Abstract
We present a geochemical dataset acquired during continual sampling over 7 months (bi-weekly) and 4 weeks (every 8 h) in the Neuwied Basin, a part of the East Eifel Volcanic Field (EEVF, Germany). We used a combination of geochemical, geophysical, and statistical methods to describe and identify potential causal processes underlying the correlations of degassing patterns of CO2, He, Rn, and tectonic processes in three investigated mineral springs (Nette, Kärlich and Kobern). We provide for the first time, temporal analyses of periodic degassing patterns (1 day and 2–6 days) in springs. The temporal fluctuations in cyclic behavior of 4–5 days that we recorded had not been observed previously but may be attributed to a fundamental change in either gas source processes, subsequent gas transport to the surface, or the influence of volcano–tectonic earthquakes. Periods observed at 10 and 15 days may be related to discharge pulses of magma in the same periodic rhythm. We report the potential hint that deep low-frequency (DLF) earthquakes might actively modulate degassing. Temporal analyses of the CO2–He and CO2–Rn couples indicate that all springs are interlinked by previously unknown fault systems. The volcanic activity in the EEVF is dormant but not extinct. To understand and monitor its magmatic and degassing systems in relation to new developments in DLF-earthquakes and magmatic recharging processes and to identify seasonal variation in gas flux, we recommend continual monitoring of geogenic gases in all available springs taken at short temporal intervals.
1. Introduction
Continental rifts and their related volcanic systems may be important contributors to deep, diffuse carbon fluxes due to intrusion and melting of metasomatized, volatile-enriched lithosphere and elevated magmatic fluxes. Faults and fractures on which volatile species can migrate towards the surface act as preferential pathways [1]. However, carbon fluxes at large depth occurring in the presence of magmatism is still poorly understood, especially in cases where magma ascent ends within the lithosphere and no eruption occurs [1]. Recently, Burton [2] and Mörner and Etiope [3] point out that slow, passive degassing of volatiles over long periods of time is a more important process than volcanic eruptions of short duration. Such passive release of volatiles and their variations in composition at the Earth’s surface represent the only indicator of a degassing magma source at depth [4]. During their migration towards the surface, these gases may contain components from three reservoirs: Mantle, crust, and atmosphere. It is possible to distinguish between these different reservoirs based on the relative gas abundances and their isotope compositions [4]. Taking advantage of the different mobility and chemical reactivity of these volatiles, a combined study of these gases is a useful tool to identify e.g., preferential migration pathways of gases or physico-chemical processes occurring at depth in volcanic areas, as findings from Tenerife island [5] or the Mount Etna [6] show. Recent studies identified distinctive periodic cycles in volcanoes and volcanic fields, e.g., in Italy (Campi Flegrei caldera; [7]), on Montserrat (Soufriere Hills Volcano; [8]), and in Chile (Llaima and Villarrica volcanoes; [9]) by analyzing different data sets. These data sets included spectroscopic measurements of water (H2O), carbon dioxide (CO2), carbon monoxide (CO), sulfur dioxide (SO2), hydrogen fluoride (HF), hydrogen chloride (HCl), and carbonyl sulfide (OCS); degassing (Ilanko et al. [10]); earthquakes [11]; deformation and seismicity [12]; and Earth tides and meteorology [7]. In literature, periodic cycles were identified in periods of 12 h, one day, 14 days, one month, six months and one year. (Table 1).

Table 1.
Examples of cyclic periods identified in previous volcanic studies using different data sets (adapted and modified from [8]).
Furthermore, systematic, long-term monitoring studies (e.g., geochemistry and degassing patterns of mineral springs) constitute the only scientifically valid basis to understand the behavior of volcanoes and provide pre-eruption baseline data, especially, when volcanoes are thought to be presently dormant but with a potential for reactivation [18].
Until now, no continuous fine-scale degassing data have been available for the seismically active East Eifel Volcanic Field (EEVF) with its Quaternary alkali basaltic volcanism and adjoining Eocene Neuwied Basin (NWB) in state of Rheinland-Pfalz (Germany). Many volcanological, petrochemical, petrological, tectonic, and seismic investigations have been carried out in the last 40 years. Their focus was on dormant but not extinct volcanic activity [19,20]; ongoing magmatic recharge beneath Laacher See Volcano [21]; the present-day NW–SE-directed compressional stress field and its related seismic activity, e.g., [22]; isotopic investigations [23,24,25]; gas composition and chemical tracers of mineral waters [25,26,27,28,29]; and mofettes along the Laacher See or at Obermendig [30]. Data collection and monitoring has been annual at best, e.g., [25], and no continual systematic long-term measurements or analyses of geogenic gas concentrations in mineral springs have been recorded. Furthermore, direct observations of periodic degassing behavior (e.g., from gas records themselves) are also still missing. This absence of information reflects a lack of data with high-time resolution of gas flux in an area where the current level of volcanic and magmatic activity is still disputed [21].
To better understand geogenic gas emissions, their rhythms, and potential changes during episodes of seismic unrest in the EEVF, we provide for the first time fine-scale data for three mineral springs: (a) Flöcksmühle in the Nette river near Ochtendung (hereafter: ‘Nette’); (b) Waldmühle in Mülheim-Kärlich (hereafter: ‘Kärlich’); and (c) ‘Kobern’ in Kobern-Gondorf in relation to parallel investigated soil gas analyses at the Goloring study site near Koblenz (≈6 km from the investigated mineral springs) that allow for periodic analyses. We present new insights into temporal changes in concentrations of the geogenic gases CO2, helium (He), and radon (Rn) by analyzing high-frequency data from gas monitoring of mineral springs, time-series of carrier-trace-gas couples (CO2–He and CO2–Rn), and variability of periodic fluctuations in gas concentrations in the NWB. Bi-weekly gas sampling was executed during a 7-month campaign (7-M; 1 March–30 September 2016). During four weeks of this campaign, we intensively sampled gases in the same mineral springs every 8 h (4-W; 12 July–11 August 2016). We used a combination of geochemical and statistical methods to identify potential causal processes underlying the correlations of degassing patterns of the three aforementioned gases in mineral springs, meteorological conditions, and earthquake events. We explored whether temporal relationships among gas concentrations in the three mineral springs and also in nearby soil gas probes [31] could be indicators of hidden faults for migrating geogenic gases from deep underground. Specifically, we tested the null hypotheses that concentrations of the investigated gases were independent in all springs. Additionally, temporal associations between the fluctuations in gas concentrations were investigated to test whether there were simultaneous effects, specific periodic rhythms, and any influence of weather or seismic activity on degassing.
This study is part IV of the research project “GeoBio-Interactions” in which we also monitored geochemistry and periodic fluctuation patterns of soil gas and ant-nest gases (CO2, He, Rn and CH4) at the Goloring site ≈6 km from the investigated mineral springs [31,32,33].
1.1. Geological Setting
The EEVF (≈400 km2) and its NWB are limited in the northern direction by the Lower Rhine Embayment and in the southern direction by the Mosel river, are located on the western side of the Hercynian Rhenish Massif, and are part of the seismically active intra-continental 1100 km long European Cenozoic rift system [34]. The current tectonic activity is characterized by uplift, that is attributed mainly to plume-related thermal expansion of the mantle-lithosphere, e.g., [19,35], crustal thinning and associated Cenozoic alkali basaltic volcanism [29,36], active rifting processes [22], crustal-scale folding, or the reactivation of Variscan thrust faults under the present-day NW–SE-directed compressional stress field, e.g., [22,34]. During the last 700 kyr, intensive intra-plate Quaternary alkali basaltic volcanism with several alternating phases of volcanic activity took place in the EEVF, leading to ≈100 eruption centers. The last phreato-plinian eruption occurred ≈12.9 kyr ago (Laacher See eruption; [37]). That eruption was fed by a phonolitic magma from 5–8 km depth [20] and can be compared to eruptions of Mt. Pinatubo (Philippines; 1991), Mt. Vesuvius (Italy; 79 AD) or Mt St Helens (USA; 1980). Today, the volcanic and magmatic activity in the Eifel region is considered to be dormant but not extinct, with no anomalous heat flow; enhanced local seismicity is commonly thought to be due to tectonic activity along the Ochtendunger Fault Zone (OFZ; [20,21,38]) rather than to volcanic processes. Increased gas flux is concentrated in the center of the EEVF (Laacher See volcano), but it is not restricted to this area. Distribution patterns of CO2 emissions coincide with an active magmatic reservoir in the lithospheric mantle (“Eifel plume”) with anomalously low seismic velocities (between 50 and at least 410 km depth) and elevated temperatures. This reservoir is the source for the Quaternary Eifel volcanism [19,36]. Calculations of the CO2-flux survey in the Eifel area vary between 0.073–1 Mt/a (e.g., [39,40]). May [27] estimated approximately 0.012 Mt/a for the West Eifel Volcanic field, a fraction of 10−4 of the CO2-flux of all estimated mantle plumes. Between 0.005 Mt/a and 0.0128 Mt/a of CO2 are observed especially in the Laacher See region (e.g., [41]). Carbon isotopes (δ13C values within the MORB range: –4.6 ± 0.6‰) and helium isotope ratios (3He/4He: Up to 5.6 Ra for the Laacher See area) indicate a predominantly mantle-derived origin.
The Eocene NWB (square-shaped; ≈585 km2) represents a tectonic depression at the crosscut zone of the Mosel and Rhine rivers with a subsidence of 350 m [42]. The NWB is still seismically active. Weak to moderate earthquakes at shallow crustal depths (≤15 km) and local magnitudes (ML, Richter scale) rarely exceeding 4.0 and are concentrated on a nearly vertical plane along the NW–SE trending OFZ ([43]; Figure 1a). Recent observations of long-period deep earthquakes (ML = 0.7–1.3) in the upper mantle (20–40 km depth) are interpreted as being induced by magma or fluid movements [21]. The NWB is characterized by decreasing mantle-derived He signatures (2–4 R/Ra) and δ13C values of –5.9‰ as compared to the Laacher See area [24,25,29]. Furthermore, local highly elevated Rn concentrations (>100 Bq/L) are associated with tectonic fault zones and clefts caused by advective gas transport along faults between the interbedding layers of Lower Devonian clay and siltstones as bedrocks and the Cenozoic sediment basin fillings [44,45]. Faults in the NWB trend NE–SW (Variscan direction), NW–SE (present-day stress field) and in its conjugated ENE–WSW direction. The stress regime for NWB shows a strong tendency towards a strike-slip regime [22]. Their ages and total penetration depths are mostly unknown [36]. Along the margins of the Rhenish massif, mineral waters with high chloride and low CO2 content that also contain crustal He dominate [36]. More than 300 minerals springs and mofettes with mostly hydrogen-carbonate-waters occur along NW–SE-, N–S-, and ±E–W-trending highly-permeable faults and crosscut zones of regional tectonic lineaments, presumably merging into shear zones of the crust or upper mantle. They provide permeable pathways for migration of CO2-rich fluids with significant contributions of mantle-derived helium linked to Quaternary volcanic activities and rapid water circulation, e.g., [23,25,27,28,29].
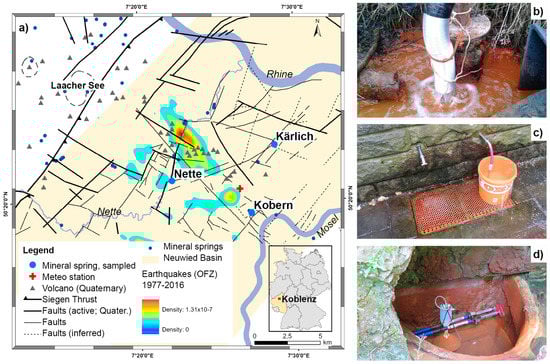
Figure 1.
The three studied mineral springs (MS; light blue dots) ≈15 km SE of the Laacher See volcano within the Neuwied Basin (NWB, light yellow area); the inset shows the location of the study site within Germany. The map (a) shows tectonic structures (black lines) and active faults (bold black lines according to [42]) compiled from the literature and different tectonic maps (e.g., [49]), additional mineral springs (dark blue dots), Quaternary volcanoes (grey triangles), location of the meteorological station at the Goloring site (red cross), and probability density of the earthquake events from 1977–2016 that were related to the Ochtendunger Fault Zone (OFZ; rainbow contours; based on data provided in earthquake data catalogues [50,51]). River names are written in italics. CO2, He, and Rn were sampled from the mineral springs. Photographs show (b) Nette and (c) Kärlich with modified outlets, and (d) Kobern equipped with a permanent gas mouse (all photographs: G.M. Berberich).
1.2. Description of the Three Investigated Mineral Springs
The investigated springs, Nette, Kärlich, and Kobern, are characterized as CO2-gas/bicarbonate-rich mineral waters [24,29] and are located at fault intersections: Nette to the southwest of the OFZ, Kobern close to the center of the OFZ in the southeast and Kärlich to the northeast, approximately 7 km away from the OFZ (Figure 1a).
Nette (Figure 1b) is a cold-water geyser at the bank of river Nette that was well-bored to a depth of 100 m in 1928 for the extraction of carbonic acid. The geyser’s plumbing geometry consisted of a vertical well-bore that allowed for the upward artesian migration of CO2-rich fluids. The CO2-driven eruption occurred within the well, leading to a soaring height of 3–4 m. After selling the rights for carbonic acid production in 1939, the geyser was closed. The owner opened the geyser again in 1965 but did not use it commercially. In 1967, the geyser was plugged with debris by vandals and its regular CO2-driven eruption cycles faded out, although a rhythmically CO2-rich fluid discharge of 120 L/min continued. To prevent further damage to the spring, the outlet was re-shaped into its present-day U-form. In 1999, the former restrictions from the sell-off of exploitation rights expired (pers. comm. J. Dumont, 2016). Nette is located in the center part of the NWB, on a tectonically active crosscut-zone with faults trending in NNE–SSW (Rhenish direction) and ENE–WSW directions. The 3He/4He ratio is between 2.51 [23] and 2.6 [25]. Approximately 31% of the He in the mineral water is mantle-derived [23].
Kärlich (Figure 1c), well-bored in 1978, is located approximately 15 m south of the Lützel creek (Lützelbach). The freely available mineral water is collected by the inhabitants and used as drinking water. Kärlich, also in the center part of the Neuwied Basin, is located at a fault intersection with faults trending in NW–SE and NE–SW (Variscan direction) to ENE–WSW directions. Approximately 36% of the He there is mantle-derived, with a 3He/4He ratio of 2.83 [23].
Kobern (Figure 1d), with a discharge of 1.5 L/min, is not well-bored and is located ≈1 km north of Kobern-Gondorf in a mixed forest stand next to the Hohenstein creek (Hohensteinbach). It was presumably constructed in its present-day shape at the beginning of the 20th century [46]. Kobern’s outer shape is constructed as a cave. Its mineral water is collected in a semicircular stonewalled water basin. The CO2-rich discharge enters the basin from the bottom. The spring is located approximately 5 km away from the southern margin of the Neuwied Basin, on a NE–SW trending fault zone. The 3He/4He ratio is 1.41; the amount of mantle-derived He is ≈18% [23].
The Paleozoic basement beneath the mineral springs consists of ≤5 km alternating strata of Lower Devonian age, iron-bearing, quarzitic sandstones with a carbonate matrix and argillaceous shale, greywacke, clay, and siltstones (“Hunsrückschiefer” and “Singhofener Schichten”). Several thin black coal seams (Upper Siegen) are embedded within these alternating strata [47]. Within the entire Neuwied Basin, a continual sedimentation process took place during the Paleogene (Mid-Eocene to Upper Oligocene) starting with fluvial-lacustrine sediments, then turning into limnic-brackish, and finally to brackish-marine clay deposits (Neuwied Gruppe; [42,48]), which contribute to the major part of the basin fillings. Eocene/Oligocene lignite seams, which are found at ≈75–160 m depth, Quaternary vulcanites (pumice and trass) of the Laacher See eruption, fluviatile Pleistocene deposits of the rivers Rhine and Mosel (gravel and sand of the Lower Terrace), and loess sediments cover the Devonian units [47]. The basement can be considered to be a siliceous crevice aquifer as groundwater is transported and stored only along open fractures, clefts, and faults because of the very low permeability of the lithology [47]. Fluviatile deposits of the Lower Terrace can be addressed as siliceous porous aquifers [49].
2. Materials and Methods
We monitored concentrations of geogenic gases (CO2, He, Rn); time-series of carrier-trace-gas couples (CO2–He and CO2–Rn); variability of fluctuations in gas concentrations; and degassing rhythms in the springs. The field campaign was from 1 March–30 September 2016. During these seven months, we sampled the springs every two weeks (16 bi-weekly samples in the 7-M campaign) and augmented these biweekly samples with additional samples taken every eight hours during a single month (4-W campaign from 12 July–11 August 2016). In the mineral springs, we explored the relationships among
- CO2, He, and Rn concentrations;
- temporal relations and degassing rhythms;
- meteorological conditions; and
- earthquakes.
2.1. Gas Sampling and Analytical Methods
We collected 1968 single gas samples across the springs during the total seven-month sampling period. Gas sampling followed the procedure described in Berberich [52]. To facilitate in-situ underwater gas sampling, the outlets of all mineral springs were modified so that the samples were isolated from atmospheric influence [53]. During each sampling at Nette, a flexible pipe extending from the original outlet was lowered under the water’s surface to allow for gas sampling without atmospheric influence (Figure 1b). At Kärlich (Figure 1c) a U-shaped copper pipe was docked to the outlet and the gas was sampled beneath the water surface in a basket. In all springs, the gas was collected via a funnel docked to a 1 L PET bottle equipped with a valve (“gas mouse”; Figure 1d). The gas mouse was completely flooded with water prior to the sampling, then turned upside-down below the water surface to prevent atmospheric gases from entering it. The flooded funnel was placed over the pipe outlet or copper pipe to collect the free, continuously bubbling gas phase, which were drawn into a sampling tube equipped with a syringe attached to the valve. Prior to sampling, the dead volume of the tube was extracted twice from the docked tube. At Kobern a permanent gas mouse was installed well below the spring orifice after initial evacuation (Figure 1d). Helium(total) samples were transferred into a 20 mL stainless-steel circular and air-tight sampling device (so-called “gas frog”) and were analyzed immediately after collection using a mobile, modified mass spectrometer (Alcatel ASM 142; adixen) that had been converted to a 20 mL sample volume for a single He measurement. Rn samples were transferred into a 100 mL Lucas cell and analyzed after at least three hours using a Lucas detector (JP048; Radon Detector LUK4). To obtain a quantitative measurement of CO2 concentrations, a portable Dräger-meter equipped with three sensors was docked to the probe or the gas mouse and run at each sampling for two minutes to stabilize the measurement (Dräger X-am® 7000; DrägerSensor® Smart IR CO2 HC, measuring range 0%–100% by volume). Details of analytical procedures and errors were described fully by Berberich [52]. All measurements were comparable to the previous ones (e.g., [31,53,54]) in this area, as the same equipment was used.
2.2. Meteorological Parameters
Meteorological data were obtained from a radio meteorological station (WH1080) placed 2 m above ground at the Goloring site (which was part of the research project “GeoBio-Interaction”, Figure 1a) in the center of the triangle-shaped study area and ≈6 km from the springs. It continuously logged meteorological conditions (temperature (°C), humidity (%), air pressure (hpa), wind speed (m/s), rainfall (mm), dew point (°C)) at 5 min intervals. The recorded data were downloaded every two days, checked for completeness, and stored in a database.
2.3. Earthquake Events
Earthquake events in the sampling region (Figure 1a) that occurred during the sampling campaign were recorded in seismological databases provided by the Erdbebenstation Bensberg [51]; www.seismo.uni-koeln.de/events/index.htm and the Landesamt für Geologie und Bergbau, Rheinland-Pfalz [50]; http://www.LGB-RLP.de/fachthemen-des-amtes/landeserdbebendienst -rheinland-pfalz/.
2.4. Data Analysis
All analyses were done using R version 3.3.2 (R Core Team 2016) or MATLAB R2017a. We examined the effects of the six measured meteorological variables on geogenic gas concentrations. As many of these variables are correlated with one another, we used principal components analysis (PCA; R function prcomp) on centered and scaled data to create composite “weather” variables (i.e., principal axes, PC1, PC2 etc.; Table 2 and Table 3). The first three axes accounted for 79% of the variance in the data, and we used these three in the subsequent analyses.
Table 2.
Descriptive statistics of meteorological conditions during the (a) 7-months (March–September 2016) and (b) 4-weeks field campaign (12 July–11 August 2016); SD = Standard deviation, CV = Coefficient of Variation.
Table 3.
Principal Component Analysis (PCA) on weather variables. PC1, PC2, PC3 are Principal axes 1, 2, and 3, respectively.
For interpreting the significance of the correlation coefficient, we followed Hinkle et al. [55]. We used the median values for interpretations of geochemical data rather than the arithmetic mean (“average”) because the median is less influenced by outliers (rare extremely large or small values) and provides a better estimator of “typical” values. Fluctuation patterns (Figure 2) were investigated by centering and scaling the data (Z-score) and removing the outliers (i.e., data >1.5 standard deviations from centered and scaled data were excluded from analysis (7-M: ≈10%; 4-W: ≈9%)). Then, we used a smoothing splines method [56] in which the spline f(x) was a piece-wise polynomial computed using a smoothing parameter (set to 0.9999 in the Matlab implementation of the method) and x was centered and scaled.
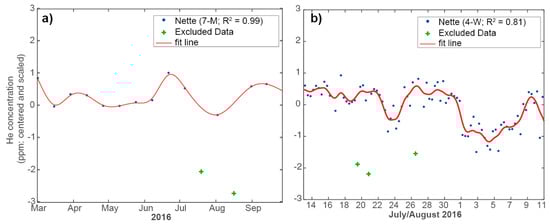
Figure 2.
Fluctuation patterns of helium concentrations before (blue dots) and after centering/scaling and applying the smoothing spline method (red line) for the Nette mineral spring for (a) the 7-month biweekly and (b) the 4-week 8-hourly measurement campaigns. Measured data >1.5 standard deviations from centered and scaled data were excluded from analysis (green crosses) for being outliers.
Cross-correlation analyses were used to investigate temporal relations between degassing patterns of sampled springs and carrier-trace-gas relations. We used the Matlab implementation of the Fourier Transform (FT; sampling rate = 8;) on raw data to investigate temporal rhythms and periodicities hidden in the degassing patterns of the mineral waters through an examination of the gas data collected during the 4-W campaign [31]. Because the observation interval corresponds to an infinite signal multiplied by a rectangular window, a Blackman window [57] was applied to suppress the artifacts that would be caused by a rectangular window. Because average degassing produced a large peak in the origin (zero frequency) of the amplitude spectrum, this peak was removed in order to enhance the visibility of the low-frequency components [31,33].
2.5. Data Availability
Data of geogenic gases in mineral springs supporting the findings of this study are available from the Harvard Forest Data Archive (http://harvardforest.fas.harvard.edu/data-archive), dataset HF-321. The entire meteorological dataset has been already published and is available from the Harvard Forest Data Archive (http://harvardforest.fas.harvard.edu/data-archive), dataset HF-311.
3. Results
3.1. Gas Composition
CO2 was the major component of the measured gases in the mineral springs. Median CO2 values differed among all the springs: Very high concentrations (86–92 Vol.%) were found in Nette and Kärlich during both the 7-M and 4-W samplings. Kobern always had median concentrations <80 Vol.% (Table 4). He concentrations (Table 4) were highly variable during both samplings and fluctuated equal by a factor of 6, e.g., Nette between 20 and 110 ppm (4-W). The concentrations observed at Nette were ≈10 times higher than at Kärlich (6–10 ppm He) or Kobern (1–7 ppm He). More than 80% of the He concentrations measured in Kobern were below atmospheric standard (5.22 ppm; [58]). Rn concentrations also varied greatly (Table 4) with the highest values in Kärlich (114 Bq/L) and the lowest in Nette (≈3 Bq/L).
Table 4.
Statistics of gas concentrations in the mineral waters for the (a) bi-weekly and (b) augmented 8-hourly samples.
He versus CO2 and Rn versus CO2 plots (Figure 3) for the 7-M and 4-W samplings showed similar distributions for He and CO2 in Kärlich and Kobern, likely indicating a tectonic linkage between both springs (Figure 3a,c). Higher He values corresponded to Nette, which is located at an intersection of an active fault system and close to a hot spot of earthquake activity (Figure 3a,c). Rn vs. CO2 plots showed similar results for Kärlich and Kobern for both samplings (Figure 3b,d).
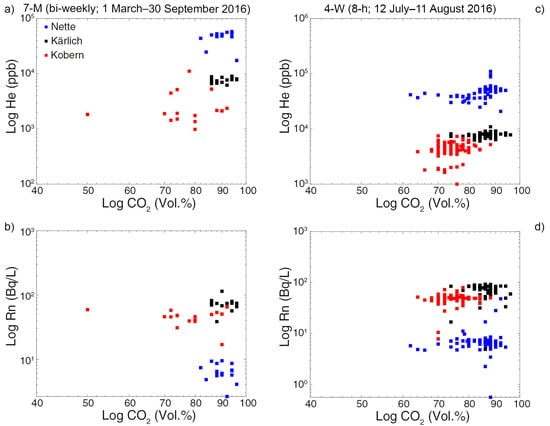
Figure 3.
He vs. CO2 (a,c) and Rn vs. CO2 (b,d) emissions: Nette (blue squares), Kobern (red squares) and Kärlich (black squares).
3.2. Time Series
3.2.1. Fluctuations in Gas Concentrations
A comparison of random samplings of gases between 2009 and 2015 (Figure 4) with the median concentrations measured during 2016 revealed substantial differences among springs and gases. CO2 concentrations were >80 Vol.% in all springs and varied only slightly (Figure 4a). Concentrations for He declined in Nette and Kärlich but rose slightly in Kobern between 2009 and 2015 (Figure 4b). Rn concentrations were much more variable, declining in Nette and Kobern but remaining stable at high levels in Kärlich (Figure 4c). Median Rn concentrations in Kärlich and Kobern in 2016 exceeded the concentrations of previous samplings. In the gas phase of Kärlich, the parametric value for Rn (100 Bq/L) of German Drinking Water Ordinance [59] was exceeded only once during the 7-M sampling campaign.
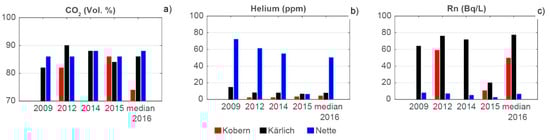
Figure 4.
Concentrations of (a) CO2 (Vol.%), (b) Helium (ppm), and (c) Radon (Bq/L) in Nette, Kärlich and Kobern between 2009 and 2016. Concentrations for 2009–2015 are from [60] and unpublished data for 2014 and 2015 by G.M. Berberich.
During the 2016 bi-weekly sampling, gas concentrations varied greatly, e.g., Kärlich between 38 and 114 Bq/L for Rn (Table 4). Sinusoidal gas fluctuations were higher in amplitude during the 7-M sampling than during the 4-W sampling (Figure 5). Variations in CO2 and He were highly correlated (r = 0.92 and 0.75) in Nette and Kärlich (Figure 5a,b,d; Table A1). He fluctuations in Kobern were anticyclic relative to Nette (r = −0.59) and Kärlich (r = −0.53; Figure 5b; Table A1). Rn fluctuations were not as pronounced as the other gases (Figure 5c) and were weakly correlated between Kobern and Kärlich (r = 0.42).
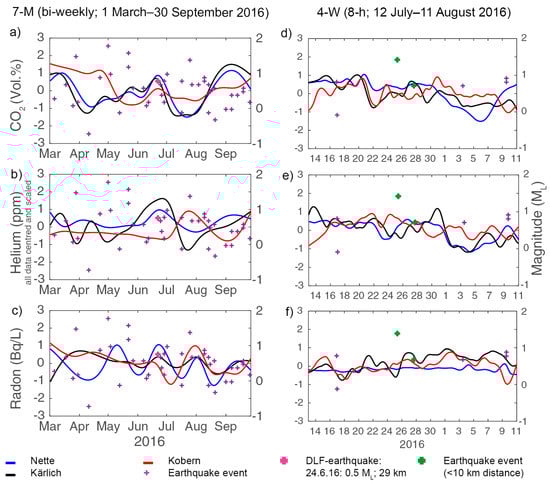
Figure 5.
Patterns of gas concentrations (centered and scaled data) during the bi-weekly (a–c) and 8-hourly (d–f) surveys in the mineral springs and earthquake events (ML) indicated with purple crosses. The deep low-frequency (DLF) earthquake on 24 June 2016 in Niedermendig is marked in magenta; earthquakes with a distance <12 km during the 4-W sampling are marked in green.
Fluctuations during the 4-W campaign (Figure 5d–f; Table A1) showed similar patterns but were more detailed than those seen in the 7-M sampling. Fluctuations were similarly highly correlated for CO2 (r = 0.65) and He (r = 0.76; Figure 5d,e; Table A1) in Nette and Kärlich. There was a moderate positive correlation of Rn fluctuations between Kärlich and Kobern (r = 0.52; Table A1). CO2 (Kärlich), He (Nette, Kärlich) and Rn (Nette, Kärlich) concentrations declined towards the end of the 4-W campaign (Figure 5d–f). Gas fluctuations in Kobern almost always differed from Nette and Kärlich and rose towards the end of the 4-W sampling (Figure 5d–f).
3.2.2. Temporal Variations of Concentrations and Carrier-Trace-Gas Couples in Springs
Cross-correlations for CO2 (Figure 6a) and He (Figure 6b) suggested that Nette and Kärlich were directly linked (CO2) and at an approximate lag of ≈2 days (40 h) for (He). Cross-correlations for Nette and Kobern (time lag of ≈2.5 days (≈64 h) for CO2), and Kobern and Kärlich revealed a positive but low relationship with a time lag of ≈2 days for CO2 (Figure 6a). Nette and Kärlich and Kobern and Kärlich were directly and instantaneously linked with respect to Rn (Figure 6c).
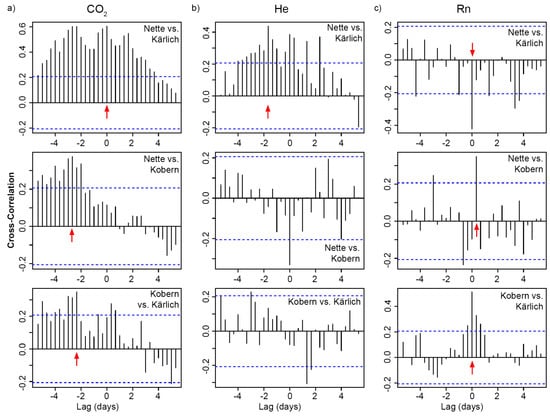
Figure 6.
The time-series of (a) CO2, (b) He, and (c) Rn (8-hourly samples; median smoothed) between all springs for the 4-W campaign. Red arrows indicate highlighted correlations. Blue dashed lines indicate 5% significance levels (values outside the blue dashed lines are statistically significant at P ≤ α = 0.05).
Joint visualization of the time-series of carrier-trace-gas couples reveal differences among the springs. A coupled system of CO2–He was visible in Nette (lag = 16 h) and Kärlich (lag = 56 h). The cross-correlation for the CO2–He couple in Kobern never exceeded 0.25 (Figure 7a). In Nette, no CO2–Rn coupled system was visible. In Kobern there was a positive but low relationship with a negative time lag of about ≈3 days for Rn, in Kärlich, we observed a small negative relationship with a negative time lag of ≈3.3 days (≈80 h; Figure 7b).
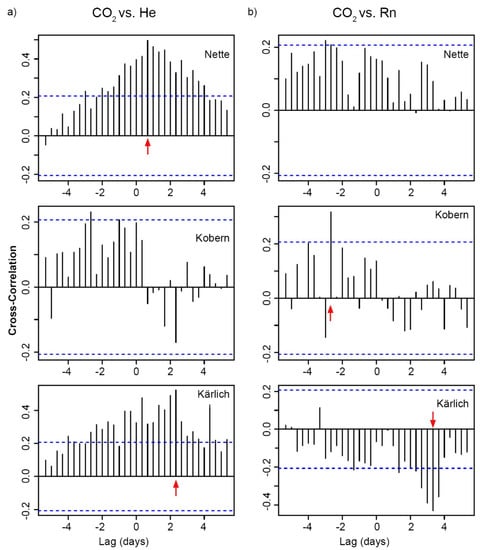
Figure 7.
Cross-correlation of the time-series of (a) CO2 vs. He, and (b) CO2 vs. Rn (8-hourly samples; median smoothed) in all springs for the 4-W campaign. Red arrows indicate highlighted correlations. Blue dashed lines indicate 5% significance levels (values outside the blue dashed lines are statistically significant at P ≤ α = 0.05).
3.2.3. Fourier Transform (FT)
Common significant, short-synchronous degassing rhythms were observed for the springs and the gases after 1 day, 2, 3, 4, 5, 6, 8, 10 and 15 days (Figure 8; Table A2). Periods with maximal amplitudes were different for the investigated mineral springs and geo-gases in the soil. Maximum peaks for CO2 were observed for periods of 1 day (Kobern), 4 days (Kärlich), and 15 days (Nette; Figure 8a; Table A2). He maxima occurred for periods of 10 days (Kärlich) and 15 days (Nette, Kobern; Figure 8b and Table A2), whereas Rn maxima were observed for periods of 6 days (Kobern) and 15 days (Nette; Kärlich (Figure 8c and Table A2). The peaks corresponding to longer periods, e.g., of 30 days were not significant from a signal processing perspective and were discarded from further analysis.
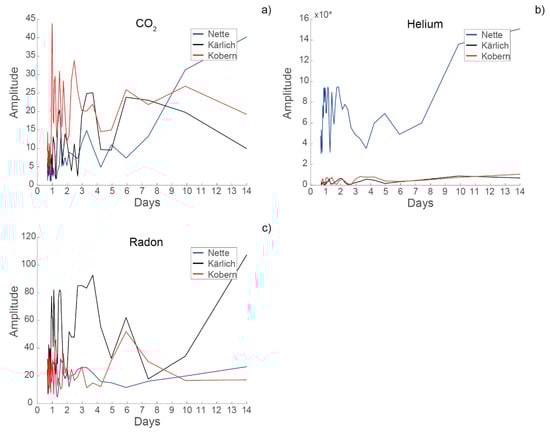
Figure 8.
The modified Fourier analysis for the degassing patterns of CO2 (a), He (b), and Rn (c), in the mineral springs for the 4-W campaign. Longer periods than 14 days are shown in Table A2.
3.3. External Factors
3.3.1. Meteorological Conditions
Dry meteorological conditions were recorded during the 7-M and 4-W campaign. Median air temperatures were 15 °C (7-M) and 17 °C (4-W), with a single large rainfall event (66.9 mm) on 13 March. Variation in atmospheric pressure and wind speed were small (Table 1). PCA and correlation analysis of raw gas data for the 4-W sampling with meteorological data (air temperature, air pressure, humidity and wind speed) showed that the degassing processes from mineral springs were not influenced by meteorological conditions (Figure A1 and Figure A2, Table A3).
3.3.2. Earthquakes
During the 7-M sampling, 43 small-scale earthquakes (−0.7 ≤ ML ≤ 1.8; depth: 1–29 km) occurred, whereas five occurred during the 4-W sampling (−0.1 ≤ ML ≤ 1.4; depth: 3–11.5 km; Figure 9). Three additional ones, on 9 and 15 August, were ≈ 26 km away. Because of their distance from the site and their low magnitudes (ML 0.8) these earthquakes were discarded from further analyses.
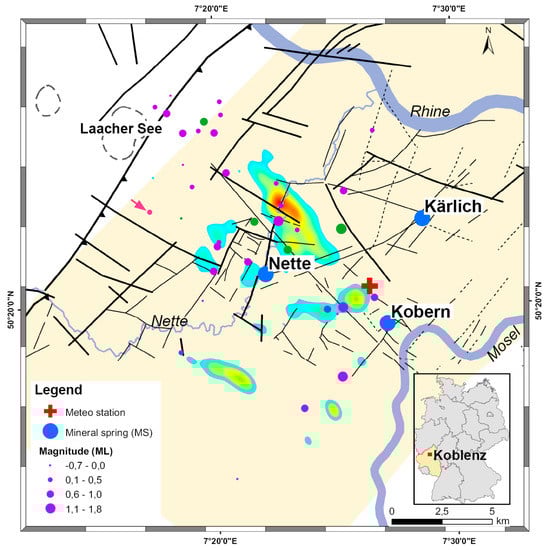
Figure 9.
(ML) of earthquakes during the 7-M field campaign (purple dots). The five earthquakes, which occurred between 1 and 12 km distance from the springs during the 4-W sampling, are marked by green dots. The DFL-earthquake near Niedermendig (pers. comm. Erdbebendienst Südwest) is marked in magenta (arrow). For further explanation of the legend see Figure 1a.
One earthquake (24 June; ML 0.5) occurred in the lower crust (≈29 km depth) and was re-calculated by Erdbebendienst Südwest and characterized as a deep low-frequency (DLF) earthquake (pers. comm. Erdbebendienst Südwest; Figure 9). Almost all gas concentrations in the springs decreased after this earthquake event, as can be observed in both the smoothed data (Figure 5a–c) and the raw data (Figure A3).
Evidence of seismic influence on concentration patterns also could be visually observed after the two nearby (<10 km) earthquakes that occurred on 25 July (ML 1.4; depth 10 km) and 27 July (ML 0.7; depth 9 km) during the 4-W campaign (Figure A3). Decreases in CO2 and He concentrations were observed ≈1 day after the 25 July earthquake in Nette and Kobern. Increases in concentrations of both gases were observed concomitantly in Kärlich; Rn increased in all springs. One day after the 27 July earthquake, CO2 and Rn increased in Kobern but decreased in Nette and Kärlich (Figure 5d–f; Figure A3).
4. Discussion
4.1. Gas Content in the Studied Waters
CO2 concentrations in the sampled gas phases can be divided into two sections: High concentrations in Nette and Kärlich and much lower ones in Kobern (Table 4). Three interlinked processes promote CO2 degassing in the EEVF [25,26,27,36]: (i) Melting processes in the upper mantle (“Eifel-Plume”), which are considered to be the main source of Quaternary Eifel volcanism, liberate CO2 from rocks, and promote direct CO2-ascension via deep reaching basement faults to the surface; (ii) liberation of additional CO2 into the lower crust via ascending alkali basaltic magma; and (iii) migration of CO2 though the brittle upper crust via fractures and faults. The sampled CO2-driven springs are located at fault intersections and characterized by geyser-type (Nette) or mofette-type (Kärlich and Kobern; [25]) degassing systems, indicating fluid transport along highly permeable migration paths within the creviced aquifer system of the Variscan bedrock, through volcanic systems, and through lineaments [36,49]. Artesian conditions resulting in formation overpressure may be caused at Nette by the permeability of the Variscan basement, provided by tectonic processes [42] that govern the supply rate of CO2-rich water and the overlaying Paleocene clay layers (thickness ≤70 m) filling the NWB [42,47,61]. Furthermore, the low depth of the groundwater table in the Nette valley may promote quick and direct CO2 discharge in high concentrations [49]. In contrast, Kärlich and Kobern continually discharge CO2-rich fluids with very small to large CO2 bubbles in the fluid. Kobern, located south of the OFZ and on a NE–SW trending fault system, had lower CO2 concentrations than Nette or Kärlich (Table 4). We hypothesize that gas migration at Kobern may occur along various faults where dissolution and fractionation of CO2 with concomitantly formed HCO3 can take place several times [62]. The local aquifer geology also might be different at Kobern, e.g., with a higher potential for geochemical reactions that consume CO2 [63]. Different local permeability, e.g., low permeability in underlying bedrock but also differences in thickness, permeability, and porosity of unsaturated zone, also might play a role [63]. According to Bräuer et al. [25], δ13C values of –5.9‰ confirm a mantle signature for Nette. This corresponds to values of deeply-derived CO2 in the Northern Apennines (−6.1–+1.5‰; [64]). However, δ13C values <−10‰ are also interpreted as mixtures between magmatic and biogenic CO2 or respectively, mantle and crustal end members (e.g., [62]). Together with similar mantle derived He signatures in Nette and Kärlich [25], we suggest a common magmatic reservoir for Nette and Kärlich, probably located in the crust and fed by the Eifelplume located in the upper mantle [19]. Because detailed δ13C investigations for Kärlich are otherwise lacking, the reservoir supplying the degassing systems cannot be confidently characterized [25].
The large differences in He concentrations and in He/CO2 ratios among the springs (Table 4) also can be attributed to their different tectonic locations. Tectonically active zones often exhibit high fluxes of He and seismic activity tends to maintain a high permeability in active fractures, both of which act as preferential conduits for gases trapped in the mantle or the crust, leading to gas concentration anomalies [65]. Judging from the very high He concentration in Nette, the transport is likely to occur in conduits of high permeability. This can be confirmed because Nette is located at a seismically active crosscut zone of two fault systems. In combination with its geyser-like CO2-driven system, where gas phases reach the surface very quickly, the less soluble but highly volatile He is enriched in the free gas phase. Furthermore, the high He concentrations can be attributed to geochemical tracers of crustal fluid movement [66] with mantle influence [23,25]. Kärlich, located on a seismically inactive fault intersection [42], had an He concentration and He:CO2 ratio twice as high as Kobern (Figure 4). Thus, the 3He contents in Kärlich (2.83) was similar to that measured at Nette (2.6) but twice as high than at Kobern [23]. In Kärlich, the fracture network might be more permeable than at Kobern, thus providing degassing pathways. Kobern is a mofette-type spring with stagnant waters, and the chemical fractionation of gases tends to zero in such waters [25]. At Kobern, there seems to be less permeability for fluid and degassing. Compared to the both other springs, He concentrations were very low in Kobern, below the atmospheric standard of 5.22 ppm [58]. Of the springs, Kobern has also the lowest concentration of mantle-derived He (≈18%; [23]). A possible explanation might be that although CO2-charged faults are present at depth, not all lead to the surface [63].
Radon anomalies at the Earth’s surface are caused by Rn migration via conduits or faults [67]. The highest Rn concentrations were found in Kärlich, located at intersections of faults trending in NW–SE and NE–SW (Variscan direction) to ENE–WSW directions (Figure 1). Rn is an excellent tracer of buried faults [66]. In the study area, locally elevated Rn (>100 Bq/L) emanation is associated with tectonic fault zones and clefts caused by advective gas transport along faults [44]. Sources for locally increased Rn emanation along faults could be precipitation of parent nuclides caused by local radium content in the soil, increase of the exposed area of faulted material by grain-size reduction, or carrier-gas flow around and within fault zones [68]. Furthermore, during an advective gas transport, the maximum migration distance is strongly increased by the “carrier effect” of other major gases (i.e., CO2). In fact, fast velocities (0.1–1 cm/s) and increased travel distances (up to few km for Rn) have been observed [68]. We also note that Rn occurrence in drinking water is controlled by underlying geology, tectonics, and hydrological processes influencing groundwater, and domestic uses of water [69]. The Council Directive 2013/51/Euratom issued by the European Commission defines requirements for the concentrations of radioactive substances in water intended for human consumption. Member states had to specify a parametric value for radon between 100 and 1000 Bq/L, which should not be exceeded [70]. In Germany, this parametric value is fixed at 100 Bq/L for drinking water in the corresponding guideline [59]. During the sampling campaign, there was no evidence that this value was consistently exceeded at Kärlich. Nevertheless, Rn values are consistently high (Table 4). Because local inhabitants collect mineral water from this spring for daily consumption the drinking water should be monitored on a regular base to prevent negative health impacts, especially on small children.
4.2. Time Series
Our continual bi-weekly and 8-h sampling intervals provided for the first time fine-scale data for mineral springs in the NWB that allowed for time-series analyses. Prior analyses in the Eifel volcanic field were based on only 6–15 samples in total per location, which had been obtained from different, annual samples (e.g., [25]). Variability in concentrations and fluctuation patterns of the 8-hourly samples were low compared to the biweekly samples. Variability was even higher if gases were sampled only once each year (e.g., [25]). This supports our conclusion that results derived from samples taken at long intervals may lead to erroneous conclusions [31]. Furthermore, our results suggest that daily fluctuations should be accounted for when analyzing gas composition and variability in time series. For example, the decline of some gas concentrations (CO2: Kärlich; He: Nette, Kärlich; Rn: Nette, Kärlich) and the rise in all gas concentrations in the Kobern spring towards the end of the 4-W sampling (Figure 4d–f) would not have been observed if samples had been taken less frequently.
4.2.1. Temporal Relations and Coupled Gas Systems
Degassing of all springs is either directly and instantaneously linked or with a lag of two to three days. This is a new finding for the NWB, suggesting that all springs are tectonically linked in ENE–WSW (Nette and Kärlich), NNE–SSW (Kärlich and Kobern) and NW–SE (Kobern and Nette) directions. However, on current geologic/tectonic reference maps (Figure 1) neither interruptions nor fault-linkages are shown. Our data provides the first evidence that bedrock fault systems in the investigated area (Figure 1) may be more developed and connected at depth [42,49]. The suggested linkages also might be related to the many micro-earthquakes that occur in this area [50,51] and are commonly believed to be due to transport of material within the volcanic plumbing system, resulting in pathways from and into magma reservoirs and thus enhance degassing. Furthermore, the stress field that occurs in the depth might promote deep low-frequency micro-earthquakes that might favor a vertical migration of magma or magmatic fluids [21,71].
Griesshaber [24] and Clauser et al. [29] suggested CO2 as the primary carrier phase in the Eifel fluid-rock system where high concentrations of CO2 gas stimulate dissolution and precipitation processes. Cross-correlations revealed only a CO2–He-coupling in Nette and Kärlich (Figure 7) which may be explained by both springs being located within the degassing center of the EEVF [25] and on the same ENE–WSW trending fault system (Figure 1a). The CO2–Rn couple is the most probable carrier-gas mechanism [65,66]. In our study area, however, evidence for a CO2–Rn couple could be identified only for Kärlich and Kobern. The Lower Devonian siltstone (grain size <2 mm) might be the common Rn source because it has a high emanation rate (≈25%; [44]). At both springs, the lag of ≈3 days is very close to the half-life of Rn. The low negative correlation between CO2 and Rn observed at Kärlich could be explained by a decline in Rn emanation followed by higher CO2 degassing. The low positive correlation at Kobern might indicate a coupled system within the half-life of Rn. The similar relation for Rn vs. CO2 in Kärlich and Kobern (Figure 7), the moderate positive correlation of Rn concentrations between both springs (Table A1), and the direct and instantaneous temporal cross-correlation (Figure 6c) all suggest that Kärlich and Kobern either have a common underground Rn source or are directly linked by a previously unknown NNE–SSW fault system. At Nette, no CO2–Rn coupling was found. There, the bedrock lithology consists of Devonian “Hunsrückschiefer” with more quarzitic components [47]. The conditions at Nette are comparable to the Wallenborn cold-water geyser in the Westeifel Volcanic Field with comparably low Rn but high CO2 concentrations [53]. High dynamics in both geyser systems might prevent higher Rn concentrations and coupled systems.
4.2.2. Degassing Rhythms
The current level of volcanic and magmatic activity in the EEVF is still under debate. Recent key questions are (a) whether there is magma migration from deep-seated reservoirs to shallow depths in the crust and (b) whether there is current recharge of magma reservoirs [21]. To understand the mechanisms that control the start of volcanic unrest it is essential to monitor the magmatic and degassing systems. Our results of the persistently degassing mineral springs reveal complex degassing patterns in the NWB and evidence for specific rhythms on multiple time scales for all investigated gases during July–August 2016. These data are the first reported that suggest periodic quiescent gas release in EEVF. These findings also can be related to similar periodic degassing patterns of CO2, He, and Rn from soil gas of the nearby Goloring study site [31]. The 1–6-, 8-, 10- and 15-day periodicities are comparable to cyclic patterns in active volcanic fields (Table 1). The 1-day (diurnal period) oscillations of the degassing signals of CO2, He, and Rn correspond to the 24 h solar day and occur at a quasi-constant local time of day [9]. The 2–3-day periodicities of all gases correspond well to periodic cycles found from deformation and seismic analyses at the Soufriere Hills volcano [15] and for CO2 fluxes at Erebus Volcano [10]. Rhythms of 6 and 8 days might be related to tidal forces as found at Llaima and Villarrica volcanoes, Chile [9].
Temporal fluctuations in cyclic behavior of 4–5 days has not been observed in other recent studies but may be attributed to fundamental changes either in the gas source processes, subsequent gas transport to the surface [15], the influence of volcano–tectonic earthquakes [7]. Maximum periods occurring at 10 and 15 days for the gases (Table A2) may be related to discharge pulses in the same periodic rhythm (see also [14]). Girona et al. [71] identified a cause-and-effect relationship between passive degassing and magma ascent (“top-down mechanism”): Magma reservoirs at shallow depth may be replenished and the internal pressure may increase as a consequence of depressurization due to degassing during quiescence. Furthermore, increase in compressive stress, variations of the volume of the pore fluid or rock matrix, and fluid movement or buoyancy are important mechanisms inducing fluid flow, and fractures remain open when the pressure exceeds the minimum principal stress (e.g., [72]). During our 2016 study period, 43 earthquakes classified as tectonic events [51] occurred in the EEVF. At least 25% of these occurred at depths >10 km. One (24 June: ML 0.5), classified as a deep low-frequency (DLF) earthquake (pers. comm. Erdbebendienst Südwest), was even deeper (≈29 km depth) and belonged to a single event to cluster M1 pers. comm. Erdbebendienst Südwest; [21]. This is a new development in the EEVF.
The large depths of the hypocenters of the DLF-earthquakes are well outside the average for the tectonic earthquakes within the Ochtendunger Fault Zone and can be related to magmatic recharging processes at the lower crust beneath Laacher See Volcano, ≈10 km northwest of our study site in the EEVF [21,73]; pers. comm. Erdbebendienst Südwest]. We visually observed a relation between earthquakes and the gas concentrations. Our data from the bi-weekly 7-M samples show a potential hint that DLF-earthquakes might actively modulate degassing. Almost all gas concentrations in the springs decreased after this DLF-earthquake event on 24 June (e.g., Figure A3). This earthquake was located between Clusters M1 and C2 [21]; pers. comm. Erdbebendienst Südwest. Furthermore, Nette and the DLF-earthquake are in a faulted area with a vertically dipping fault plane in NW–SE direction showing strike-slip mechanism [21]. We hypothesize that the vertical fault plane and DLF earthquakes that are commonly ascribed to movements of magmatic fluids [21], might promote a quick ascent of gases towards the surface within a short period of time. As there was only one DLF-earthquake, however, statistical power is much too low to detect significant associations between gas flux patterns and earthquakes. Nevertheless, the recent occurrences of DLF-earthquakes that are related to magmatic processes at the lower crust indicates the need for continuous monitoring of geogenic gases in this youngest volcanic field in Germany.
Furthermore, evidence of seismic influence on gas concentrations and fluctuation patterns could be visually observed after the two nearby earthquakes that occurred on 25 July (ML 1.4; depth 10 km; <5 km distance) and 27 July (ML 0.7; depth 9 km; <8 km distance) during the 4-W campaign (Figure A3). As there were only two such nearby events, however, statistical power is much too low to detect significant associations between gas flux and earthquakes. Though more micro-earthquakes occurred during the sampling, we did not find all earthquakes being related to degassing patterns. This result is attributable to either: (a) The earthquake magnitudes being too small to influence gas concentrations; (b) most of the earthquakes occurring at distances >10 km from the springs and not having any influence; or (c) discontinuous sampling intervals not allowing for the observation of an impact of earthquakes on gas concentrations.
The degassing pattern from the subsurface has been suggested to be dependent on meteorological conditions (e.g., [74,75,76,77]). Those studies concentrated on diffuse soil degassing, not on direct degassing of mineral springs. Our results based on continuous in situ monitoring of the nearby meteorological variables do not support this suggestion for the investigated 7-M period (c.f., [78] for the El Hierro Volcanic system). This result is in agreement with other data [75] that found only low correlations between degassing and air temperature (−0.31) and no correlations with humidity, atmospheric pressure, rain, or windspeed (−0.09–0.07; [55]). Additionally, our results do not support the hypothesis that air temperature is a dominant controller of CO2 production [79]. The reason for these differences may reflect different measurements of meteorological variables. In previous publications, these were based on only one daily value recorded from distant meteorological stations [30], not on continuous in situ measurements. The moderate negative influence of temperature and positive influences of wind speed in Kobern during the bi-weekly sampling (Figure A1 and Figure A2; Table A3) can be attributed to the permanent wooden cover on the semi-circular stone-walled water basin, emplaced for hazard prevention. This influence vanished during the 4-W sampling when the stone-walled water basin was ventilated every eight hours. As we cannot rule out the existence of seasonal variations on degassing patterns, continuous monitoring of geogenic gases and water chemistry for several years in all available springs would help address the magnitude and importance of seasonal effects.
Our results of continuous monitoring of gas emissions support the hypothesis by Hensch et al. [21] that the area of the Laacher See volcano might exhibit an active magmatic system with connections to a melt zone in the upper mantle. Magma convection and mixing dynamics combined with strongly variable flow and discharge pulses of magma into the conduit [80,81], may be a source of passive periodic degassing.
To understand and monitor its magmatic and degassing system in relation to new developments in deep low-frequency micro-earthquakes, infrequent samples are unlikely to be useful. To achieve baseline monitoring data, continual systematic collection, analysis, and interpretation of gas concentrations of the gases in all available mineral springs of the EEVF taken at short temporal intervals are needed.
5. Conclusions
Geogenic gases from mineral springs in the Neuwied Basin, a part of the East Eifel Volcanic Field (EEVF), were sampled to describe and analyze gas composition, fluctuation patterns, temporal variations, and carrier-trace-gas couples of geogenic gases (He, Rn, CO2). Key results of the bi-weekly sampling during seven months with an augmented 8-hourly sampling during a 4-week period were that:
- First identification of periodic degassing rhythms of 1 day and 2–5 days for CO2, He, and Rn in mineral springs of the East Eifel Volcanic field (EEVF) that correspond to analyses of soil gasses were done in a parallel study.
- Cross-correlation analyses, CO2–He coupling, and CO2–Rn coupling together suggest that Nette and Kärlich are directly linked via previously unknown tectonic fault systems.
- The volcanic activity in the EEVF is dormant but not extinct. To understand and monitor its magmatic and degassing systems in relation to new developments in earthquake processes and to identify seasonal variation in gas flux, we recommend continuous monitoring of geogenic gases in all available springs taken at short temporal intervals.
Author Contributions
Funding acquisition, G.M.B, A.M.E. and C.W.; conceptualization, G.M.B; investigation, G.M.B, M.B.B; methodology, G.M.B; formal analysis, G.M.B, M.B.B, A.M.E. and C.W.; writing—original draft preparation, G.M.B, M.B.B, A.M.E. and C.W.; writing—review and editing, G.M.B, M.B.B, A.M.E. and C.W.; project administration G.M.B.
Funding
The study is part of the research project “GeoBio-Interactions” funded by the VW-Stiftung (grant numbers Az 93 403 and Az 94 626) within the initiative “Experiment!”—Auf der Suche nach gewagten Forschungsideen. The VW-Stiftung had no role in the design of the study; in the collection, analyses, or interpretation of data; in the writing of the manuscript, and in the decision to publish the results.
Acknowledgments
We thank Hayley Simpson, Alfredo Román Tejeda, and Stanley Obamwonyi (all M.Sc. students at the University of Duisburg-Essen), and Mark Schumann, Felix Dacheneder and Thomas Evert (University of Duisburg-Essen) for doing the gas sampling and analyses. Gas analyses were run on equipment from the department of Geology at University of Duisburg-Essen. We also thank Michael Dötsch (Mayor of Kobern-Gondorf), Jürgen Dumont (private owner of the Flöcksmühle (Nette) in the Nette river) and Uli Klöckner (Mayor of Mülheim-Kärlich) for their support and the permission to use and modify the outlet of the mineral springs Nette, Kobern, and Kärlich for the field campaign. We thank Arne Grumpe (TU Dortmund) for his support in FT-based analysis. We acknowledge financial support by Deutsche Forschungsgemeinschaft and Technische Universität Dortmund/TU Dortmund University within the funding programme Open Access Publishing.
Conflicts of Interest
The authors declare no conflict of interest. The funders had no role in the design of the study; in the collection, analyses, or interpretation of data; in the writing of the manuscript, or in the decision to publish the results.
Appendix A
Table A1.
Correlation coefficients between fluctuation patterns of geogenic gas concentrations (centered and scaled data) during the bi-weekly (a) and 8-hourly (b) survey in the mineral springs. Significant correlation coefficients [55] are highlighted in bold.
Table A1.
Correlation coefficients between fluctuation patterns of geogenic gas concentrations (centered and scaled data) during the bi-weekly (a) and 8-hourly (b) survey in the mineral springs. Significant correlation coefficients [55] are highlighted in bold.
| (a) 7-M | Nette | Kärlich | Kobern | (b) 4-W | Nette | Kärlich | Kobern |
|---|---|---|---|---|---|---|---|
| CO2 (Vol.%) | CO2 (Vol.%) | ||||||
| Nette | 1 | Nette | 1 | ||||
| Kärlich | 0.92 | 1 | Kärlich | 0.65 | 1 | ||
| Kobern | 0.35 | 0.21 | 1 | Kobern | 0.12 | 0.35 | 1 |
| He (ppb) | He (ppb) | ||||||
| Nette | 1 | Nette | 1 | ||||
| Kärlich | 0.75 | 1 | Kärlich | 0.76 | 1 | ||
| Kobern | −0.59 | −0.53 | 1 | Kobern | 0.12 | 0.00 | 1 |
| Rn (Bq/L) | Rn (Bq/L) | ||||||
| Nette | 1 | Nette | 1 | ||||
| Kärlich | 0.04 | 1 | Kärlich | 0.44 | 1 | ||
| Kobern | 0.09 | 0.42 | 1 | Kobern | 0.19 | 0.52 | 1 |
Table A2.
Fourier Transform (FT) for CO2, He and Rn in mineral waters (4-W sampling). Maxima of amplitudes are highlighted in bold.
Table A2.
Fourier Transform (FT) for CO2, He and Rn in mineral waters (4-W sampling). Maxima of amplitudes are highlighted in bold.
| Days | Cycles | CO2 Nette | CO2 Kärlich | CO2 Kobern | He Nette | He Kärlich | He Kobern | Rn Nette | Rn Kärlich | Rn Kobern |
|---|---|---|---|---|---|---|---|---|---|---|
| 1 | 0.33 | |||||||||
| 0.66 | 7 | 11 | 14 | 76,846 | 2803 | 6528 | 32 | 43 | 37 | |
| 1.00 | 8 | 13 | 44 | 94,651 | 4032 | 7605 | 30 | 82 | 32 | |
| 2 | 1.33 | 6 | 20 | 31 | 92,905 | 5979 | 7864 | 29 | 82 | 46 |
| 1.66 | 13 | 16 | 28 | 94,394 | 4098 | 2581 | 32 | 81 | 36 | |
| 2.00 | 9 | 14 | 19 | 94,997 | 6743 | 5544 | 25 | 52 | 26 | |
| 3 | 2.33 | 9 | 11 | 34 | 78,069 | 2608 | 3975 | 21 | 48 | 25 |
| 2.66 | 7 | 2 | 26 | 55,541 | 1188 | 565 | 25 | 85 | 19 | |
| 3.00 | 11 | 19 | 20 | 48,987 | 2531 | 5596 | 26 | 85 | 27 | |
| 4 | 3.33 | 15 | 25 | 20 | 44,947 | 3720 | 8418 | 26 | 83 | 11 |
| 3.66 | 10 | 25 | 22 | 35,557 | 5889 | 7849 | 22 | 93 | 15 | |
| 4.00 | ||||||||||
| 5 | 5 | 10 | 15 | 59,780 | 4918 | 8054 | 16 | 56 | 12 | |
| 5.00 | 11 | 10 | 15 | 69,155 | 1777 | 4185 | 15 | 33 | 31 | |
| 6 | ||||||||||
| 6.00 | 7 | 24 | 26 | 49,106 | 3398 | 3773 | 12 | 62 | 52 | |
| 7 | ||||||||||
| 7.00 | ||||||||||
| 8 | 13 | 23 | 22 | 60,093 | 5166 | 4753 | 16 | 18 | 30 | |
| 8.00 | ||||||||||
| 9 | ||||||||||
| 9.00 | ||||||||||
| 10 | ||||||||||
| 10.00 | 31 | 20 | 27 | 136,078 | 8928 | 7648 | 20 | 34 | 17 | |
| 11 | ||||||||||
| 11.00 | ||||||||||
| 12 | ||||||||||
| 12.00 | ||||||||||
| 13 | ||||||||||
| 13.00 | ||||||||||
| 14 | ||||||||||
| 14.00 | ||||||||||
| 15 | ||||||||||
| 15.00 | 42 | 8 | 18 | 153,949 | 6666 | 11,316 | 28 | 122 | 17 | |
| 30 | 30 | 76 | 25 | 16 | 90,588 | 4707 | 13,573 | 34 | 191 | 49 |

Figure A1.
Coefficients of the principal components analysis of weather variables with geogenic gas concentrations for (a) CO2, (b) He, and (c) Rn for the mineral springs during the 7-M campaign. The histograms on the diagonal illustrate the distribution of data of each of the three principal axes describing meteorological conditions (see also Table 2 and Table 3); the plots below the diagonal illustrate the raw data (symbols) and pair-wise linear regression relationships (red lines) for each corresponding pair of variables along the diagonal, and the panels above the diagonals report the pair-wise correlation coefficients (font size scaled to the coefficients).

Figure A2.
Coefficients of the principal components analysis of weather variables with geogenic gas concentrations for (a) CO2, (b) He, and (c) Rn for the mineral springs during the 4-W campaign. The histograms on the diagonal illustrate the distribution of data of each of the three principal axes describing meteorological conditions (see also Table 2 and Table 3); the plots below the diagonal illustrate the raw data (symbols) and pair-wise linear regression relationships (red lines) for each corresponding pair of variables along the diagonal, and the panels above the diagonals report the pair-wise correlation coefficients (font size scaled to the coefficients).
Table A3.
Coefficients of raw data of weather variables (air temperature, air pressure, wind speed, humidity) with geogenic gas concentrations for CO2, He, and Rn for the mineral springs during the 4-W sampling.
Table A3.
Coefficients of raw data of weather variables (air temperature, air pressure, wind speed, humidity) with geogenic gas concentrations for CO2, He, and Rn for the mineral springs during the 4-W sampling.
| 4-W Sampling | Nette | Kärlich | Kobern |
|---|---|---|---|
| CO2 (Vol.%) | |||
| Air temperature | 0.11 | 0.17 | 0.20 |
| Air pressure | −0.19 | −0.09 | −0.11 |
| Humidity | 0.06 | −0.21 | −0.12 |
| Wind speed | −0.07 | −0.19 | −0.22 |
| He (ppb) | |||
| Air temperature | −0.02 | 0.00 | 0.07 |
| Air pressure | −0.03 | −0.16 | −0.09 |
| Humidity | 0.01 | −0.01 | 0.03 |
| Wind speed | −0.03 | −0.23 | −0.08 |
| Rn (Bq/L) | |||
| Air temperature | 0.04 | −0.01 | 0.13 |
| Air pressure | 0.00 | −0.19 | −0.13 |
| Humidity | −0.01 | −0.09 | −0.12 |
| Wind speed | −0.18 | −0.06 | −0.05 |

Figure A3.
Gas concentrations (raw data) during the bi-weekly (a–c) and 8-hourly (d–f) survey in the mineral springs and earthquake events (ML) indicated by purple crosses. The DLF-earthquake on 24 June 2016 in Niedermendig is marked in magenta (a–c); earthquakes with a distance <12 km during the 4-W sampling are marked in green (d–f). Median values are indicated by the horizontal lines colored according to the spring colors.
References
- Hunt, J.A.; Zafu, A.; Mather, T.A.; Pyle, D.M.; Barry, P.H. Spatially Variable CO2 Degassing in the Main Ethiopian Rift: Implications for Magma Storage, Volatile Transport, and Rift-Related Emissions. Geochem. Geophys. Geosystems 2017, 18, 3714–3737. [Google Scholar] [CrossRef]
- Burton, M.R.; Sawyer, G.M.; Granieri, D. Deep Carbon Emissions from Volcanoes. Rev. Miner. Geochem. 2013, 75, 323–354. [Google Scholar] [CrossRef]
- Mörner, N.-A.; Etiope, G. Carbon degassing from the lithosphere. Planet. Chang. 2002, 33, 185–203. [Google Scholar] [CrossRef]
- Inguaggiato, S.; DiLiberto, I.S.; Federico, C.; Paonita, A.; Vita, F. Review of the evolution of geochemical monitoring, networks and methodologies applied to the volcanoes of the Aeolian Arc (Italy). Earth-Science Rev. 2018, 176, 241–276. [Google Scholar] [CrossRef]
- Marrero-Diaz, R.; López, D.; Pérez, N.M.; Custodio, E.; Sumino, H.; Melián, G.V.; Padrón, E.; Hernández, P.A.; Calvo, D.; Barrancos, J.; et al. Carbon dioxide and helium dissolved gases in groundwater at central Tenerife Island, Canary Islands: Chemical and isotopic characterization. Bull. Volcanol. 2015, 77. [Google Scholar] [CrossRef]
- Liotta, M.; D’Alessandro, W.; Bellomo, S.; Brusca, L. Volcanic plume fingerprint in the groundwater of a persistently degassing basaltic volcano: Mt. Etna. Chem. Geol. 2016, 433, 68–80. [Google Scholar] [CrossRef]
- Petrosino, S.; Cusano, P.; Madonia, P. Tidal and hydrological periodicities of seismicity reveal new risk scenarios at Campi Flegrei caldera. Sci. Rep. 2018, 8, 13808. [Google Scholar] [CrossRef] [PubMed]
- Flower, V.J.B.; Carn, S.A. Characterising volcanic cycles at Soufriere Hills Volcano, Montserrat: Time series analysis of multi-parameter satellite data. J. Vol. Geotherm. Res. 2014, 304, 82–93. [Google Scholar] [CrossRef][Green Version]
- Bredemeyer, S.; Hansteen, T.H. Synchronous degassing patterns of the neighbouring volcanoes Llaima and Villarrica in south-central Chile: The influence of tidal forces. N.a. Diabetol. 2014, 103, 1999–2012. [Google Scholar]
- Ilanko, T.; Oppenheimer, C.; Burgisser, A.; Kyle, P. Cyclic degassing of Erebus volcano, Antarctica. Bull. Volcanol. 2015, 77, 56. [Google Scholar] [CrossRef]
- Lamb, O.D.; Varley, N.R.; Mather, T.A.; Pyle, D.M.; Smith, P.J.; Liu, E.J. Multiple timescales of cyclical behaviour observed at two dome-forming eruptions. J. Volcanol. Geotherm. 2014, 284, 106–121. [Google Scholar] [CrossRef]
- Druitt, T.H.; Young, S.R.; Baptie, B.; Bonadonna, C.; Calder, E.S.; Clarke, A.B.; Cole, P.D.; Harford, C.L.; Herd, R.A.; Luckett, R.; et al. Episodes of cyclic Vulcanian explosive activity with fountain collapse at Soufrière Hills Volcano, Montserrat. Geol. Soc. London, Memoirs 2002, 21, 281–306. [Google Scholar] [CrossRef]
- Nicholson, E.J.; Mather, T.A.; Pyle, D.M.; Odbert, H.M.; Christopher, T. Cyclical patterns in volcanic degassing revealed by SO2 flux timeseries analysis: Anapplication to Soufrière Hills Volcano, Montserrat. Earth. Plan Sci. Let. 2013, 375, 209–221. [Google Scholar] [CrossRef]
- Loughlin, S.C.; Luckett, R.; Ryan, G.; Christopher, T.; Hards, V.; De Angelis, S.; Strutt, M. An overview of lava dome evolution, dome collapse and cyclicity at Soufrière Hills Volcano, Montserrat, 2005–2007. Geophys. Res. Lett. 2010, 37, 19. [Google Scholar] [CrossRef]
- Odbert, H.M.; Wadge, G. Time series analysis of lava flux. J. Volcanol. Geotherm. Res. 2009, 188, 305–314. [Google Scholar] [CrossRef]
- Jaquet, O.; Carniel, R.; Sparks, S.; Thompson, G.; Namar, R.; Di Cecca, M. DEVIN: Aforecasting approach using stochastic methods applied to the Soufriere Hills Volcano. J. Volcanol. Geotherm. Res. 2006, 153, 97–111. [Google Scholar] [CrossRef]
- Sparks, R.S.J.; Young, S.R. The eruption of Soufrière Hills Volcano, Montserrat (1995–1999): Overview of scientific results. Geol. Soc. London, Memoirs 2002, 21, 45–69. [Google Scholar] [CrossRef]
- Tilling, R.I. The critical role of volcano monitoring in risk reduction. Adv. Geosci. 2008, 14, 3–11. [Google Scholar] [CrossRef]
- Achauer, U.; Ritter, J.R.; Jordan, M.; Christensen, U.R. A mantle plume below the Eifel volcanic fields, Germany. Earth Planet. Sci. Lett. 2001, 186, 7–14. [Google Scholar]
- Schmincke, H.U. The Quaternary volcanic fields of the East and the West Eifel (Germany). In Mantle Plumes: A Multidisciplinary Approach; Ritter, J.R.R., Christensen, U.R., Eds.; Springer: Berlin Heidelberg, 2007; pp. 241–322. [Google Scholar]
- Hensch, M.; Dahm, T.; Ritter, J.; Heimann, S.; Schmidt, B.; Stange, S.; Lehmann, K. Deep low-frequency earthquakes reveal ongoing magmatic recharge beneath Laacher See Volcano (Eifel, Germany). Geophys. J. Int. 2019, 216, 2025–2036. [Google Scholar] [CrossRef]
- Hinzen, K.-G. Stress field in the Northern Rhine area, Central Europe, from earthquake fault plane solutions. Tectonophysics 2003, 377, 325–356. [Google Scholar] [CrossRef]
- Griesshaber, E.; O’Nions, R.; Oxburgh, E. Helium and carbon isotope systematics in crustal fluids from the Eifel, the Rhine Graben and Black Forest, F.R.G. Chem. Geol. 1992, 99, 213–235. [Google Scholar] [CrossRef]
- Griesshaber, E. The distribution pattern of mantle derived volatiles in mineral waters of the Rhenish Massif. In Young Tectonics-Magmatism-Fluids, A Case Study of the Rhenish Massif; Neugebauer, H.J., Ed.; SFB 350: Wechselwirkungen kontinentaler Stoffsysteme und ihre Modellierung, Rheinische Friedrich-Wilhelm Universität: Bonn, Germany, 1998; Volume 74, pp. 51–59. [Google Scholar]
- Bräuer, K.; Kämpf, H.; Niedermann, S.; Strauch, G. Indications for the existence of different magmatic reservoirs beneath the Eifel area (Germany): A multi-isotope (C, N, He, Ne, Ar) approach. Chem. Geol. 2013, 356, 193–208. [Google Scholar] [CrossRef]
- May, F.; Hoernes, S.; Neugebauer, H.J. Genesis and distribution of mineral waters as a consequence of recent lithospheric dynamics: The Rhenish Massif, Central Europe. N.a. Diabetol. 1996, 85, 782–799. [Google Scholar] [CrossRef]
- May, F. Quantifizierung des CO2-Flusses zur Abbildung magmatischer Prozesse im Untergrund der Westeifel; Shaker Verlag: Aachen, Germany, 2002; p. 172. [Google Scholar]
- May, F. Säuerlinge der Vulkaneifel und der Südeifel. Mainzer. Geowiss. Mitt. 2002, 31, 7–57. [Google Scholar]
- Clauser, C.; Griesshaber, E.; Neugebauer, H.J. Decoupled thermal and mantle helium anomalies: Implications for the transport regime in continental rift zones. J. Geophys. Res. 2002, 107, 2269. [Google Scholar] [CrossRef]
- Gal, F.; Michel, B.; Gilles, B.; Frédéric, J.; Karine, M. CO2 escapes in the Laacher See region, East Eifel, Germany: Application of natural analogue onshore and offshore geochemical monitoring. Int. J. Greenh. Gas 2011, 5, 1099–1118. [Google Scholar] [CrossRef]
- Berberich, G.M.; Berberich, M.B.; Ellison, A.M.; Wöhler, C. Degassing Rhythms and Fluctuations of Geogenic Gases in A Red Wood-Ant Nest and in Soil in The Neuwied Basin (East Eifel Volcanic Field, Germany). Insects 2018, 9, 135. [Google Scholar] [CrossRef]
- Berberich, G.M.; Ellison, A.M.; Berberich, M.B.; Grumpe, A.; Becker, A.; Wöhler, C. Can a red wood-ant nest be associated with fault-related CH4 micro-seepage? A case study from continuous short-term in-situ sampling. Animals 2018, 8, 46. [Google Scholar] [CrossRef]
- Berberich, G.M.; Berberich, M.B.; Ellison, A.M.; Grumpe, A.; Becker, A.; Wöhler, C. First in Situ Identification of Ultradian and Infradian Rhythms, and Nocturnal Locomotion Activities of Four Colonies of Red Wood Ants (Formica rufa-Group). J. Biol. Rhythms 2019, 34, 19–38. [Google Scholar] [CrossRef]
- Tesauro, M.; Hollenstein, C.; Egli, R.; Geiger, A.; Kahle, H.-G. Analysis of central western Europe deformation using GPS and seismic data. J. Geodyn. 2006, 42, 194–209. [Google Scholar] [CrossRef]
- Campbell, J.; Kümpel, H.-J.; Fabian, M.; Fischer, D.; Görres, B.; Keysers, C.J.; Lehmann, K. Recent movement pattern of the Lower Rhine Basin from tilt, gravity and GPS data. Neth. J. Geosc. Geologie en Mijnbouw 2002, 81, 223–230. [Google Scholar]
- May, F. Alteration of Wall Rocks by CO 2 -Rich Water Ascending in Fault Zones: Natural Analogues for Reactions Induced by CO 2 Migrating Along Faults in Siliciclastic Reservoir and Cap Rocks. Oil Gas Sci. Technol. – d’IFP Energies Nouv. 2005, 60, 19–32. [Google Scholar] [CrossRef]
- Litt, T.; Brauer, A.; Goslar, T.; Merk, J.; Balaga, K.; Mueller, H.; Ralska-Jasiewiczowa, M.; Stebich, M.; Negendank, J.F.W. Correlation and synchronisation of Late glacial continental sequences in northern Central Europe based on annually laminated lacustrine sediments. Quat. Sci. Rev. 2001, 20, 1233–1249. [Google Scholar] [CrossRef]
- Wörner, G. Quaternary Eifel volcanism, its mantle sources and effect on the crust of the Rhenish Shield. In Young Tectonics-Magmatism-Fluids, A Case Study of the Rhenish Massif; Neugebauer, H.J., Ed.; SFB 350: Wechselwirkungen kontinentaler Stoffsysteme und ihre Modellierung, Rheinische Friedrich-Wilhelm Universität: Bonn, Germany, 1998; Volume 74, pp. 11–17. [Google Scholar]
- Puchelt, H. Carbon dioxide in the Rhenish Massif, Central Europe. In Plateau Uplift. The Rhenish Shield - A Case History; Fuchs, K., von Gehlen, K., Mälzer, H., Murawski, H., Semmel, A., Eds.; Springer: Berlin, Germany, 1983. [Google Scholar]
- Frechen, J.; Hopmann, M.; Knetsch, G. Die Vulkanische Eifel; Stollfuß Verlag: Bonn, Germany, 1967; p. 140. [Google Scholar]
- Imboden, D.M.; Aeschbach-Hertig, W.; Kipfer, R.; Hofer, M.; Wieler, R.; Signer, P. Quantification of gas fluxes from the subcontinental mantle: The example of Laacher See, a maar lake in Germany. Geochim, Cosmochim, Acta 1996, 60, 31–41. [Google Scholar]
- Meyer, W. Geologie der Eifel; E. Schweitbart’sche Verlagsbuchandlung: Stuttgart, Germany, 1994. [Google Scholar]
- Ahorner, L. Historical seismicity and present-day microearthquake activity of the Rhenish Massif, Central Europe. In Plateau Uplift, The Rhenish Shield—A Case History; Fuchs, K., Von Gehlen, K., Mälzer, M., Murawski, H., Semmel, A., Eds.; Springer: Berlin, Germany, 1983; pp. 198–221. [Google Scholar]
- Kemski, J.; Klingel, R.; Siehl, A.; Neznal, M.; Matolin, N. Erarbeitung Fachlicher Grundlagen zur Beurteilung der Vergleichbarkeit Unterschiedlicher Messmethoden zur Bestimmung der Radonbodenluftkonzentration—Vorhaben 3609S10003. Bd. 2 Sachstandsbericht “Radonmessungen in der Bodenluft -Einflussfaktoren, Messverfahren, Bewertung”; Urn:nbn:de:0221-201203237830; Bundesamt für Strahlenschutz (BfS): Salzgitter, Germany, 2012. [Google Scholar]
- LGB RLP. Radonpotentialkarte der Osteifel. Landesamt für Geologie und Bergbau Rheinland-Pfalz, 2017a. Available online: http://www.LGBRLP.de/karten-und-produkte/online-karten/online-karte-radonprognose.html (accessed on 1 August 2017).
- Liesenfeld, J. Cobern: Führer mit Beiträgen zu Seiner Ortsgeschichte; Verschönerungs- u. Altertumsverein: Cobern, Germany, 1926. [Google Scholar]
- LGB RLP. Geologie von Rheinland-Pfalz; Schweizbart’sche Verlagsbuchhandlung (Nägele u. Obermiller): Stuttgart, Germany, 2005. [Google Scholar]
- Schäfer, P.; Kadolsky, D. Neuwieder Becken. Available online: https://www.schweizerbart.de/papers/sdgg/detail/75/78648/Neuwieder_Becken (accessed on 14 February 2019).
- Landesamt für Geologie und Bergbau Rheinland-Pfalz (LGB RLP). Hydrogeologische Kartierung Neuwieder Becken, 1:25,000. Ed; Landesamt für Geologie und Bergbau Rheinland-Pfalz: Mainz, Germany, 2000. [Google Scholar]
- LGB RLP. Earthquake Catalogue. Landesamt für Geologie und Bergbau Rheinland-Pfalz. 2017. Available online: http://www.LGB RLP.de/erdbeben.htm (accessed on 5 January 2017).
- BNS. Earthquake Data Catalogue. Department of Earthquake Geology of Cologne University. 2017. Available online: www.seismo.uni-koeln.de/catalog/index.htm (accessed on 5 January 2017).
- Berberich, G. Identifikation Junger Gasführender Störungszonen in der West- und Hocheifel mit Hilfe von Bioindikatoren. Ph.D. Thesis, University of Duisburg-Essen, Duisburg, Germany, 2010. [Google Scholar]
- Rose, S.; Long, A. Monitoring Dissolved Oxygen in Ground Water: Some Basic Considerations. J. Recomm. Serv. 1988, 8, 93–97. [Google Scholar] [CrossRef]
- Berberich, G.M.; Schreiber, U. GeoBioScience: Red wood ants as bioindicators for active tectonic fault systems in the West Eifel (Germany). Animals 2013, 3, 475–498. [Google Scholar] [CrossRef]
- Hinkle, D.E.; Wiersma, W.; Jurs, S.G. Applied Statistics for the Behavioral Sciences, 5th ed.; Wadsworth Publishing: Belmont, CA, USA, 2009. [Google Scholar]
- Marsland, S. Machine Learning, an Algorithmic Perspective, 1st ed.; CRC Press: Boca Raton, FL, USA, 2009. [Google Scholar]
- Oppenheim, A.V.; Schafer, R.W.; Buck, J.R. Discrete-Time Signal Processing; Pearson Education India: Upper Saddle River, NJ, USA, 1999; pp. 468–471. [Google Scholar]
- Davidson, T.A.; Emerson, D.E. Direct determination of the helium 3 content of atmospheric air by mass spectrometry. J. Geophys. Res. Atmos. 1990, 95. [Google Scholar] [CrossRef]
- TrinkwV. Trinkwasserverordnung in der Fassung der Bekanntmachung vom 10. März 2016 (BGBl. I S. 459), die durch Artikel 2 des Gesetzes vom 17. Juli 2017 (BGBl. I S. 2615) geändert worden ist. Available online: www.juris.de (accessed on 15 September 2017).
- Berberich, G.M.; Schreiber, U. (Landesamt für Geologie und Bergbau Rheinland-Pfalz, Mainz, Germany). Monitoring geogener Gase in der West-, Ost- und Südeifel sowie im Mittelrhein-/Lahngebiet. Unpublished Work. 2012; 37. [Google Scholar]
- Watson, Z.T.; Hana, W.S.; Keating, E.H.; Junga, N.H.; Luc, M. Eruption dynamics of CO2-driven cold-water geysers: Crystal, Tenmile geysers in Utah and Chimayó geyser in New Mexico. Earth Plan. Sci. Let. 2014, 408, 272–284. [Google Scholar] [CrossRef]
- Weinlich, F.H. Isotopically light carbon dioxide in nitrogen rich gases, The gas distribution pattern in the French Massif Central, the Eifel and the western Eger Rift. Ann. Geophys. 2005, 48, 19–31. [Google Scholar]
- Kirk, K. Natural CO2 Flux Literature Review for the QICS Project; Commissioned Report, CR/11/005; British Geological Survey, Energy Programme; Kexworth: Nottingham, UK, 2011; 38p. [Google Scholar]
- Collettini, C.; Cardellini, C.; Chiodini, G.; De Paola, N.; Holdsworth, R.E.; Smith, S.A.F. Fault weakening due to CO degassing in the Northern Apennines: Short- and long-term processes. Geo. Soc. 2008, 299, 175–194. [Google Scholar] [CrossRef]
- Baubron, J.C.; Rigo, A.; Toutain, J.-P. Soil gas profiles as a tool to characterize active tectonic areas: The Jaut Pass example (Pyrenees, France). Earth Planet. Sci. Lett. 2002, 196, 69–81. [Google Scholar] [CrossRef]
- Ciotoli, G.; Lombardi, S.; Morandi, S.; Zarlenga, F. A multidisciplinary statistical approach to study the relationships between helium leakage and neo-tectonic activity in a gas province: The Vasto Basin, Abruzzo-Molise (Central Italy). AAPG Bull. 2004, 88, 355–372. [Google Scholar] [CrossRef]
- Etiope, G.; Martinelli, G. Migration of carrier and trace gases in the geosphere: An overview. Phys. Earth Plan. Int. 2002, 129, 185–204. [Google Scholar] [CrossRef]
- Ciotoli, G.; Sciarra, A.; Ruggiero, L.; Annunziatellis, A.; Bigi, S. Soil gas geochemical behaviour across buried and exposed faults during the 24 August 2016 central Italy earthquake. Ann. Geophys. 2016, 59. [Google Scholar] [CrossRef]
- Crockett, R.G.M.; Gillmore, G.K.; Phillips, P.S.; Denman, A.R.; Groves-Kirkby, C.J. Tidal synchronicity of built-environment radon levels in the UK. Geophys. Res. Let. 2006, 33, L05308. [Google Scholar] [CrossRef]
- Council Directive 2013/51/EURATOM of 22 October 2013 Laying down Requirements for the Protection of the Health of the General Public with Regard to Radioactive Substances in Water Intended for Human Consumption. OJ L 296/12, 7.11.2013. Available online: https://eur-lex.europa.eu/LexUriServ/LexUriServ.do?uri=OJ:L:2013:296:0012:0021:EN:PDF (accessed on 15 September 2017).
- Girona, T.; Costa, F.; Schubert, G. Degassing during quiescence as a trigger of magma ascent and volcanic eruptions. Sci. Rep. 2015, 5, 18212. [Google Scholar] [CrossRef]
- Birdsell, D.T.; Rajaram, H.; Dempsey, D.; Viswanathan, H.S. Hydraulic fracturing fluid migration in the subsurface: A review and expanded modeling results. Water Resour. Res. 2015, 51, 7159–7188. [Google Scholar] [CrossRef]
- LGB RLP. Messnetz des Erdbebendienstes Südwest Misst Erstmals Mikrobeben in der Unterkruste unter der Osteifel. Landesamt für Geologie und Bergbau Rheinland-Pfalz, 2017. Available online: http://www.LGB RLP.de/aktuelles/detail/news/detail/News/ (accessed on 1 August 2017).
- Toutain, J.P.; Baubron, J.C. Gas geochemistry and seismotectonics: A review. Tectonophysics 1999, 304, 1–27. [Google Scholar] [CrossRef]
- Oliveira, S.; Viveiros, F.; Silva, C.; Pacheco, J.E. Automatic Filtering of Soil CO2 Flux Data: Different Statistical Approaches Applied to Long Time Series. Front. Earth Sci. 2018, 6, 208. [Google Scholar] [CrossRef]
- Rinaldi, A.P.; Vandemeulebrouck, J.; Todesco, M.; Viveiros, F. Effects of atmospheric conditions on surface diffuse degassing. J Geophys. Res. Solid Earth 2012, 117. [Google Scholar] [CrossRef]
- Granieri, D.; Chiodini, G.; Marzocchi, W.; Avino, R. Continuous monitoring of CO2 soil diffuse degassing at Phlegraean Fields (Italy): Influence of environmental and volcanic parameters. Earth Plan. Sci. Let. 2003, 212, 167–179. [Google Scholar] [CrossRef]
- Padilla, G.D.; Hernández, P.A.; Padrón, E.; Barrancos, J.; Pérez, N.M.; Melián, G.; Nolasco, D.; Dionis, S.; Rodríguez, F.; Calvo, D.; et al. Soil gas radon emissions and volcanic activity at El Hierro (Canary Islands): The 2011–2012 submarine Eruption. Geochem. Geophys. Geosyst. 2013, 14, 432–447. [Google Scholar] [CrossRef]
- Beaubien, S.; Jones, D.; Gal, F.; Barkwith, A.; Braibant, G.; Baubron, J.-C.; Ciotoli, G.; Graziani, S.; Lister, T.; Lombardi, S. Monitoring of near-surface gasgeochemistry at the Weyburn, Canada, CO2-EOR site, 2001–2011. Int. J. Greenh. Gas Control. 2013, 16, 236–262. [Google Scholar] [CrossRef]
- Longo, A.; Papale, P.; Vassalli, M.; Saccoroti, G.; Montagna, C.P.; Cassioli, A.; Guidice, S.; Boschi, E. Magma convection and mixing dynamics as a source of Ultra-Long-Period oscillations. J. Volcanol. Geoth. Res. 2012, 74, 873–880. [Google Scholar] [CrossRef]
- Oppenheimer, C.; Lomakina, A.S.; Kyle, P.R.; Kingsbury, N.G.; Boichu, M. Pulsatory magma supply to a phonolite lava lake. Earth Planet Sci. Lett. 2009, 284, 392–398. [Google Scholar] [CrossRef]
© 2019 by the authors. Licensee MDPI, Basel, Switzerland. This article is an open access article distributed under the terms and conditions of the Creative Commons Attribution (CC BY) license (http://creativecommons.org/licenses/by/4.0/).