Abstract
The Yangtze River Basin (YRB) is highly vulnerable to both floods and droughts, with precipitation playing a key role in driving these hydrological extremes. Understanding and reducing uncertainty in precipitation estimates is therefore crucial for effective water management and hazard mitigation. The study evaluated the error characteristics of daily precipitation estimates from three datasets (CRA40, IMERG, and SM2RAIN) using the triple collocation (TC) approach. A least-squares merging framework was then applied to integrate these datasets and generate merged precipitation estimates with improved accuracy and reduced uncertainty over the YRB. Results showed that all examined datasets exhibited higher fractional root-mean-squared error (fRMSE) in the source region of the Yangtze River, indicating a greater influence of random errors and reduced sensitivity to precipitation changes in this area. Among the datasets, SM2RAIN exhibited the weakest agreement with ground-based measurements, while IMERG performed best in capturing extreme precipitation events. CRA40 and the TC-based merged precipitation estimates exhibited overall higher accuracy, with a station-average correlation coefficient of approximately 0.71. Despite comparable accuracy, the merged precipitation data is relatively more robust than CRA40, with a lower average error standard deviation of 2.07 mm.
1. Introduction
The Yangtze River Basin (YRB)—the longest river system in China and the third-largest river basin in the world—plays a vital role in China’s economic development, ecological stability, and water resource management [1]. The Yangtze River Economic Belt covers approximately 21% of China’s land area, yet supports about 43% of the national population and contributes 46.5% of the country’s gross domestic product (GDP) in 2022 [2,3,4]. However, the YRB is highly susceptible to both floods and droughts due to the combined influences of monsoonal climate dynamics, complex topography, and intensified anthropogenic activities.
In recent decades, climate change and human activities have intensified the frequency and severity of water-related hazards in the YRB. For example, catastrophic floods in the summer of 2020, especially in the middle and lower reaches, affected approximately 45.5 million people and caused direct economic losses exceeding 170 billion RMB (~16.5 billion US dollars) [5,6]. Conversely, in 2022, the YRB experienced an unprecedented drought, notable for its wide spatial extent, prolonged duration, and exceptional intensity [7]. This event affected more than 0.6 million hectares of cropland and resulted in direct economic losses of approximately 7.5 billion US dollars [8]. As a key driver of the hydrological cycle, accurate and high-resolution precipitation estimates are indispensable for hydrological modeling, disaster risk reduction, and climate adaptation.
Rain gauge measurements are generally considered the most reliable source of precipitation data and have been widely used in precipitation analysis. Many studies have employed rain gauge measurements to examine the spatiotemporal variability of precipitation in the YRB, with particular emphasis on extreme events [9,10,11,12,13,14]. Most studies reported increasing frequencies of heavy and extreme precipitation since 1960, particularly in the middle and lower reaches of the basin [10,12,14]. However, Yuan et al. [10] found that many of these increasing trends were not statistically significant across most of the YRB from 1960 to 2020. Given their point-scale nature and limited spatial coverage, rain gauges may fail to capture basin-wide spatiotemporal variability of precipitation, especially in regions with complex terrain and large topographic gradients.
To address these limitations, spatially continuous precipitation products derived from satellites and models have been increasingly adopted. For instance, Wu et al. [15] compared the accuracy of satellite-based precipitation products from the Global Precipitation Measurement (GPM) IMERG and Tropical Rainfall Measuring Mission (TRMM) in the YRB from 2014 to 2017. They found a better performance of the IMERG product, especially for light precipitation detection. Xiao et al. [16] further evaluated the accuracy of seven satellite-based daily precipitation products over the YRB from 2003 to 2017. They highlighted the superior performance of IMERG and the Climate Prediction Center Morphing technique (CMORPH). Nevertheless, most satellite products struggle to detect extreme events, such as heavy rainfall in estuaries and droughts in mountainous regions [16]. Wang et al. [17] compared four precipitation datasets for the period 1998–2014. Their results suggest that CMORPH exhibited relatively high accuracy, while the precipitation forcing in the Global Land Data Assimilation System (GLDAS) was least accurate in the study area. However, none of the four products accurately captured the rainfall intensity levels.
Given the limitations of individual products, multi-source precipitation merging has gained increasing attention [18,19,20,21]. Among the various approaches, the triple collocation (TC)-based merging framework aims to minimize the error variance of the merged product and has gained considerable recognition [20,21,22,23]. TC was developed to analyze the error variance among three independent datasets of the same variable, without requiring a “truth” dataset [24]. TC has been widely applied to assess the error characteristics of various geophysical data beyond precipitation, such as soil moisture [25,26,27,28], evapotranspiration [29,30], and terrestrial water storage [31,32,33]. When combined with a least-squares merging strategy, TC-based error variances can be used to weight the input dataset, yielding merged precipitation estimates with reduced error variance [34]. While TC-based merging has shown promise, its performance in improving precipitation estimates has not been comprehensively evaluated in the YRB. Chen et al. [23], for example, compared collocation-based merging with other methods using four daily gridded precipitation products over the YRB during 2015–2018. They found that the TC method performed comparably to Bayesian model averaging and Random Forest-based merging, with the added benefit of not requiring gauge data, making it especially valuable in ungauged regions.
Despite numerous studies on precipitation estimation in the YRB, most studies rely on gauge networks or gridded products with relatively coarse spatial resolution (e.g., 0.25). Furthermore, many analyses are based on datasets ending before 2020, overlooking both recent updates in precipitation estimation algorithms and potential shifts in precipitation patterns under climate change. To address these gaps and facilitate accurate hydrologic modeling and hazard monitoring, this study applies a TC-based framework to improve precipitation estimation in the YRB. The specific objectives are to: (1) assess the accuracy and error standard deviation of different precipitation products in the YRB; (2) generate high-resolution (0.1), high-accuracy merged precipitation estimates through TC-based merging; and (3) evaluate the ability of each product to capture extreme precipitation events.
The remainder of the paper is organized as follows: Section 2 introduces the study area, datasets, and methodology; Section 3.1 analyzes the uncertainty in multi-source precipitation products; Section 3.2 evaluates the accuracy of the merged precipitation estimates; Section 3.3 examines the performance of all products across different precipitation intensity levels; Section 4 discusses key findings; and Section 5 concludes the study.
2. Materials and Methods
2.1. Study Area
The Yangtze River, the longest river in China, originates in the Tanggula Mountains and flows through 19 provinces and autonomous regions from the west to the East China Sea [23]. The YRB, located between 2430′ N–3545′ N and 9033′ E–12225′ E, is the third-largest river basin in the world, covering an area of approximately 1.8 million km2 [1]. The basin has complex terrain, with elevation decreasing from west to east, as shown in Figure 1. Most of the region experiences a typical subtropical monsoon climate, except for the Tibetan Plateau. Precipitation in the YRB shows strong seasonal variability, with most precipitation occurring during the summer months from May to September [4]. The average annual precipitation of the basin is around 1100 mm, ranging from less than 400 mm in the upper reaches to over 1600 mm in the lower reaches [1,35]. The combination of topographic and climatic factors makes the YRB highly susceptible to flooding, resulting in significant loss of life and severe socioeconomic impacts.
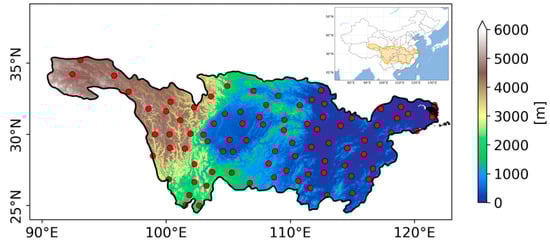
Figure 1.
Location and Elevation of the Yangtze River basin. The red dots represent the locations of rain gauge stations.
2.2. Datasets
2.2.1. IMERG
The Integrated Multi-satellite Retrievals for GPM (IMERG) is a representative global precipitation product that inter-calibrates and merges microwave precipitation estimates, microwave-calibrated infrared satellite estimates, and gauge measurements [36]. The study used the IMERG Version 07 Final Run daily precipitation product with a spatial resolution of 0.1. Data are available at https://gpm.nasa.gov/data/directory (accessed on 9 June 2025).
2.2.2. CRA40
The Chinese Global Atmospheric Reanalysis (CRA40) is the first-generation atmospheric reanalysis dataset developed by the China Meteorological Administration (CMA) [37,38]. It provides consistent, high-quality estimates of variables related to the atmosphere, land surface, and oceans since 1979. The reanalysis system employs a three-dimensional variational assimilation technique, and its atmospheric reanalysis products are offered at multiple horizontal resolutions ranging from 35 km to 2.5, and temporal resolutions from 6-hourly to monthly. Although several studies have evaluated the reliability of CRA40 precipitation estimates across different regions [38,39,40,41], its accuracy and uncertainty in the YRB remain insufficiently assessed.
Therefore, this study utilized the 6-hourly precipitation estimates from CRA40 on a 0.25 grid. The data are archived by the China Meteorological Data Service Center at https://data.cma.cn/en/?r=data/detail&dataCode=NAFP_CRA40_FTM_6HOR&keywords=month (accessed on 9 June 2025). To ensure consistency with other datasets, the CRA40 data were spatially interpolated to the 0.1 grid of IMERG using linear interpolation and temporally aggregated to the daily scale.
2.2.3. SM2RAIN-ASCAT
SM2RAIN-ASCAT is a global rainfall product derived from the Soil Moisture to Rain algorithm using Advanced SCATeterometer soil moisture observations [42]. The “bottom-up” approach treats satellite-derived soil moisture as natural rain gauges to infer rainfall amounts based on the soil water balance equation. The study employed the SM2RAIN-ASCAT version 2.1.2n dataset (hereafter referred to as “SM2RAIN”), which provides daily precipitation data at a 0.1 resolution. The dataset is available from 2007 to 2022, and it can be downloaded from https://zenodo.org/records/10376109 (accessed on 9 June 2025).
2.2.4. In Situ Measurements
To evaluate the performance of different precipitation products, daily precipitation measurements from CMA rainfall gauges were collected. A total of 87 rain gauges in the YRB with continuous daily records from 2007 to 2022 were selected for analysis. The spatial distribution of rainfall gauges is shown in Figure 1.
It is noted that the spatial mismatch between gridded estimates and point-scale measurements may affect evaluation results. However, applying gauge-to-grid or grid-to-point matching introduces additional uncertainties, particularly in mountainous areas. Moreover, the choice of scale-matching method (e.g., nearest neighbor or bilinear interpolation) can lead to different comparison outcomes, and the implications of these methods are not yet fully understood [43,44]. Therefore, following many previous studies [45,46,47], this study directly compares precipitation measurements at ground-based stations with estimates in the corresponding grid cells.
2.3. Methods
2.3.1. Triple Collocation
TC quantifies the random error variance based on three collocated datasets of the same geophysical variable [24,27]. Assuming that the three datasets are independent, the most commonly used error model for TC analysis represents relationship between the estimates and the unknown “true” values as a linear additive model:
where (i = 1, 2, 3) denotes the three collocated precipitation estimates from IMERG, CRA40, and SM2RAIN, respectively; and are the linear regression coefficients between the estimates and the true state , which represent the systematic error; is the random error with mean zero and error variance of .
Unlike conventional mean square difference methods that requires a reference dataset, TC enables the estimation of error variances without relying on a known ground “truth”. The error variance can be derived using either a difference notation (i.e., cross-multiplying differences between the three rescaled datasets) or a covariance notation (combination of the covariances between the datasets). More details of derivations of the two notations are provided in Gruber et al. [27]. In the study, the covariance notation was adopted. Accordingly, the data variances () and covariances () are expressed as follows:
where represents the variance of the true state; i, j and . Thus, the unscaled error variance can be represented as:
For consistency with the magnitude of precipitation values, uncertainty is quantified and reported as random error standard deviation (i.e., the square root of the error variance) in the study.
It should be noted that the unscaled error variance (or standard deviation) from Equation (3) does not account for differences in signal amplitude among the datasets. The limitation can result in misleading or inconsistent comparisons of error variance across the study domain. To address this issue, the fractional root-mean-squared error (fRMSE) was further employed to measure the error relative to the signal strength [26]. The fRMSE (Equation (4)) normalizes the unscaled error standard deviation, removes the dependency of the error patterns on the spatial sensitivity pattern of the scaling reference, and allows for a more meaningful inter-comparison of datasets [26,27]. The fRMSE ranges between 0 and 1, representing perfect estimates and no signal of the truth, respectively. Values greater than 1/ (~0.7) suggest that the error variance surpasses the signal variance [26], highlighting reduced reliability of the dataset.
2.3.2. Least-Squares Merging
The objective of the TC-based merging framework is to minimize the error variance of the merged product. To acquire the least-squares solution, all datasets should be related to the truth with the same coefficient, and reference data is needed [34]. The merged estimate is calculated as
where , , and are the rescaled datasets, and , , are the corresponding weights. These weights can be solved and represented as:
where , , are the rescaled error variances for each dataset, and they can be derived by multiplying rescaling parameters ( and ) to the unscaled error variances from Equation (3). The conversion equations in the form of error standard deviation are shown in Equation (7).
After obtaining the weights, the merged estimate can be calculated based on Equation (5). The error standard deviation of the merged estimate can also be calculated as:
2.3.3. Evaluation Metrics
The accuracy of the investigated gridded precipitation products from CRA40, IMERG, SM2RAIN, and the TC-based merged data was evaluated against ground-based rain gauge measurements. Potential uncertainty arising from the scale mismatch between gridded estimates and the point-scale measurements was acknowledged in the evaluation process. Three commonly used statistical metrics, including Pearson’s correlation coefficient (R), bias, and unbiased root-mean-squared error (ubRMSE), were employed in the study. R measures the linear relationship between the estimated and observed precipitation, with a value close to 1 indicating a strong positive linear correlation. Bias quantifies the systematic difference between estimated and observed precipitation at each station location. A positive bias indicates overestimation, while a negative bias indicates underestimation. ubRMSE measures the magnitude of random errors after removing the systematic bias, with larger values suggesting greater random error in the gridded precipitation estimates.
3. Results
3.1. Error Uncertainty Analysis
The cross-correlations among IMERG, CRA40, and SM2RAIN were first evaluated to assess the mutual linear relationship assumed in the TC method [34,36]. Figure 2 shows a strong correlation between IMERG and CRA40 across the study domain, particularly in the lower eastern reaches. SM2RAIN shows relatively higher correlation with IMERG and CRA40 in the upper reaches, but weaker correlations (R < 0.4) in the headwater region, along the Hengduan Mountains, and around the lakes. Although weak correlations in these complex terrain areas may reduce the robustness of error standard deviation estimates, the overall strong cross-correlations suggest that the datasets capture the dominant “true” signal across most of the domain, supporting the assumption of a strong mutual linear relationship among examined precipitation estimates.
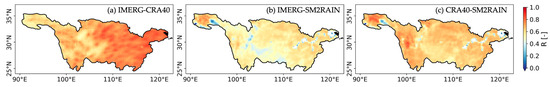
Figure 2.
Cross-correlations of daily precipitation estimates between (a) IMERG and CRA40, (b) IMERG and SM2RAIN, and (c) CRA40 and SM2RAIN. The white areas in (b,c) indicate water bodies where SM2RAIN data are unavailable.
The unscaled error standard deviations for IMERG, CRA40, and SM2RAIN are presented in Figure 3a–c. For all three datasets, the spatial distribution of error standard deviation closely aligns with the spatial pattern of precipitation. Larger error standard deviations occur in the lower reaches (eastern basin), where precipitation amounts are generally higher. CRA40 generally provided the lowest error standard deviation, with values less than 4 mm over 98% of the study domain. IMERG showed relatively larger errors in the southern and eastern regions, while SM2RAIN exhibited exceptionally high error standard deviations in localized areas, particularly along the western margin of the Sichuan Basin, characterized by abrupt elevation changes, and around Poyang Lake. Missing values in the error maps (i.e., the white areas) correspond to the absence of SM2RAIN data over water bodies.
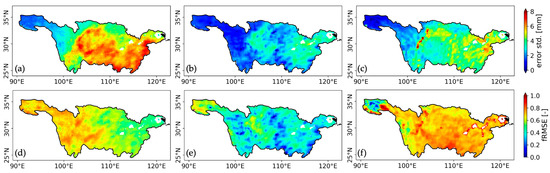
Figure 3.
Error standard deviation of daily precipitation estimates from (a) IMERG, (b) CRA40, and (c) SM2RAIN. The corresponding fractional root-mean-squared error (fRMSE) for IMERG, CRA40, and SM2RAIN is shown in (d–f), respectively.
Because TC-based error standard deviations are inherently influenced by precipitation climatology, direct comparisons among datasets and regions are problematic due to the spatial heterogeneity in precipitation magnitude and variability. The fRMSE removes the dependency of error variance on local climatology via a normalization strategy and facilitates more robust inter-comparisons. The fRMSE maps are shown in Figure 3d–f. In contrast to the spatial pattern of unscaled error standard deviations (Figure 3a–c), both IMERG and CRA40 exhibit larger fRMSE values in the YRB headwaters, despite their smaller absolute errors. This indicates that the estimates are less sensitive to precipitation changes and more affected by random errors in the source region. Thus, the reliability of IMERG and CRA40 in the source region may be less reliable. For SM2RAIN, the spatial distributions of fRMSE and unscaled error standard deviation are broadly consistent, both showing lower values in the source region. More than 57% of the study domain provided fRMSE values greater than 0.7. Particularly high fRMSE values are concentrated along the western margin of the Sichuan Basin and near major lakes, consistent with areas of large error standard deviations, further highlighting the limited reliability of SM2RAIN in these areas.
Using IMERG as the scaling reference, the rescaled error standard deviations and the corresponding weights for each dataset are shown in Figure 4. Although selecting a reference introduces the spatial climatology of the reference dataset into the merged precipitation estimates, the relative weighting among datasets remains unaffected. Results showed that CRA40 received the highest weight across most of the study domain. SM2RAIN was weighted more heavily in the headwaters, where both CRA40 and IMERG exhibited higher fRMSE. Around water bodies, the merged precipitation estimates relied more strongly on IMERG.
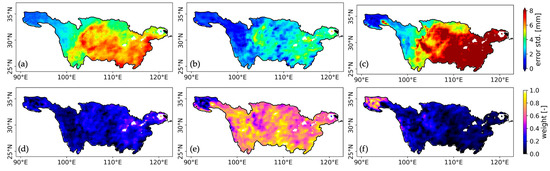
Figure 4.
Rescaled error standard deviation of daily precipitation estimates from (a) IMERG, (b) CRA40, and (c) SM2RAIN, using IMERG as the reference dataset. The corresponding weights assigned to each dataset in the merging procedure are shown in (d–f), respectively.
3.2. Accuracy Analysis of Multi-Source Precipitation Estimates
Figure 5 shows the average daily precipitation from 2007 to 2022 for all gridded datasets compared with rain gauge measurements. All datasets displayed increased average precipitation from the west to the east. IMERG and CRA40 reproduced spatial patterns more consistent with rain gauge measurements than SM2RAIN, which exhibited prominent elongated zones of high values in the Hengduan Mountains. SM2RAIN also revealed a series of northeast-southwest-oriented stripes with high values in the middle and lower reaches (Figure 5c). The merged precipitation estimates (Figure 5d) effectively captured the spatial distribution of average precipitation in the YRB. In terms of amplitude, the merged data aligned more closely with SM2RAIN in the headwater region and with IMERG in the lower reaches.
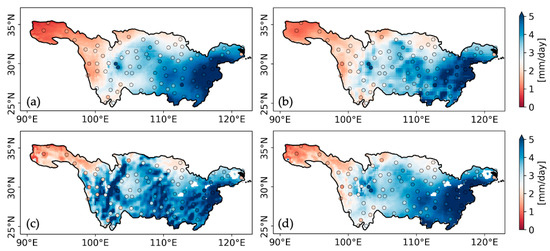
Figure 5.
Average daily precipitation from 2007 to 2022 derived from (a) IMERG, (b) CRA40, (c) SM2RAIN, and (d) the TC-based merged estimates. Colored dots represent gauge-based averages.
The gridded precipitation datasets were further evaluated against ground-based measurements. Figure 6 illustrates the spatial distribution of R, bias, and ubRMSE. CRA40 demonstrated high consistency with ground measurements, yielding high R values and low bias at most station locations, except in the Sichuan Basin. IMERG and SM2RAIN performed less well, with lower R and larger bias and ubRMSE. IMERG generally achieved higher R values but exhibited notable positive bias and elevated ubRMSE in the middle and lower reaches. SM2RAIN displayed no clear spatial pattern in R, but showed large positive biases in the upper and middle reaches. The merged precipitation estimates performed comparably to CRA40, likely due to the dominant weight assigned to CRA40 in the least-squares merging process.
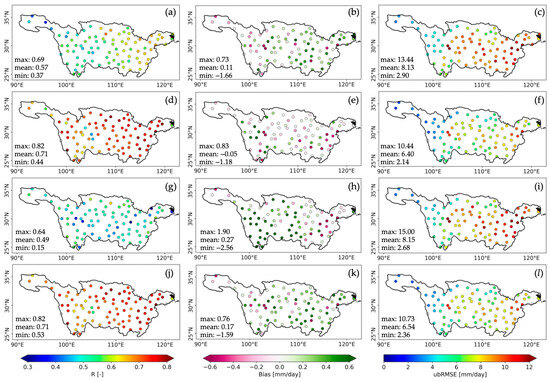
Figure 6.
Spatial distribution of correlation coefficient (R), bias, and ubRMSE for IMERG (a–c), CRA40 (d–f), SM2RAIN (g–i), and the merged estimates (j–l) when evaluated against rain gauge measurements.
Figure 7 summarizes dataset performance using violin plots. CRA40 and the merged data provided the highest station-average R values of approximately 0.71. However, the merged data showed a tighter distribution of R around the median (Figure 7a), indicating greater consistency across stations compared to CRA40. IMERG yielded weaker agreement with rain gauge measurements, with a station-average R value of 0.57. SM2RAIN exhibited the lowest correlation (average R of 0.49) and a pronounced lower tail, indicating poor performance at several stations.
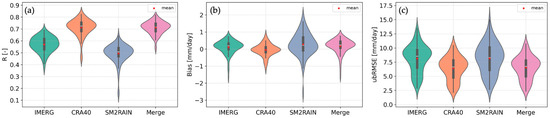
Figure 7.
Violin plots of evaluation metrics (a) R, (b) Bias, and (c) ubRMSE for all gridded precipitation estimates.
Similarly to the correlation analysis, SM2RAIN also displayed a wider spread of bias and ubRMSE than the other datasets, with station-average values of 0.27 mm/day for bias and 8.15 mm/day for ubRMSE. IMERG and CRA40 produced biases closer to zero, with station-average values of 0.11 mm/day and −0.05 mm/day, respectively. The merged data slightly overestimate precipitation at most stations but largely underestimate precipitation at a few stations, leading to a relatively large mean bias of 0.17 mm/day. The violin plots of ubRMSE suggest a weakly bimodal distribution for all datasets, with a dominant central peak and a smaller, less pronounced secondary peak. CRA40 and the merged precipitation estimates showed lower ubRMSE among all examined datasets, with station-averaged values of 6.40 mm/day and 6.54 mm/day, respectively.
3.3. Precipitation Intensity Analysis
Daily precipitation was classified into five intensity levels: no precipitation (<1 mm/day), light (1–10 mm/day), moderate (10–25 mm/day), heavy (25–50 mm/day), and extreme (>50 mm/day) precipitation [48,49]. The performance of gridded precipitation estimates across these categories was then evaluated. Figure 8a shows the distribution of daily precipitation intensity for each dataset. All products tended to underestimate the frequency of no precipitation (<1 mm/day) and extreme precipitation (>50 mm/day) events, while overestimating the occurrence of light to moderate precipitation (1~25 mm/day). Among them, SM2RAIN exhibited the most pronounced deviation from ground-based measurements, with the frequency of no precipitation and light precipitation events less than 40% and exceeding 50%, respectively. The probability distribution of IMERG is more consistent with gauge measurements relative to CRA40, whereas the merged estimates closely resembled CRA40.
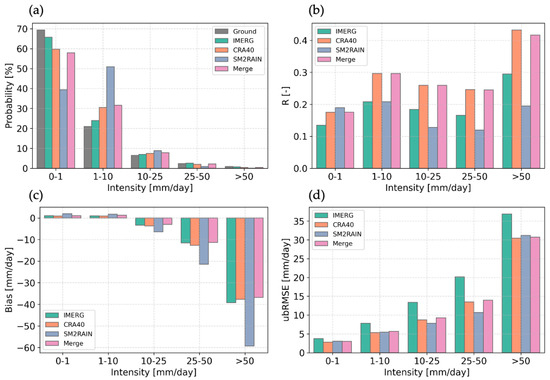
Figure 8.
(a) Distribution of daily precipitation intensity for each dataset. Panels (b–d) show station-averaged evaluation metrics across different intensity intervals: (b) R, (c) bias, and (d) ubRMSE.
Figure 8b–d present the accuracy metrics of the gridded precipitation datasets across different intensity levels. CRA40 and the merged estimates generally achieved the highest R across all intensity intervals. IMERG showed the weakest correlation with ground-based measurements for light precipitation (<10 mm/day), while SM2RAIN performed poorly for moderate to extreme events. Regarding the bias of precipitation estimates, all datasets slightly overestimated no-rain or light precipitation but underestimated moderate to extreme precipitation. The merged precipitation estimates yielded the lowest overall bias across all intensity levels. For ubRMSE, all datasets showed increasing values with precipitation intensity. IMERG consistently produced higher ubRMSE than others, which can be explained by the higher variability in the IMERG data. The performance of CRA40 and the merged data were similar, with the ubRMSE from the merged estimates slightly larger than CRA40.
Figure 9 illustrates the spatial distribution of the average annual maximum daily precipitation from 2007 to 2022. IMERG provided the most accurate representation of extreme precipitation. Maximum daily precipitation over 150 mm/day was detected in the Sichuan Basin and the Poyang Lake regions. CRA40 reproduced the spatial pattern of maximum precipitation with larger values in the east, but it systematically underestimated the maximum values. The merged estimates again resembled CRA40. SM2RAIN showed the poorest capability in capturing extreme precipitation, with the annual maxima below 50 mm/day across most of the domain.
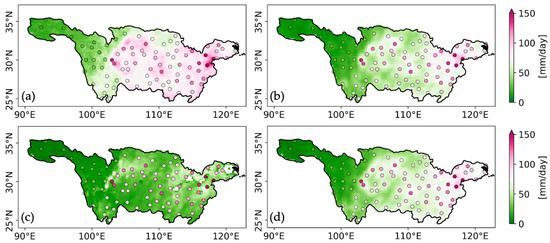
Figure 9.
Average annual maximum daily precipitation from 2007 to 2022 derived from (a) IMERG, (b) CRA40, (c) SM2RAIN, and (d) the TC-based merged estimates.
4. Discussion
4.1. Error Metrics Interpretation
The study examined the spatial distribution of unscaled error standard deviation (Figure 3a–c), rescaled error standard deviation (Figure 4a–c), and the normalized metric fRMSE (Figure 3d–f). Correct interpretation of these three error forms is essential for understanding product performance, yet previous studies have seldom explicitly summarized their differences or respective applications.
The unscaled error standard deviation is affected by the scale and offset of each dataset, and is therefore not comparable across datasets due to differences in units, dynamic ranges, or calibration. However, within a single dataset, the unscaled error standard deviation can highlight spatial patterns of high absolute errors, which may arise from either inherent data uncertainty (e.g., sensor noise or model error) or strong signal variability.
In contrast, the rescaled error standard deviation is expressed in the scaling reference space, enabling inter-comparison across datasets over the same region. The rescaling process preserves the relative error ranking of errors, but it inherits the climatology of the scaling reference data, limiting its utility for spatial comparison within a single dataset. The unscaled and rescaled errors can be converted using a priori or posterior scaling parameters (Equation (7); Gruber et al. [27]).
Finally, fRMSE is a dimensionless, scale-independent metric computed by normalizing the unscaled error standard deviation by signal variability. fRMSE is self-contained and allows more flexibility and consistent comparison of relative errors across space and products [26]. These distinctions help explain the different spatial patterns observed for unscaled, rescaled, and normalized error standard deviations in the study.
4.2. Comparison of Precipitation Datasets
The cross-correlation and error standard deviation analysis revealed that SM2RAIN had weaker correlations with the IMERG and CRA40, resulting in larger fRMSE values. The evaluation of gridded precipitation estimates against ground-based measurements also suggested the inferior accuracy of SM2RAIN among all examined datasets. The limited performance of SM2RAIN may be attributed to its retrieval algorithm, which infers liquid precipitation indirectly from satellite-derived soil moisture dynamics. The algorithm assumes surface soil moisture changes are primarily rainfall-driven, and it is highly sensitive to other hydrological processes such as. Evaporation and runoff [42]. Consequently, SM2RAIN estimates are less reliable in regions with dense vegetation cover or complex terrain [50,51], as is the case in the YRB.
The limitations of the SM2RAIN algorithm are also reflected in the striping artifacts in its average precipitation estimates (Figure 5c). The upper YRB has a complex topography, recognized for high mountains, deep valleys, and strong elevation gradients. The middle and lower YRB are characterized by meandering river networks, relatively dense vegetation cover, and areas with intensive anthropogenic activities (e.g., irrigation and land management). These factors complicate the relationship between rainfall and surface soil moisture dynamics, further hindering the applicability of SM2RAIN in the YRB.
Although CRA40 outperformed IMERG in overall accuracy and showed lower uncertainty, it showed reduced capability in capturing extreme precipitation events, consistent with previous findings [41]. This limitation may be attributed to constraints in the data assimilation system and discrepancies between the native resolution of CRA40 and point-scale measurements. To achieve spatial consistency among the three datasets for TC analysis, CRA40 data were linearly interpolated from 0.25 to 0.1, a common practice in previous studies [20,52,53]. While this interpolation does not introduce new information, it may induce spatial smoothing and block-like error structures, potentially biasing the TC-derived random error standard deviation, particularly in regions with complex terrain. Quantitative evaluation of the effect of such spatial interpolation on TC-derived error estimates warrants further investigation in future work.
IMERG tends to overestimate precipitation in the middle to lower reaches while underestimating precipitation in the upper reaches with higher elevation (Figure 6b). The underestimation of precipitation in high-elevation regions is coincident with findings in Aksu et al. [54]. Nevertheless, IMERG achieved the highest accuracy in detecting extreme events, which may be credited to its finer native spatiotemporal resolution (10 km and half-hourly), as well as improvements introduced in Version 07, including enhanced retrieval algorithms and the incorporation of ground-based calibration during post-processing.
Regarding TC-based merged data, it showed notable reductions in error standard deviation and fRMSE (Figure 10) compared with the input products (Figure 3d–f and Figure 4a–c), thereby improving the accuracy and robustness of precipitation forcing for hydrological simulations. Although the merged data closely resembled CRA40 due to CRA40’s dominant weight in most of the study domain, it provided narrower error spreads and more consistent agreement with rain gauges. It should also be noted that the TC-based merging framework assumes a constant error standard deviation for each dataset, leading to fixed weights during the merging process. This assumption of temporal stationarity may not hold in practice [55,56]. Future efforts incorporating time-varying error variance may further improve daily precipitation estimates and enhance hydrological modeling fidelity across the YRB.
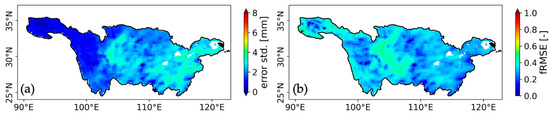
Figure 10.
(a) Scaled error standard deviation of the merged daily precipitation estimates using IMERG as the scaling reference; (b) fRMSE of the merged daily precipitation estimates.
5. Conclusions
Accurate and reliable precipitation estimates at high spatiotemporal resolution are crucial for hydrological modeling and disaster mitigation in the YRB. The study evaluated precipitation estimates from IMERG, CRA40, and SM2RAIN using the TC method. A normalized metric, fRMSE, was employed to facilitate inter-comparison of error uncertainty across datasets and the study domain. Both IMERG and CRA40 showed large fRMSE values in the Yangtze River source region, suggesting a higher noise-to-signal ratio in this area. SM2RAIN generally yielded the highest fRMSE across the study domain, indicating that it is less sensitive to precipitation changes and more affected by random errors.
A least-squares merging approach was then used to integrate the three datasets and generate high-accuracy daily precipitation estimates. The merged precipitation estimates reduced error standard deviation and showed greater consistency with rain gauge measurements. Among individual datasets, SM2RAIN demonstrated the lowest accuracy and displayed unnatural stripes, particularly in regions with steep elevation gradients and near river bodies. IMERG performed best in detecting heavy and extreme precipitation events, although it also yielded relatively high random errors. CRA40 and the merged dataset both showed overall higher accuracy, with the merged estimates outperforming CRA40 in terms of consistency. The evaluation metric values (e.g., R and ubRMSE) derived from the merged precipitation estimates were more tightly distributed than those from CRA40, indicating more robust performance. Additionally, the merged data better represented the probability of extreme precipitation (>50 mm/day) than CRA40.
Despite these advances, limitations are still evident. Gauge-based validation is affected by the spatial scale mismatch between point-scale measurements and gridded estimates, particularly during localized heavy rainfall events. Although various strategies have been applied to address this mismatch, their implications are not yet well understood. Future efforts on quantifying and mitigating the effects of scale mismatch through the scale-aware validation frameworks may enable more accurate, application-specific assessment of precipitation products. Moreover, the study does not account for the time-varying characteristics of the error standard deviation of different products. More exploration on incorporating time-variant error characterization methods to improve the merged precipitation estimates is needed in the future.
Author Contributions
Conceptualization, J.W., Z.S. and G.Y.; methodology, J.W. and X.Y.; software, J.W. and X.F.; validation, J.W., X.F. and X.Y.; resources, G.Y.; data curation, J.W. and X.Y.; writing—original draft preparation, J.W. and X.F.; writing—review and editing, Z.S. and G.Y.; visualization, J.W. and X.Y.; funding acquisition, G.Y. All authors have read and agreed to the published version of the manuscript.
Funding
This research was funded by the National Natural Science Foundation of China, grant number 42301436.
Data Availability Statement
The IMERG data was archived by GES DISC, and can be accessed from https://gpm.nasa.gov/data/directory (accessed on 9 June 2025). The CRA40 data is stored at the China Meteorological Data Service Center, and data can be accessed from https://data.cma.cn/en/?r=data/detail&dataCode=NAFP_CRA40_FTM_6HOR&keywords=month (accessed on 9 June 2025). The SM2RAIN-ASCAT data can be downloaded from https://zenodo.org/records/10376109 (accessed on 9 June 2025). The merged TC-based precipitation can be acquired by request.
Conflicts of Interest
The authors declare no conflicts of interest.
References
- Li, P.; Yu, Z.; Jiang, P.; Wu, C. Spatiotemporal Characteristics of Regional Extreme Precipitation in Yangtze River Basin. J. Hydrol. 2021, 603, 126910. [Google Scholar] [CrossRef]
- Hai, J. Report on the Green Development Index of the Yangtze River Economic Belt (2022–2023). In Annual Report on the Development of Yangtze River Economic Belt (2022–2023); Social Sciences academic Press: Beijing, China, 2024; pp. 70–100. [Google Scholar]
- Yang, P.; Xia, J.; Luo, X.; Meng, L.; Zhang, S.; Cai, W.; Wang, W. Impacts of Climate Change-Related Flood Events in the Yangtze River Basin Based on Multi-Source Data. Atmos. Res. 2021, 263, 105819. [Google Scholar] [CrossRef]
- Wu, X.; Wang, L.; Niu, Z.; Jiang, W.; Cao, Q. More Extreme Precipitation over the Yangtze River Basin, China: Insights from Historical and Projected Perspectives. Atmos. Res. 2023, 292, 106883. [Google Scholar] [CrossRef]
- Wei, K.; Ouyang, C.; Duan, H.; Li, Y.; Chen, M.; Ma, J.; An, H.; Zhou, S. Reflections on the Catastrophic 2020 Yangtze River Basin Flooding in Southern China. Innov. 2020, 1, 100038. [Google Scholar] [CrossRef]
- Tang, S.; Luo, J.-J.; He, J.; Wu, J.; Zhou, Y.; Ying, W. Toward Understanding the Extreme Floods over Yangtze River Valley in June–July 2020: Role of Tropical Oceans. Adv. Atmos. Sci. 2021, 38, 2023–2039. [Google Scholar] [CrossRef]
- Ma, M.; Qu, Y.; Lyu, J.; Zhang, X.; Su, Z.; Gao, H.; Yang, X.; Chen, X.; Jiang, T.; Zhang, J.; et al. The 2022 Extreme Drought in the Yangtze River Basin: Characteristics, Causes and Response Strategies. River 2022, 1, 162–171. [Google Scholar] [CrossRef]
- Liu, Y.; Yuan, S.; Zhu, Y.; Ren, L.; Chen, R.; Zhu, X.; Xia, R. The Patterns, Magnitude, and Drivers of Unprecedented 2022 Mega-Drought in the Yangtze River Basin, China. Environ. Res. Lett. 2023, 18, 114006. [Google Scholar] [CrossRef]
- Li, X.; Zhang, K.; Gu, P.; Feng, H.; Yin, Y.; Chen, W.; Cheng, B. Changes in Precipitation Extremes in the Yangtze River Basin during 1960–2019 and the Association with Global Warming, ENSO, and Local Effects. Sci. Total Environ. 2021, 760, 144244. [Google Scholar] [CrossRef]
- Yuan, Z.; Yin, J.; Wei, M.; Yuan, Y. Spatio-Temporal Variations in the Temperature and Precipitation Extremes in Yangtze River Basin, China during 1961–2020. Atmosphere 2021, 12, 1423. [Google Scholar] [CrossRef]
- Guan, Y.; Zheng, F.; Zhang, X.; Wang, B. Trends and Variability of Daily Precipitation and Extremes during 1960–2012 in the Yangtze River Basin, China. Int. J. Climatol. 2017, 37, 1282–1298. [Google Scholar] [CrossRef]
- Hu, M.; Dong, M.; Tian, X.; Wang, L.; Jiang, Y. Trends in Different Grades of Precipitation over the Yangtze River Basin from 1960 to 2017. Atmosphere 2021, 12, 413. [Google Scholar] [CrossRef]
- Wang, Y.; Xu, Y.; Lei, C.; Li, G.; Han, L.; Song, S.; Yang, L.; Deng, X. Spatio-Temporal Characteristics of Precipitation and Dryness/Wetness in Yangtze River Delta, Eastern China, during 1960–2012. Atmos. Res. 2016, 172–173, 196–205. [Google Scholar] [CrossRef]
- Wu, S.; Hu, Z.; Wang, Z.; Cao, S.; Yang, Y.; Qu, X.; Zhao, W. Spatiotemporal Variations in Extreme Precipitation on the Middle and Lower Reaches of the Yangtze River Basin (1970–2018). Quat. Int. 2021, 592, 80–96. [Google Scholar] [CrossRef]
- Wu, Y.; Zhang, Z.; Huang, Y.; Jin, Q.; Chen, X.; Chang, J. Evaluation of the GPM IMERG v5 and TRMM 3B42 v7 Precipitation Products in the Yangtze River Basin, China. Water 2019, 11, 1459. [Google Scholar] [CrossRef]
- Xiao, S.; Xia, J.; Zou, L. Evaluation of Multi-Satellite Precipitation Products and Their Ability in Capturing the Characteristics of Extreme Climate Events over the Yangtze River Basin, China. Water 2020, 12, 1179. [Google Scholar] [CrossRef]
- Wang, W.; Lin, H.; Chen, N.; Chen, Z. Evaluation of Multi-Source Precipitation Products over the Yangtze River Basin. Atmos. Res. 2021, 249, 105287. [Google Scholar] [CrossRef]
- Koster, R.D.; Liu, Q.; Reichle, R.H.; Huffman, G.J. Improved Estimates of Pentad Precipitation Through the Merging of Independent Precipitation Data Sets. Water Resour. Res. 2021, 57, e2021WR030330. [Google Scholar] [CrossRef]
- Chao, L.; Zhang, K.; Li, Z.; Zhu, Y.; Wang, J.; Yu, Z. Geographically Weighted Regression Based Methods for Merging Satellite and Gauge Precipitation. J. Hydrol. 2018, 558, 275–289. [Google Scholar] [CrossRef]
- Lyu, F.; Tang, G.; Behrangi, A.; Wang, T.; Tan, X.; Ma, Z.; Xiong, W. Precipitation Merging Based on the Triple Collocation Method Across Mainland China. IEEE Trans. Geosci. Remote Sens. 2021, 59, 3161–3176. [Google Scholar] [CrossRef]
- Wei, L.; Jiang, S.; Dong, J.; Ren, L.; Yong, B.; Yang, B.; Li, X.; Duan, Z. A Combined Extended Triple Collocation and Cumulative Distribution Function Merging Framework for Improved Daily Precipitation Estimates over Mainland China. J. Hydrol. 2024, 641, 131757. [Google Scholar] [CrossRef]
- Bai, X.; Wang, P.; He, Y.; Zhang, Z.; Wu, X. Assessing the Accuracy and Drought Utility of Long-Term Satellite-Based Precipitation Estimation Products Using the Triple Collocation Approach. J. Hydrol. 2021, 603, 127098. [Google Scholar] [CrossRef]
- Chen, C.; He, M.; Chen, Q.; Zhang, J.; Li, Z.; Wang, Z.; Duan, Z. Triple Collocation-Based Error Estimation and Data Fusion of Global Gridded Precipitation Products over the Yangtze River Basin. J. Hydrol. 2022, 605, 127307. [Google Scholar] [CrossRef]
- Stoffelen, A. Toward the True Near-surface Wind Speed: Error Modeling and Calibration Using Triple Collocation. J. Geophys. Res. 1998, 103, 7755–7766. [Google Scholar] [CrossRef]
- Crow, W.T.; Lei, F.; Hain, C.; Anderson, M.C.; Scott, R.L.; Billesbach, D.; Arkebauer, T. Robust Estimates of Soil Moisture and Latent Heat Flux Coupling Strength Obtained from Triple Collocation: Estimation of Land Coupling Strength. Geophys. Res. Lett. 2015, 42, 8415–8423. [Google Scholar] [CrossRef]
- Draper, C.; Reichle, R.; De Jeu, R.; Naeimi, V.; Parinussa, R.; Wagner, W. Estimating Root Mean Square Errors in Remotely Sensed Soil Moisture over Continental Scale Domains. Remote Sens. Environ. 2013, 137, 288–298. [Google Scholar] [CrossRef]
- Gruber, A.; Su, C.-H.; Zwieback, S.; Crow, W.; Dorigo, W.; Wagner, W. Recent Advances in (Soil Moisture) Triple Collocation Analysis. Int. J. Appl. Earth Obs. Geoinf. 2016, 45, 200–211. [Google Scholar] [CrossRef]
- Miralles, D.G.; Crow, W.T.; Cosh, M.H. Estimating Spatial Sampling Errors in Coarse-Scale Soil Moisture Estimates Derived from Point-Scale Observations. J. Hydrometeorol. 2010, 11, 1423–1429. [Google Scholar] [CrossRef]
- Li, C.; Yang, H.; Yang, W.; Liu, Z.; Jia, Y.; Li, S.; Yang, D. Error Characterization of Global Land Evapotranspiration Products: Collocation-Based Approach. J. Hydrol. 2022, 612, 128102. [Google Scholar] [CrossRef]
- Khan, M.S.; Liaqat, U.W.; Baik, J.; Choi, M. Stand-Alone Uncertainty Characterization of GLEAM, GLDAS and MOD16 Evapotranspiration Products Using an Extended Triple Collocation Approach. Agric. For. Meteorol. 2018, 252, 256–268. [Google Scholar] [CrossRef]
- Yin, G.; Park, J. The Use of Triple Collocation Approach to Merge Satellite- and Model-Based Terrestrial Water Storage for Flood Potential Analysis. J. Hydrol. 2021, 603, 127197. [Google Scholar] [CrossRef]
- Yoon, Y.; Kumar, S.V.; Forman, B.A.; Zaitchik, B.F.; Kwon, Y.; Qian, Y.; Rupper, S.; Maggioni, V.; Houser, P.; Kirschbaum, D.; et al. Evaluating the Uncertainty of Terrestrial Water Budget Components Over High Mountain Asia. Front. Earth Sci. 2019, 7, 120. [Google Scholar] [CrossRef]
- Hasan, E.; Tarhule, A. Comparison of Decadal Water Storage Trends from Common GRACE Releases (RL05, RL06) Using Spatial Diagnostics and a Modified Triple Collocation Approach. J. Hydrol. X 2021, 13, 100108. [Google Scholar] [CrossRef]
- Yilmaz, M.T.; Crow, W.T.; Anderson, M.C.; Hain, C. An Objective Methodology for Merging Satellite- and Model-based Soil Moisture Products. Water Resour. Res. 2012, 48, 2011WR011682. [Google Scholar] [CrossRef]
- Zhang, Y.; Sun, A.; Sun, H.; Gui, D.; Xue, J.; Liao, W.; Yan, D.; Zhao, N.; Zeng, X. Error Adjustment of TMPA Satellite Precipitation Estimates and Assessment of Their Hydrological Utility in the Middle and Upper Yangtze River Basin, China. Atmos. Res. 2019, 216, 52–64. [Google Scholar] [CrossRef]
- Yin, G.; Zhang, Y.; Cao, Y.; Park, J. Improving Daily Precipitation Estimates by Merging Satellite and Reanalysis Data in Northeast China. Remote Sens. 2024, 16, 4703. [Google Scholar] [CrossRef]
- Li, J.; Tian, Q.; Shen, Z.; Xu, Y.; Yan, Z.; Li, M.; Zhu, C.; Xue, J.; Lin, Z.; Yang, Y.; et al. Fidelity of Global Tropical Cyclone Activity in a New Reanalysis Dataset (CRA40). Meteorol. Appl. 2024, 31, e70009. [Google Scholar] [CrossRef]
- Liu, Z.; Jiang, L.; Shi, C.; Zhang, T.; Zhou, Z.; Liao, J.; Yao, S.; Liu, J.; Wang, M.; Wang, H.; et al. CRA-40/Atmosphere—The First-Generation Chinese Atmospheric Reanalysis (1979–2018): System Description and Performance Evaluation. J. Meteorol. Res. 2023, 37, 1–19. [Google Scholar] [CrossRef]
- Yang, J.; Huang, M.; Zhai, P. Performance of the CRA-40/Land, CMFD, and ERA-Interim Datasets in Reflecting Changes in Surface Air Temperature over the Tibetan Plateau. J. Meteorol. Res. 2021, 35, 663–672. [Google Scholar] [CrossRef]
- Li, C.; Zhao, T.; Shi, C.; Liu, Z. Assessment of Precipitation from the CRA40 Dataset and New Generation Reanalysis Datasets in the Global Domain. Int. J. Climatol. 2021, 41, 5243–5263. [Google Scholar] [CrossRef]
- Zhou, Z.; Chen, S.; Li, Z.; Luo, Y. An Evaluation of CRA40 and ERA5 Precipitation Products over China. Remote Sens. 2023, 15, 5300. [Google Scholar] [CrossRef]
- Brocca, L.; Filippucci, P.; Hahn, S.; Ciabatta, L.; Massari, C.; Camici, S.; Schüller, L.; Bojkov, B.; Wagner, W. SM2RAIN–ASCAT (2007–2018): Global Daily Satellite Rainfall Data from ASCAT Soil Moisture Observations. Earth Syst. Sci. Data 2019, 11, 1583–1601. [Google Scholar] [CrossRef]
- Ebrahimi, S.; Chen, C.; Chen, Q.; Zhang, Y.; Ma, N.; Zaman, Q. Effects of Temporal Scales and Space Mismatches on the TRMM 3B42 v7 Precipitation Product in a Remote Mountainous Area. Hydrol. Process. 2017, 31, 4315–4327. [Google Scholar] [CrossRef]
- Li, J.; Gan, T.Y.; Chen, Y.D.; Gu, X.; Hu, Z.; Zhou, Q.; Lai, Y. Tackling Resolution Mismatch of Precipitation Extremes from Gridded GCMs and Site-Scale Observations: Implication to Assessment and Future Projection. Atmos. Res. 2020, 239, 104908. [Google Scholar] [CrossRef]
- Katiraie-Boroujerdy, P.-S.; Nasrollahi, N.; Hsu, K.; Sorooshian, S. Evaluation of Satellite-Based Precipitation Estimation over Iran. J. Arid. Environ. 2013, 97, 205–219. [Google Scholar] [CrossRef]
- Chen, H.; Yong, B.; Qi, W.; Wu, H.; Ren, L.; Hong, Y. Investigating the Evaluation Uncertainty for Satellite Precipitation Estimates Based on Two Different Ground Precipitation Observation Products. J. Hydrometeorol. 2020, 21, 2595–2606. [Google Scholar] [CrossRef]
- Lei, H.; Zhao, H.; Ao, T. Ground Validation and Error Decomposition for Six State-of-the-Art Satellite Precipitation Products over Mainland China. Atmos. Res. 2022, 269, 106017. [Google Scholar] [CrossRef]
- Mahmoud, M.T.; Mohammed, S.A.; Hamouda, M.A.; Mohamed, M.M. Impact of Topography and Rainfall Intensity on the Accuracy of IMERG Precipitation Estimates in an Arid Region. Remote Sens. 2020, 13, 13. [Google Scholar] [CrossRef]
- GB/T 28592-2012; General Administration of Quality Supervision, Inspection and Quarantine of the People’s Republic of China (AQSIQ) & Standardization Administration of China (SAC). Grade of Precipitation: Beijing, China, 2012.
- Brocca, L.; Ciabatta, L.; Massari, C.; Moramarco, T.; Hahn, S.; Hasenauer, S.; Kidd, R.; Dorigo, W.; Wagner, W.; Levizzani, V. Soil as a Natural Rain Gauge: Estimating Global Rainfall from Satellite Soil Moisture Data. JGR Atmos. 2014, 119, 5128–5141. [Google Scholar] [CrossRef]
- Filippucci, P.; Brocca, L.; Massari, C.; Saltalippi, C.; Wagner, W.; Tarpanelli, A. Toward a Self-Calibrated and Independent SM2RAIN Rainfall Product. J. Hydrol. 2021, 603, 126837. [Google Scholar] [CrossRef]
- Park, J.; Baik, J.; Choi, M. Triple Collocation-Based Multi-Source Evaporation and Transpiration Merging. Agric. For. Meteorol. 2023, 331, 109353. [Google Scholar] [CrossRef]
- Lu, X.; Tang, G.; Liu, X.; Wang, X.; Liu, Y.; Wei, M. The Potential and Uncertainty of Triple Collocation in Assessing Satellite Precipitation Products in Central Asia. Atmos. Res. 2021, 252, 105452. [Google Scholar] [CrossRef]
- Aksu, H.; Yaldiz, S.G. Performance Comparison of GPM IMERG V07 with Its Predecessor V06 and Its Application in Extreme Precipitation Clustering over Türkiye. Atmos. Res. 2025, 315, 107840. [Google Scholar] [CrossRef]
- Alcantara, A.L.; Ahn, K.-H. Time-Varying Quadruple Collocation for Enhanced Satellite and Reanalysis Precipitation Data Error Estimation and Integration. Int. J. Appl. Earth Obs. Geoinf. 2024, 127, 103692. [Google Scholar] [CrossRef]
- Cecinati, F.; Rico-Ramirez, M.A.; Heuvelink, G.B.M.; Han, D. Representing Radar Rainfall Uncertainty with Ensembles Based on a Time-Variant Geostatistical Error Modelling Approach. J. Hydrol. 2017, 548, 391–405. [Google Scholar] [CrossRef]
Disclaimer/Publisher’s Note: The statements, opinions and data contained in all publications are solely those of the individual author(s) and contributor(s) and not of MDPI and/or the editor(s). MDPI and/or the editor(s) disclaim responsibility for any injury to people or property resulting from any ideas, methods, instructions or products referred to in the content. |
© 2025 by the authors. Licensee MDPI, Basel, Switzerland. This article is an open access article distributed under the terms and conditions of the Creative Commons Attribution (CC BY) license (https://creativecommons.org/licenses/by/4.0/).