Article

Forecasting Environmental Drivers and Invasion Risk of Lagocephalus sceleratus (Gmelin, 1789) and Pterois miles (Bennett, 1828) in the Pagasitikos Gulf (Greece)

by
Dimitris Klaoudatos
1,*,
Alexandros Theocharis
1,2,
İlker Aydin
3,
Dimitris Pafras
1,
Kleio Karagianni
1 and
Christos Domenikiotis
1
1
Department of Ichthyology and Aquatic Environment (DIAE), School of Agricultural Sciences, University of Thessaly (UTh), Fytokou Street, 38446 Volos, Greece
2
National Institute of Aquatic Resources, Technical University of Denmark, North Sea Science Park, 9850 Hirtshals, Denmark
3
Department of Fishing Technology, Faculty of Fisheries, Ege University, Bornova-İzmir 35100, Türkiye
*
Author to whom correspondence should be addressed.
Geosciences 2025, 15(9), 361; https://doi.org/10.3390/geosciences15090361
Submission received: 7 June 2025 / Revised: 11 August 2025 / Accepted: 12 September 2025 / Published: 14 September 2025

Abstract

The Eastern Mediterranean Sea has become a hotspot for biological invasions, with thermophilic species like Lagocephalus sceleratus (silver-cheeked toadfish) and Pterois miles (devil firefish) posing significant ecological and socioeconomic threats. Machine learning models (support vector machine and neural network) were developed to predict species establishment, demonstrating high predictive accuracy. SHapley Additive exPlanations analyses further highlighted the relative influence of environmental predictors. Nominal logistic regression identified bottom temperature and salinity as the key environmental drivers for the establishment of these species, with thresholds of 16.38 °C and 39.14 psu for P. miles and 15.84 °C and 39.09 psu for L. sceleratus. Forecasts through 2035, generated using the Prophet model, have predicted warming bottom temperatures but declining salinity levels, creating variable conditions for invasion. Long-term suitability was assessed by comparing forecasted conditions against thresholds, revealing that salinity and chlorophyll a consistently fall below suitable levels for both species. L. sceleratus showed stable suitability with occasional declines, while P. miles exhibited greater variability. These findings underscore the importance of fine-scale benthic data and integrated modeling approaches for early detection and adaptive management of invasive species in Mediterranean ecosystems. The study provides clear thresholds to guide ongoing environmental monitoring and emphasizes the need for continuous assessments to anticipate future invasion risks under changing climatic conditions.

Graphical Abstract

1. Introduction

Invasive species, alongside overfishing and pollution, pose significant threats to global biodiversity [1]. The Mediterranean Sea, a major hotspot for marine bio-invasions, has seen nearly 1000 alien species introduced, predominantly through Lessepsian migration via the Suez Canal [2,3,4]. This influx, particularly of fish species, has accelerated in recent decades, with profound ecological and societal impacts [5,6]. Among these, the silver-cheeked toadfish Lagocephalus sceleratus and the devil firefish Pterois miles are of particular concern due to their significant ecological impacts, with L. sceleratus listed among the top 100 most invasive species and P. miles noted for its well-documented invasive success [7,8,9,10,11].
Globalization, through maritime transport, coastal infrastructure, and tourism, continues to accelerate the introduction of non-indigenous species (NIS) into new marine environments [12,13,14,15]. Concurrently, climate change is expanding the geographic range of thermophilic species by increasing sea temperatures and altering oceanographic conditions [16,17]. In the Mediterranean, these shifts have facilitated the rapid spread of warm-water invaders such as P. miles and L. sceleratus [18,19,20]. Both species are well-established in the eastern basin, where favorable environmental conditions and the lack of evolved defenses in native prey (prey naïveté) have facilitated their spread [21,22,23]. In Rhodes, invasive populations of P. miles exhibit positive allometric growth, while L. sceleratus individuals reach weights exceeding 4.6 kg, significantly larger than many native predators such as groupers (Epinephelus marginatus) [24]. Their large size, combined with generalist diets and competitive dominance, enhances their ecological fitness and may exacerbate disruptions to local food webs by preying on naive native species and outcompeting smaller predators [25,26,27].
The silver-cheeked toadfish is a highly invasive pufferfish species, and it has significantly impacted the Mediterranean Sea since it was first recorded in Gökova Bay, Turkey, in 2003 and subsequently spread to Rhodes, Greece, in 2006 [28,29]. Recognized among the top 100 invasive alien species, L. sceleratus poses severe ecological threats through its tetrodotoxin (TTX), which acts as a novel weapon in Mediterranean ecosystems. Native predators lack evolutionary exposure to TTX, leaving them unable to control L. sceleratus populations, while native prey fail to recognize it as a threat, a phenomenon documented in Mediterranean invasion dynamics [8]. This predatory advantage disrupts trophic cascades, particularly through overconsumption of herbivorous fish and crustaceans [24]. Its rapid expansion across diverse habitats, including sandy, rocky, and seagrass environments in shallow waters (0–50 m), has led to its establishment in the Eastern Mediterranean, including Greece, with recent range extensions to the Black Sea and the Strait of Gibraltar [30,31,32,33]. L. sceleratus disrupts local fish markets by deterring customers due to its TTX content, which poses severe health risks and reduces consumer confidence in seafood safety [34]. Its presence increases labor costs, as fishers must discard toxic bycatch and reinforce fishing gear with steel lines to withstand the species’ damaging bites [35]. Additionally, L. sceleratus preys on commercially valuable cephalopods, such as octopus and squid, reducing their stocks and impacting market supply [36,37].
The devil firefish is a highly invasive Lessepsian fish species that has rapidly expanded across the Mediterranean Sea, posing significant ecological and socioeconomic challenges [10]. First recorded in the Mediterranean off Israel in 1991 and off Rhodes, Greece, on 15 July 2015, its swift proliferation has established large populations, particularly in the eastern basin, due to its early maturation, venomous defenses, and ecological adaptability [21,38,39]. The minimum temperature the species can survive in is 10 °C [7,40,41]. As a generalist carnivore, P. miles consumes a wide range of fish and crustaceans at rates that often exceed prey production, threatening local biodiversity and competing with native species for resources [42,43,44]. In Greek coastal fisheries, its presence disrupts small-scale fishing operations, as it is primarily caught in static nets but has limited commercial value, complicating management efforts [45].
Researchers have increasingly turned to predictive ecological modeling to assess and anticipate the spread of these invaders [27,46]. These models assess niche differences between a species’ native and invaded regions, employing a variety of techniques, such as envelope-based methods [47,48], statistical approaches [49,50], and machine learning algorithms [26,51]. By correlating species presence with environmental variables, these models generate probability distributions that can be projected spatially and temporally to visualize invasion dynamics [52,53]. Studies consistently identify sea surface temperature (SST) as a primary driver of invasive species richness in both global and regional contexts [54]. More specifically, for the devil firefish in the Mediterranean Sea, species distribution models have highlighted thermal variables, particularly SST mean and range, as dominant predictors of invasion risk [26,55]. These models have also demonstrated that the species’ spread is facilitated by elevated minimum winter temperatures and lower salinity thresholds, which align with the environmental conditions found in the Eastern Mediterranean basin. Additionally, Dimitriadis et al. [56] mapped the potential expansion range of the species within the Mediterranean Sea, using the 15.3 °C winter isotherm as a thermal boundary. This temperature threshold is considered a limiting factor for the establishment of P. miles, based on its known thermal tolerance. For L. sceleratus, Coro et al. [27] developed a comprehensive ensemble modeling framework combining 7 machine learning algorithms and 18 environmental predictors, including SST, salinity, depth, and distance from shore, to estimate current and future habitat suitability across the Mediterranean.
Despite growing research on the distribution of marine invasive species, critical gaps remain in pinpointing the specific environmental thresholds driving their establishment and spread. While invasive taxa have been documented across the Aegean Sea, there is still limited understanding of how dynamic environmental variables interact to influence invasion risk. This study aims to forecast key oceanographic parameters in the Pagasitikos Gulf through 2035 and compare them with baseline conditions in areas where L. sceleratus and P. miles were first observed and established in Greece. The objectives of this study are to (i) identify the oceanographic variables that strongly promote or constrain the occurrence of L. sceleratus and P. miles and to define threshold values for these parameters; (ii) apply machine learning algorithms to uncover patterns in species–environment relationships; and (iii) estimate the potential timeline for population establishment in the Pagasitikos Gulf through 2035.

2. Materials and Methods

2.1. Data Acquisition and Study Area

Environmental data was obtained for a marine area south of Rhodes Island (Figure 1) between January 2000 and January 2025, where the two target species (P. miles, L. sceleratus) were initially detected in Hellenic waters (in 2015 and 2005, respectively; Table 1).
Data acquisition involved access to the Copernicus Marine Service (CMEMS), the marine component of the EU’s Copernicus Earth Observation Programme, which delivers free and regular data on ocean conditions-classified into physical (blue), sea ice (white), and biogeochemical (green) domains [57].
Physical data were sourced from the Mediterranean Monitoring and Forecasting Centre (Med MFC) multiyear reanalysis product, based on the NEMO (Nucleus for European Modelling of the Ocean) hydrodynamic model and the OceanVAR (a data assimilation system used within the Med MFC to integrate observational data into the NEMO hydrodynamic model), with a spatial resolution of 1/24° (~4–5 km) (Mediterranean Sea Physics Reanalysis Product) [58,59,60]. These datasets included monthly means of sea water potential temperature (T), bottom temperature (TOB), and salinity (S), with demonstrated consistency with in situ observations and reported biases of 0.3 °C for SST and 0.17 psu for salinity [61].
Complementary biogeochemical data were obtained from the Mediterranean Sea Biogeochemical Reanalysis, produced using the MedBFM 3.2 system (Mediterranean Biogeochemical Flux Model, an integrated modeling framework used for simulating biogeochemical processes in the Mediterranean Sea), which integrates the OGSTM v4.3 transport model (Ocean General Simulation and Transport Model, a physical transport model that simulates the movement of water masses and tracers in the ocean) and the BFM v5.1 biogeochemical flux model (a numerical model that simulates biogeochemical cycles, including carbon, nitrogen, phosphorus, and oxygen dynamics, as well as interactions among plankton, bacteria, and dissolved organic matter), along with the 3DVAR-BIO v3.3 (3D Variational Biogeochemical Data Assimilation, a data assimilation system that integrates observational biogeochemical data into the MedBFM framework) assimilation scheme for surface chlorophyll data [62,63]. These datasets, also at 1/24° horizontal resolution, provided monthly values of key biogeochemical variables, including pH (total scale), dissolved oxygen (O2), nitrate (NO3), phosphate (PO4), and ammonium (NH4), covering the period from January 1999 to the present [64,65]. Satellite-derived chlorophyll a (Chl-a) concentrations, based on merged multi-sensor data (Sea-viewing Wide Field-of-view Sensor (SeaWiFS), Moderate Resolution Imaging Spectroradiometer (MODIS), Medium Resolution Imaging Spectrometer (MERIS), Visible Infrared Imaging Radiometer Suite (VIIRS), and Ocean and Land Color Instrument (OLCI)) with 1 km resolution and monthly temporal resolution were also used from the CNR’s (National Research Council of Italy) Ocean Color products, generated via spectral merging techniques and validated with in situ data from the MedBiOp (Mediterranean Biogeochemical Optical) dataset [66,67,68]. Additionally, satellite-based SST and Chl-a data from the MODIS sensor aboard NASA’s (National Aeronautics and Space Administration) Terra satellite, with 4 km spatial resolution and spanning from February 2000 to the present, were obtained through the Ocean Biology Processing Group (OBPG) at NASA’s Goddard Space Flight Center [69,70]. All spatial processing and statistical analyses were conducted using Quantum GIS (Geographic Information System) (QGIS) version 3.42 [71].

2.2. Statistical Analysis

The data were analyzed using exploratory data analysis and inferential statistics with the statistical program Jamovi (Ver. 2.5.3) [72] (Sydney, Australia) at an alpha level of 0.05. Normality of distribution was assessed using the Shapiro–Wilk normality test. Bartlett and Levene tests were used to assess homoscedasticity. Comparison of environmental parameters among sites (Pagasitikos–Rhodes) was assessed with the use of Student’s t-test and the Mann–Whitney U test [73].
To identify the major environmental factors influencing the establishment of L. sceleratus and P. miles and their relative importance (p < 0.05), a second-degree polynomial stepwise regression was performed using forward selection in JMP (Version 17, SAS Institute Inc., Cary, NC, USA, 1989–2025) [74]. The full model included all recorded environmental variables and their second-degree polynomial terms, as well as possible interactions. Forward selection iteratively added terms to the model, starting from an intercept-only model, until the minimum Bayesian Information Criterion (BIC) was achieved, indicating the best-fit model with optimal balance between explanatory power and parsimony. The minimum model, selected based on the lowest BIC, retained only the significant predictors (p < 0.05) that best explained species establishment.
We assessed the potential for multicollinearity amongst the considered covariates using the variance inflation factor (VIF) [75]. A VIF of 1 indicates no multicollinearity, meaning the predictor is not correlated with others. VIF values between 1 and 5 suggest moderate multicollinearity, which is generally acceptable but may require scrutiny if approaching 5. A VIF of 5 or higher signals high multicollinearity, often considered problematic, while a VIF of 10 or greater indicates severe multicollinearity, typically deemed unacceptable and requiring corrective actions like removing variables or applying techniques, such as principal component analysis [76]. Herein, we removed variables with the highest VIF until all variables exhibited a VIF less than 5.
Pearson correlation coefficient (PCC) was further employed as a measure of the strength of the linear association among different environmental factors [73], calculated as:
r   =   [ n ( x y ) x y ] / [ n ( x 2 ) ( x ) 2 ] [ n ( y 2 ) ( y ) 2 ]
where n is the sample size, Σ is the summation of all values, and x and y represent pairs of environmental variables.
The Sample-size to Feature-size Ratio (SFR) [77] used to assess the sufficiency of the data used to predict the NIS (non-indigenous species) establishment was calculated as:
SFR   =   N u m b e r   o f   S a m p l e s N u m b e r   o f   F e a t u r e s
Using the nominal logistic regression model, threshold values for the two major factors affecting the establishment of L. sceleratus and P. miles were identified at a 50% probability of presence [75].

2.3. Machine Learning

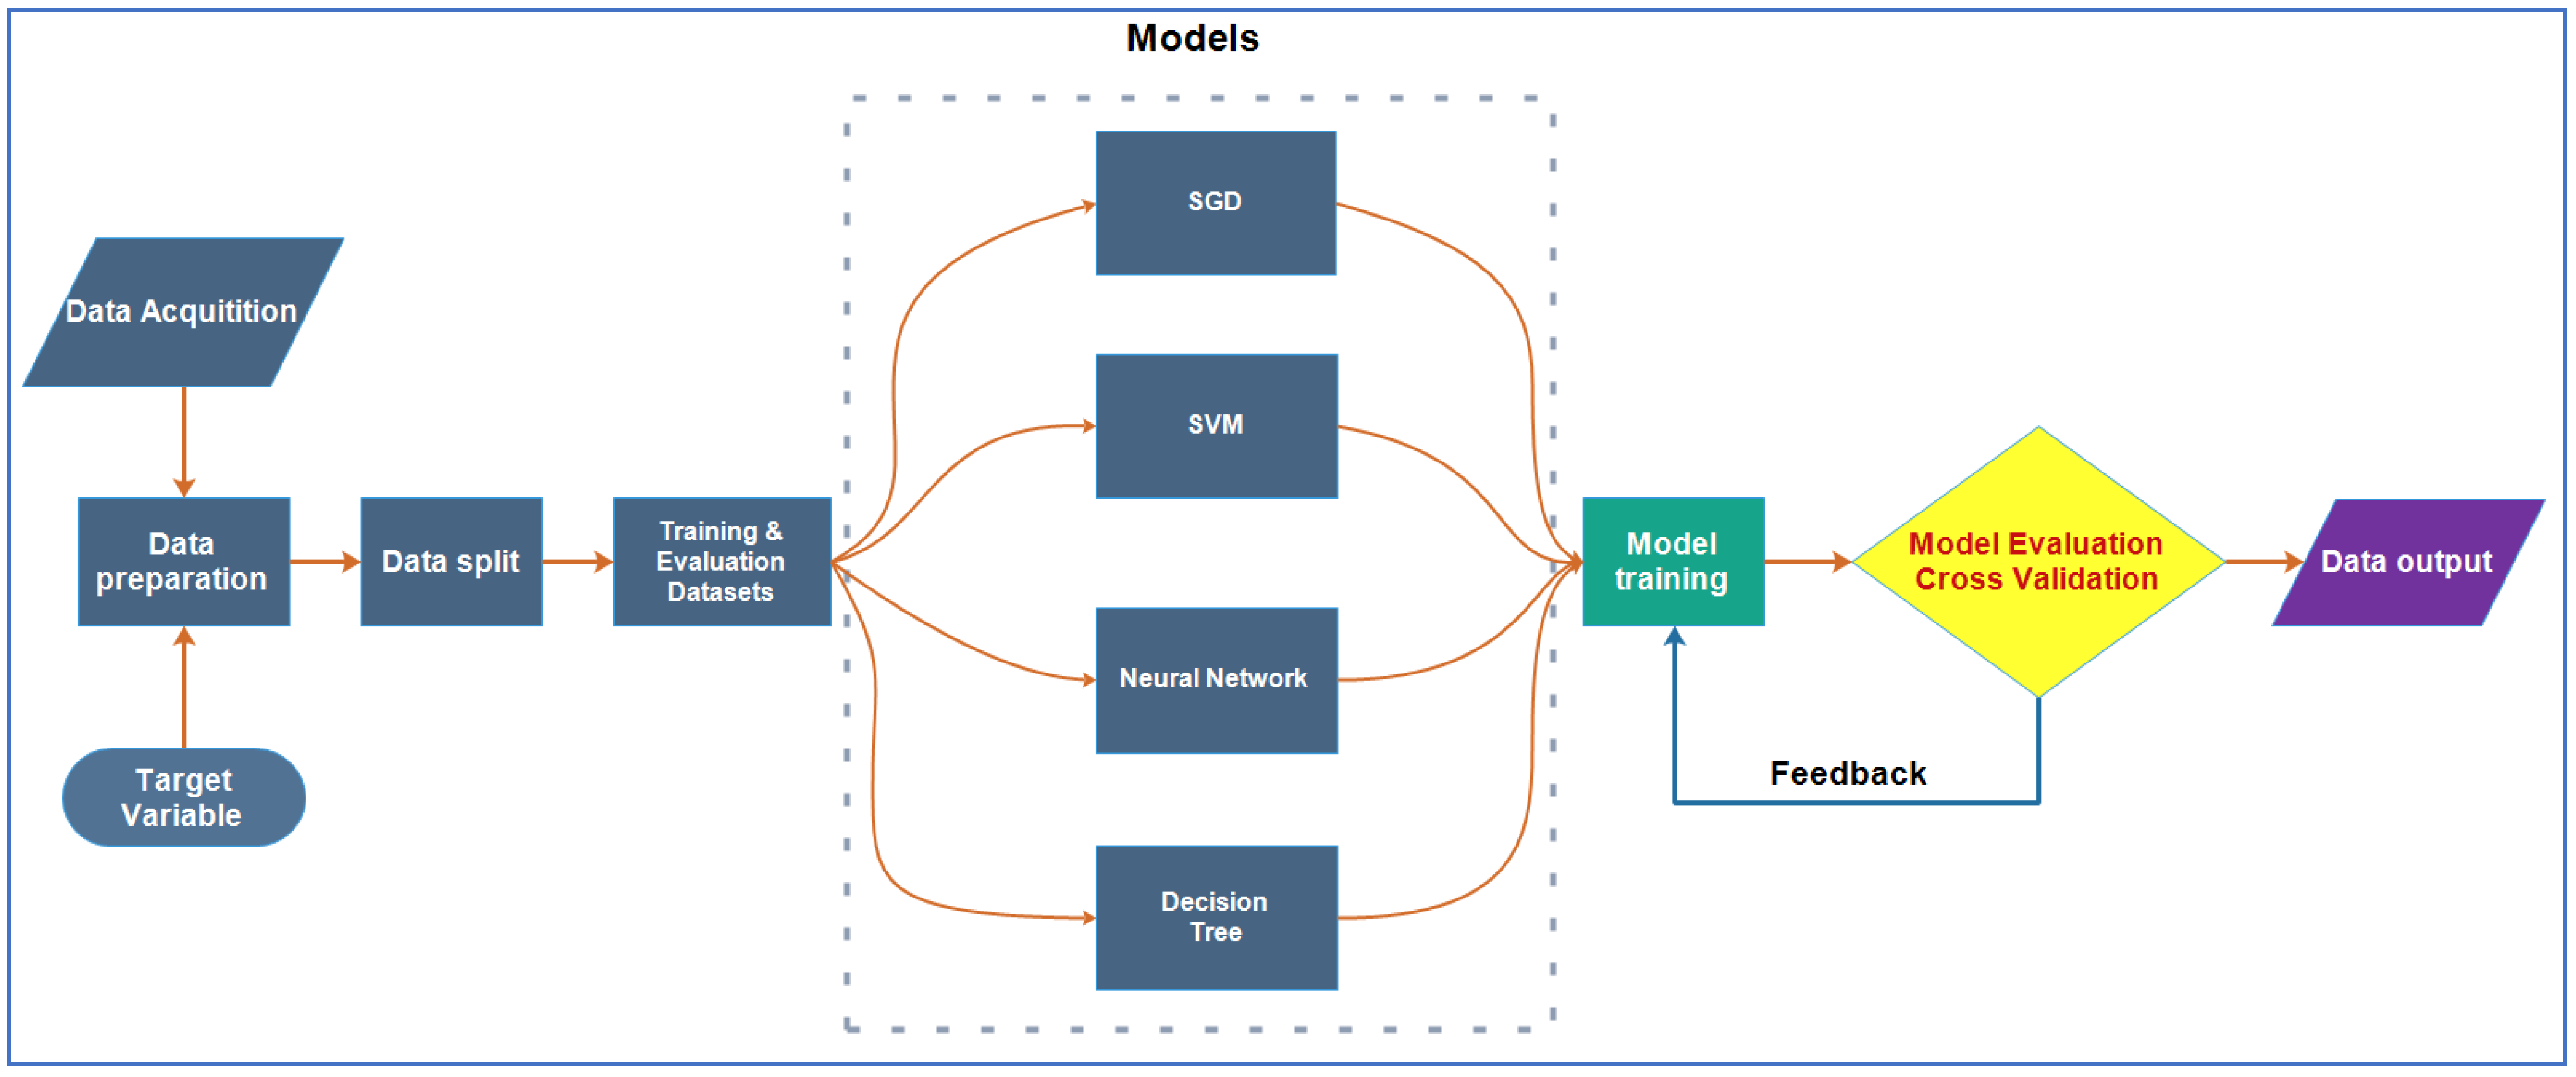
Predictive analysis using supervised machine learning (ML) algorithms was employed to predict the NIS establishment in the Mediterranean, using the visual programming software Orange (version 3.36.2; Ljubljana, Slovenia) [78] (Figure 2). Following data collection, the dataset was then divided into a training set and a testing set using a 70–30% split. Post-model training and parameter fine-tuning were carried out to enhance the performance of each model. No preprocessing was applied to the dataset before analysis. Model evaluation and comparison to determine the best overall performance were conducted using a stratified 10-fold cross-validation with performance metrics. The models employed included stochastic gradient descent (SGD), support vector machine (SVM), neural network, and decision trees (DTs).

2.4. Description of ML Algorithms

Herein, we employed four discrete classes of techniques (SGD, SVM, neural network, and DT) on our datasets, each with its own strengths and weaknesses. SGD is an optimization technique employed as a means to train a model efficiently by using small batches of randomly selected samples per iteration [79] to accelerate convergence and improve the model’s ability to generalize [79]. However, due to its stochastic nature, careful tuning of the learning rate and other hyperparameters is essential to ensure stable convergence toward an optimal solution [80]. SVM is a supervised algorithm primarily used for classification, mapping input data to output labels based on patterns learned from training examples [81,82]. Its strength lies in delivering high accuracy and generalizability in high-dimensional datasets by balancing model complexity and training errors [82] with techniques developed to help prevent overfitting [81,82]. Neural networks are computational models inspired by the human brain, composed of interconnected units that process inputs through weighted connections and transfer functions to generate outputs [83]. Their strength is in their ability to identify complex patterns and relationships in data [83], and as such, they excel in tasks such as classification, regression, and pattern recognition [84]. Finally, DTs are widely used ML models known for their transparency, simplicity, and capacity to manage both numerical and categorical variables [85]. These models function as classifiers by sorting data based on feature values to determine class membership [86,87].

2.5. Assessment of Model Performance

Model performance was assessed using six key indicators to provide a comprehensive evaluation of its predictive capability. The area under the receiver-operating characteristic curve (AUC) was employed to measure the model’s ability to distinguish between positive and negative classes across various threshold settings [88]. Classification accuracy (CA), defined as the proportion of correctly classified instances, offers a general overview of the model’s overall correctness [89]. The F1 score, calculated as the weighted harmonic mean of precision and recall, provides a balanced metric that accounts for both the precision (the proportion of true positives among instances classified as positive) and recall (the proportion of true positives among all positive instances in the dataset), making it particularly useful when dealing with imbalanced data [90]. Precision highlights the model’s exactness in identifying positive cases, while recall emphasizes its ability to capture all actual positive instances. Lastly, the Matthews correlation coefficient (MCC) was utilized to assess the quality of binary classifications, offering a balanced measure even with uneven class distributions [91].
Model performance was evaluated using a weighted composite score incorporating five key metrics: AUC (weighted 30% for overall discriminative ability), F1 score (20% for precision–recall balance), recall (20% for sensitivity in species detection), normalized MCC (20% for robustness to class imbalance), and classification accuracy (10% for overall correctness), with MCC rescaled to a 0–1 range [92]. Complementary rank-based scoring (1st = 3 pts, 2nd = 2 pts, 3rd = 1 pt per metric) assessed model consistency across evaluation criteria. Ecological relevance was further quantified through an Ecological Utility index (AUC × Recall × MCC), emphasizing detection reliability for conservation applications [93,94]. This multi-metric approach follows best practices in ecological modeling by balancing statistical rigor with biological interpretability [95,96].
The SHAP (SHapley Additive exPlanations) method was utilized to illustrate the contribution and importance of each feature in the model’s predictions. SHAP values quantify the extent to which each feature influences the model’s output [97]. Higher SHAP values, indicating greater deviation from the graph’s center, reflect a stronger impact of the feature on the prediction for the selected class. Positive SHAP values (points to the right of the center) indicate feature values that support the prediction of the selected class, whereas negative values (points to the left) suggest an effect against classification in that class [98].

2.5.1. Area Under the Receiver-Operating Characteristic Curve (AUC)

The area under the receiver-operating characteristic curve (AUC) is a widely used metric to evaluate the overall discriminatory power of a binary classification model. It quantifies the model’s ability to distinguish between positive and negative classes by plotting the true positive rate (sensitivity) against the false positive rate (1-specificity) across various classification thresholds [88]. An AUC value of 0.5 indicates a model with no discriminatory ability (random guessing), while a value of 1.0 signifies perfect classification. AUC is particularly valuable because it is threshold-independent, providing a single measure of performance across all possible classification thresholds, and it is less sensitive to class imbalance than accuracy. This makes it a preferred metric in scenarios where the cost of false positives and false negatives varies.

2.5.2. Classification Accuracy (CA)

Classification accuracy (CA) is a straightforward metric that measures the proportion of correctly classified instances out of the total number of instances in the dataset. It is calculated as the ratio of the sum of true positives and true negatives to the total sample size, expressed as a percentage. While CA provides a general sense of a model’s correctness, its utility can be limited in the presence of imbalanced datasets, where a model might achieve high accuracy by simply predicting the majority class, thus overlooking the minority class’s performance [90]. For example, in the context of predicting species establishment, if the “No” class dominates, a model could achieve high CA by predicting “No” for all instances, even if it fails to identify any true positives. Despite this limitation, CA remains a useful initial indicator of model performance when classes are relatively balanced.

2.5.3. F1 Score

The F1 score is the weighted harmonic mean of precision and recall, providing a single metric that balances the trade-off between these two measures. It is particularly useful in scenarios with imbalanced datasets, where focusing solely on accuracy might be misleading. Precision measures the proportion of true positives among instances classified as positive, while recall measures the proportion of true positives identified among all actual positive instances [99]. The F1 score reaches its maximum value of 1 when both precision and recall are perfect, and it approaches 0 when either metric is low. In the context of predicting L. sceleratus and P. miles establishment, the F1 score ensures that the model performs well in both correctly identifying areas of establishment (precision) and capturing most of the actual establishment cases (recall).

2.5.4. Precision

Precision, also known as the positive predictive value, measures the proportion of true positives among all instances classified as positive by the model. This metric is critical in applications where the cost of false positives is high, as it reflects the model’s exactness in identifying positive cases [100]. For instance, in the prediction of L. sceleratus and P. miles establishment, high precision indicates that when the model predicts establishment, it is likely correct, minimizing unnecessary interventions in areas where the species is not actually present. However, precision alone does not account for the model’s ability to identify all positive cases, which is where recall complements it. Precision is prioritized as a performance metric when managing invasive species, where false positives lead to wasted resources.

2.5.5. Recall

Recall, also referred to as sensitivity or the true positive rate, measures the proportion of true positives identified by the model among all actual positive instances in the dataset. This metric is crucial in scenarios where missing a positive case (false negative) is costly, such as in the prediction of invasive species establishment, where failing to identify a region of potential L. sceleratus and P. miles establishment could allow the species to spread unchecked [90]. High recall ensures that the model captures most of the actual positive cases, but it may come at the expense of precision if the model also increases false positives. In ecological modeling, recall is often prioritized when the goal is to detect as many true cases as possible for early intervention.

2.5.6. Matthews Correlation Coefficient (MCC)

The Matthews correlation coefficient (MCC) is a balanced metric that evaluates the quality of binary classifications, considering all four elements of the confusion matrix: true positives, true negatives, false positives, and false negatives [92]. It ranges from −1 (worst) to +1 (best), with 0 indicating random performance. Unlike accuracy, the MCC is robust to class imbalance, making it a reliable measure in scenarios where one class significantly outnumbers the other, such as in rare event prediction. In the context of L. sceleratus and P. miles establishment, the MCC provides a comprehensive assessment of the model’s performance across both classes, ensuring that neither class is disproportionately favored.

2.6. Environmental Drivers and Thresholds for Species Establishment in South Aegean

Environmental data from the marine area south of Rhodes Island, where L. sceleratus and P. miles are already well established, were used to identify the primary environmental factors influencing establishment. The relationship between species presence and environmental predictors was quantified using nominal logistic regression. In this analysis, species presence/absence was treated as a binary dependent variable, and the continuous environmental parameters served as independent variables. The logistic regression model estimated the probability of species presence across the observed range of each predictor variable. Predictor selection was based on statistical significance and parsimony [101,102].
For each species, the fitted model was used to generate nominal logistic curves plotting probability of presence against each significant predictor, with 95% confidence intervals. From these curves, environmental thresholds were defined as the values corresponding to a 50% predicted probability of presence. These thresholds represent the tipping points where environmental conditions shift from being predominantly unsuitable (<50% probability) to suitable (>50% probability) for establishment. This approach allowed for direct, quantitative identification of key limiting and favoring environmental conditions for each species in a region where both are established, thereby providing a robust baseline for extrapolation to other areas in subsequent analyses.

2.7. Environmental Drivers and Thresholds for Species Establishment in the Pagasitikos Gulf

While initial results (factors affecting species establishment) emphasized two primary predictors (bottom temperature and salinity), the analysis was extended to include all available environmental parameters to fully capture the multidimensional environmental space influencing species establishment. The long-term mean values for each of these parameters were extracted from the Pagasitikos Gulf (2000–2025) and used as inputs into the previously developed Rhodes-based models. This approach allowed the simulation of how the species would respond to the current environmental conditions in the Pagasitikos Gulf, based on their known responses in Rhodes, thereby enabling an evidence-based prediction of establishment potential in the gulf [103]. The underlying assumption is that the physiological and ecological tolerances of each species remain consistent between regions, making the Rhodes-derived models a valid framework for extrapolation.
To model the presence of L. sceleratus and P. miles in relation to environmental predictors, nominal logistic regression was applied. Each model partitioned the probability of species presence using continuous environmental variables, identifying key favoring and limiting factors and their effect sizes [75]. These models were constructed to quantify the relationship between species presence and a suite of environmental parameters, identifying which variables influence establishment and determining their threshold values at a 50% probability of presence.

2.8. Forecast of Environmental Parameters at the Pagasitikos Gulf

Environmental data was obtained for the Pagasitikos Gulf (Figure 1) between January 2000 and January 2025 (Table 1). To forecast environmental predictors in the Pagasitikos Gulf and provide insights into future environmental conditions influencing species establishment, the Prophet time series model [104] was applied to historical data for surface and bottom temperature, chlorophyll a, salinity, dissolved oxygen, phosphate (PO4), pH, ammonium (NH4), and nitrate (NO3). The model, implemented in R [105] using the Prophet package (Ver. 1.1.5), captured nonlinear trends, seasonality, and irregular events, with data preprocessed to ensure proper formatting and outlier handling [104]. Historical monthly time series data (January 2000–January 2025) for each environmental parameter were reformatted to Prophet’s required structure (ds = date, y = value) and modelled using default additive seasonality with automatic changepoint detection. The model incorporated piecewise linear trends and event regressors, with hyperparameters to balance flexibility. Forecasts were generated for 10 years (120 months) for most predictors, except salinity and pH, which were limited to 5 years (60 months) due to high uncertainty from recent extreme weather events [106]. For NO3, a log-transformation was applied to stabilize variance, with forecasts back-transformed for interpretation [107]. Model outputs included predicted values, trends, and 95% confidence intervals, visualized using ggplot2 [108] to assess temporal patterns and uncertainty.

2.9. Evaluation of Species Establishment Potential in the Pagasitikos Gulf

To evaluate the likelihood of L. sceleratus and P. miles establishing in the Pagasitikos Gulf, nominal logistic regression models for each species were first developed using environmental data from Rhodes Island, where both species are already well established. To assess the future environmental suitability for each species establishment in the Pagasitikos Gulf, the limiting environmental parameters for each species predicted between 2025 and 2035 were evaluated against species-specific threshold values (establishment) derived from prior nominal logistic regression analyses. For each species, specific threshold values were established representing the environmental boundaries within which the species can successfully establish and maintain viable populations, indicating physiological tolerances.
Using R (Ver. 4.3.2), the dataset was filtered to the forecast period, and thresholds were applied to determine whether each parameter met suitability criteria based on defined directions, which represented the species preference (above or below). A binary indicator (0 or 1) was assigned to each parameter to denote threshold compliance, and a composite suitability score was calculated as the sum of parameters meeting thresholds for each date. To refine this assessment, logistic regression models were employed to estimate the relative importance of each environmental parameter in determining species establishment likelihood [109]. Predictor variables were standardized prior to modeling to ensure comparability of coefficient magnitudes [110]. The absolute values of standardized logistic regression coefficients were then used as weights to construct a weighted suitability score, reflecting the differential influence of each parameter on species establishment probability. This method improves upon unweighted summation by incorporating parameter-specific effects derived from observed occurrence data, thereby enhancing the ecological realism of the suitability assessment and predictive accuracy [111].
Monthly environmental data from Prophet forecasting models were evaluated against the established thresholds to identify the individual parameter suitability trends (the temporal patterns in threshold exceedance for each environmental variable; composite suitability dynamics; the overall habitat suitability evolution over the forecast period; and critical establishment windows) and the time periods when multiple parameters simultaneously meet threshold criteria. This approach focused on thoroughly evaluating the environmental factors affecting species establishment while also considering the uncertainty caused by extreme weather events.

3. Results

3.1. Factors Affecting Species Establishment

3.1.1. L. sceleratus Establishment in Rhodes

The statistical analysis identifies salinity and bottom temperature as the key environmental drivers influencing the establishment of L. sceleratus, as shown through a second-degree stepwise regression using the minimum Bayesian Information Criterion (BIC) for model selection. Both predictors showed highly significant effects (p < 0.0001 for salinity; p = 0.00003 for temperature). Salinity exhibited the strongest influence (Logworth = 13.904; estimate = 1.299, p < 0.0001), indicating that higher salinity levels substantially increase the likelihood of L. sceleratus presence. Bottom temperature also had a significant positive effect (Logworth = 4.506; estimate = 0.202, p < 0.0001), though its impact was comparatively smaller. The model’s overall fit was robust (F Ratio = 47.54, p < 0.0001), and multicollinearity was small (VIF ≈ 1.02 for both variables). Pearson correlation analysis indicates no significant correlation between the identified factors.
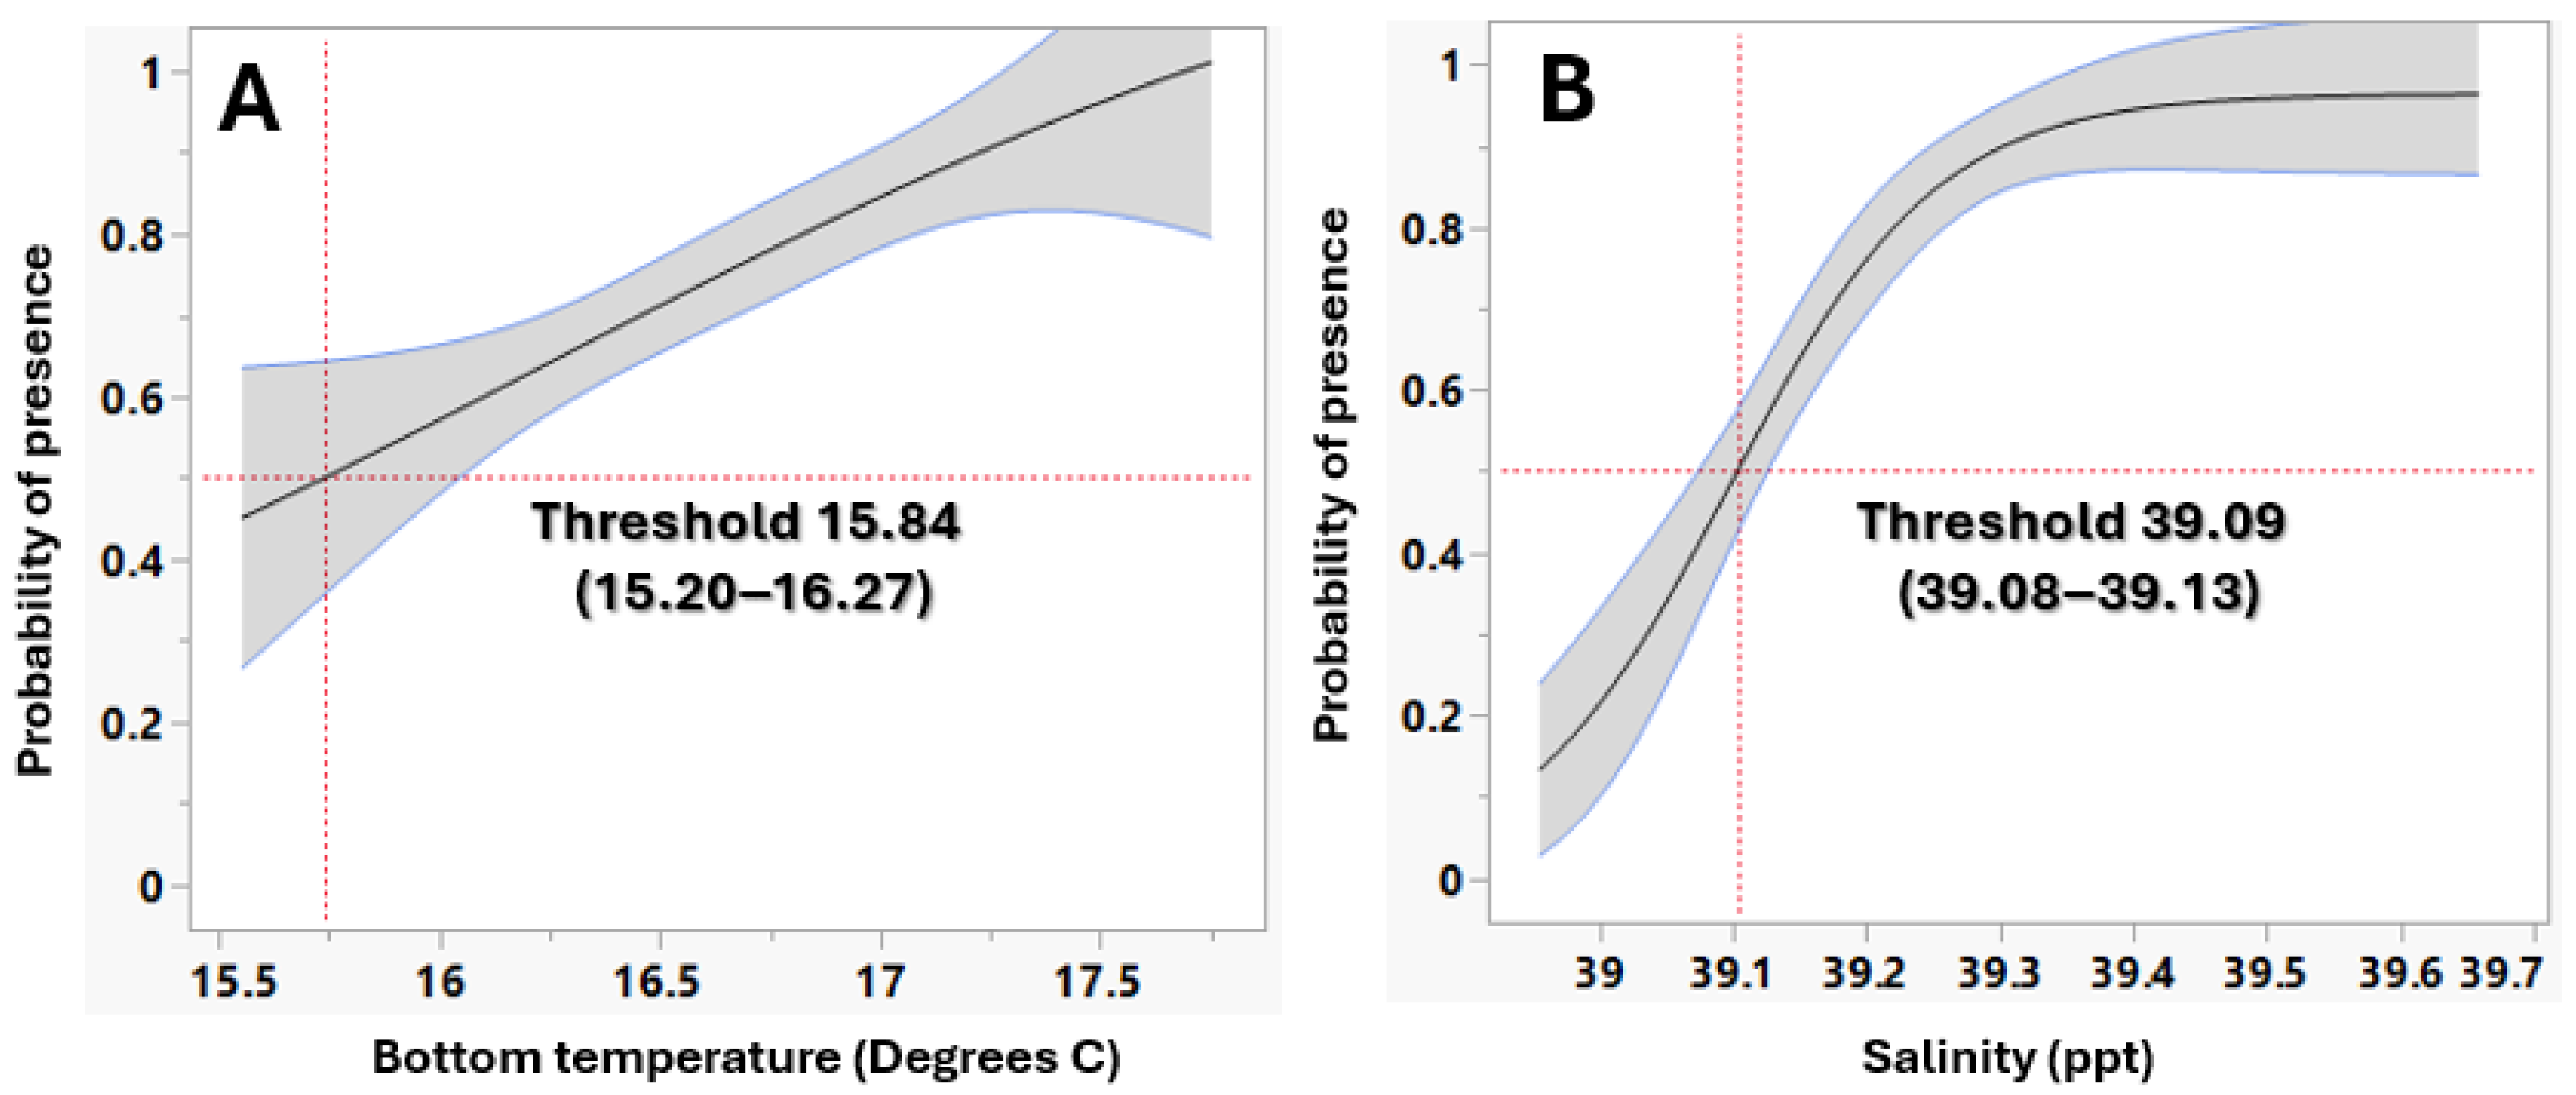
Nominal logistic curves fitted to each factor indicated that for the silver-cheeked toadfish (Figure 3), the threshold for bottom temperature was identified at 15.84 °C, where the probability of presence increased above this value. The threshold for salinity was identified at 39.09 ppt, with salinity levels above this threshold predominantly associated with increased presence.

3.1.2. P. miles Establishment in Rhodes

The statistical analysis reveals that bottom temperature and salinity were the primary factors influencing P. miles establishment, as identified through a second-degree stepwise regression using the minimum Bayesian Information Criterion (BIC) for model selection. A significant overall fit (F Ratio = 79.53, p < 0.0001) was shown. Bottom temperature exhibited a strong positive effect (Logworth = 18.888; estimate = 0.476, p < 0.0001), indicating that warmer conditions favor species establishment. Similarly, salinity had a significant positive influence (Logworth = 9.784; estimate = 1.092, p < 0.0001), suggesting that higher salinity levels also promote establishment. The low variance inflation factors (VIF ≈ 1.02) for both predictors confirmed minimal multicollinearity. Pearson correlation analysis indicates no significant correlation between the identified factors.
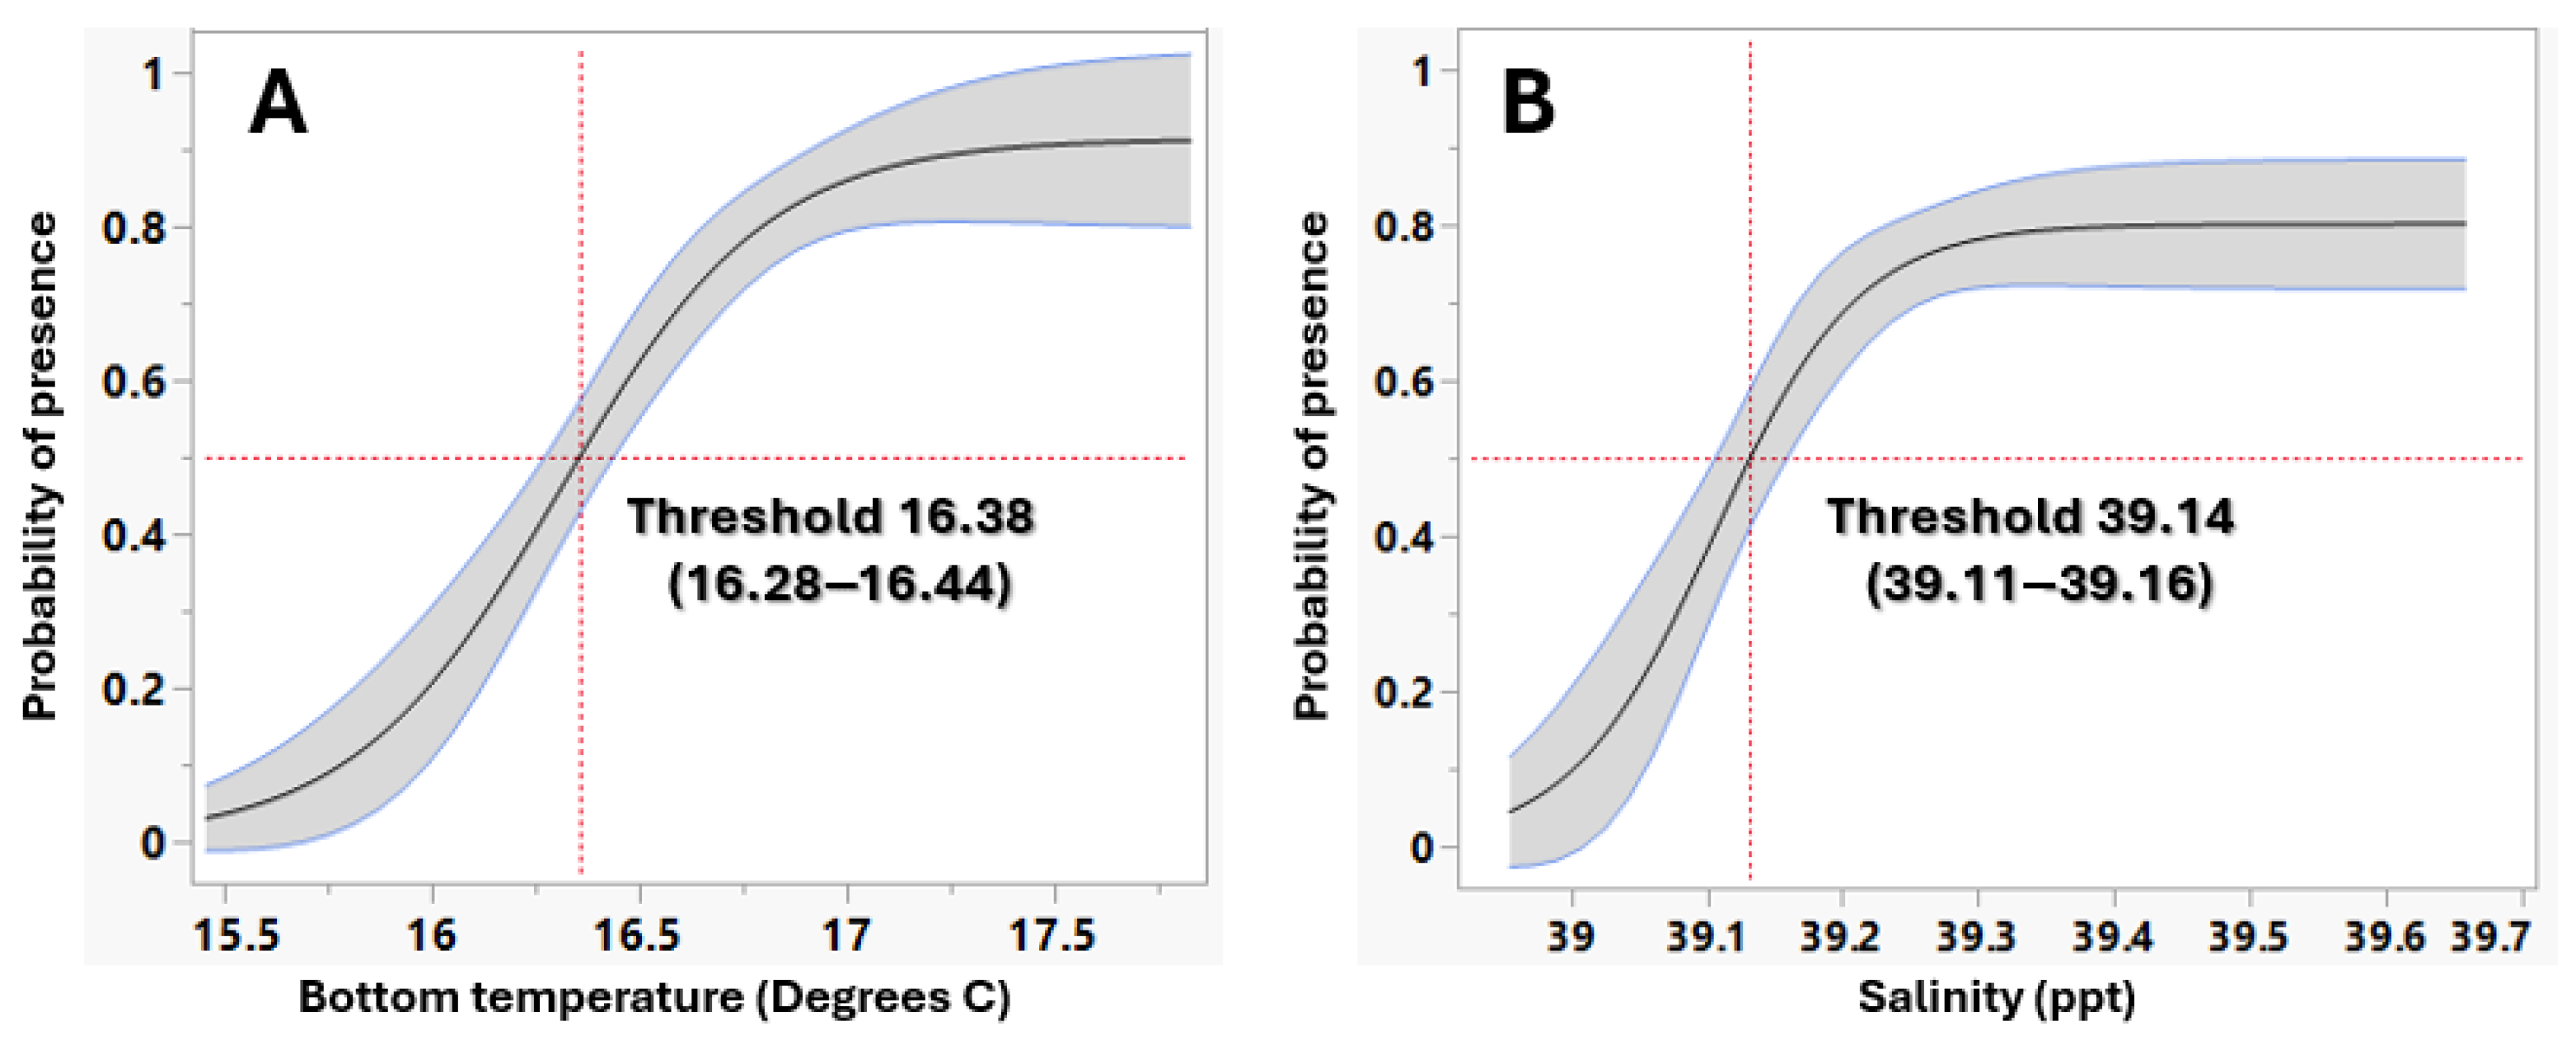
Nominal logistic curves fitted to each factor indicated that for the devil firefish (Figure 4), the threshold for bottom temperature was identified at 16.38 °C, where the probability of presence increased sharply above this value. The threshold for salinity was identified at 39.14 ppt, with salinity levels above this threshold predominantly associated with increased presence.

3.2. ML Model Configuration and Performance for Each Species’ Establishment

All models utilized salinity and bottom temperature as key environmental predictors for both species. The specific configurations for each machine learning approach were implemented as follows:
The neural network architecture consisted of a single hidden layer with 100 neurons and logistic activation functions, optimized using the Adam algorithm. L2 regularization (α = 0.0001) was applied to prevent overfitting, with training limited to 200 maximum iterations. For support vector machines, we employed a linear kernel SVM with a cost parameter (C) of 1.00 and regression loss epsilon (ε) of 0.10, using a convergence tolerance of 0.001 and a maximum of 120 iterations. The stochastic gradient descent model incorporated hinge loss for classification and Huber loss for regression, trained with a constant learning rate (η0 = 0.01) and inverse scaling (exponent t = 0.25) over 1500 maximum iterations. Decision trees were grown with binary splits, requiring a minimum of two instances per leaf and limiting depth to 100 nodes, while stopping splits when nodes reached 95% class purity.
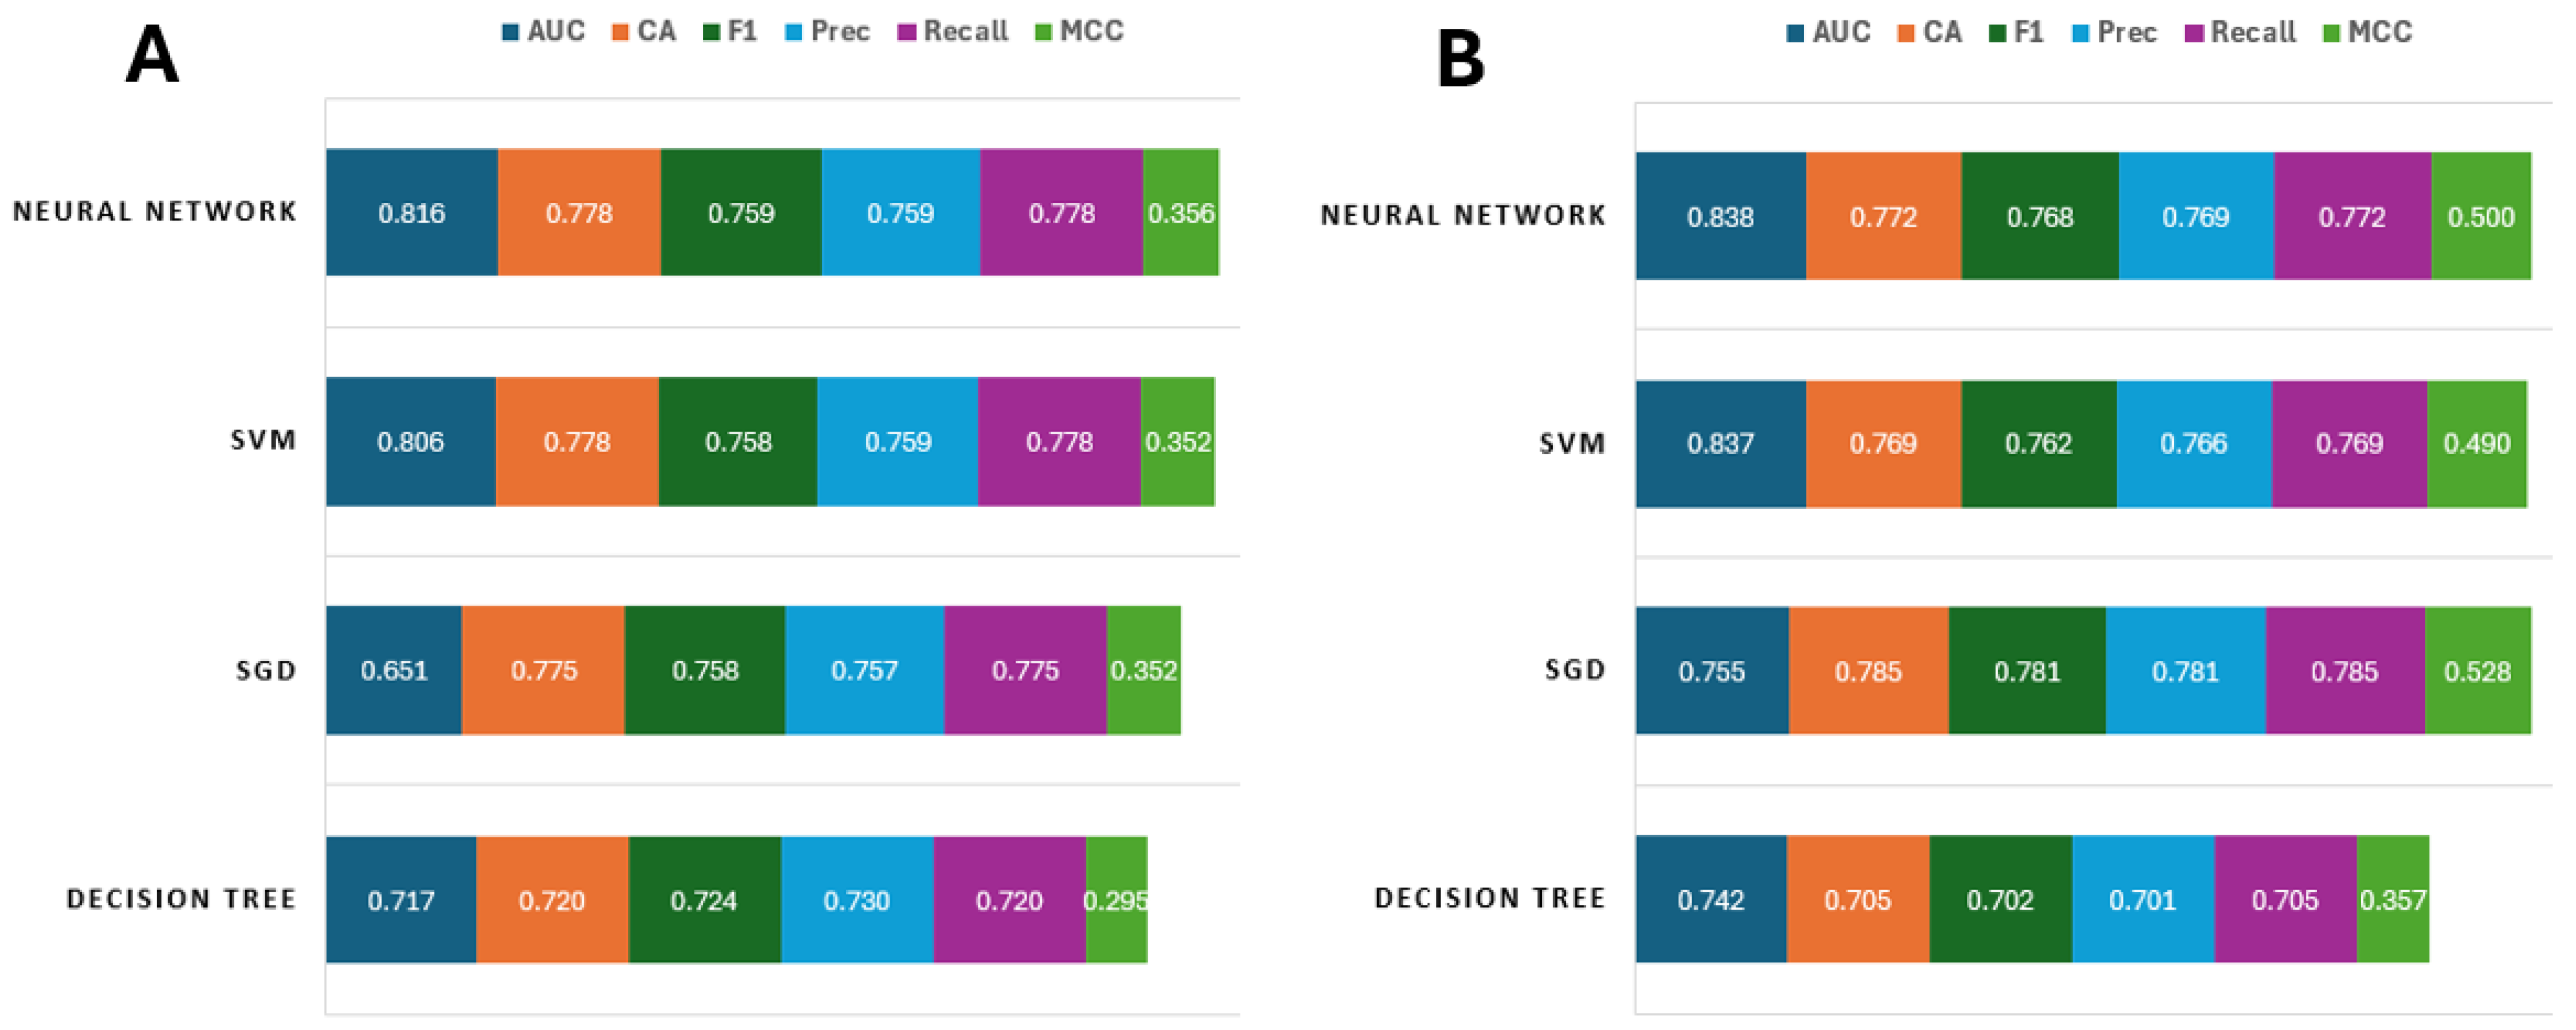
Machine learning model performance for each species was assessed using a total of six indicators (Figure 5), namely, the area under receiver-operating curve (AUC), the proportion of correctly classified examples (CA), the weighted harmonic means of precision and recall (F1), the proportion of true positives among instances classified as positive (Prec), the proportion of true positives among all positive instances in the data (recall), and the Matthews correlation coefficient (MCC).
According to the indicators employed, the models that performed best in predicting the establishment of both the silver-cheeked toadfish and the devil firefish, using bottom temperature and salinity as predictors, were the neural network, followed by SVM using the two identified factors (Figure 5).
The composite performance scores across models for each species is shown in Table 2.
The neural network demonstrated the strongest overall performance for L. sceleratus prediction (Table 2), achieving the highest weighted average score (0.72) and rank score (18/24), driven by superior AUC (0.816) and balanced precision–recall metrics (F1: 0.759). The SVM closely trailed (weighted avg: 0.70), indicating robust linear separation of habitat suitability. Notably, the decision tree lagged significantly (weighted avg: 0.61), reflecting its limitations in capturing complex environmental interactions. The Ecological Utility score (AUC × Recall × MCC) further confirmed the neural network’s dominance (0.45), though SVM’s comparable score (0.43) suggested it as a viable alternative for interpretable models.
For P. miles, the neural network again led in overall performance (weighted avg: 0.754) (Table 2), but SGD emerged as a surprising contender with the highest Ecological Utility score (0.53), attributable to its exceptional MCC (0.528) and recall (0.785), critical for minimizing false negatives in detection. The SVM maintained consistency (weighted avg: 0.749), while the decision tree struggled (0.650), reinforcing its inadequacy for nuanced habitat modeling. The neural network’s balanced metrics (AUC: 0.838, F1: 0.768) and SGD’s strength in robustness (MCC) suggest a trade-off: the former for generalizability, the latter for imbalanced data scenarios.
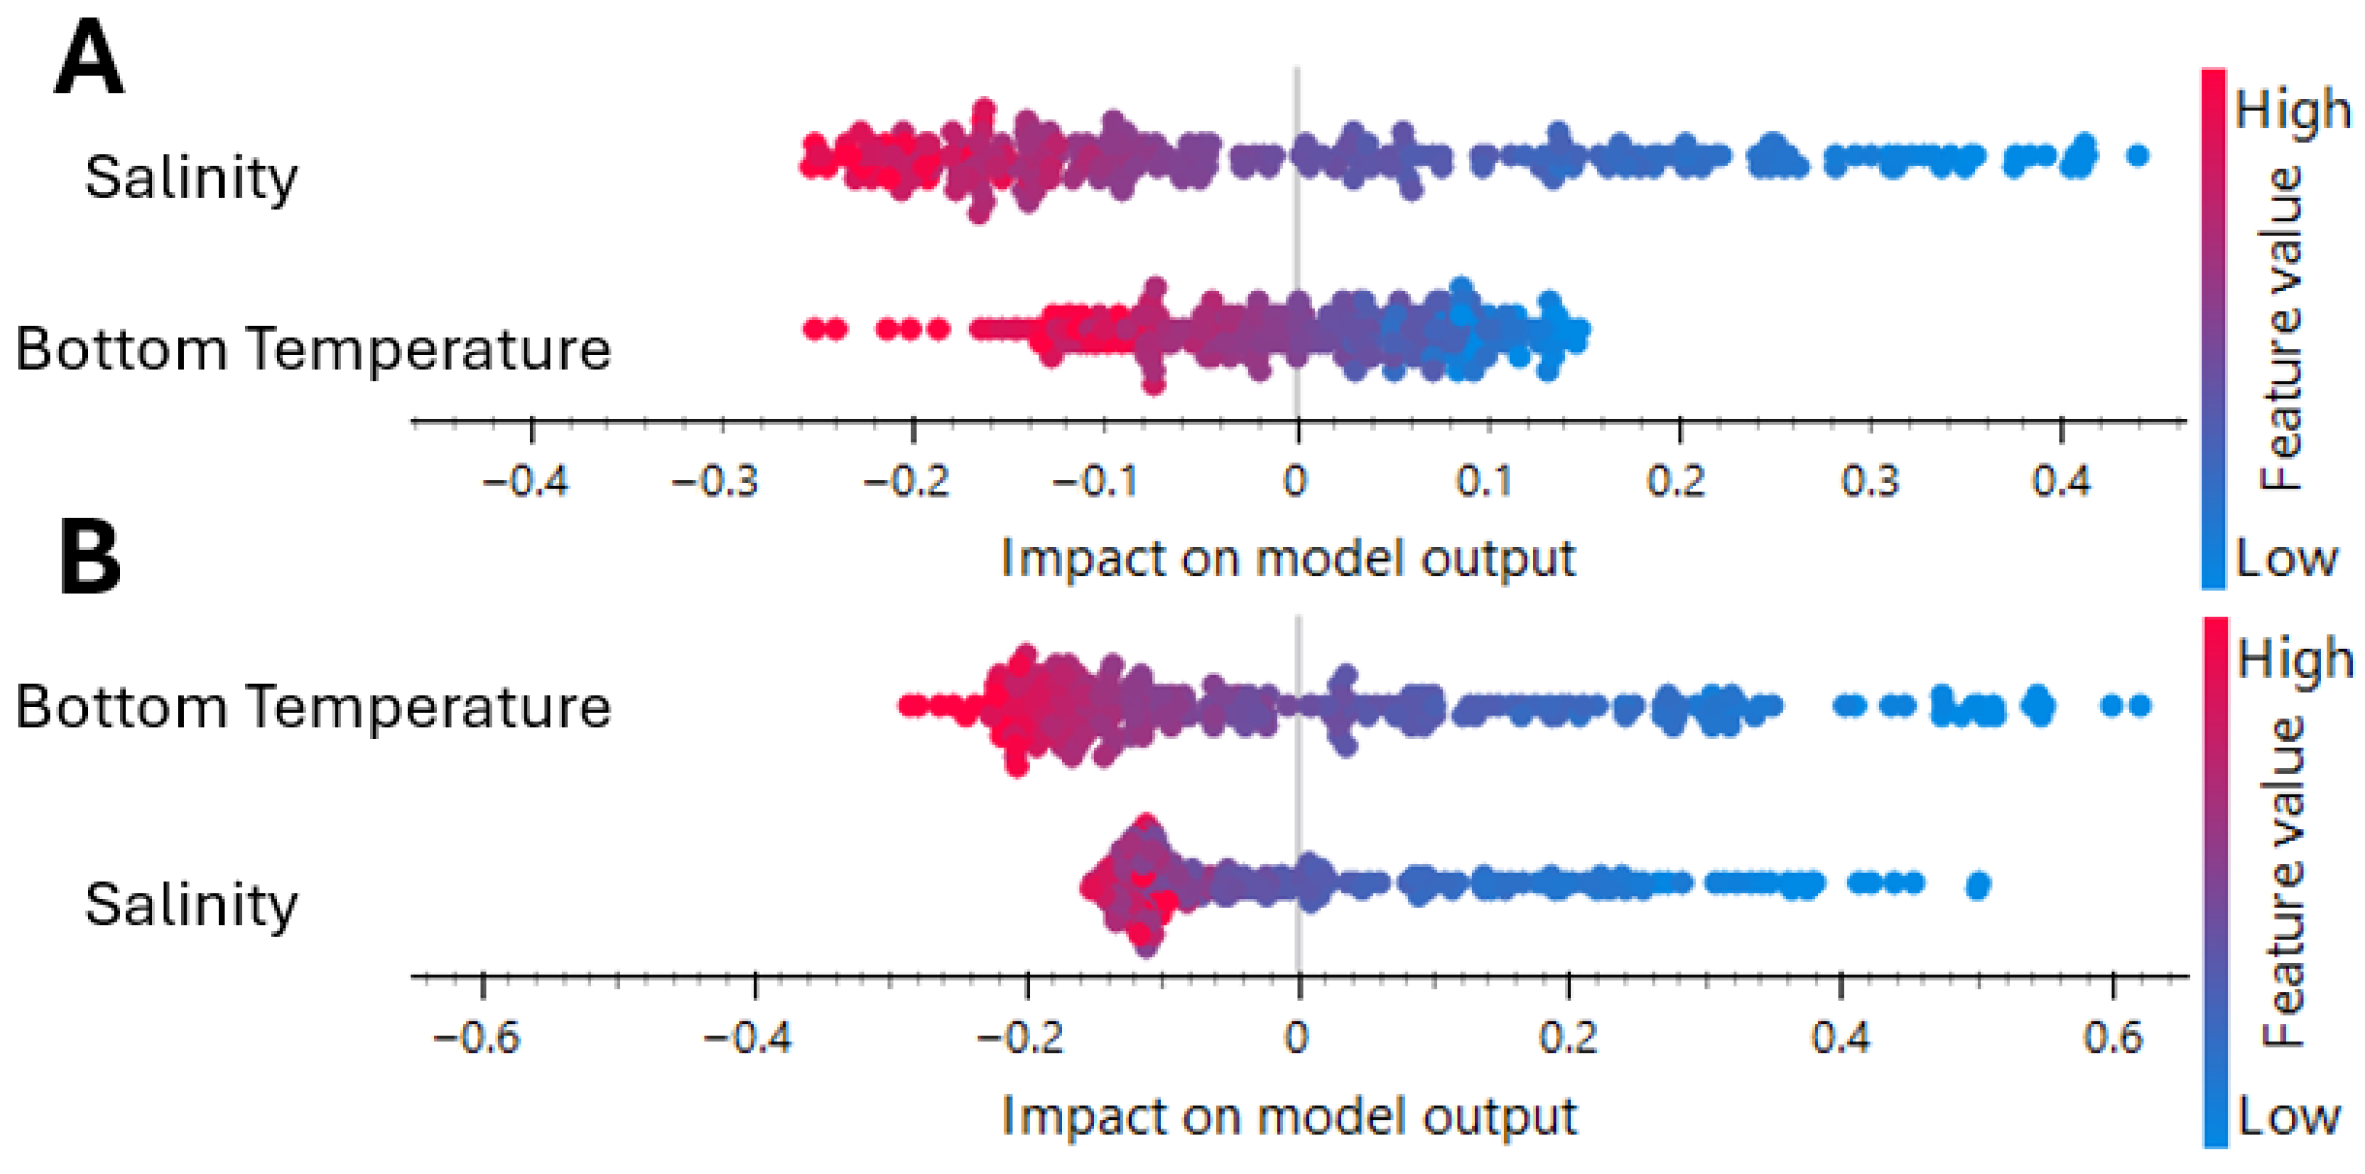
In the SHAP (SHapley Additive exPlanations) analysis (Figure 6), salinity emerged as the most influential feature for the silver-cheeked toadfish, followed by bottom temperature. The devil firefish, however, showed the opposite trend, with bottom temperature ranking higher than salinity. Feature values are color-coded on a scale from red (higher values) to blue (lower values), with the color range normalized to the full range of each feature’s values in the dataset.
The decision-tree model for the silver-cheeked toadfish (Figure 7) achieved a precision of 0.758 (169/223 correctly classified presence/absence records). Salinity emerged as the strongest predictor, with a primary split at approximately 39.17 psu. Locations exceeding this salinity threshold were classified as presence in 88.8% of cases (135/152), regardless of bottom temperature. In lower-salinity sites (<39.17 psu), a secondary split on bottom water temperature (16.70 °C) distinguished absence (66.0% at ≤16.70 °C) from higher occurrence probability (65.4% at >16.70 °C). Within the warmer branch, an additional temperature split (16.78 °C) identified pockets of 100% presence (5/5) at moderate warm temperatures and 57.1% presence (12/21) at higher warm extremes. Thus, L. sceleratus is most likely to be found in very high-salinity waters, whereas in more moderate-salinity environments its occurrence is contingent on sufficiently warm bottom temperatures.
The decision-tree model for the devil firefish (Figure 8) yielded a precision of 0.744 (144/228 correctly classified). Bottom water temperature was the primary driver, with a threshold at 16.43 °C. Sites cooler than this threshold were largely absent of P. miles (67.5% absence, 52/77), whereas warmer areas (>16.43 °C) were assigned presence in 78.8% of cases (119/151). Among warmer sites, a secondary split on salinity at 39.15 psu separated predominantly absent locations (55.6% absence when ≤39.15 psu) from high-presence locations (89.6% presence when >39.15 psu). Additional splits in bottom temperature (e.g., 17.08 °C) further refined presence probabilities, culminating in 97.4% presence (37/38) at the highest temperature and salinity combinations. Overall, P. miles occurrence is first constrained by a minimum bottom temperature (~16.4 °C) and then substantially enhanced by high salinity.

3.3. Identification of Key Environmental Parameters and Threshold Values for the Pagasitikos Gulf Establishment

All environmental parameters obtained exhibited highly significant differences among sites (the Pagasitikos Gulf and Rhodes Island) (Table 3).
Applying the mean environmental values from the Pagasitikos Gulf (2000–2025) to the Rhodes-derived logistic regression model revealed several key variables that limit the establishment of both species (Table 4). Chlorophyll a, with a mean value of 0.478 mg/m3, corresponded to an absence probability of 99.2%, indicating that higher productivity in Pagasitikos may be unfavorable for this species. Salinity, averaging 38.036 psu in the gulf, was well below the species’ establishment threshold of 39.144 psu, resulting in a near-total prediction of absence (99.9%). Bottom temperature (15.84 °C) also produced a low presence probability (6.1%), highlighting thermal constraints in deeper waters. The model also revealed that pH at 8.156 and dissolved oxygen at 236 mmol/m3 both shifted predicted presence to below 50%, with probabilities of 49.4% and 43.3%, respectively, which are conditions that diverge from the slightly more acidic and oxygen-depleted environments preferred in Rhodes. Lastly, phosphate (PO4) concentrations at 0.012 mmol/m3 yielded a marginal presence probability of 60.2%, still below optimal levels. Overall, these results confirm that the environmental profile of the Pagasitikos Gulf is largely unfavorable for P. miles, with high probabilities of absence across all limiting parameters, particularly due to insufficient salinity and bottom temperature (Supplementary Figure S1).
Similarly, several key variables were identified as limiting factors for the establishment of the silver-cheeked toadfish due to their strong association with increased absence probability (Table 4). Specifically, chlorophyll a at 0.478 mg/m3 led to a sharp increase in predicted absence, with the probability of absence rising to 94.3% and presence dropping to just 5.7%. Similarly, pH at 8.156 produced a presence probability of only 34%, further suggesting unsuitable chemical conditions. Dissolved oxygen (O2) at 236 mmol/m3 also reduced the presence probability to 63%, compared to higher probabilities observed in more hypoxic environments typical of Rhodes. Although the bottom temperature (15.84 °C) yielded a moderate presence probability (62%), it still indicated marginal conditions relative to the optimum range. Most notably, salinity in Pagasitikos (mean = 38.036 psu) was far below the identified threshold of 39.096 psu, resulting in an almost complete prediction of absence. These results collectively highlight that despite some favorable conditions, the combined effect of low salinity, elevated chlorophyll, and other marginal parameters renders the Pagasitikos Gulf environmentally unsuitable for stable L. sceleratus establishment at present (Supplementary Figure S2).
To determine species-specific environmental thresholds for establishment, the profiler outputs from the Rhodes-based logistic regression models were employed, and the parameter values corresponding to a 50% probability of presence were identified. These thresholds represent the tipping points at which environmental conditions begin to favor or limit each species’ occurrence. The resulting values for each limiting factor are presented in Table 4.

3.4. Forecast of Environmental Parameters at the Pagasitikos Gulf

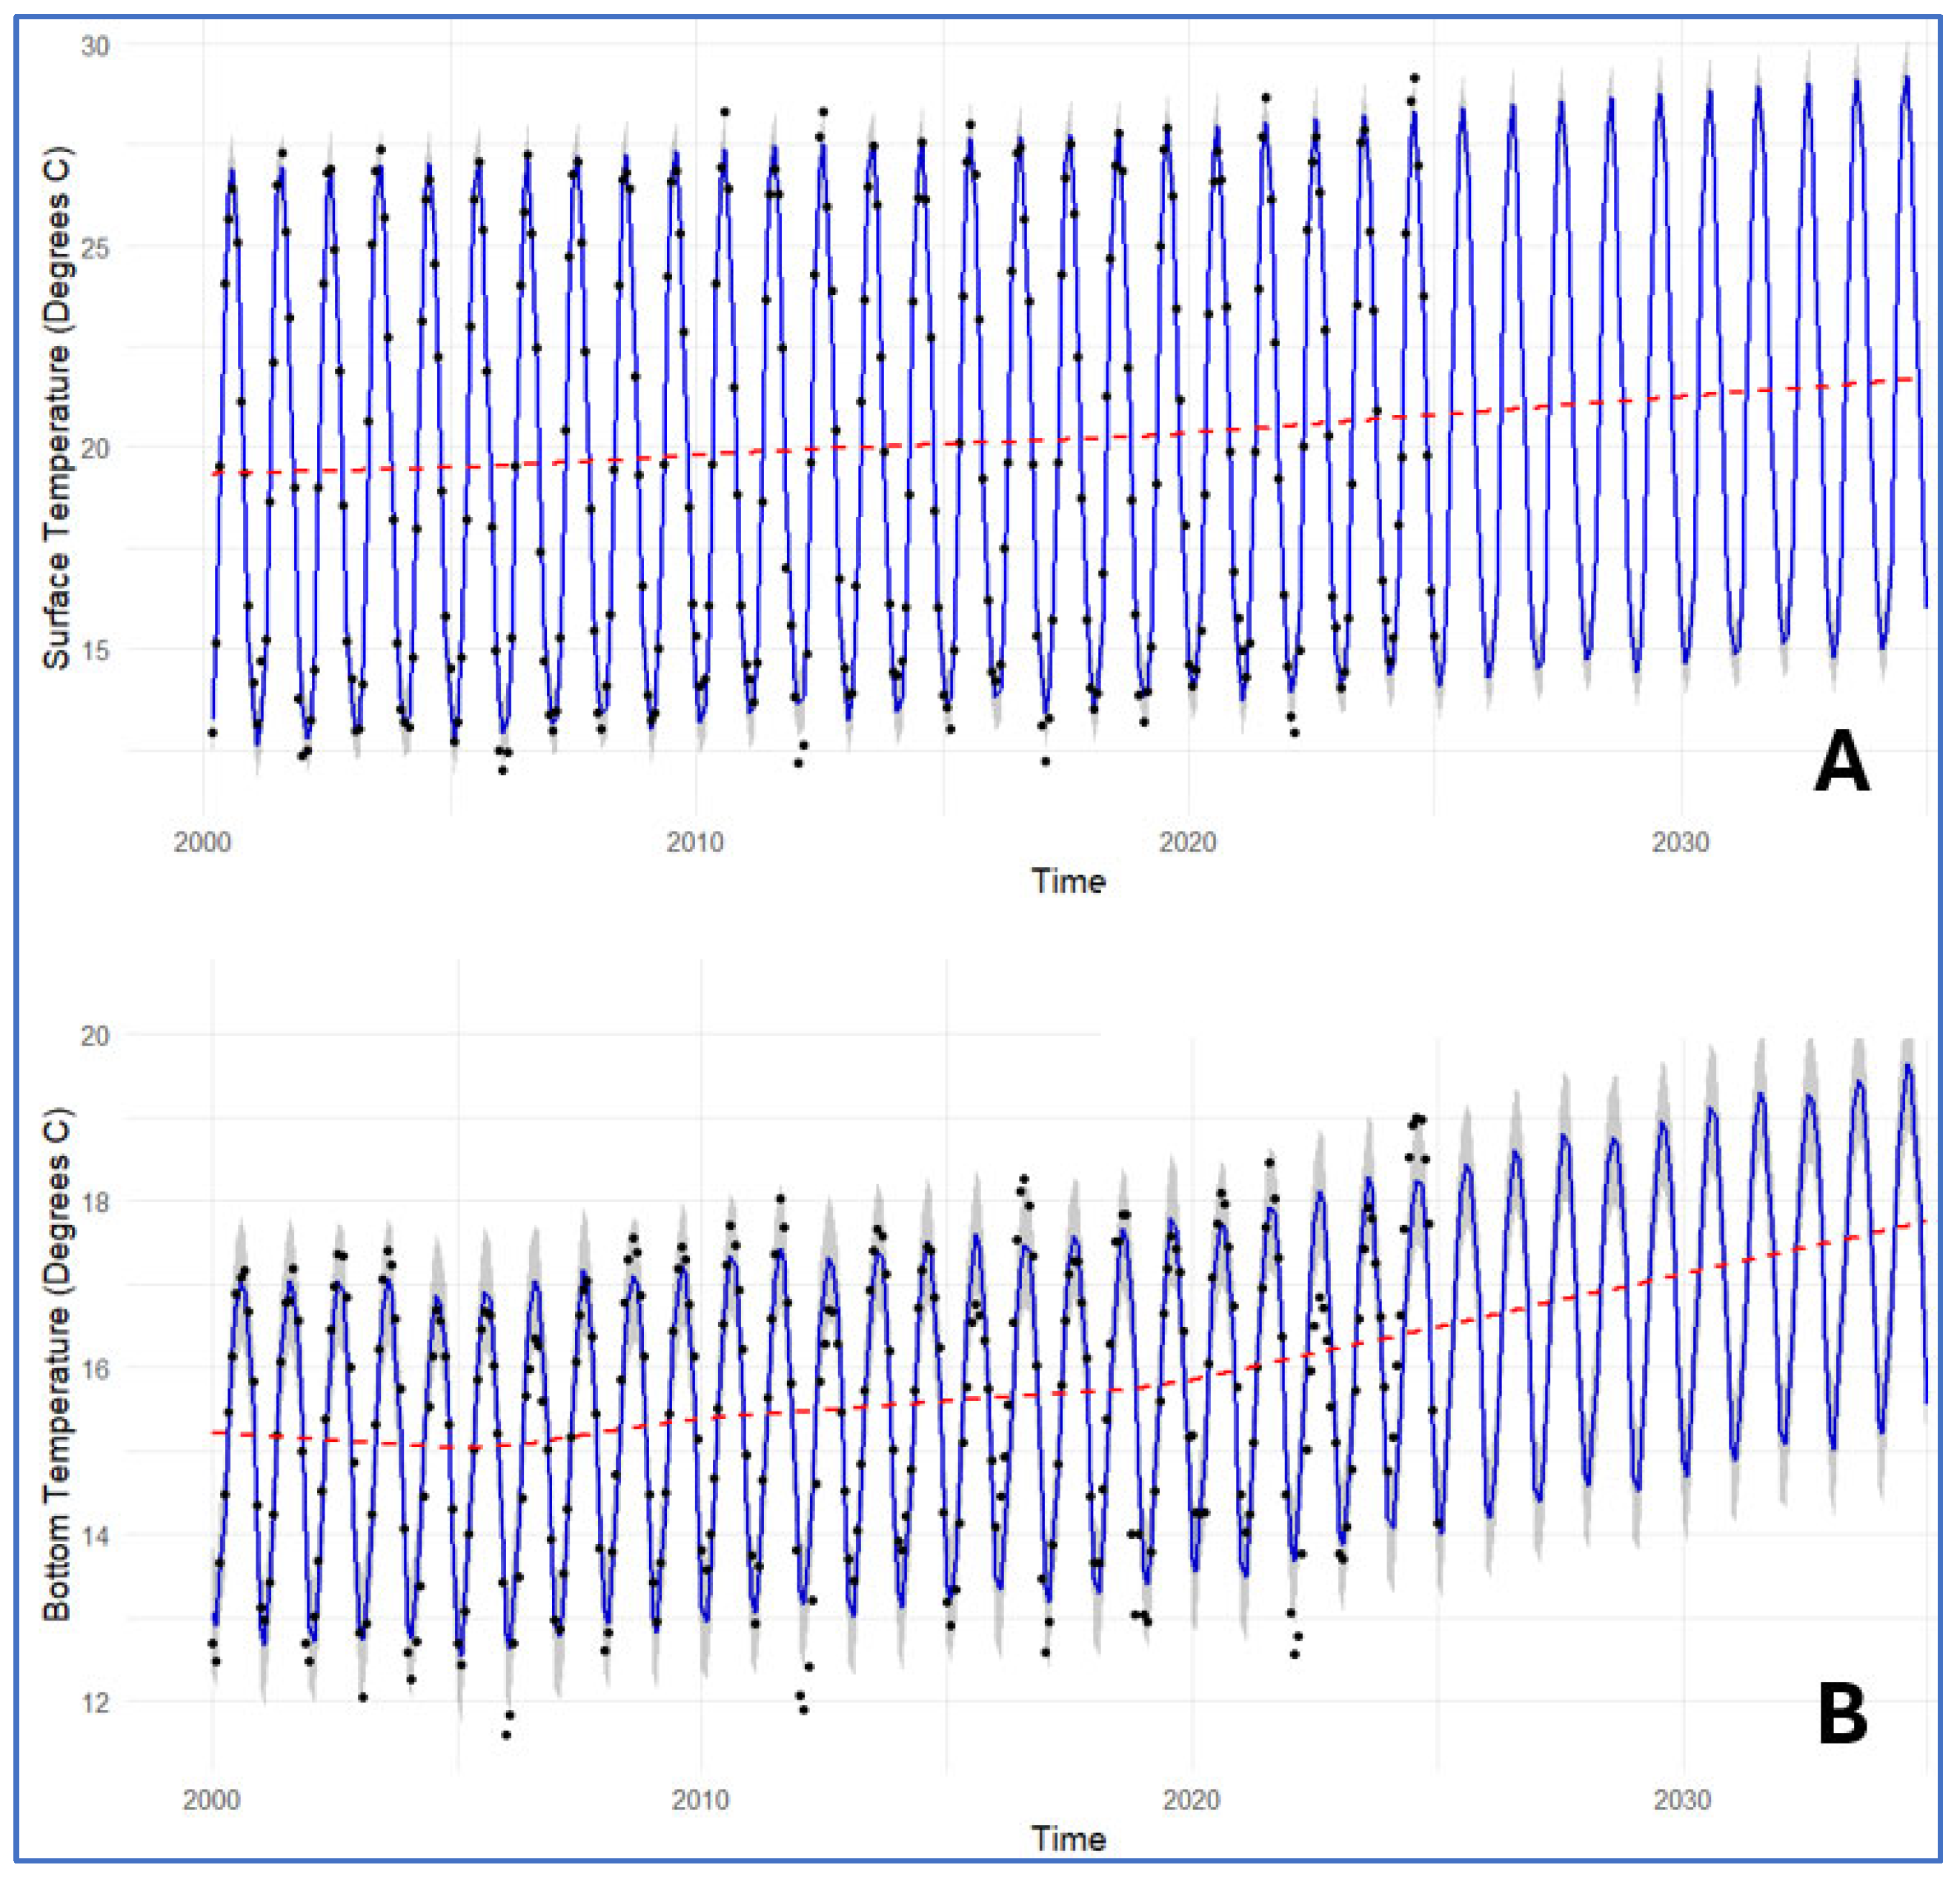
Figure 9 presents the long-term trends in surface and bottom temperatures in the Pagasitikos Gulf from 2000 to 2035. Panel A shows surface temperatures fluctuating seasonally between approximately 15 °C and 30 °C, with a slight upward trend in the moving average over the decades. The red trend line in Panel A indicates a gradual increase in surface temperature, rising by about 1–2 °C from 2000 to 2035. In Panel B, bottom temperatures exhibit similar seasonal oscillations, ranging between 14 °C and 20 °C, but with a more pronounced upward trend compared to surface temperatures in the predicted years. Overall, the results indicate a warming trend in the Pagasitikos Gulf, with both surface and bottom waters experiencing an increase of approximately 1–2 °C.
Figure 10 displays the temporal trends of salinity, dissolved oxygen, pH, and chlorophyll a in the Pagasitikos Gulf from 2000 to 2035 across four panels labeled A, B, C, and D. In Panel A, salinity shows a general decline with noticeable fluctuations, dropping from around 38.5 to below 37 over the period, with some years exhibiting significant variability. Panel B indicates that dissolved oxygen levels remain relatively stable around 200 µg/L, with minor fluctuations and a slight downward trend towards 2035. In Panel C, pH exhibits strong seasonal oscillations, maintaining an average around 8.2 but with a subtle decreasing trend over time, suggesting a gradual acidification. Panel D shows chlorophyll a levels with considerable variability, peaking around 2010–2020 and then declining. Sporadic high values (outliers) can be observed in 2023, consistent with local environmental phenomena and flooding. The shaded areas in each panel represent confidence intervals, indicating the reliability of the trends observed.
Figure 11 presents the temporal trends of nitrate (NO3), ammonium (NH4), and phosphate (PO4) concentrations in the Pagasitikos Gulf from 2000 to 2035 across three panels labeled A, B, and C. In Panel A, NO3 concentrations show a marked decline over time, with significant variability early in the period. Panel B illustrates NH4 levels, which remain relatively low and stable, with slight seasonal variations but no clear long-term trend. In Panel C, PO4 concentrations also exhibit a decreasing trend, with consistent seasonal oscillations throughout. The red trend lines in each panel highlight the overall downward trajectories for NO3, NH4, and PO4. The confidence intervals highlight the variability in the data, particularly for NO3 during the earlier years.
Actual environmental data points (January 2000–January 2025) compared with predicted (February 2025–January 2035) indicate significant differences in all environmental parameters except phosphate (PO4) for the Pagasitikos Gulf (Table 5).
Table 5 indicates that surface and bottom water temperatures and chlorophyll a concentrations are projected to increase significantly. Conversely, salinity, dissolved oxygen, pH, nitrate, and ammonium levels are expected to decrease significantly. Phosphate levels are expected to show a slight, non-significant decrease.

3.5. Evaluation of Species Establishment Potential in the Pagasitikos Gulf

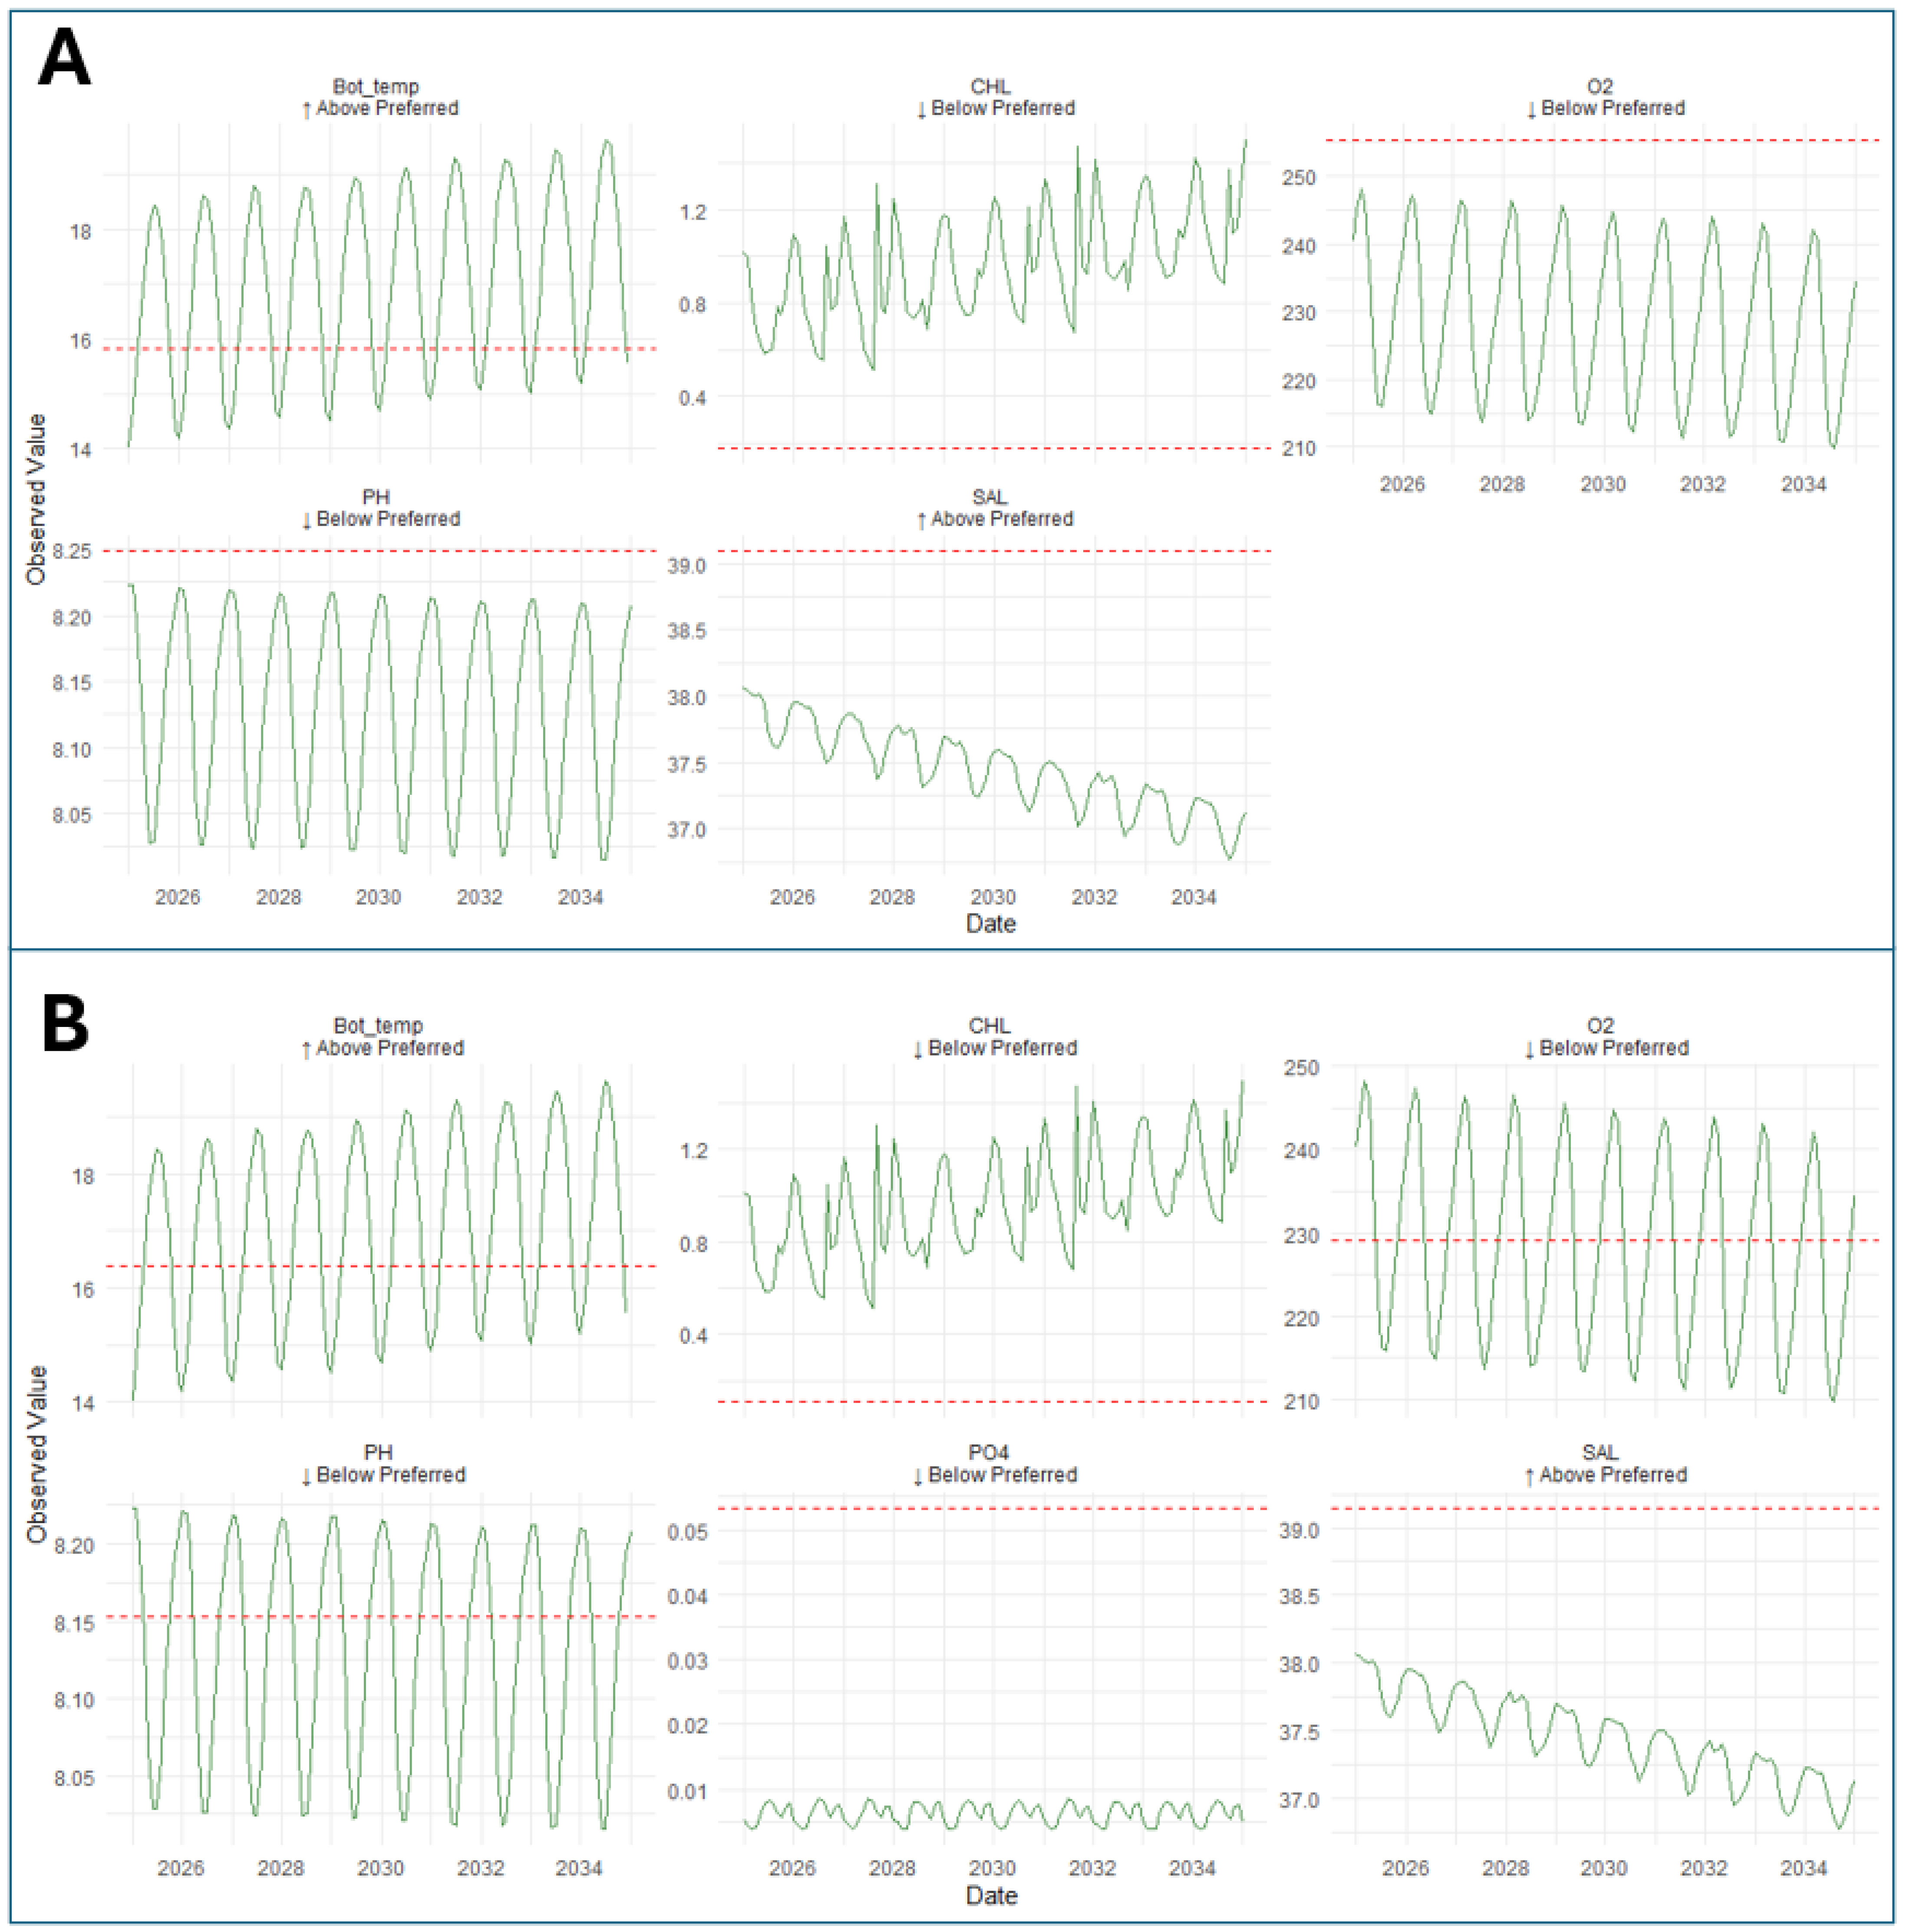
The temporal patterns of threshold exceedance for each environmental variable for L. sceleratus and P. miles in the Pagasitikos Gulf are illustrated in Figure 12. From 2025 to 2035, most environmental parameters for the silver-cheeked toadfish, such as bottom temperature, pH, and dissolved oxygen, generally exceed their respective thresholds, as indicated by the predominance of red bars across the years. Notably, salinity and chlorophyll remain consistently below threshold values for both species throughout the decade, highlighting a persistent environmental limitation in the region.
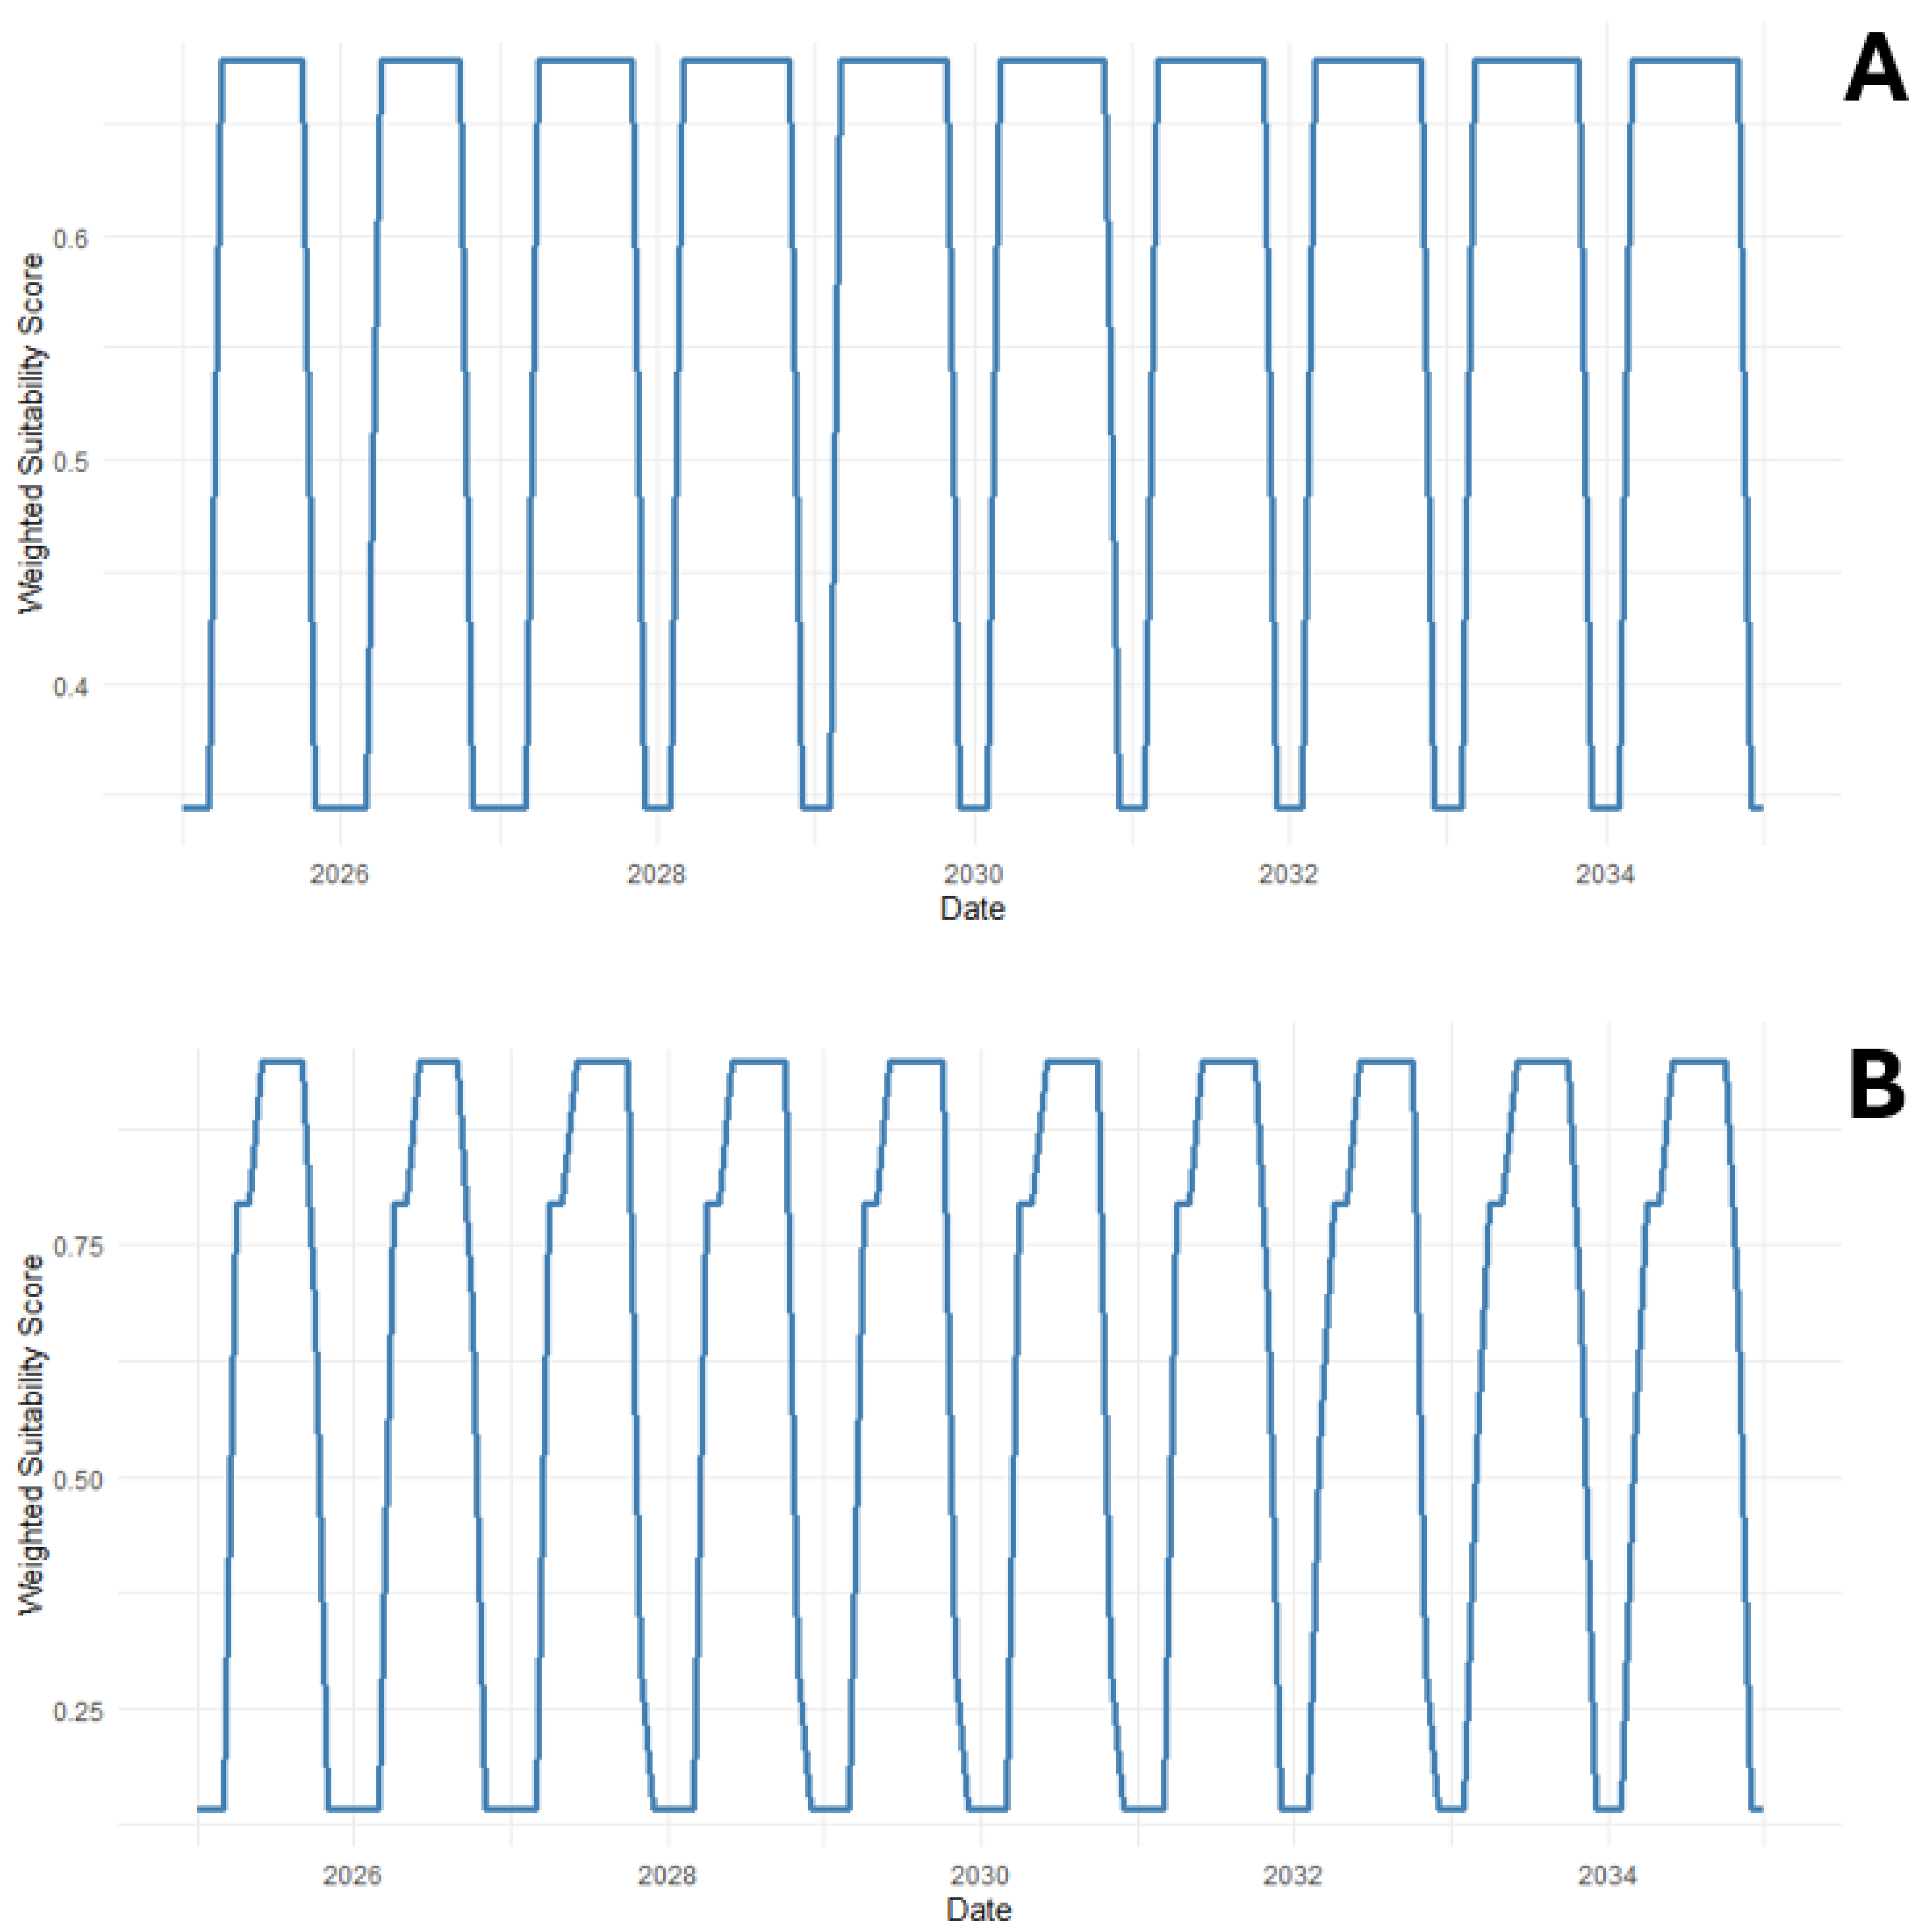
The overall evolution of habitat suitability for L. sceleratus and P. miles in the Pagasitikos Gulf over the forecast period is presented in Figure 13. For the silver-cheeked toadfish, the suitability score consistently reaches three out of the five limiting environmental parameters. Occasional short-term declines to two parameters meeting their thresholds indicate temporary environmental constraints. In contrast, the devil firefish shows greater variability, with suitability scores ranging from one to four out of six limiting parameters meeting their thresholds at any given time throughout the next decade. Overall, the trend suggests that L. sceleratus experiences more favorable and stable environmental conditions, while P. miles is subject to more frequent and pronounced environmental limitations.
Figure 14 illustrates the trends in environmental parameters relative to suitability thresholds for P. miles and L. sceleratus in the Pagasitikos Gulf from 2025 to 2035, highlighting key periods for potential establishment.
For the devil firefish, phosphate (PO4) remains within favorable levels, while bottom temperature shows variability over time. Chlorophyll and salinity remain consistently below threshold levels for P. miles, underscoring a continuing environmental constraint for the species. For L. sceleratus, bottom temperature shows variability over time, and pH and dissolved oxygen (O2) remain, and are projected to remain, within the species’ preferred ranges, as indicated by the threshold line (red color). In contrast, chlorophyll (CHL) and salinity (SAL), similar to P. miles, consistently fall outside the suitable range and are projected to deviate even further from threshold values, indicating persistent environmental limitations.

4. Discussion

The spread and establishment of non-native species often result from a complex, multistage process that begins in the source environment and extends through introduction, establishment, and eventual spread [112]. Identifying regions prone to invasion is, therefore, critical for focusing management efforts where they can most effectively intercept species before they become established [113,114]. However, predicting which non-native organisms will successfully invade remains challenging because invasion success depends on a combination of species-specific traits (e.g., ecological tolerance and life-history characteristics), biotic interactions, habitat suitability, and propagule pressure, among other factors [115,116,117,118,119]. Since these variables interact in nonlinear ways, any predictive framework that helps anticipate where and when invasions might occur is invaluable for guiding early detection and rapid response efforts, thereby reducing the long-term ecological and economic costs associated with invasive species [120,121].
Our study focused on the Pagasitikos Gulf, comparing key environmental parameters to those south of Rhodes, where L. sceleratus and P. miles are already established. We found that bottom temperature and salinity emerged as the primary predictors of both species’ presence, consistent with findings by Coro et al. [27] and Mitchell and Dominguez [26]. The first logistic regression model derived from the study indicated that the devil firefish reaches a 50% probability of occurrence at a bottom temperature of 16.38 °C and salinity of 39.14 psu, while the silver-cheeked toadfish reaches this threshold at 15.84 °C and 39.09 psu. These threshold values are consistent with previous field-based observations in the Eastern Mediterranean, where bottom temperatures above 16 °C and salinities near or above 39 psu are typical in areas of dense invasion [30,33]. In contrast, the Pagasitikos Gulf’s bottom temperatures frequently fall below these thresholds, and salinity shows a downward trend over our forecast period, aligning with scarce sightings of both species in the gulf. Although occasional warm, saline “windows” may permit temporary incursions, persistent environmental mismatches suggest that sustained colonization is unlikely without substantial shifts in temperature or salinity.
For most marine fish species, particularly those adapted to open-ocean or “full-strength” seawater (~35 psu), a difference of less than 1 psu is unlikely to have substantial direct physiological effects. Euryhaline species, such as Mugil cephalus or Dicentrarchus labrax, can tolerate salinity swings of several psu without measurable stress responses [122,123], and even many stenohaline species exhibit tolerance to small fluctuations within the fully marine range [124]. However, persistent differences of <1 psu can still be ecologically meaningful when they reflect distinct water masses with different thermal regimes, nutrient concentrations, and biological productivity. In such cases, salinity often acts as a proxy variable for a broader set of environmental conditions that together influence habitat suitability and species distribution [125]. This is particularly relevant for thermophilic, stenohaline species like L. sceleratus and P. miles [126], which in the Eastern Mediterranean typically occur in higher-salinity waters (~39 psu). The observed difference between Rhodes (~39.2 psu) and the Pagasitikos Gulf (~38.0 psu) is unlikely to represent a strict osmoregulatory threshold but may instead signify an underlying shift in water mass properties, such as lower temperature stability, altered prey availability, and changes in biogeochemical conditions, that collectively reduce establishment potential. Therefore, while the absolute physiological impact of a <1 psu difference may be minimal, its ecological implications can be significant when embedded in a multivariate environmental context.
Although salinity and chlorophyll a thresholds derived from the Rhodes dataset may appear restrictive, we consider them to be ecologically meaningful indicators within the Eastern Mediterranean context. Salinity near or above 39 psu is characteristic of areas where L. sceleratus and P. miles have established dense populations, including Rhodes, Cyprus, and the Levant Basin [30]. These values are not arbitrary but reflect the stable, high-salinity water masses of the Levantine basin, which are typically coupled with low primary productivity. Chlorophyll a concentrations in these regions often remain below 0.2 mg m−3 [127,128], a condition that correlates with the oligotrophic environments in which these species thrive. While both species exhibit physiological tolerance to broader salinity and productivity ranges in other parts of their native and invaded ranges, our model thresholds represent realized environmental optima in the South Aegean, where long-term persistence has been documented. Consequently, the persistently lower salinity and higher chlorophyll a observed in the Pagasitikos Gulf relative to Rhodes are not minor deviations but indicative of a different water mass structure and trophic regime, which are conditions that our analysis shows to be less favorable for establishment based on empirical presence–absence relationships.
The fine-scale benthic conditions modelled in this research differ noticeably from broader, surface-focused studies. While previous work has highlighted sea surface temperature as a dominant driver of marine biodiversity [54], our emphasis on bottom water parameters, particularly temperature and salinity, reflects the unique environmental dynamics of the Pagasitikos Gulf. These thresholds likely reflect underlying physiological tolerances. Elevated bottom temperatures may accelerate metabolic rates and reproductive cycles in these thermophilic species, while high salinity is essential for osmoregulatory balance, particularly in stenohaline invaders like the silver-cheeked toadfish [129]. As both L. sceleratus and P. miles utilize benthic habitats for foraging and reproduction, focusing on bottom temperature and salinity offers a more precise assessment of habitat suitability than surface-only metrics. Hydrodynamic simulations of the Pagasitikos Gulf reveal a well-defined seasonal thermocline and halocline, typically forming between 20 and 40 m depth during summer months, with a triple-layered structure persisting into August [130,131]. These stratified layers are influenced by wind-driven mixing, heat exchange, and freshwater inputs, leading to significant vertical gradients in temperature and salinity. Such stratification is critical for understanding benthic habitat suitability, as it affects the distribution of thermophilic and stenohaline species. Therefore, focusing on bottom water parameters provides a more accurate assessment of habitat conditions compared to surface-only metrics.
The environmental thresholds identified in our models for L. sceleratus are consistent with, yet slightly narrower than, the broad tolerance ranges reported from its native and invaded distributions. In its native Red Sea, L. sceleratus inhabits shallow coastal waters with high salinity (>39 psu) and warm temperatures often exceeding 27 °C year-round [132]. In contrast, in the Eastern Mediterranean, it has successfully established in cooler (15–27 °C) and less saline waters (~37–39 psu), occupying diverse habitats from sandy bottoms and rocky substrates to Posidonia oceanica meadows [37,133]. Records from the Eastern Mediterranean show that L. sceleratus inhabits sandy, rocky, and muddy substrates down to 150 m, illustrating its broad benthic adaptability [134]. The species has since expanded across much of the Mediterranean, including the Adriatic and even the Strait of Gibraltar, indicating that it can tolerate seasonal cooling and salinities well below those of its native range [135]. This plasticity suggests that the thresholds derived from our Pagasitikos Gulf analysis likely reflect local environmental optima rather than strict physiological limits and that the species’ realized niche in the Mediterranean encompasses a broader range of conditions than observed in its native habitat.
The temporal forecasts through to 2035 project a warming trend in both surface and bottom temperatures in line with global ocean warming patterns [136,137]. These projections suggest that bottom thermal barriers may gradually weaken, potentially enabling occasional periods when conditions meet the 50% occurrence thresholds for both species. However, a simultaneous decline in salinity, likely driven by increased freshwater inputs from precipitation or river runoff, creates a counteracting effect that preserves a salinity-driven invasion barrier. Decreases in dissolved oxygen and pH, coupled with reductions in nutrient concentrations (nitrate and ammonium), further complicate the ecological landscape by altering competitive dynamics among native and non-native taxa [138,139]. The apparent negative coupling between declining salinity (from increased freshwater inputs) and declining nutrient concentrations in the Pagasitikos Gulf deviates from the typical expectation that enhanced runoff elevates coastal nutrients via terrestrial sources like fertilizers and erosion [140]. This can be explained by regional processes, including climate-driven warming that strengthens thermal stratification, limiting vertical mixing and nutrient upwelling in this oligotrophic system [141,142]. Local factors, such as improved wastewater management and the Volos Wastewater Treatment Plant (built in 1987), have reduced anthropogenic nutrient loads, shifting the gulf from eutrophic to moderate status with sustained declines in nitrate, ammonium, and chlorophyll a [141,143]. Extreme events like Storm Daniel (2023) further dilute and flush nutrients offshore rather than accumulating them. Biological uptake by algae during warmer periods also depletes nutrients. Integrated modeling and monitoring are crucial to track these interactions under climate change [144]. For lionfish, elevated oxygen levels may exacerbate metabolic demands, while the silver-cheeked toadfish might experience reduced growth or reproduction under hyperoxic conditions [26,27]. At the same time, lower chlorophyll a concentrations suggest reduced primary productivity in benthic food webs, potentially limiting prey availability for these predators. Overall, the interplay of these environmental constraints reinforces the Pagasitikos Gulf’s current marginal suitability for both species.
Effective management of these potential invasions hinges on early detection, targeted monitoring, and rapid response. Coro et al. [27] proposed selective removal of larger L. sceleratus individuals and focused efforts in high-risk zones, while Mitchell and Dominguez [26] highlighted the success of lionfish derbies and spearfishing campaigns in Cyprus. Although early concerns about lionfish invasions emphasized devastating effects on native ecosystems in the western Atlantic, recent evidence suggests that broader-scale disruptions may be less severe than initially feared, with ecosystem changes more attributable to factors like overfishing and phenological shifts than to lionfish alone. For instance, Finch et al. [145] documented that lionfish abundance along the U.S. Atlantic coast increased initially, peaked around 2015–2017, and then stabilized or declined by 2021, likely due to natural processes such as intraspecific competition rather than human interventions, given their preference for deeper waters (40–90 m) beyond recreational diving limits. By integrating the temporal forecasts of this study with near-real-time environmental data, such as those provided by the Copernicus Marine Service, managers could align surveillance efforts with predicted windows of optimal bottom temperature and salinity. This would allow for proactive measures, such as targeted removal or public outreach, during periods when the likelihood of invasion is highest, while also monitoring for potential expansions driven by warming waters, as noted in Finch et al. [145].
Finally, the findings of this study underscore the need to continuously update fine-scale environmental monitoring. While broad Mediterranean trends point to a general warming of water that favors warm-water invaders [54,136,137], localized oceanographic data, particularly bottom temperature, salinity, dissolved oxygen, and nutrient concentrations, ultimately determine whether Lessepsian migrants such as L. sceleratus and P. miles can establish sustainable populations. Given the forecasted trajectories through 2035, persistent salinity deficits and high dissolved oxygen levels suggest that the Pagasitikos Gulf will remain marginally suitable for these species in the near term. However, any acceleration of warming or unexpected shifts in salinity patterns could tip the balance, enabling sporadic or sustained invasions. From a practical perspective, these threshold values provide actionable benchmarks for managers to guide seasonal surveillance protocols. Monitoring efforts can be concentrated during months when bottom temperatures and salinity exceed these thresholds, enhancing early detection and rapid response efforts [146].
While the current study employed individual machine learning models to predict invasion risks, these models inherently face limitations in predictive power due to their reliance on specific algorithms and data constraints. For instance, the performance metrics highlighted variability in model accuracy, suggesting room for improvement, particularly in capturing complex, nonlinear species–environment interactions. To enhance robustness, future research could adopt ensemble forecasting approaches, which combine multiple ML algorithms or model outputs to reduce uncertainty and improve predictive accuracy. Ensemble species distribution models (SDMs), such as those integrating random forests, boosted regression trees, and MaxEnt, have demonstrated superior performance in data-scarce marine settings [147,148]. Additionally, integrating satellite-derived variables could further refine model responsiveness to transient ecological shifts [149]. Embedding biotic interactions into ecological network models [150,151] may also address gaps in the current framework, which focuses solely on abiotic drivers. Such approaches would be particularly beneficial for future refinements in the Eastern Mediterranean, enabling more reliable delineation of high-risk zones amid changing oceanographic conditions.
Beyond environmental drivers, future invasion dynamics in the Pagasitikos Gulf will also depend on ecological connectivity, human-mediated pathways, and broader socio-environmental interactions. For instance, hydrodynamic connectivity has been shown to strongly influence the spatial spread of marine invaders by facilitating larval dispersal across distant habitats [152]. Additionally, the ongoing “tropicalization” of temperate marine ecosystems, driven by climate change, may progressively alter community structures and resource availability in favor of thermophilic invaders like L. sceleratus and P. miles [153]. However, anticipating these shifts requires a more holistic approach. Integrating ecological forecasting with socio-economic data, as suggested by Giakoumi et al. [154], could improve invasion risk assessments and align monitoring efforts with areas of high ecological and economic vulnerability. Similarly, harmonized long-term monitoring and management frameworks across EU marine regions, as advocated by Katsanevakis et al. [126], are essential to implement early-warning systems. Finally, as Simberloff et al. [155] caution, the inherently uncertain and context-dependent nature of biological invasions necessitates precautionary approaches grounded in both empirical modeling and adaptive management.
While this study provides valuable insights into the environmental drivers shaping the potential establishment of L. sceleratus and P. miles in the Pagasitikos Gulf, some limitations must be acknowledged. First, although decision tree and machine learning models offer interpretable and robust classification, their accuracy is inherently constrained by the quality and resolution of the environmental data used [87]. The reliance on reanalysis and forecast datasets, while comprehensive, may not fully capture localized microhabitat variability, particularly in nearshore and structurally complex environments. Second, the study’s temporal projections rely on the Prophet model, which, while effective for capturing seasonality and trends, does not account for sudden ecological disturbances (e.g., marine heatwaves, extreme weather events, or anthropogenic pollution spikes) that can significantly affect invasive species dynamics [104]. This adds uncertainty to long-range suitability forecasts [156]. Third, biological factors such as larval dispersal, predator–prey interactions, or reproductive success were not explicitly modeled. These processes may mediate invasion outcomes even when environmental conditions appear favorable [157]. Similarly, human factors, like fishing pressure, shipping routes, and habitat modification, may enhance or inhibit spread but were beyond the scope of this analysis. Future research should focus on integrating finer-scale oceanographic models and incorporating biological data, such as reproductive phenology, dispersal capabilities, and competitive interactions with native species. Experimental work assessing physiological tolerances under fluctuating oxygen, pH, and nutrient levels would further refine species-specific thresholds. Additionally, coupling habitat suitability models with connectivity and hydrodynamic models could improve predictions of invasion corridors and source–sink dynamics.

5. Conclusions

This study offers an assessment of the environmental suitability for the invasive species L. sceleratus and P. miles in the Pagasitikos Gulf (Eastern Mediterranean). By integrating species distribution modeling, machine learning algorithms, and long-range time series forecasting, bottom temperature and salinity appeared to be important predictors of invasion potential, with species-specific thresholds suggested based on environmental data from areas where both species have established populations (Rhodes Island). Temporal projections using the Prophet model suggest a possible warming trend that might gradually reduce thermal limitations in the Pagasitikos Gulf. However, decreasing salinity and elevated chlorophyll a concentrations could potentially constrain sustained establishment in the near future (5 to 10 years). While occasional environmental “windows” might allow for temporary incursions, the overall habitat conditions in the Pagasitikos Gulf seem to be less favorable for long-term colonization at present. These findings highlight the potential value of incorporating fine-scale benthic data and multiple environmental parameters into invasion risk models rather than relying solely on surface metrics. The results could provide practical guidance for management by suggesting environmental thresholds for targeted monitoring and early-warning systems. Future research might benefit from further integrating biological traits, larval dispersal models, and human-mediated vectors to improve invasion forecasts. Given the ongoing shifts in oceanographic patterns due to climate change, ongoing monitoring and periodic model updates may be necessary to support adaptive management and conservation efforts in the dynamic Mediterranean coastal ecosystems.

Supplementary Materials

The following supporting information can be downloaded at: https://www.mdpi.com/article/10.3390/geosciences15090361/s1, Figure S1: Predicted probability of P. miles establishment in Pagasitikos Gulf based on key environmental parameters.; Figure S2: Predicted probability of L. sceleratus establishment in Pagasitikos Gulf based on key environmental parameters.

Author Contributions

Conceptualization, D.K. and A.T.; methodology, D.K. and A.T.; software, D.K., A.T., K.K., and C.D.; validation, İ.A., D.P., K.K., and C.D.; formal analysis, D.K. and A.T.; investigation, İ.A., D.P., and C.D.; resources, D.P., K.K., and C.D.; data curation, D.K. and A.T.; writing—original draft preparation, D.K. and A.T.; writing—review and editing, D.K., A.T., İ.A., D.P., K.K., and C.D.; visualization, D.K. and A.T.; supervision, D.K., İ.A., and C.D.; project administration, D.K. All authors have read and agreed to the published version of the manuscript.

Funding

This research received no external funding.

Data Availability Statement

The datasets analyzed from the current study are available from the corresponding author upon reasonable request.

Acknowledgments

We gratefully acknowledge the Copernicus Marine Environment Monitoring Service (CMEMS) for providing open-access data from the Mediterranean Sea, including the Sea Physics, Sea Biogeochemical and Bio-Geo-Chemical, L4, monthly means, daily gapfree, and climatology Satellite Observations (1997-ongoing) time series. We also acknowledge NASA Ocean Biology Distributed Active Archive Center (OB.DAAC) for the data, imagery, and web resources used. We also extend our thanks to the QGIS Development Team for maintaining QGIS, which was instrumental in data extraction, spatial processing, and visualization.

Conflicts of Interest

The authors declare no conflicts of interest.

References

  1. Costello, M.J.; Coll, M.; Danovaro, R.; Halpin, P.; Ojaveer, H.; Miloslavich, P. A Census of Marine Biodiversity Knowledge, Resources, and Future Challenges. PLoS ONE 2010, 5, e12110. [Google Scholar] [CrossRef]
  2. Rilov, G.; Galil, B. Marine Bioinvasions in the Mediterranean Sea—History, Distribution and Ecology. In Biological Invasions in Marine Ecosystems; Rilov, G., Crooks, J.A., Eds.; Springer: Berlin/Heidelberg, Germany, 2009; Volume 204, pp. 549–575. ISBN 978-3-540-79236-9. [Google Scholar]
  3. Galil, B.S. Alien Species in the Mediterranean Sea—Which, When, Where, Why? Hydrobiologia 2008, 606, 105–116. [Google Scholar] [CrossRef]
  4. Zenetos, A.; Gofas, S.; Morri, C.; Rosso, A.; Violanti, D.; Garcia Raso, J.E.; Cinar, M.E.; Almogi-Labin, A.; Ates, A.S.; Azzurro, E.; et al. Alien Species in the Mediterranean Sea by 2012. A Contribution to the Application of European Union’s Marine Strategy Framework Directive (MSFD). Part 2. Introduction Trends and Pathways. Mediterr. Mar. Sci. 2012, 13, 328. [Google Scholar] [CrossRef]
  5. Edelist, D.; Rilov, G.; Golani, D.; Carlton, J.T.; Spanier, E. Restructuring the S Ea: Profound Shifts in the World’s Most Invaded Marine Ecosystem. Divers. Distrib. 2013, 19, 69–77. [Google Scholar] [CrossRef]
  6. Mavruk, S.; Avsar, D. Non-Native Fishes in the Mediterranean from the Red Sea, by Way of the Suez Canal. Rev. Fish Biol. Fish. 2008, 18, 251–262. [Google Scholar] [CrossRef]
  7. Côté, I.M.; Smith, N.S. The Lionfish Pterois Sp. Invasion: Has the Worst-case Scenario Come to Pass? J. Fish Biol. 2018, 92, 660–689. [Google Scholar] [CrossRef]
  8. Streftaris, N.; Zenetos, A. Alien Marine Species in the Mediterranean-the 100 ‘Worst Invasives’ and Their Impact. Mediterr. Mar. Sci. 2006, 7, 87–118. [Google Scholar] [CrossRef]
  9. Côté, I.M.; Green, S.J.; Hixon, M.A. Predatory Fish Invaders: Insights from Indo-Pacific Lionfish in the Western Atlantic and Caribbean. Biol. Conserv. 2013, 164, 50–61. [Google Scholar] [CrossRef]
  10. Kondylatos, G.; Theocharis, A.; Mandalakis, M.; Avgoustinaki, M.; Karagyaurova, T.; Koulocheri, Z.; Vardali, S.; Klaoudatos, D. The Devil Firefish Pterois miles (Bennett, 1828): Life History Traits of a Potential Fishing Resource in Rhodes (Eastern Mediterranean). Hydrobiology 2024, 3, 31–50. [Google Scholar] [CrossRef]
  11. Gardner, P.G.; Frazer, T.K.; Jacoby, C.A.; Yanong, R.P.E. Reproductive Biology of Invasive Lionfish (Pterois spp.). Front. Mar. Sci. 2015, 2, 7. [Google Scholar] [CrossRef]
  12. Meyerson, L.A.; Mooney, H.A. Invasive Alien Species in an Era of Globalization. Front. Ecol. Environ. 2007, 5, 199–208. [Google Scholar] [CrossRef]
  13. Seebens, H.; Gastner, M.T.; Blasius, B. The Risk of Marine Bioinvasion Caused by Global Shipping. Ecol. Lett. 2013, 16, 782–790. [Google Scholar] [CrossRef] [PubMed]
  14. Blanco, A.; Larrinaga, A.R.; Neto, J.M.; Troncoso, J.; Méndez, G.; Domínguez-Lapido, P.; Ovejero, A.; Pereira, L.; Mouga, T.M.; Gaspar, R.; et al. Spotting Intruders: Species Distribution Models for Managing Invasive Intertidal Macroalgae. J. Environ. Manag. 2021, 281, 111861. [Google Scholar] [CrossRef] [PubMed]
  15. Costello, K.E.; Lynch, S.A.; McAllen, R.; O’Riordan, R.M.; Culloty, S.C. Assessing the Potential for Invasive Species Introductions and Secondary Spread Using Vessel Movements in Maritime Ports. Mar. Pollut. Bull. 2022, 177, 113496. [Google Scholar] [CrossRef]
  16. Mainka, S.A.; Howard, G.W. Climate Change and Invasive Species: Double Jeopardy. Integr. Zool. 2010, 5, 102–111. [Google Scholar] [CrossRef]
  17. Atkinson, J.; King, N.G.; Wilmes, S.B.; Moore, P.J. Summer and Winter Marine Heatwaves Favor an Invasive Over Native Seaweeds. J. Phycol. 2020, 56, 1591–1600. [Google Scholar] [CrossRef]
  18. Azzurro, E.; Smeraldo, S.; D’Amen, M. Spatio-temporal Dynamics of Exotic Fish Species in the Mediterranean Sea: Over a Century of Invasion Reconstructed. Glob. Chang. Biol. 2022, 28, 6268–6279. [Google Scholar] [CrossRef]
  19. Stachowicz, J.J.; Terwin, J.R.; Whitlatch, R.B.; Osman, R.W. Linking Climate Change and Biological Invasions: Ocean Warming Facilitates Nonindigenous Species Invasions. Proc. Natl. Acad. Sci. USA 2002, 99, 15497–15500. [Google Scholar] [CrossRef] [PubMed]
  20. Sorte, C.J.B.; Williams, S.L.; Zerebecki, R.A. Ocean Warming Increases Threat of Invasive Species in a Marine Fouling Community. Ecology 2010, 91, 2198–2204. [Google Scholar] [CrossRef]
  21. Kletou, D.; Hall-Spencer, J.M.; Kleitou, P. A Lionfish (Pterois miles) Invasion Has Begun in the Mediterranean Sea. Mar. Biodivers. Rec. 2016, 9, 46. [Google Scholar] [CrossRef]
  22. Pastor, F.; Valiente, J.A.; Khodayar, S. A Warming Mediterranean: 38 Years of Increasing Sea Surface Temperature. Remote Sens. 2020, 12, 2687. [Google Scholar] [CrossRef]
  23. Hernández, S.; Martínez, B.D.-C.; Olabarria, C. Predicting Habitat Suitability for Alien Macroalgae in Relation to Thermal Niche Occupancy. Mar. Pollut. Bull. 2024, 208, 116953. [Google Scholar] [CrossRef] [PubMed]
  24. Kalogirou, S.; Wennhage, H.; Pihl, L. Non-Indigenous Species in Mediterranean Fish Assemblages: Contrasting Feeding Guilds of Posidonia Oceanica Meadows and Sandy Habitats. Estuar. Coast. Shelf Sci. 2012, 96, 209–218. [Google Scholar] [CrossRef]
  25. Kondylatos, G.; Kallias, I.; Vafidis, D.; Exadactylos, A.; Theocharis, A.; Mavrouleas, D.; Kalaentzis, K.; Avgoustinaki, M.; Conides, A.; Klaoudatos, D. The Length-Weight Relationship of Indigenous and Non-Indigenous Fish Species from the Small-Scale Fisheries of Rhodes Greece. Int. Aquat. Res. 2024, 16, 169–185. [Google Scholar] [CrossRef]
  26. Mitchell, E.; Dominguez Almela, V. Modelling the Rise of Invasive Lionfish in the Mediterranean. Mar. Biol. 2025, 172, 18. [Google Scholar] [CrossRef]
  27. Coro, G.; Vilas, L.G.; Magliozzi, C.; Ellenbroek, A.; Scarponi, P.; Pagano, P. Forecasting the Ongoing Invasion of Lagocephalus sceleratus in the Mediterranean Sea. Ecol. Modell. 2018, 371, 37–49. [Google Scholar] [CrossRef]
  28. Akyol, O.; Ünal, V.; Ceyhan, T.; Bilecenoglu, M. First Confirmed Record of Lagocephalus sceleratus (Gmelin, 1789) in the Mediterranean Sea. J. Fish Biol. 2005, 66, 1183–1186. [Google Scholar] [CrossRef]
  29. Corsini, M.; Margies, P.; Kondilatos, G.; Economidis, P.S. Three New Exotic Fish Records from the SE Aegean Greek Waters. Sci. Mar. 2006, 70, 319–323. [Google Scholar] [CrossRef]
  30. Kalogirou, S.; Corsini-Foka, M.; Sioulas, A.; Wennhage, H.; Pihl, L. Diversity, Structure and Function of Fish Assemblages Associated with Posidonia oceanica Beds in an Area of the Eastern Mediterranean Sea and the Role of Non-indigenous Species. J. Fish Biol. 2010, 77, 2338–2357. [Google Scholar] [CrossRef]
  31. Cinar, M.E.; Bilecenoglu, M.; Ozturk, Β.; Katagan, Τ.; Yokes, Μ.Β.; Aysel, V.; Dagli, E.; Acik, S.; Ozcan, T.; Erdogan, H. An Updated Review of Alien Species on the Coasts of Turkey. Mediterr. Mar. Sci. 2011, 12, 257. [Google Scholar] [CrossRef]
  32. Bilecenoğlu, M.; Öztürk, B. Possible Intrusion of Lagocephalus sceleratus (Gmelin, 1789) to the Turkish Black Sea Coast. J. Black Sea/Mediterr. Environ. 2018, 24, 272–276. [Google Scholar]
  33. Azzurro, E.; Bariche, M. The Long Reach of the Suez Canal: Lagocephalus sceleratus (Gmelin, 1789) an Unwanted Indo-Pacific Pest at the Atlantic Gate. BioInvasions Rec. 2020, 9, 204–208. [Google Scholar] [CrossRef]
  34. Kosker, A.R.; Özogul, F.; Durmus, M.; Ucar, Y.; Ayas, D.; Regenstein, J.M.; Özogul, Y. Tetrodotoxin Levels in Pufferfish (Lagocephalus sceleratus) Caught in the Northeastern Mediterranean Sea. Food Chem. 2016, 210, 332–337. [Google Scholar] [CrossRef]
  35. Ünal, V.; Bodur, H.G. The Socio-Economic Impacts of the Silver-Cheeked Toadfish on Small-Scale Fishers: A Comparative Study from the Turkish Coast. Su Ürünleri Derg. 2017, 34, 119–127. [Google Scholar] [CrossRef]
  36. Katikou, P.; Georgantelis, D.; Sinouris, N.; Petsi, A.; Fotaras, T. First Report on Toxicity Assessment of the Lessepsian Migrant Pufferfish Lagocephalus sceleratus (Gmelin, 1789) from European Waters (Aegean Sea, Greece). Toxicon 2009, 54, 50–55. [Google Scholar] [CrossRef] [PubMed]
  37. Kalogirou, S. Ecological Characteristics of the Invasive Pufferfish Lagocephalus sceleratus (Gmelin, 1789) in the Eastern Mediterranean Sea—A Case Study from Rhodes. Mediterr. Mar. Sci. 2013, 14, 251. [Google Scholar] [CrossRef]
  38. Golani, D.; Sonin, O. New Records of the Red Sea Fishes, Pterois miles (Scorpaenidae) and Pteragogus pelycus (Labridae) from the Eastern Mediterranean Sea. Jpn. J. Ichthyol. 1992, 39, 167–169. [Google Scholar] [CrossRef]
  39. Dimitriou, A.C.; Chartosia, N.; Hall-Spencer, J.M.; Kleitou, P.; Jimenez, C.; Antoniou, C.; Hadjioannou, L.; Kletou, D.; Sfenthourakis, S. Genetic Data Suggest Multiple Introductions of the Lionfish (Pterois miles) into the Mediterranean Sea. Diversity 2019, 11, 149. [Google Scholar] [CrossRef]
  40. Kimball, M.E.; Miller, J.M.; Whitfield, P.E.; Hare, J.A. Thermal Tolerance and Potential Distribution of Invasive Lionfish (Pterois volitans/miles Complex) on the East Coast of the United States. Mar. Ecol. Prog. Ser. 2004, 283, 269–278. [Google Scholar] [CrossRef]
  41. Barker, B.D.; Horodysky, A.Z.; Kerstetter, D.W. Hot or Not? Comparative Behavioral Thermoregulation, Critical Temperature Regimes, and Thermal Tolerances of the Invasive Lionfish Pterois Sp. versus Native Western North Atlantic Reef Fishes. Biol. Invasions 2018, 20, 45–58. [Google Scholar] [CrossRef]
  42. Morris, J.A.; Whitfield, P.E. Biology, Ecology, Control and Management of the Invasive Indo-Pacific Lionfish: An Updated Integrated Assessment. NOAA Technical Memorandum NOS NCCOS 99; National Oceanic and Atmospheric Administration: Washington, DC, USA, 2009.
  43. Peake, J.; Bogdanoff, A.K.; Layman, C.A.; Castillo, B.; Reale-Munroe, K.; Chapman, J.; Dahl, K.; Patterson Iii, W.F.; Eddy, C.; Ellis, R.D.; et al. Feeding Ecology of Invasive Lionfish (Pterois volitans and Pterois miles) in the Temperate and Tropical Western Atlantic. Biol. Invasions 2018, 20, 2567–2597. [Google Scholar] [CrossRef]
  44. Koilakos, S.M.; Georgatis, I.; Leonardos, I. Feeding Strategies and Biological Traits of the Lessepsian Migrant Pterois miles (Bennett, 1828) in the Messenian Gulf, SW Greece. Fishes 2024, 9, 380. [Google Scholar] [CrossRef]
  45. Kondylatos, G.; Vagenas, G.; Kalaentzis, K.; Mavrouleas, D.; Conides, A.; Karachle, P.K.; Corsini-Foka, M.; Klaoudatos, D. Exploring the Structure of Static Net Fisheries in a Highly Invaded Region: The Case of Rhodes Island (Eastern Mediterranean). Sustainability 2023, 15, 14976. [Google Scholar] [CrossRef]
  46. Guisan, A.; Petitpierre, B.; Broennimann, O.; Daehler, C.; Kueffer, C. Unifying Niche Shift Studies: Insights from Biological Invasions. Trends Ecol. Evol. 2014, 29, 260–269. [Google Scholar] [CrossRef] [PubMed]
  47. Sutherst, R.W. Climate Change and Invasive Species: A Conceptual Framework. In Invasive Species in a Changing World; Island Press: Washington, DC, USA, 2000; pp. 211–240. [Google Scholar]
  48. Jeschke, J.M.; Strayer, D.L. Usefulness of Bioclimatic Models for Studying Climate Change and Invasive Species. Ann. N. Y. Acad. Sci. 2008, 1134, 1–24. [Google Scholar] [CrossRef]
  49. Ficetola, G.F.; Thuiller, W.; Miaud, C. Prediction and Validation of the Potential Global Distribution of a Problematic Alien Invasive Species—The American Bullfrog. Divers. Distrib. 2007, 13, 476–485. [Google Scholar] [CrossRef]
  50. Bidegain, G.; Bárcena, J.F.; García, A.; Juanes, J.A. Predicting Coexistence and Predominance Patterns between the Introduced Manila Clam (Ruditapes philippinarum) and the European Native Clam (Ruditapes decussatus). Estuar. Coast. Shelf Sci. 2015, 152, 162–172. [Google Scholar] [CrossRef]
  51. Peterson, A.T.; Robins, C.R. Using Ecological-Niche Modeling to Predict Barred Owl Invasions with Implications for Spotted Owl Conservation. Conserv. Biol. 2003, 17, 1161–1165. [Google Scholar] [CrossRef]
  52. Mellin, C.; Lurgi, M.; Matthews, S.; MacNeil, M.A.; Caley, M.J.; Bax, N.; Przeslawski, R.; Fordham, D.A. Forecasting Marine Invasions under Climate Change: Biotic Interactions and Demographic Processes Matter. Biol. Conserv. 2016, 204, 459–467. [Google Scholar] [CrossRef]
  53. Carlos-Júnior, L.A.; Barbosa, N.P.U.; Moulton, T.P.; Creed, J.C. Ecological Niche Model Used to Examine the Distribution of an Invasive, Non-Indigenous Coral. Mar. Environ. Res. 2015, 103, 115–124. [Google Scholar] [CrossRef]
  54. Song, T.; Huang, Y.; Fang, L.; Li, Y.; Li, J.; Chang, J. Non-Native Species in Marine Protected Areas: Global Distribution Patterns. Environ. Sci. Ecotechnol. 2024, 22, 100453. [Google Scholar] [CrossRef]
  55. Turan, C. Species Distribution Modelling of Invasive Alien Species; Pterois miles for Current Distribution and Future Suitable Habitats. Glob. J. Environ. Sci. Manag. 2020, 6, 429–440. [Google Scholar] [CrossRef]
  56. Dimitriadis, C.; Galanidi, M.; Zenetos, A.; Corsini-Foka, M.; Giovos, I.; Karachle, P.K.; Fournari–Konstantinidou, I.; Kytinou, E.; Issaris, Y.; Azzurro, E. Updating the Occurrences of Pterois miles in the Mediterranean Sea, with Considerations on Thermal Boundaries and Future Range Expansion. Mediterr. Mar. Sci. 2020, 21, 62–69. [Google Scholar] [CrossRef]
  57. Marine|Copernicus. Available online: https://www.copernicus.eu/en/copernicus-services/marine (accessed on 27 March 2025).
  58. Escudier, R.; Clementi, E.; Omar, M.; Cipollone, A.; Pistoia, J.; Aydogdu, A.; Drudi, M.; Grandi, A.; Lyubartsev, V.; Lecci, R.; et al. Mediterranean Sea Physical Reanalysis (CMEMS MED-Currents) (Version 1) [Data Set]; Copernicus Marine Environment Monitoring Service: Toulouse, France, 2020. [Google Scholar] [CrossRef]
  59. Escudier, R.; Clementi, E.; Cipollone, A.; Pistoia, J.; Drudi, M.; Grandi, A.; Lyubartsev, V.; Lecci, R.; Aydogdu, A.; Delrosso, D. A High Resolution Reanalysis for the Mediterranean Sea. Front. Earth Sci. 2021, 9, 702285. [Google Scholar] [CrossRef]
  60. Nigam, T.; Escudier, R.; Pistoia, J.; Aydogdu, A.; Omar, M.; Clementi, E.; Cipollone, A.; Drudi, M.; Grandi, A.; Mariani, A.; et al. Mediterranean Sea Physical Reanalysis INTERIM (CMEMS MED-Currents, E3R1i System) (Version 1) [Data Set]; Copernicus Marine Environment Monitoring Service: Toulouse, France, 2021. [Google Scholar] [CrossRef]
  61. Escudier, R.; Clementi, E.; Nigam, T.; Pistoia, J.; Grandi, A.; Aydogdu, A.; Miraglio, P. Synthesis Quality Overview Document (SQO) for Mediterranean Sea Physics Reanalysis; Copernicus Marine Environment Monitoring Service: Toulouse, France, 2024. [Google Scholar]
  62. Teruzzi, A.; Di Biagio, V.; Feudale, L.; Bolzon, G.; Lazzari, P.; Salon, S.; Coidessa, G.; Cossarini, G. Mediterranean Sea Biogeochemical Reanalysis (CMEMS MED-Biogeochemistry, MedBFM3 System) (Version 1) [Data Set]; Copernicus Marine Environment Monitoring Service: Toulouse, France, 2021. [Google Scholar] [CrossRef]
  63. Cossarini, G.; Feudale, L.; Teruzzi, A.; Bolzon, G.; Coidessa, G.; Solidoro, C.; Di Biagio, V.; Amadio, C.; Lazzari, P.; Brosich, A. High-Resolution Reanalysis of the Mediterranean Sea Biogeochemistry (1999–2019). Front. Mar. Sci. 2021, 8, 741486. [Google Scholar] [CrossRef]
  64. Lecci, Ρ.; Drudi, Μ.; Grandi, A.; Clementi, Ε. Product User Manual for Mediterranean Sea Physical Reanalysis Product, EU Copernicus Marine Service—Public Ref: CMEMS-MED-PUM-006-004; Copernicus Marine Environment Monitoring Service: Toulouse, France, 2024. [Google Scholar]
  65. Teruzzi, A.; Di Biagio, V.; Feudale, L.; Bolzon, G.; Lazzari, P.; Salon, S.; Coidessa, G.; Cossarini, G. Quality Information Document for MED MFC Products MEDSEA_MULTIYEAR_BGC_006_008, Ref: CMEMS-MED-QUID-006-008, Issue 3.2; Copernicus Marine Service: Toulouse, France, 2022. [Google Scholar]
  66. Volpe, G.; Colella, S.; Brando, V.E.; Forneris, V.; La Padula, F.; Di Cicco, A.; Sammartino, M.; Bracaglia, M.; Artuso, F.; Santoleri, R. Mediterranean Ocean Colour Level 3 Operational Multi-Sensor Processing. Ocean Sci. 2019, 15, 127–146. [Google Scholar] [CrossRef]
  67. Berthon, J.-F.; Zibordi, G. Bio-Optical Relationships for the Northern Adriatic Sea. Int. J. Remote Sens. 2004, 25, 1527–1532. [Google Scholar] [CrossRef]
  68. Colella, S.; Böhm, E.; Cesarini, C.; Jutard, Q.; VE, B. Product User Manual for Ocean Colour Products, EU Copernicus Marine Service—Public Ref: CMEMS-OC-PUM-5.0; Copernicus Marine Environment Monitoring Service: Toulouse, France, 2024. [Google Scholar]
  69. NASA Ocean Biology Processing Group. Sea-viewing Wide Field-of-view Sensor (SeaWiFS) Level-2 Ocean Color Data, version R2018.8; NASA Ocean Biology Distributed Active Archive Center: Greenbelt, MD, USA, 2018. [Google Scholar] [CrossRef]
  70. NASA Ocean Color. Available online: https://oceancolor.gsfc.nasa.gov/resources/atbd/sst/ (accessed on 15 May 2025).
  71. QGIS Development Team. QGIS Geographic Information System (Version 3.44.2) [Computer software]. Open Source Geospatial Foundation. 2025. Available online: https://www.qgis.org (accessed on 15 May 2025).
  72. Şahin, M.; Aybek, E. Jamovi: An Easy to Use Statistical Software for the Social Scientists. Int. J. Assess. Tools Educ. 2019, 6, 670–692. [Google Scholar] [CrossRef]
  73. Hampton, R.E.; Havel, J.E. Introductory Biological Statistics; Waveland Press: Long Grove, IL, USA, 2006; ISBN 1577663802. [Google Scholar]
  74. Figard, S. Introduction to Biostatistics with JMP; SAS Institute: Cary, NC, USA, 2019; ISBN 1635267188. [Google Scholar]
  75. Sall, J.; Stephens, M.L.; Lehman, A.; Loring, S. JMP Start Statistics: A Guide to Statistics and Data Analysis Using JMP; Sas Institute: Cary, NC, USA, 2017; ISBN 1629608785. [Google Scholar]
  76. Gareth, J.; Witten, D.; Hastie, T.; Tibshirani, R. An Introduction to Statistical Learning; Springer: Berlin/Heidelberg, Germany, 2013; Volume 112. [Google Scholar]
  77. Zhu, J.-J.; Yang, M.; Ren, Z.J. Machine Learning in Environmental Research: Common Pitfalls and Best Practices. Environ. Sci. Technol. 2023, 57, 17671–17689. [Google Scholar] [CrossRef]
  78. Demšar, J.; Curk, T.; Erjavec, A.; Gorup, Č.; Hočevar, T.; Milutinovič, M.; Možina, M.; Polajnar, M.; Toplak, M.; Starič, A. Orange: Data Mining Toolbox in Python. J. Mach. Learn. Res. 2013, 14, 2349–2353. [Google Scholar]
  79. Ruder, S. An Overview of Gradient Descent Optimization Algorithms. arXiv 2016, arXiv:1609.04747. [Google Scholar]
  80. Bottou, L. Stochastic Gradient Descent Tricks. In Neural Networks: Tricks of the Trade, 2nd ed.; Springer: Berlin/Heidelberg, Germany, 2012; pp. 421–436. [Google Scholar]
  81. Noble, W.S. What Is a Support Vector Machine? Nat. Biotechnol. 2006, 24, 1565–1567. [Google Scholar] [CrossRef]
  82. Pisner, D.A.; Schnyer, D.M. Chapter 6—Support Vector Machine. In Machine Learning: Methods and Applications to Brain Disorders; Mechelli, A., Vieira, S., Eds.; Academic Press: Cambridge, MA, USA, 2020; pp. 101–121. ISBN 978-0-12-815739-8. [Google Scholar]
  83. Wallisch, P.; Lusignan, M.E.; Benayoun, M.D.; Baker, T.I.; Dickey, A.S.; Hatsopoulos, N.G. Chapter 36—Neural Networks Part I: Unsupervised Learning. In MATLAB for Neuroscientists: An Introduction to Scientific Computing in MATLAB, 2nd ed.; Wallisch, P., Lusignan, M.E., Benayoun, M.D., Baker, T.I., Dickey, A.S., Hatsopoulos, N., Eds.; Academic Press: San Diego, CA, USA, 2014; pp. 489–500. ISBN 978-0-12-383836-0. [Google Scholar]
  84. Politikos, D.V.; Petasis, G.; Chatzispyrou, A.; Mytilineou, C.; Anastasopoulou, A. Automating Fish Age Estimation Combining Otolith Images and Deep Learning: The Role of Multitask Learning. Fish. Res. 2021, 242, 106033. [Google Scholar] [CrossRef]
  85. Quinlan, J.R. Induction of Decision Trees. Mach. Learn. 1986, 1, 81–106. [Google Scholar] [CrossRef]
  86. Kotsiantis, S.B.; Zaharakis, I.D.; Pintelas, P.E. Machine Learning: A Review of Classification and Combining Techniques. Artif. Intell. Rev. 2006, 26, 159–190. [Google Scholar] [CrossRef]
  87. Olden, J.D.; Lawler, J.J.; Poff, N.L. Machine Learning Methods Without Tears: A Primer for Ecologists. Q. Rev. Biol. 2008, 83, 171–193. [Google Scholar] [CrossRef]
  88. Hanley, J.A.; McNeil, B.J. The Meaning and Use of the Area under a Receiver Operating Characteristic (ROC) Curve. Radiology 1982, 143, 29–36. [Google Scholar] [CrossRef]
  89. Sokolova, M.; Lapalme, G. A Systematic Analysis of Performance Measures for Classification Tasks. Inf. Process. Manag. 2009, 45, 427–437. [Google Scholar] [CrossRef]
  90. Powers, D.M.W. Evaluation: From Precision, Recall and F-Measure to ROC, Informedness, Markedness and Correlation. arXiv 2020, arXiv:2010.16061. [Google Scholar] [CrossRef]
  91. Matthews, B.W. Comparison of the Predicted and Observed Secondary Structure of T4 Phage Lysozyme. Biochim. Biophys. Acta (BBA)-Protein Struct. 1975, 405, 442–451. [Google Scholar] [CrossRef]
  92. Chicco, D.; Jurman, G. The Advantages of the Matthews Correlation Coefficient (MCC) over F1 Score and Accuracy in Binary Classification Evaluation. BMC Genom. 2020, 21, 6. [Google Scholar] [CrossRef] [PubMed]
  93. Fawcett, T. An Introduction to ROC Analysis. Pattern Recognit. Lett. 2006, 27, 861–874. [Google Scholar] [CrossRef]
  94. Jiménez-Valverde, A. Insights into the Area under the Receiver Operating Characteristic Curve (AUC) as a Discrimination Measure in Species Distribution Modelling. Glob. Ecol. Biogeogr. 2012, 21, 498–507. [Google Scholar] [CrossRef]
  95. Fielding, A.H.; Bell, J.F. A Review of Methods for the Assessment of Prediction Errors in Conservation Presence/Absence Models. Environ. Conserv. 1997, 24, 38–49. [Google Scholar] [CrossRef]
  96. Sofaer, H.R.; Flather, C.H.; Skagen, S.K.; Steen, V.A.; Noon, B.R. Clustering and Ensembling Approaches to Support Surrogate-based Species Management. Divers. Distrib. 2019, 25, 1246–1258. [Google Scholar] [CrossRef]
  97. Lundberg, S.M.; Lee, S.-I. A Unified Approach to Interpreting Model Predictions. Adv. Neural Inf. Process. Syst. 2017, 30. [Google Scholar]
  98. Lundberg, S.M.; Erion, G.; Chen, H.; DeGrave, A.; Prutkin, J.M.; Nair, B.; Katz, R.; Himmelfarb, J.; Bansal, N.; Lee, S.-I. From Local Explanations to Global Understanding with Explainable AI for Trees. Nat. Mach. Intell. 2020, 2, 56–67. [Google Scholar] [CrossRef] [PubMed]
  99. Goutte, C.; Gaussier, E. A Probabilistic Interpretation of Precision, Recall and F-Score, with Implication for Evaluation. In Advances in Information Retrieval, Proceedings of the European Conference on Information Retrieval, Santiago de Compostela, Spain, 21–23 March 2005; Springer: Berlin/Heidelberg, Germany, 2005; pp. 345–359. [Google Scholar]
  100. Davis, J.; Goadrich, M. The Relationship between Precision-Recall and ROC Curves. In Proceedings of the 23rd international Conference on Machine Learning, Pittsburgh, PA, USA, 25–29 June 2006; pp. 233–240. [Google Scholar]
  101. Wisz, M.S.; Guisan, A. Do Pseudo-Absence Selection Strategies Influence Species Distribution Models and Their Predictions? An Information-Theoretic Approach Based on Simulated Data. BMC Ecol. 2009, 9, 8. [Google Scholar] [CrossRef]
  102. Pearce, J.; Ferrier, S. Evaluating the Predictive Performance of Habitat Models Developed Using Logistic Regression. Ecol. Modell. 2000, 133, 225–245. [Google Scholar] [CrossRef]
  103. Tsagarakis, K.; Libralato, S.; Giannoulaki, M.; Touloumis, K.; Somarakis, S.; Machias, A.; Frangoulis, C.; Papantoniou, G.; Kavadas, S.; Stoumboudi, M.T. Drivers of the North Aegean Sea Ecosystem (Eastern Mediterranean) Through Time: Insights From Multidecadal Retrospective Analysis and Future Simulations. Front. Mar. Sci. 2022, 9, 919793. [Google Scholar] [CrossRef]
  104. Taylor, S.J.; Letham, B. Forecasting at Scale. Am. Stat. 2018, 72, 37–45. [Google Scholar] [CrossRef]
  105. R Core Team. R: A Language and Environment for Statistical Computing; R Foundation for Statistical Computing: Vienna, Austria, 2024. [Google Scholar]
  106. Dimitriou, E.; Efstratiadis, A.; Zotou, I.; Papadopoulos, A.; Iliopoulou, T.; Sakki, G.-K.; Mazi, K.; Rozos, E.; Koukouvinos, A.; Koussis, A.D. Post-Analysis of Daniel Extreme Flood Event in Thessaly, Central Greece: Practical Lessons and the Value of State-of-the-Art Water-Monitoring Networks. Water 2024, 16, 980. [Google Scholar] [CrossRef]
  107. Box, G.E.P.; Jenkins, G.M.; Reinsel, G.C.; Ljung, G.M. Time Series Analysis: Forecasting and Control, 3rd ed.; Grant, J., Riker, E., Eds.; John Wiley & Sons: Hoboken, NJ, USA, 2015; ISBN 1118674928. [Google Scholar]
  108. Wickham, H.; Sievert, C. Ggplot2: Elegant Graphics for Data Analysis; Springer: New York, NY, USA, 2009; Volume 10. [Google Scholar]
  109. Hosmer, D.W., Jr.; Lemeshow, S.; Sturdivant, R.X. Applied Logistic Regression, 3rd ed.; John Wiley & Sons: Hoboken, NJ, USA, 2013; ISBN 1118548353. [Google Scholar]
  110. Guisan, A.; Zimmermann, N.E. Predictive Habitat Distribution Models in Ecology. Ecol. Modell. 2000, 135, 147–186. [Google Scholar] [CrossRef]
  111. Elith, J.; Leathwick, J.R.; Hastie, T. A Working Guide to Boosted Regression Trees. J. Anim. Ecol. 2008, 77, 802–813. [Google Scholar] [CrossRef]
  112. Carlton, J.T. Biological Invasions and Cryptogenic Species. Ecology 1996, 77, 1653–1655. [Google Scholar] [CrossRef]
  113. Kolar, C.S.; Lodge, D.M. Progress in Invasion Biology: Predicting Invaders. Trends Ecol. Evol. 2001, 16, 199–204. [Google Scholar] [CrossRef] [PubMed]
  114. Crafton, R.E. Modeling Invasion Risk for Coastal Marine Species Utilizing Environmental and Transport Vector Data. Hydrobiologia 2015, 746, 349–362. [Google Scholar] [CrossRef]
  115. Stachowicz, J.J.; Whitlatch, R.B.; Osman, R.W. Species Diversity and Invasion Resistance in a Marine Ecosystem. Science 1999, 286, 1577–1579. [Google Scholar] [CrossRef] [PubMed]
  116. Mack, R.N.; Simberloff, D.; Mark Lonsdale, W.; Evans, H.; Clout, M.; Bazzaz, F.A. Biotic Invasions: Causes, Epidemiology, Global Consequences, and Control. Ecol. Appl. 2000, 10, 689–710. [Google Scholar] [CrossRef]
  117. Nyberg, C.D.; Wallentinus, I. Can Species Traits Be Used to Predict Marine Macroalgal Introductions? Biol. Invasions 2005, 7, 265–279. [Google Scholar] [CrossRef]
  118. Kimbro, D.L.; Cheng, B.S.; Grosholz, E.D. Biotic Resistance in Marine Environments. Ecol. Lett. 2013, 16, 821–833. [Google Scholar] [CrossRef] [PubMed]
  119. Ricciardi, A.; Hoopes, M.F.; Marchetti, M.P.; Lockwood, J.L. Progress toward Understanding the Ecological Impacts of Nonnative Species. Ecol. Monogr. 2013, 83, 263–282. [Google Scholar] [CrossRef]
  120. Leung, B.; Drake, J.M.; Lodge, D.M. Predicting Invasions: Propagule Pressure and the Gravity of Allee Effects. Ecology 2004, 85, 1651–1660. [Google Scholar] [CrossRef]
  121. Williams, S.L.; Grosholz, E.D. The Invasive Species Challenge in Estuarine and Coastal Environments: Marrying Management and Science. Estuaries Coasts 2008, 31, 3–20. [Google Scholar] [CrossRef]
  122. Varsamos, S.; Nebel, C.; Charmantier, G. Ontogeny of Osmoregulation in Postembryonic Fish: A Review. Comp. Biochem. Physiol. Part A Mol. Integr. Physiol. 2005, 141, 401–429. [Google Scholar] [CrossRef]
  123. Schultz, E.T.; McCormick, S.D. Euryhalinity in an Evolutionary Context; Elsevier: Amsterdam, The Netherlands, 2012; Volume 32. [Google Scholar]
  124. Evans, D.; Claiborne, J.; Currie, S. The Physiology of Fishes, 4th ed.; CRC Press: Boca Raton, FL, USA, 2020; ISBN 100017459X. [Google Scholar]
  125. Bœuf, G.; Payan, P. How Should Salinity Influence Fish Growth? Comp. Biochem. Physiol. Part C Toxicol. Pharmacol. 2001, 130, 411–423. [Google Scholar] [CrossRef]
  126. Katsanevakis, S.; Wallentinus, I.; Zenetos, A.; Leppäkoski, E.; Çinar, M.E.; Oztürk, B.; Grabowski, M.; Golani, D.; Cardoso, A.C. Impacts of Invasive Alien Marine Species on Ecosystem Services and Biodiversity: A Pan-European Review. Aquat. Invasions 2014, 9, 391–423. [Google Scholar] [CrossRef]
  127. Siokou-Frangou, I.; Christaki, U.; Mazzocchi, M.G.; Montresor, M.; Ribera d’Alcalá, M.; Vaqué, D.; Zingone, A. Plankton in the Open Mediterranean Sea: A Review. Biogeosciences 2010, 7, 1543–1586. [Google Scholar] [CrossRef]
  128. Barale, V.; Jaquet, J.-M.; Ndiaye, M. Algal Blooming Patterns and Anomalies in the Mediterranean Sea as Derived from the SeaWiFS Data Set (1998–2003). Remote Sens. Environ. 2008, 112, 3300–3313. [Google Scholar] [CrossRef]
  129. Somero, G.N. The Physiology of Climate Change: How Potentials for Acclimatization and Genetic Adaptation Will Determine ‘Winners’ and ‘Losers’. J. Exp. Biol. 2010, 213, 912–920. [Google Scholar] [CrossRef]
  130. Petihakis, G.; Triantafyllou, G.; Pollani, A.; Koliou, A.; Theodorou, A. Field Data Analysis and Application of a Complex Water Column Biogeochemical Model in Different Areas of a Semi-Enclosed Basin: Towards the Development of an Ecosystem Management Tool. Mar. Environ. Res. 2005, 59, 493–518. [Google Scholar] [CrossRef]
  131. Bousbouras, G.; Angelidis, P. Hydrodynamic Simulation of the Pagasitikos Gulf, Greece. Comput. Water Energy Environ. Eng. 2023, 13, 58–85. [Google Scholar] [CrossRef]
  132. Sabrah, M.; El-Ganainy, A.; Zaky, M.A. Biology and Toxicity of the Pufferfish Lagocephalus sceleratus (Gmelin, 1789) from the Gulf of Suez. Egypt. J. Aquat. Res. 2006, 32, 283–297. [Google Scholar]
  133. Azzurro, E.; Soto, S.; Garofalo, G.; Maynou, F. Fistularia commersonii in the Mediterranean Sea: Invasion History and Distribution Modeling Based on Presence-Only Records. Biol. Invasions 2013, 15, 977–990. [Google Scholar] [CrossRef]
  134. El-Haweet, A.A.K.; Farrag, M.M.S.; Akel, E.-S.A.; Moustafa, M.A. Puffer Fish Catch in the Egyptian Mediterranean Coast “The Challenged Invaders”. Int. J. Ecotoxicol. Ecobiol. 2016, 1, 13–19. [Google Scholar] [CrossRef]
  135. Katsanevakis, S.; Poursanidis, D.; Hoffman, R.; Rizgalla, J.; Rothman, S.B.-S.; Levitt-Barmats, Y.; Hadjioannou, L.; Trkov, D.; Garmendia, J.M.; Rizzo, M. Unpublished Mediterranean Records of Marine Alien and Cryptogenic Species. BioInvasions Rec. 2020, 9, 165–182. [Google Scholar] [CrossRef]
  136. Barnett, T.P.; Pierce, D.W.; AchutaRao, K.M.; Gleckler, P.J.; Santer, B.D.; Gregory, J.M.; Washington, W.M. Penetration of Human-Induced Warming into the World’s Oceans. Science 2005, 309, 284–287. [Google Scholar] [CrossRef] [PubMed]
  137. Poloczanska, E.S.; Brown, C.J.; Sydeman, W.J.; Kiessling, W.; Schoeman, D.S.; Moore, P.J.; Brander, K.; Bruno, J.F.; Buckley, L.B.; Burrows, M.T.; et al. Global Imprint of Climate Change on Marine Life. Nat. Clim. Change 2013, 3, 919–925. [Google Scholar] [CrossRef]
  138. Kress, N.; Thingstad, T.F.; Pitta, P.; Psarra, S.; Tanaka, T.; Zohary, T.; Groom, S.; Herut, B.; Mantoura, R.F.C.; Polychronaki, T. Effect of P and N Addition to Oligotrophic Eastern Mediterranean Waters Influenced by Near-Shore Waters: A Microcosm Experiment. Deep Sea Res. Part II Top. Stud. Oceanogr. 2005, 52, 3054–3073. [Google Scholar] [CrossRef]
  139. Béthoux, J.P.; Morin, P.; Ruiz-Pino, D.P. Temporal Trends in Nutrient Ratios: Chemical Evidence of Mediterranean Ecosystem Changes Driven by Human Activity. Deep Sea Res. Part II Top. Stud. Oceanogr. 2002, 49, 2007–2016. [Google Scholar] [CrossRef]
  140. Sinha, E.; Michalak, A.M.; Balaji, V. Eutrophication Will Increase during the 21st Century as a Result of Precipitation Changes. Science 2017, 357, 405–408. [Google Scholar] [CrossRef]
  141. Raitsos, D.E.; Korres, G.; Triantafyllou, G.; Petihakis, G.; Pantazi, M.; Tsiaras, K.; Pollani, A. Assessing Chlorophyll Variability in Relation to the Environmental Regime in Pagasitikos Gulf, Greece. J. Mar. Syst. 2012, 94, S16–S22. [Google Scholar] [CrossRef]
  142. Reale, M.; Cossarini, G.; Lazzari, P.; Lovato, T.; Bolzon, G.; Masina, S.; Solidoro, C.; Salon, S. Acidification, Deoxygenation, and Nutrient and Biomass Declines in a Warming Mediterranean Sea. Biogeosciences 2022, 19, 4035–4065. [Google Scholar] [CrossRef]
  143. Kanellopoulos Theodore, D.; Georgios, P.; Alexandra, P.; Eleni, R.; Ioannis, H.; Catherine, T.; Nikolaos, K.; Sofia, R.; Ioanna, V.; Angeliki, M. The Semi-Enclosed Pagassitikos Gulf Under the Impact of Human Activities. In The Handbook of Environmental Chemistry; Springer Nature: Berlin/Heidelberg, Germany, 2024. [Google Scholar] [CrossRef]
  144. Dimarchopoulou, D.; Keramidas, I.; Tsagarakis, K.; Tsikliras, A.C. Ecosystem Models and Effort Simulations of an Untrawled Gulf in the Central Aegean Sea. Front. Mar. Sci. 2019, 6, e00648. [Google Scholar] [CrossRef]
  145. Finch, M.W.; Ballenger, J.C.; Bacheler, N.M.; Bubley, W.J. Tracking an Invasion: How the Distribution and Abundance of Lionfish (Pterois spp.) Has Changed along the US Atlantic Coast. Biol. Invasions 2024, 26, 1669–1683. [Google Scholar] [CrossRef]
  146. Ojaveer, H.; Galil, B.S.; Minchin, D.; Olenin, S.; Amorim, A.; Canning-Clode, J.; Chainho, P.; Copp, G.H.; Gollasch, S.; Jelmert, A.; et al. Ten Recommendations for Advancing the Assessment and Management of Non-Indigenous Species in Marine Ecosystems. Mar. Policy 2014, 44, 160–165. [Google Scholar] [CrossRef]
  147. Thuiller, W.; Lafourcade, B.; Engler, R.; Araújo, M.B. BIOMOD—A Platform for Ensemble Forecasting of Species Distributions. Ecography 2009, 32, 369–373. [Google Scholar] [CrossRef]
  148. Hao, T.; Elith, J.; Guillera-Arroita, G.; Lahoz-Monfort, J.J. A Review of Evidence about Use and Performance of Species Distribution Modelling Ensembles like BIOMOD. Divers. Distrib. 2019, 25, 839–852. [Google Scholar] [CrossRef]
  149. Guisan, A.; Thuiller, W.; Zimmermann, N.E. Habitat Suitability and Distribution Models: With Applications in R; Cambridge University Press: Cambridge, UK, 2017; ISBN 0521765137. [Google Scholar]
  150. Araújo, M.B.; Luoto, M. The Importance of Biotic Interactions for Modelling Species Distributions under Climate Change. Glob. Ecol. Biogeogr. 2007, 16, 743–753. [Google Scholar] [CrossRef]
  151. Wisz, M.S.; Pottier, J.; Kissling, W.D.; Pellissier, L.; Lenoir, J.; Damgaard, C.F.; Dormann, C.F.; Forchhammer, M.C.; Grytnes, J.; Guisan, A. The Role of Biotic Interactions in Shaping Distributions and Realised Assemblages of Species: Implications for Species Distribution Modelling. Biol. Rev. 2013, 88, 15–30. [Google Scholar] [CrossRef] [PubMed]
  152. Cowen, R.K.; Sponaugle, S. Larval Dispersal and Marine Population Connectivity. Ann. Rev. Mar. Sci. 2009, 1, 443–466. [Google Scholar] [CrossRef] [PubMed]
  153. Vergés, A.; Steinberg, P.D.; Hay, M.E.; Poore, A.G.B.; Campbell, A.H.; Ballesteros, E.; Heck, K.L., Jr.; Booth, D.J.; Coleman, M.A.; Feary, D.A. The Tropicalization of Temperate Marine Ecosystems: Climate-Mediated Changes in Herbivory and Community Phase Shifts. Proc. R. Soc. B Biol. Sci. 2014, 281, 20140846. [Google Scholar] [CrossRef] [PubMed]
  154. Giakoumi, S.; Katsanevakis, S.; Albano, P.G.; Azzurro, E.; Cardoso, A.C.; Cebrian, E.; Deidun, A.; Edelist, D.; Francour, P.; Jimenez, C. Management Priorities for Marine Invasive Species. Sci. Total Environ. 2019, 688, 976–982. [Google Scholar] [CrossRef]
  155. Simberloff, D.; Martin, J.-L.; Genovesi, P.; Maris, V.; Wardle, D.A.; Aronson, J.; Courchamp, F.; Galil, B.; García-Berthou, E.; Pascal, M.; et al. Impacts of Biological Invasions: What’s What and the Way Forward. Trends Ecol. Evol. 2013, 28, 58–66. [Google Scholar] [CrossRef]
  156. Dormann, C.F.; Purschke, O.; Marquez, J.R.G.; Lautenbach, S.; Schroeder, B. Components of Uncertainty in Species Distribution Analysis: A Case Study of the Great Grey Shrike. Ecology 2008, 89, 3371–3386. [Google Scholar] [CrossRef]
  157. Gallien, L.; Douzet, R.; Pratte, S.; Zimmermann, N.E.; Thuiller, W. Invasive Species Distribution Models–How Violating the Equilibrium Assumption Can Create New Insights. Glob. Ecol. Biogeogr. 2012, 21, 1126–1136. [Google Scholar] [CrossRef]
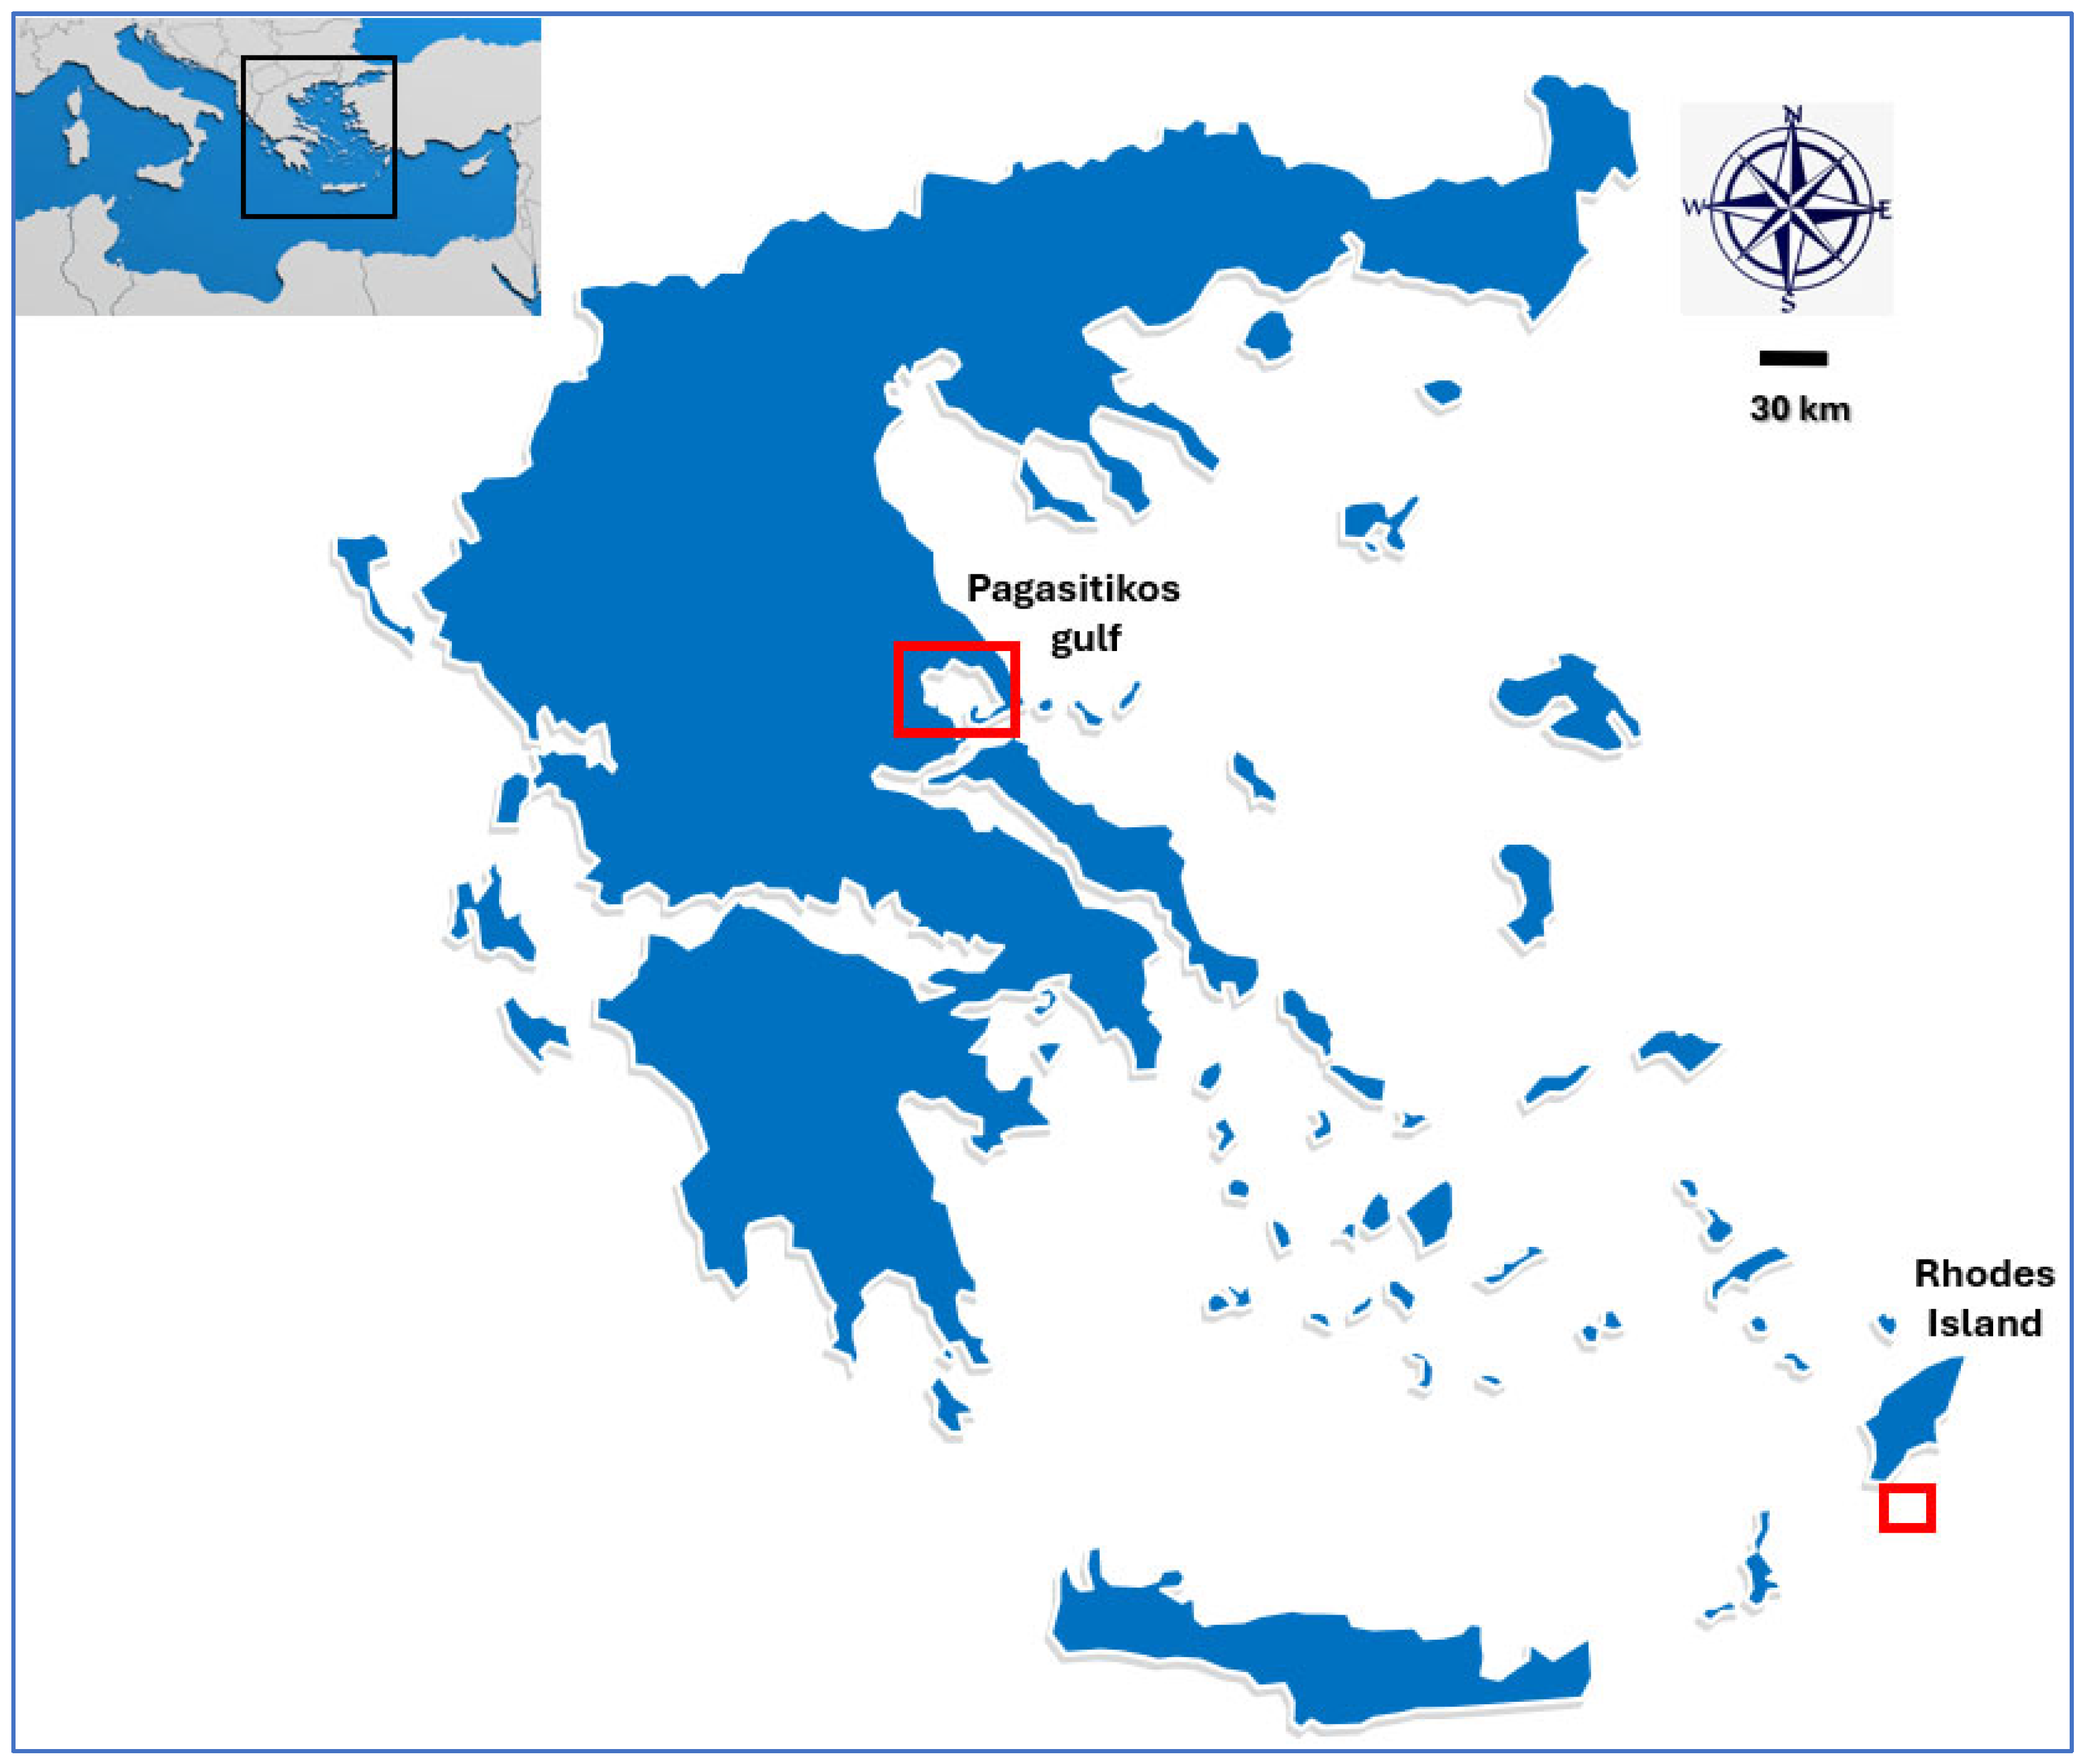
Figure 1. Map of Greece showing the study areas where data were collected (red squares). The black square indicates the location of Greece in the Mediterranean Sea.
Geosciences 15 00361 g001
Figure 2. The workflow of the process used for the predictive analysis of supervised ML algorithms. The shapes represent the following: rectangles—data processing steps; ovals—start points; diamonds—decisions; and parallelograms—input and output. The colors represent the following: blue—data-related processes; green—model training and development; orange—evaluation and testing; and purple—deployment and monitoring.
Geosciences 15 00361 g002
Figure 3. Nominal logistic curves (black lines), threshold values, and 95% confidence intervals (indicated by red dotted lines) showing the effects of (A) bottom temperature and (B) salinity on the probability of presence for L. sceleratus. Gray shaded areas represent confidence intervals.
Geosciences 15 00361 g003
Figure 4. Nominal logistic curves (black lines), threshold values, and 95% confidence intervals (indicated by red dotted lines) showing the effects of (A) bottom temperature and (B) salinity on the probability of presence for P. miles. Gray shaded areas represent confidence intervals.
Geosciences 15 00361 g004
Figure 5. Performance metrics used to compare (A) L. sceleratus and (B) P. miles model performance (area under receiver-operating curve (AUC), classification accuracy (CA), weighted harmonic mean of precision and recall (F1), the proportion of true positives among instances classified as positive (Prec), proportion of true positives (recall), and the Matthews correlation coefficient (MCC), acquired from stratified 10-fold cross-validation for the prediction of species presence for each model and species.
Geosciences 15 00361 g005
Figure 6. Explanation of (A) the neural network algorithm for L. sceleratus and (B) P. miles, and which features contribute the most and how they contribute toward the prediction of each species’ presence.
Geosciences 15 00361 g006
Figure 7. Decision tree for predicting the establishment of L. sceleratus in the Mediterranean Sea using bottom water temperature (Bot_Temp, °C) and salinity (Sal, psu) as predictors. Nodes are colored based on the majority prediction: blue for “No” (non-establishment) and red for “Yes” (establishment).
Geosciences 15 00361 g007
Figure 8. Decision tree for predicting the establishment of P. miles in the Mediterranean Sea using bottom water temperature (Bot_Temp, °C) and salinity (Sal, psu) as predictors. Nodes are colored based on the majority prediction: blue for “No” (non-establishment) and red for “Yes” (establishment).
Geosciences 15 00361 g008
Figure 9. Time series analysis applied to the Pagasitikos Gulf historical data using the Prophet time series model for (A) surface temperature and (B) bottom temperature. The blue line indicates forecasted values, black dots indicate data points, the red line denotes the trend, and the gray area represents the 95% confidence interval.
Geosciences 15 00361 g009
Figure 10. Time series analysis applied to the Pagasitikos Gulf historical data using the Prophet time series model for (A) salinity; (B) dissolved oxygen; (C) pH; and (D) chlorophyll a. The blue line indicates forecasted values, black dots indicate data points, the red line denotes the trend, and the gray area represents the 95% confidence interval.
Geosciences 15 00361 g010
Figure 11. Time series analysis applied to the Pagasitikos Gulf historical data using the Prophet time series model for (A) nitrate (NO3); (B) ammonium (NH4); and (C) phosphate (PO4). The blue line indicates forecasted values, black dots indicate data points, the red line denotes the trend, and the gray area represents the 95% confidence interval.
Geosciences 15 00361 g011
Figure 12. Individual parameter suitability trends for (A) L. sceleratus and (B) P. miles in the Pagasitikos Gulf from 2025 to 2035. Red bars indicate the achievement of environmental threshold values for each species in the Pagasitikos Gulf between 2025 and 2035.
Geosciences 15 00361 g012
Figure 13. Composite weighted suitability dynamics for (A) L. sceleratus and (B) P. miles in the Pagasitikos Gulf. The blue line indicates the predicted number of parameters meeting the establishment threshold for each species in the Pagasitikos Gulf between 2025 and 2035.
Geosciences 15 00361 g013
Figure 14. The critical establishment windows for (A) L. sceleratus and (B) P. miles in the Pagasitikos Gulf. Red lines indicate the threshold for establishment; green lines indicate the predicted variation of each environmental parameter in the Pagasitikos Gulf (2025–2035). Legends above each parameter indicate the environmental preference for each species.
Geosciences 15 00361 g014
Table 1. The environmental data acquired and the associated measuring units, where O2, Chl_a, NH4, NO3, and PO4 represent the concentrations of dissolved oxygen, chlorophyll a, ammonium, nitrate, and phosphate, respectively, in the water.
ParameterMeasuring Unit
Surface Temperature°C
Bottom Temperature°C
Salinitypsu
pH−log[H+]
O2mmol/m3
Chl_amg/m3
NH4mmol/m3
NO3mmol/m3
PO4mmol/m3
Table 2. Composite performance scores across models for each species.
L. sceleratus
ModelWeighted Avg 1Rank Score 2Ecological Utility 3
Neural Network0.7218 (1st)0.45
SVM0.715 (2nd)0.43
SGD0.6510 (3rd)0.38
Decision Tree0.618 (4th)0.35
P. miles
ModelWeighted Avg 1Rank Score 2Ecological Utility 3
Neural Network0.75417 (1st)0.52
SVM0.74914 (2nd)0.51
SGD0.74013 (3rd)0.53
Decision Tree0.6507 (4th)0.37
1. Weighted average: AUC (30%), F1 (20%), recall (20%), MCC (20%, normalized), CA (10%). 2. Rank score: sum of ranks per metric (1st = 3 pts, 2nd = 2 pts, 3rd = 1 pt). 3. Ecological Utility: AUC × Recall × MCC (prioritizes detection robustness).
Table 3. A comparison of environmental parameters between the Pagasitikos Gulf (January 2000–January 2025) and Rhodes Island (January 2000–January 2025). Data are mean values ± standard error. Difference indicates significance level (***: p < 0.001).
ParameterPagasitikos GulfRhodes IslandDifference
Surface Temperature (°C)19.87 ± 0.2921.43 ± 0.19***
Bottom Temperature (°C)15.46 ± 0.0916.66 ± 0.03***
Salinity (psu)38.04 ± 0.0239.25 ± 0.007***
O2 (mmol/m3)236.00 ± 0.68219.11 ± 0.51***
pH (−log[H+])8.15 ± 0.0048.07 ± 0.003***
Chl_a (mg/m3)0.48 ± 0.0290.06 ± 0.001***
NH4 (mmol/m3)0.08 ± 0.0020.11 ± 0.001***
NO3 (mmol/m3)0.18 ± 0.0090.72 ± 0.016***
PO4 (mmol/m3)0.006 ± 0.0010.012 ± 0.001***
Table 4. Thresholds for environmental factors limiting establishment in the Pagasitikos Gulf.
Key Environmental ParametersThreshold for Establishment
P. miles
Threshold for Establishment
L. sceleratus
Chlorophyll a≤0.1052 mg/m3≤0.1774 mg/m3
Bottom Temperature≥16.382 °C≥15.84 °C
pH≤8.1531≤8.249
Salinity≥39.144 psu≥39.096 psu
Dissolved Oxygen≤229.07 mmol/m3≤255.37 mmol/m3
Phosphate:≤0.05329 mmol/m3
Table 5. Comparison between the Pagasitikos Gulf observed (January 2000–January 2025) and modeled (February 2025–January 2035) environmental parameters. Values indicate mean and standard deviation; difference indicates significance level (ns: not significant; *: p < 0.05; ** p < 0.01; ***: p < 0.001).
ParameterObservedModeledDifference
Surface Temperature (°C)19.87 ± 5.1821.15 ± 5.15**
Bottom Temperature (°C)15.46 ± 1.6917.06 ± 1.58***
Salinity (psu)38.03 ± 0.3637.45 ± 0.31***
O2 (mmol/m3)235.99 ± 11.73228.79 ± 11.49***
pH (−log[H+])8.16 ± 0.078.13 ± 0.07*
Chl_a (mg/m3)0.48 ± 0.500.96 ± 0.23***
NO3 (mmol/m3)0.19 ± 0.160.06 ± 0.05***
NH4 (mmol/m3)0.08 ± 0.040.07 ± 0.03***
PO4 (mmol/m3)0.0066 ± 0.0020.0062 ± 0.001ns
Disclaimer/Publisher’s Note: The statements, opinions and data contained in all publications are solely those of the individual author(s) and contributor(s) and not of MDPI and/or the editor(s). MDPI and/or the editor(s) disclaim responsibility for any injury to people or property resulting from any ideas, methods, instructions or products referred to in the content.