Article

Gravity Rate of Change Due to Slow Tectonics: Insights from Numerical Modeling

Department of Earth Sciences “A. Desio”, Università degli Studi di Milano, 20134 Milan, Italy
*
Author to whom correspondence should be addressed.
Geosciences 2025, 15(9), 359; https://doi.org/10.3390/geosciences15090359
Submission received: 31 July 2025 / Revised: 2 September 2025 / Accepted: 10 September 2025 / Published: 13 September 2025
(This article belongs to the Section Geophysics)

Abstract

Gravity anomalies caused by tectonics are commonly assumed to be static, based on the argument that the motions are slow enough for the induced mass changes over time to be negligible. We exploit this concept in the context of rifting and subduction by showing that the horizontal motions of density contrasts occurring at active and passive margins are responsible for sizable amounts of gravity rate of change. These findings are obtained via 2D finite element modeling of the two tectonic mechanisms in a vertical cross-section perpendicular to the ocean–continent transition as well as through evaluating the time-dependent gravity disturbance at a reference height caused by mass readjustment underneath. This disturbance originates from deep-seated changing density anomalies and dynamic topography with respect to a reference normal Earth. The gravity rate of change is proven to scale linearly with extensional and trench migration velocity; the peak-to-peak values between the largest maxima and minima are 0.08 μGal/yr and 0.21 μGal/yr, for a velocity of 1 cm/yr. For both tectonic mechanisms, the dominant positive rate of change is due to the horizontal motion of a density contrast of about 300–400 kg/m3. We also consider the role of dynamic topography in comparison to that of deep-seated changing density anomalies.

1. Introduction

Every mass redistribution on our planet due to dynamic processes induces a variation in the Earth’s gravity field over time. This variation can be measured through space missions, and can be studied to deepen our knowledge of the interior of our planet in terms of density and viscosity. In the field of solid Earth geophysics, a wide literature has been developed over the past decades regarding the gravity signature of various processes and how it varies over time at different temporal and spatial scales. However, most of these studies focus on processes characterized by short to intermediate time scales, such as co- and post-seismic deformation [1,2,3,4,5,6], Post-Glacial Rebound (PGR) [7,8,9,10], and Glacial Isostatic Adjustment (GIA) [11], as well as on the impact of the variations in the length of day [12] or that of the decrease in the geometrical flattening of the Earth [13,14].
Analysis of the static gravity and geoid patterns associated with slow processes has made possible advancements in understanding the internal structure of our planet. A series of works, from the pioneering works of the eighties and the nineties [15,16,17] to more recent ones [18,19,20,21], has focused on the relationships between the stationary components of the gravity and geoid signatures induced by tectonic processes occurring on a time scale of millions of years (e.g., subduction, rifting and mantle convection). In contrast, the study of variations in geoid signatures over time due to these processes has received less attention, with only very recent efforts focusing on the time-dependent gravitational signatures of rifting [22] and mantle wedge dynamics during subduction [23], including plate coupling [23,24]. We believe that the real challenge for the future is to be able to measure what is not measurable today, for example, the variations induced by slow tectonic processes as evaluated in the present work.
De facto, slow tectonic processes are only considered in terms of their contribution to the static component of the Earth’s gravity field. This is because it is generally believed that mass changes during slow tectonic processes are slow enough that they do not produce significant gravity changes during our lifetime. In this work, we take a step beyond this simplification in the cases of rifting and subduction with trench migration. We focus on the horizontal centimeter-level motion of the masses that occurs in proximity to ocean–continent transitions and analyze the contribution to the gravity rate of change, either from the deep-seated density anomalies or from surface dynamic topography, wondering whether the induced gravity rate of change can be measured at the Earth’s surface.
We analyze the interplay between changes in gravity and changes in dynamic topography over time. This provides a regional-scale complement to global studies on the role of lateral viscosity variations obtained from the inversion of global mantle flow based on the static gravity field and dynamic topography [25]. In [25], the authors focused on using gravity gradients of the static field at the global scale to constrain lateral viscosity variations. Instead, we are concerned with the time variations of the gravity gradients, bathymetry, and positive topography, which are responsible for changes in gravity over time at the regional scale.
Through our analysis, we aim to contribute to bridging the time scale gap between the static gravity field (measured by, e.g., the GOCE mission [26,27]), as was considered in [23] for the static gravity field at subduction zones, and the transient gravity field (measured by, e.g., the GRACE mission [28,29]) due to fast tectonic processes such as co- and post-seismic deformation [3,5] working on time scales of 10 ÷ 102 yr.
We would like to underline that this work is not intended to prove the obvious, that is, that slow tectonics produces variations in the gravitational field. Rather, we address the question of whether the rate of change in gravity induced by slow tectonics can be measured on the Earth’s surface, or in other words, how accurate the mission must be in order to detect variations induced by slow tectonics.

2. Methods

To investigate the gravity rate of change driven by rifting and subduction, we use the approach developed in [18] and more recently used to analyze the gravity signature at the Mariana and Sumatra subduction contexts [23] and at the Aden area of rifting [22]. Thus, we first develop 2D finite element modeling of rifting and subduction processes and calculate the mass anomalies driven by both processes. Second, we estimate the gravitational contribution of the modeled density anomalies at each time step and the gravity rate of change, considering the gravitational contribution at successive time steps for the latter.

2.1. Two-Dimensional Finite Element Modeling

We use the FALCON finite element code [30,31], which numerically integrates the balance equations for an incompressible visco-plastic medium in the following form:
· u = 0
· σ + ρ g = 0
ρ 0 C p T t + u · T = · K T + ρ H + 2 μ ϵ ˙ : ϵ α T ρ g u y
where u is the velocity, σ is the stress tensor, ρ is the density, g is the gravitational acceleration vector, C p is the isobaric heat capacity, T is the temperature, t is the time, K is the thermal conductivity, H is the volumetric heat production, μ is the effective viscosity, ϵ ˙ is the strain rate tensor, and α is the thermal expansion coefficient.
The mass distribution responsible for gravity disturbances and gravity rate of change is obtained in a 2D Cartesian domain perpendicular to the strike of the reference tectonic structures, discretized by means of quadrilateral bilinear velocity-constant pressure elements and with dimensions varying from 5 × 5 km, to 1 × 1 km.
A weak compressibility of the medium is accounted for by using the penalty formulation and replacing Equation (1) with the following equation:
· u = p λ
where λ is the penalty coefficient, which is fixed for each element e to 10 6 μ ( e ) of the particle-in-cell method. A regularly distributed swarm of Lagrangian markers covers the entire domain, with a density of 12 to 20 markers per element, and their advection is performed by means of a second-order Runge–Kutta scheme in space. The elemental properties, with the exception of viscosity, are calculated as the arithmetical average on all the markers inside each element. Elemental viscosity is instead calculated as a geometric average of the effective viscosity on the markers inside each element. The effective viscosity is computed as
μ e f f = m i n ( μ c p , μ p ) ,
where μ c p is the creep-viscosity, calculated as the harmonic average between linear and nonlinear viscosities μ d f and μ d s , respectively:
μ c p = 1 μ d f 1 μ d s 1
with
μ d f = d m A d f 1 e Q d f + p V d f R T
μ d s = A d s 1 / n d s ϵ ˙ 1 + 1 / n d s e Q d s + p V d s n d s R T
and where μ p is the plastic-viscosity defined through the Drucker–Prager plasticity criterion:
μ p = p s i n ϕ + c c o s ϕ 2 ϵ ˙ e
where c is the cohesion, ϕ is the angle of friction, and ϵ ˙ e is the effective strain rate. The effective viscosity is allowed to vary in the range between 10 19 Pa s and 10 25 Pa s. Strain softening is taken into account for both plasticity and viscous creep. Melting and serpentinization are also allowed.
Topography is allowed to deform using the arbitrary Lagrangian–Eulerian formulation [32].
Table 1 and Table 2 list the values of the parameters used in the present analysis.
For further details concerning the numerical code, the reader is referred to [30].

2.1.1. Model Setup—Rifting

For rifting models, we use an experimental domain of 1200 × 600 km (Figure 1a) with a minimum numerical resolution of 5 × 5 km at the bottom and the borders, a horizontal refinement towards the center, and a vertical refinement toward the surface, where the maximum resolution is 1 × 1 km. For time steps, we use the Courant–Friedrichs–Lewy (CFL) condition with a Courant number of 0.25.
We consider a thickness of 25 km for the upper crust, 10 km for the lower crust, and 65 km for the lithospheric mantle layer, resulting in a 100 km thick lithosphere on top of the asthenosphere. To localize the initial deformation in the center of the model domain, we use a weak seed of 6 × 6 km located at the top of the lithospheric mantle. The initial temperature profile is a steady-state geotherm with a fixed surface temperature of 273 K and a temperature of 823 K at the bottom of the crust, increasing to 1603 K at the bottom of the lithosphere. The temperature in the asthenosphere is constant down to the bottom of the numerical domain. At the start of the model, a constant outflow velocity of 0.5, 1, and 1.5 cm/yr is respectively set for different models along both vertical boundaries from the surface down to the bottom of the lithosphere. These velocities match many of the extensional environments on Earth, including the East African Rift [33] and the Gulf of Aden [22].
A constant inflow velocity along the vertical boundaries in the asthenosphere and a linear transitional zone of 100 km are set such that the net material flux along the vertical boundaries is 0.

2.1.2. Model Setup—Subduction

For subduction models, we use a 2D domain of 1200 km × 700 km (Figure 1b) with a homogeneous resolution of 2.5 × 2.5 km. The continental crust is 30 km thick, stratified by 21 km of wet quartzite above and 9 km of wet anorthite at the bottom. The oceanic crust is 9 km thick, stratified into 5 km of antigorite above and 4 km of microgabbro at the bottom. The lithospheric mantle is made of dry olivine, and is 90 km thick under the continental domain and 81 km thick under the oceanic one. The erosion and sedimentation process allows for the introduction of sediments made of wet quartzite during model evolution. The initial temperature profile is a steady-state geotherm with a fixed surface temperature of 288.15 K, linearly increasing to 1603.15 K at the base of the lithosphere. The temperature in the asthenosphere remains uniform down to the bottom of the domain. A convergence with a velocity of 1 cm/yr, 3 cm/yr, or 5 cm/yr is applied at the lateral boundaries of the lithosphere. These velocities, which are applied to each edge of the model, reflect those observed on Earth and provide a velocity of trench migration that is consistent with the majority of subduction zones exhibiting trench migration. This could be representative of the western Pacific in the Indo-Atlantic hotspot reference frame or no-net-rotation reference frame (see Figure 1 in [34]). To ensure mass conservation, after a 120 km thick transition zone, a divergence velocity is applied at the remaining lateral boundary. The convergence velocity is applied on both the lateral boundaries for the models with the trench retreat; for the models with a fixed trench, it is applied only at the oceanic lithosphere. In this latter case, the lateral boundary at the continental side is free-slip.
Table 2. Values of the rheological parameters used in the present analysis.
Diffusion Creep dfDislocation Creep dsPlasticity
Pre-Exponential Factor Activation Energy Activation Volume Grain Size Exponent Grain Size Pre-Exponential Factor Activation Energy Activation Volume Stress Exponent Friction Angle Cohesion
AdfQdfVdfmdAdsQdsVdsndsϕc
Layer Flow Law (10−17 Pa/s) (103 J/mol) (10−6 m3/mol) - (10−3 mm) (10−17 Pa/s) (103 J/mol) (10−6 m3/mol) - (°) (MPa)
Sediments Wet Quartzite 1,2----- 8.57 × 10−112230.04.0
Upper Continental Crust Wet Quartzite 1,2-----8.57 × 10−112230.04.0
Lower Continental CrustrmColumbia Diabase 3 6.08 × 10−23006.03.05.01.19 × 10−94850.04.7
smWet Anorthite 1-----0.7133450.03.0
Upper Oceanic CrustrmMicrogabbro 4-----1.99 × 1064970.03.45–254–20
smAntigorite 5-----1.39 × 10−20893.23.8
Lower Oceanic Crustrm---------
smMicrogabbro 4-----1.99 × 1064970.03.4
Lithospheric MantlermDry Dunite 6-----1.12 × 10−45350.03.6
smDry Olivine 1-----65.2530183.5
Asthenospheric MantlermDry Dunite 62.537510.03.05.01.12 × 10−45350.03.6
smDry Olivine 123737510.03.05.065.2530183.5
Serpentine Antigorite 5-----1.39 × 10−20893.23.8
MeltrmDry Dunite 62.537510.03.05.01.12 × 10−45350.03.6
sm---------
1 [35]; 2 [36]; 3 [37]; 4 [38]; 5 [39]; 6 [40]. rm: rifting model; sm: subduction model. When not explicitly stated, the two models use the same parameter value. df Diffusion Creep: Viscous deformation, thermally activated, resulting from the diffusion of atoms and vacancies through the interiors of crystal grains when the grains are subjected to stress. Diffusion creep leads to a linear (Newtonian) fluid behavior (Equation (7)). A vacancy is a point defect in a crystal that forms when an atom leaves its lattice site [41]. ds Dislocation Creep: Viscous deformation, thermally activated, resulting from the migration of dislocations through the interiors of crystal grains when the grains are subjected to stress. Dislocation creep leads to a nonlinear (non-Newtonian) fluid behavior (Equation (8)). Dislocations are imperfections in the crystalline lattice structure [41].

2.2. Gravity Model

The gravity rate of change at point P and time t is calculated as follows:
g ˙ ( P , t ) = g ( P , t + δ t ) g ( P , t ) δ t
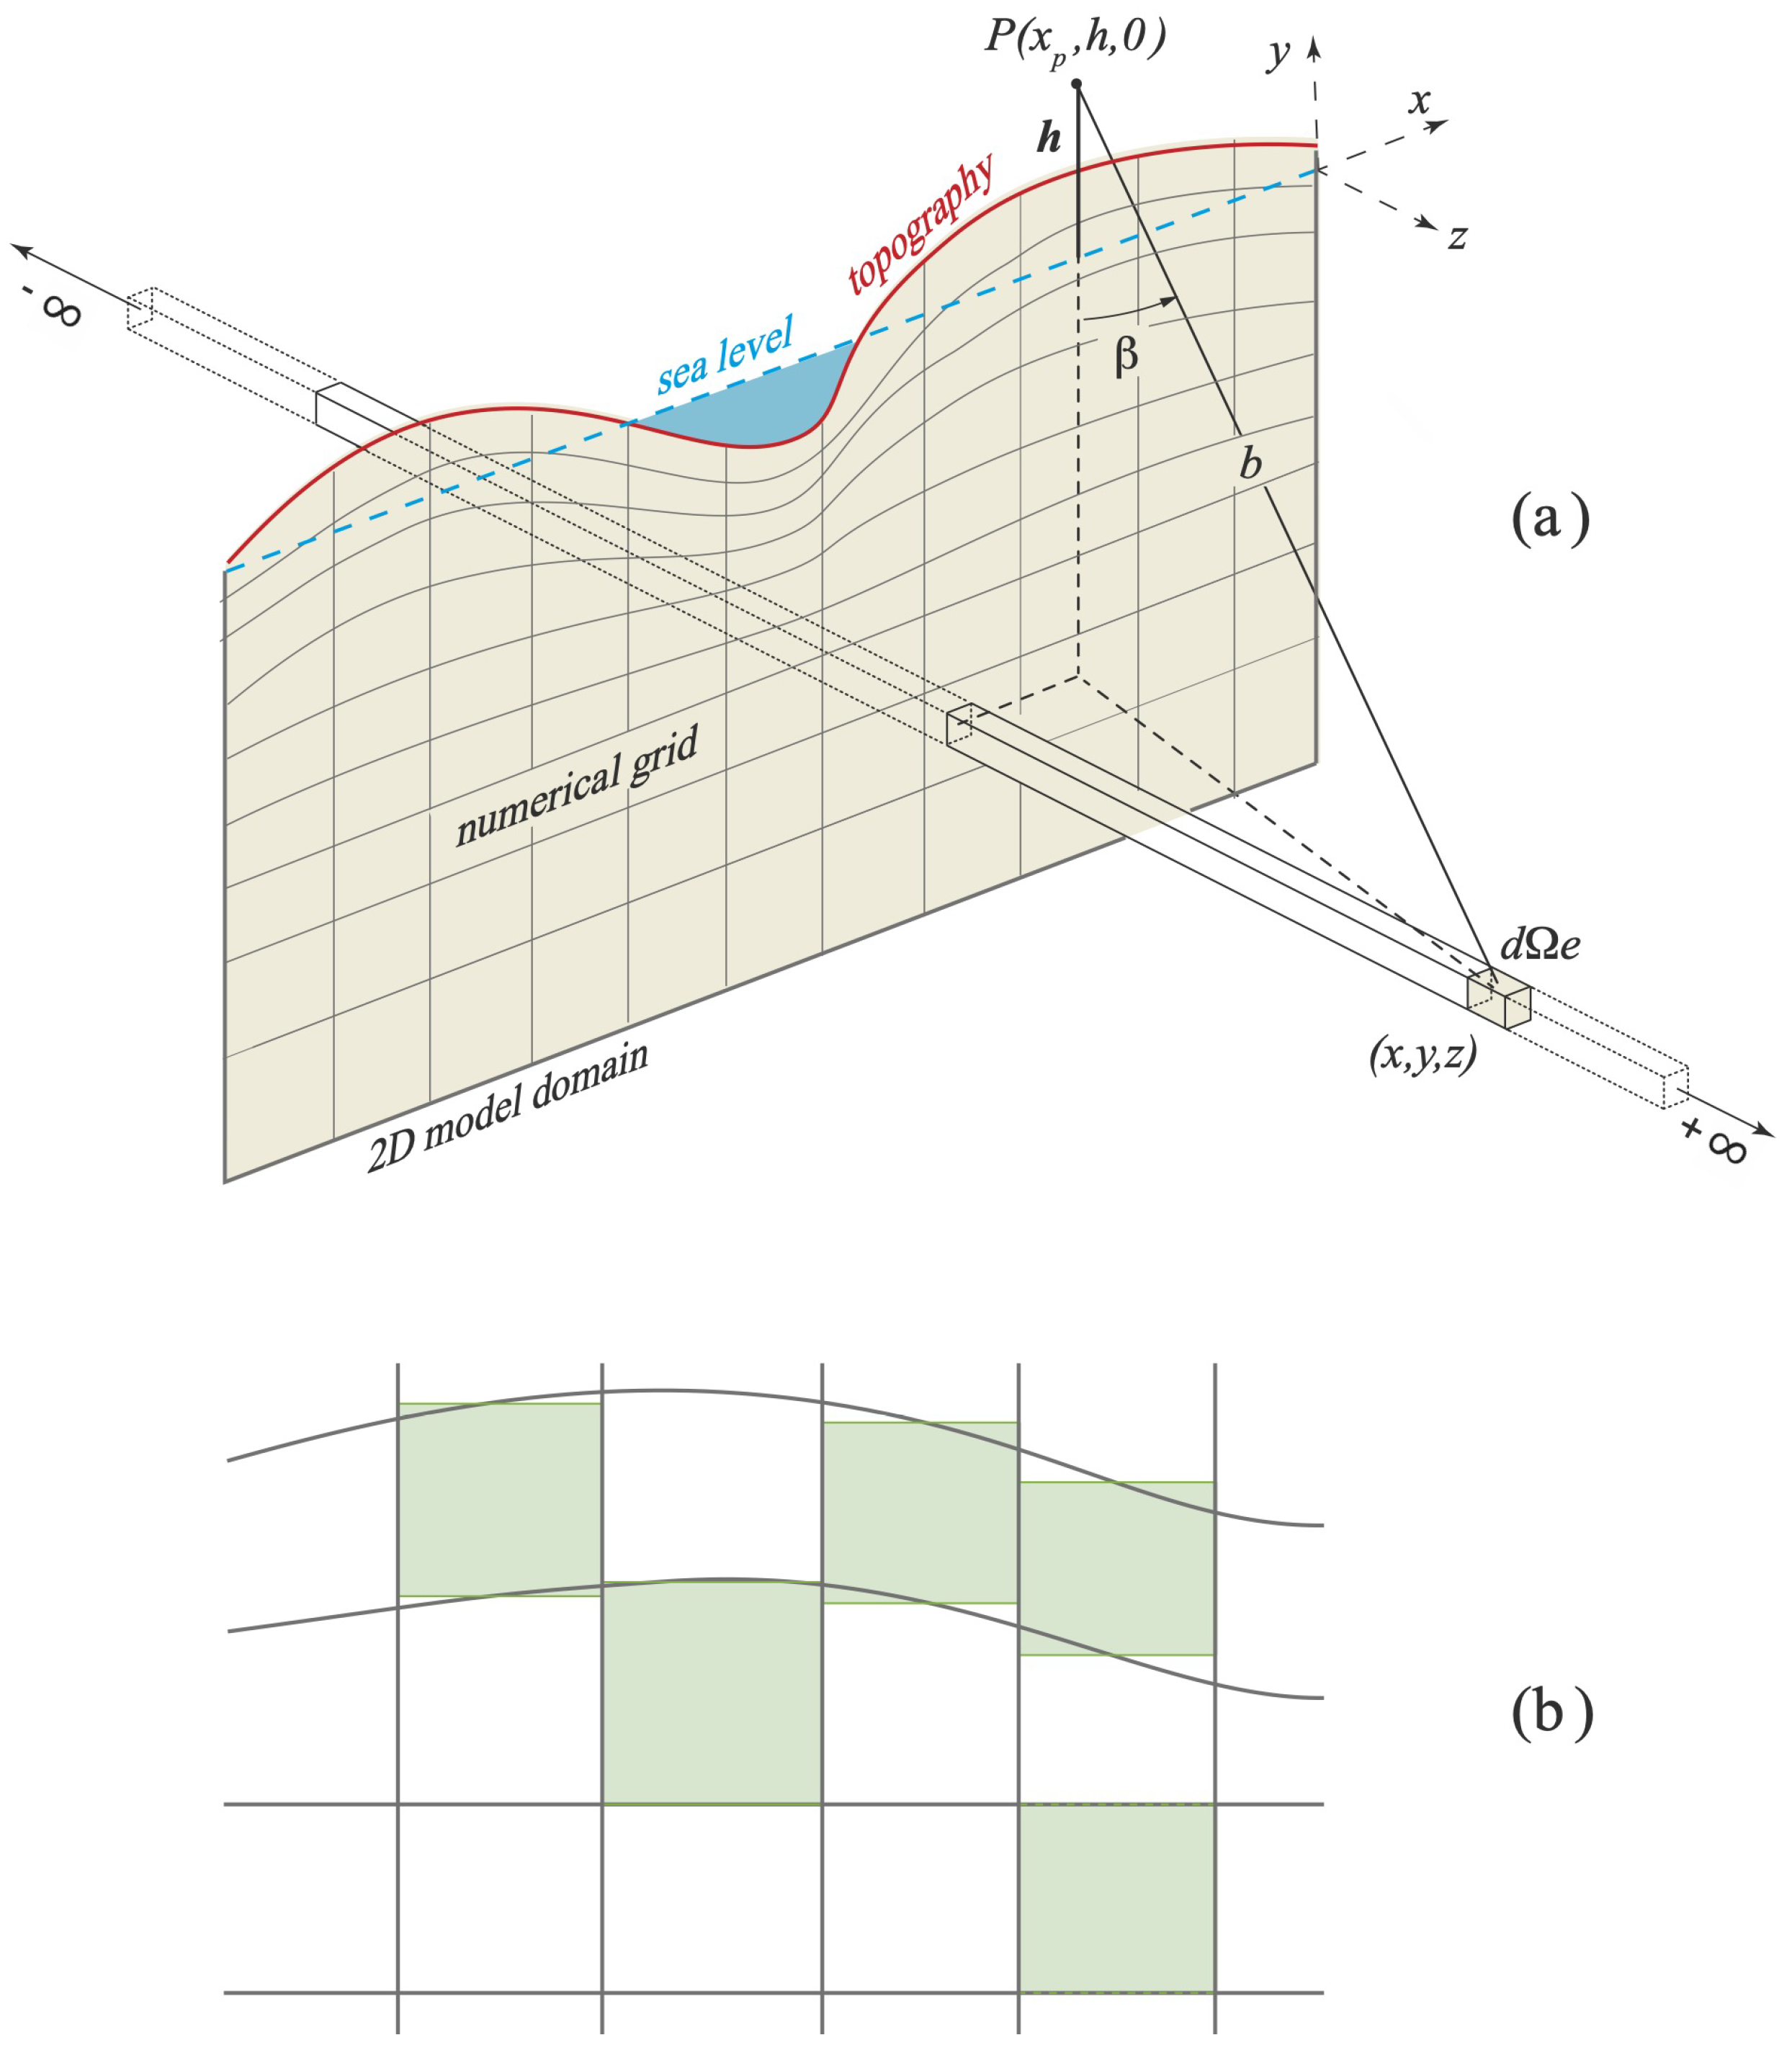
where g ( P , t ) and g ( P , t + δ t ) are the gravitational contributions of the model mass distribution predicted at two successive times t and t + δ t , with δ t as the varying model time step. Figure 2 shows the scheme used to calculate g ( P , t ) .
For each element of the numerical grid, we construct rectangular prismatic element infinitely extended in the direction perpendicular to the model and with area and density equal to those of the element to which it refers. We compute g ( P , t ) by summing at each time the gravitational contributions of all prismatic elements according to
g ( P , t ) = e = 1 n e l e m g e ( P , t ) ,
where n e l e m is the total number of elements in the numerical model grid and g e ( P , t ) is the vertical component of the gravitational attraction exerted by each prismatic element of density ρ e ( t ) on the unit mass placed at point P (located at an altitude h); g e ( P , t ) is provided by the volume integral
g e ( P , t ) = G Ω e ρ e ( t ) b 2 cos β d Ω e ,
where G is the universal gravitational constant (6.67 × 10⁻¹¹ m3 kg−1 s−2), b is the distance between point P and the center of the infinitesimal volumetric portion dΩe of the prismatic element, and Ωe is the volume of the prismatic element. See panel a of Figure 2 for the meaning of β .
For all the analyzed models and for all times, we consider the altitude of point P to be h = 5 km above the sea level, which guarantees that positive topography is totally accounted for in the gravity evaluation. At the same time, this allows our results to be readily considered in the frame of space gravity analysis, where this height over the ellipsoid is commonly used. In order to make our analysis useful for future ground measurements of gravity changes, which are likely to provide accuracy and precision comparable if not better to satellite-based measurements, we also calculate the gravity rate of change at topographic level, making the calculation altitude coincide with the sea level if the topography is negative. This calculation has been performed for the rifting model with an extensional velocity of 1 cm/yr and for the subduction model with a convergence velocity of 1 cm/yr. The gravity rate of change accounts for the time variation in the altitude of the calculation points.
The adopted procedure allows us to account for the gravitational effects of uplift and subsidence. In the latter case, the empty space between the topographic surface and sea level is filled with water of density ρ w = 1000 kg/m3.
Before calculating the volume integral of Equation (12), the prismatic elements are regularized such that each distorted prismatic element is replaced with a rectangular prism for which the cross-section coincides with the rectangle having an area equivalent to the area of the original deformed grid element (panel b of Figure 2). This guarantees that the mass of the rectangular prismatic element is the same as that of the distorted element.
After this regularization, Equation (12) simplifies to the calculation of the simpler integral over the volume of an infinitely extended rectangular prism of uniform density.

3. Model Results

For rifting and subduction models, we separately describe:
  • The pattern and magnitude of the modeled gravity rate of change and the contributions from deep-seated masses and dynamic topography.
  • The correlation between the gravity rate of change and the density rate of change.
  • How the gravity rate of change varies with the velocity prescribed at the edges.

3.1. Rifting

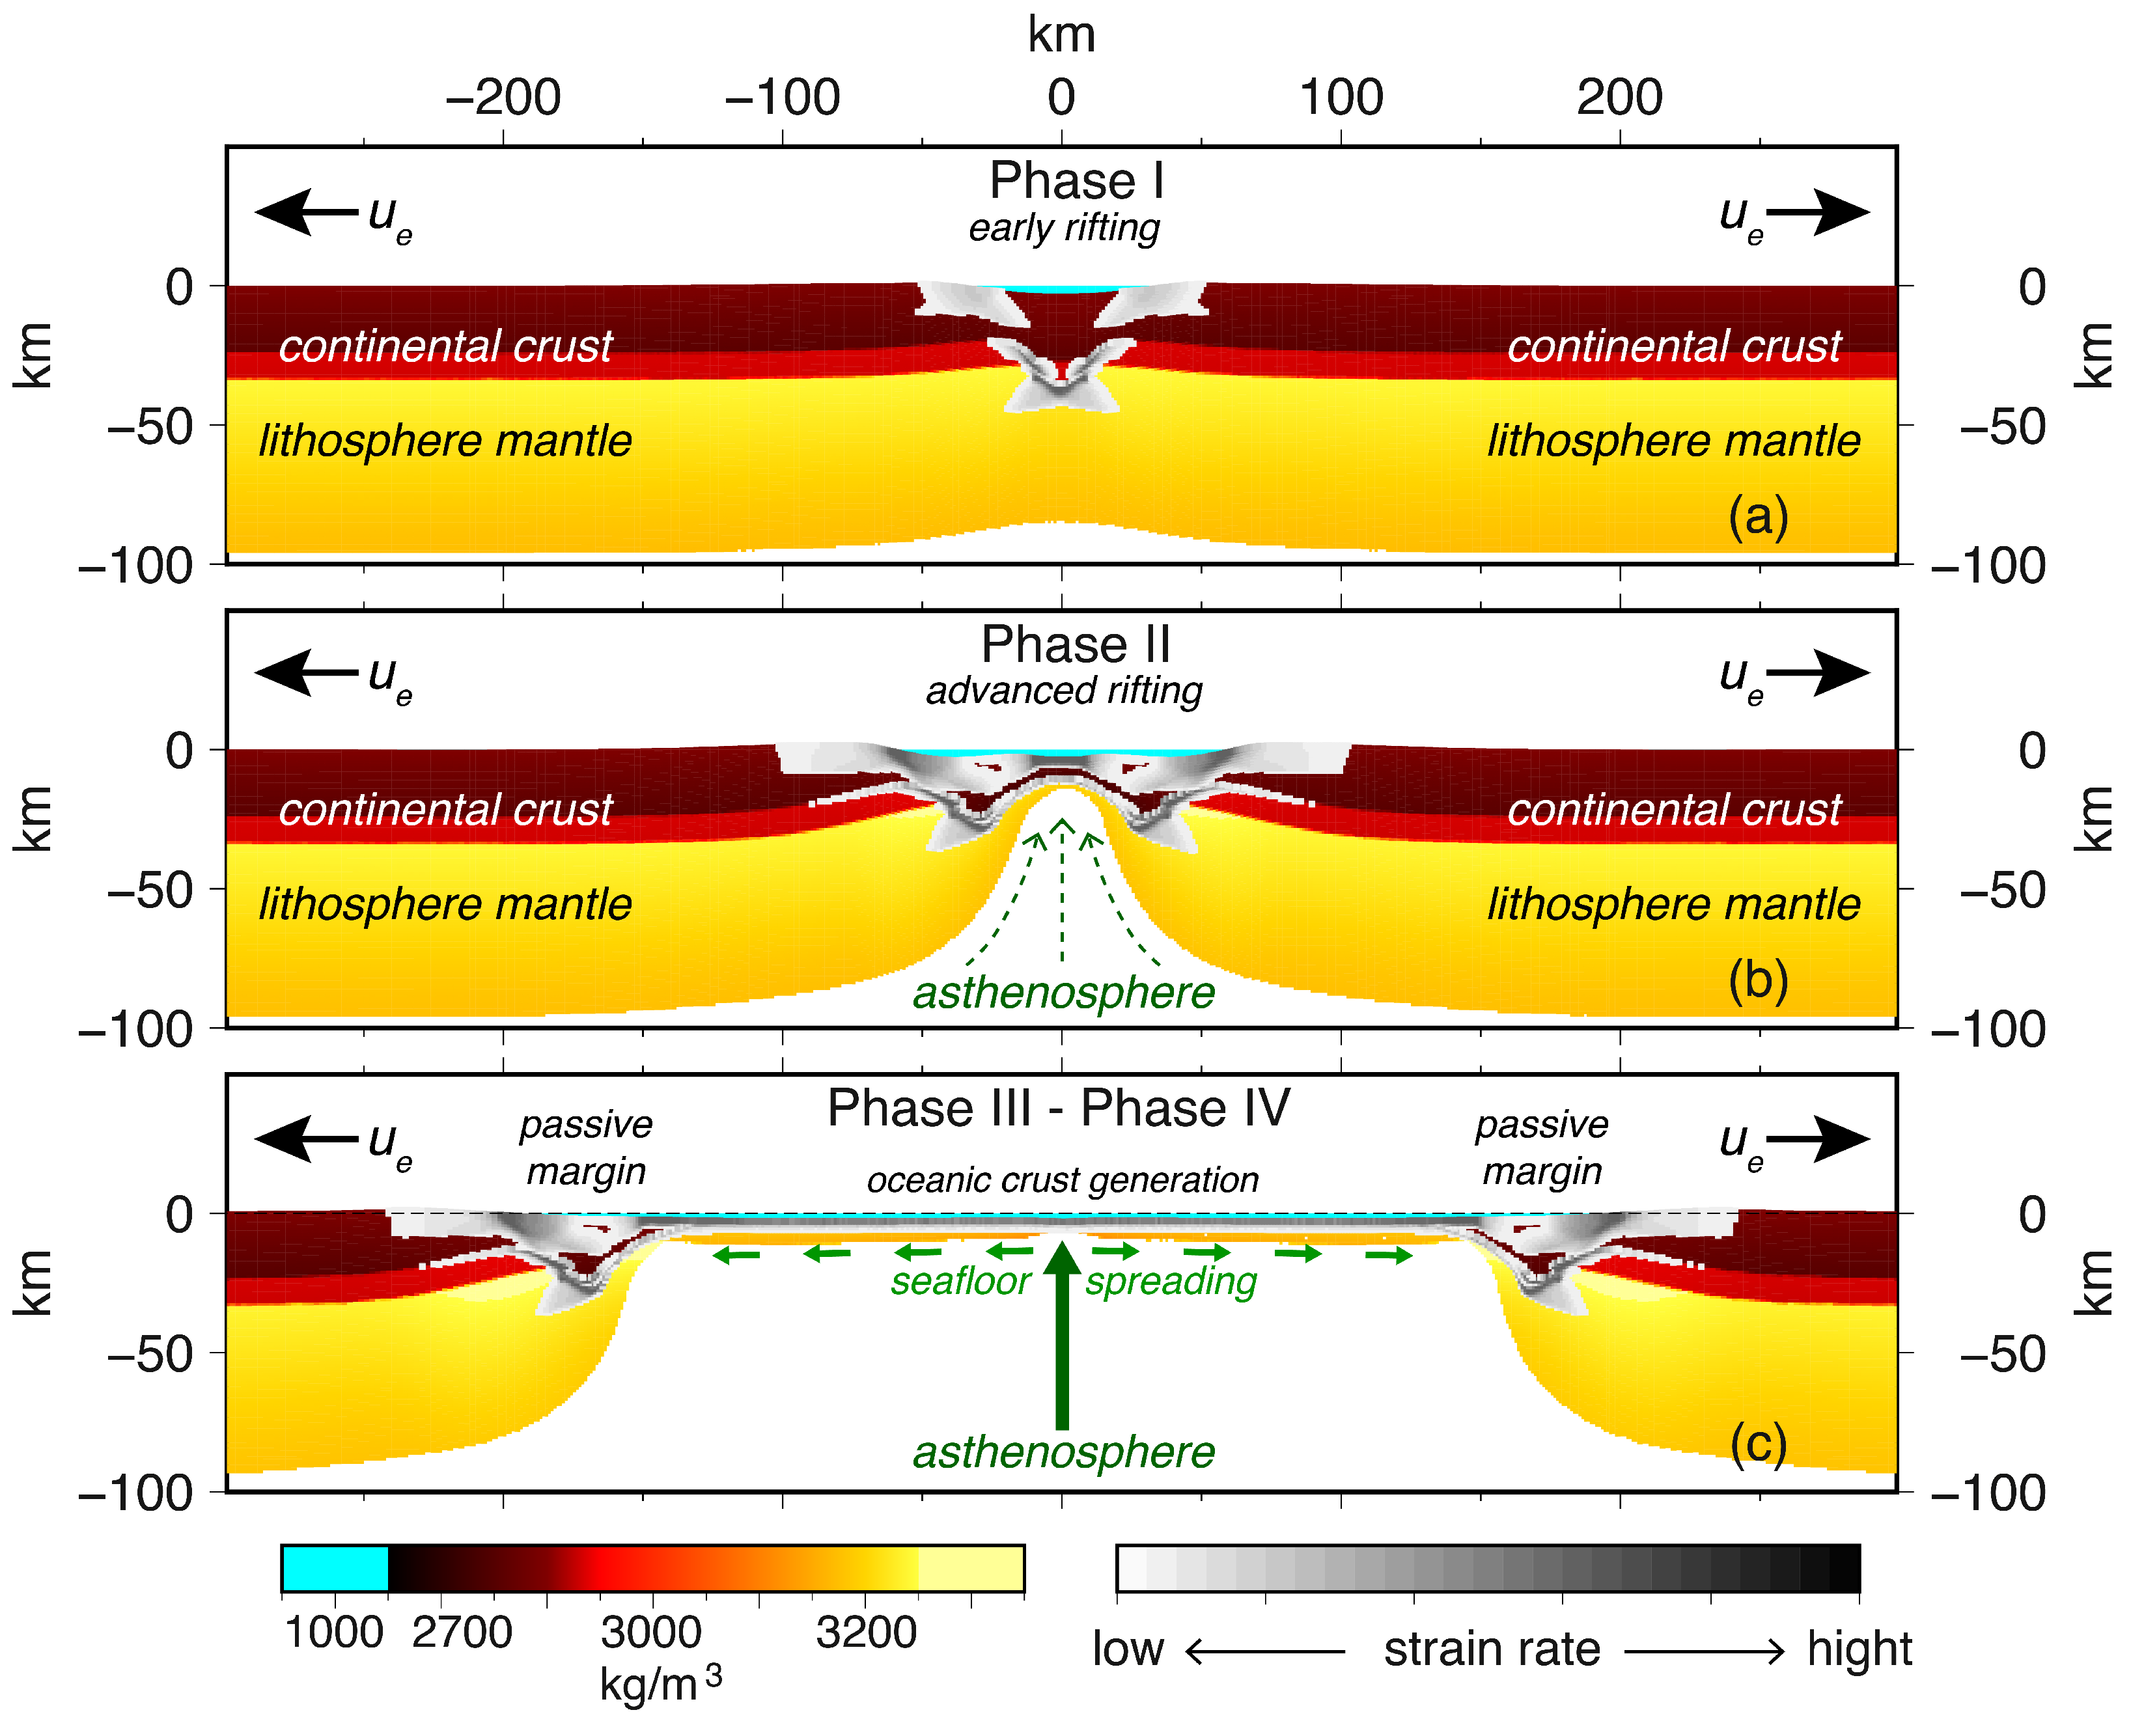
For all the analyzed rifting models, four main thermo-mechanical phases can be recognized, in agreement with [42] and synthesized here in Figure 3. During Phase I (panel a of Figure 3), low strain rate occurs throughout the divergent crustal blocks, with the exception of the area near the future ridge, where a high crustal velocity gradient generates an intense strain rate. During Phase II (panel b of Figure 3), the crust undergoes an intense and widespread strain, with localization of the thinning near the future ridge. Phase II ends with crustal breakup. Post-crustal breakup evolution of the models characterizes Phase III, during which the strain rate continuously decreases and lithospheric breakup occurs, followed by the horizontal velocities in the crustal blocks progressively becoming nearly constant and the strain rate becoming lower compared to previous phases. During Phase IV, the two continental blocks move rigidly with a velocity that is nearly equal to that prescribed at the marginal sides (panel c of Figure 3).

3.1.1. Modeled Gravity Rate of Change

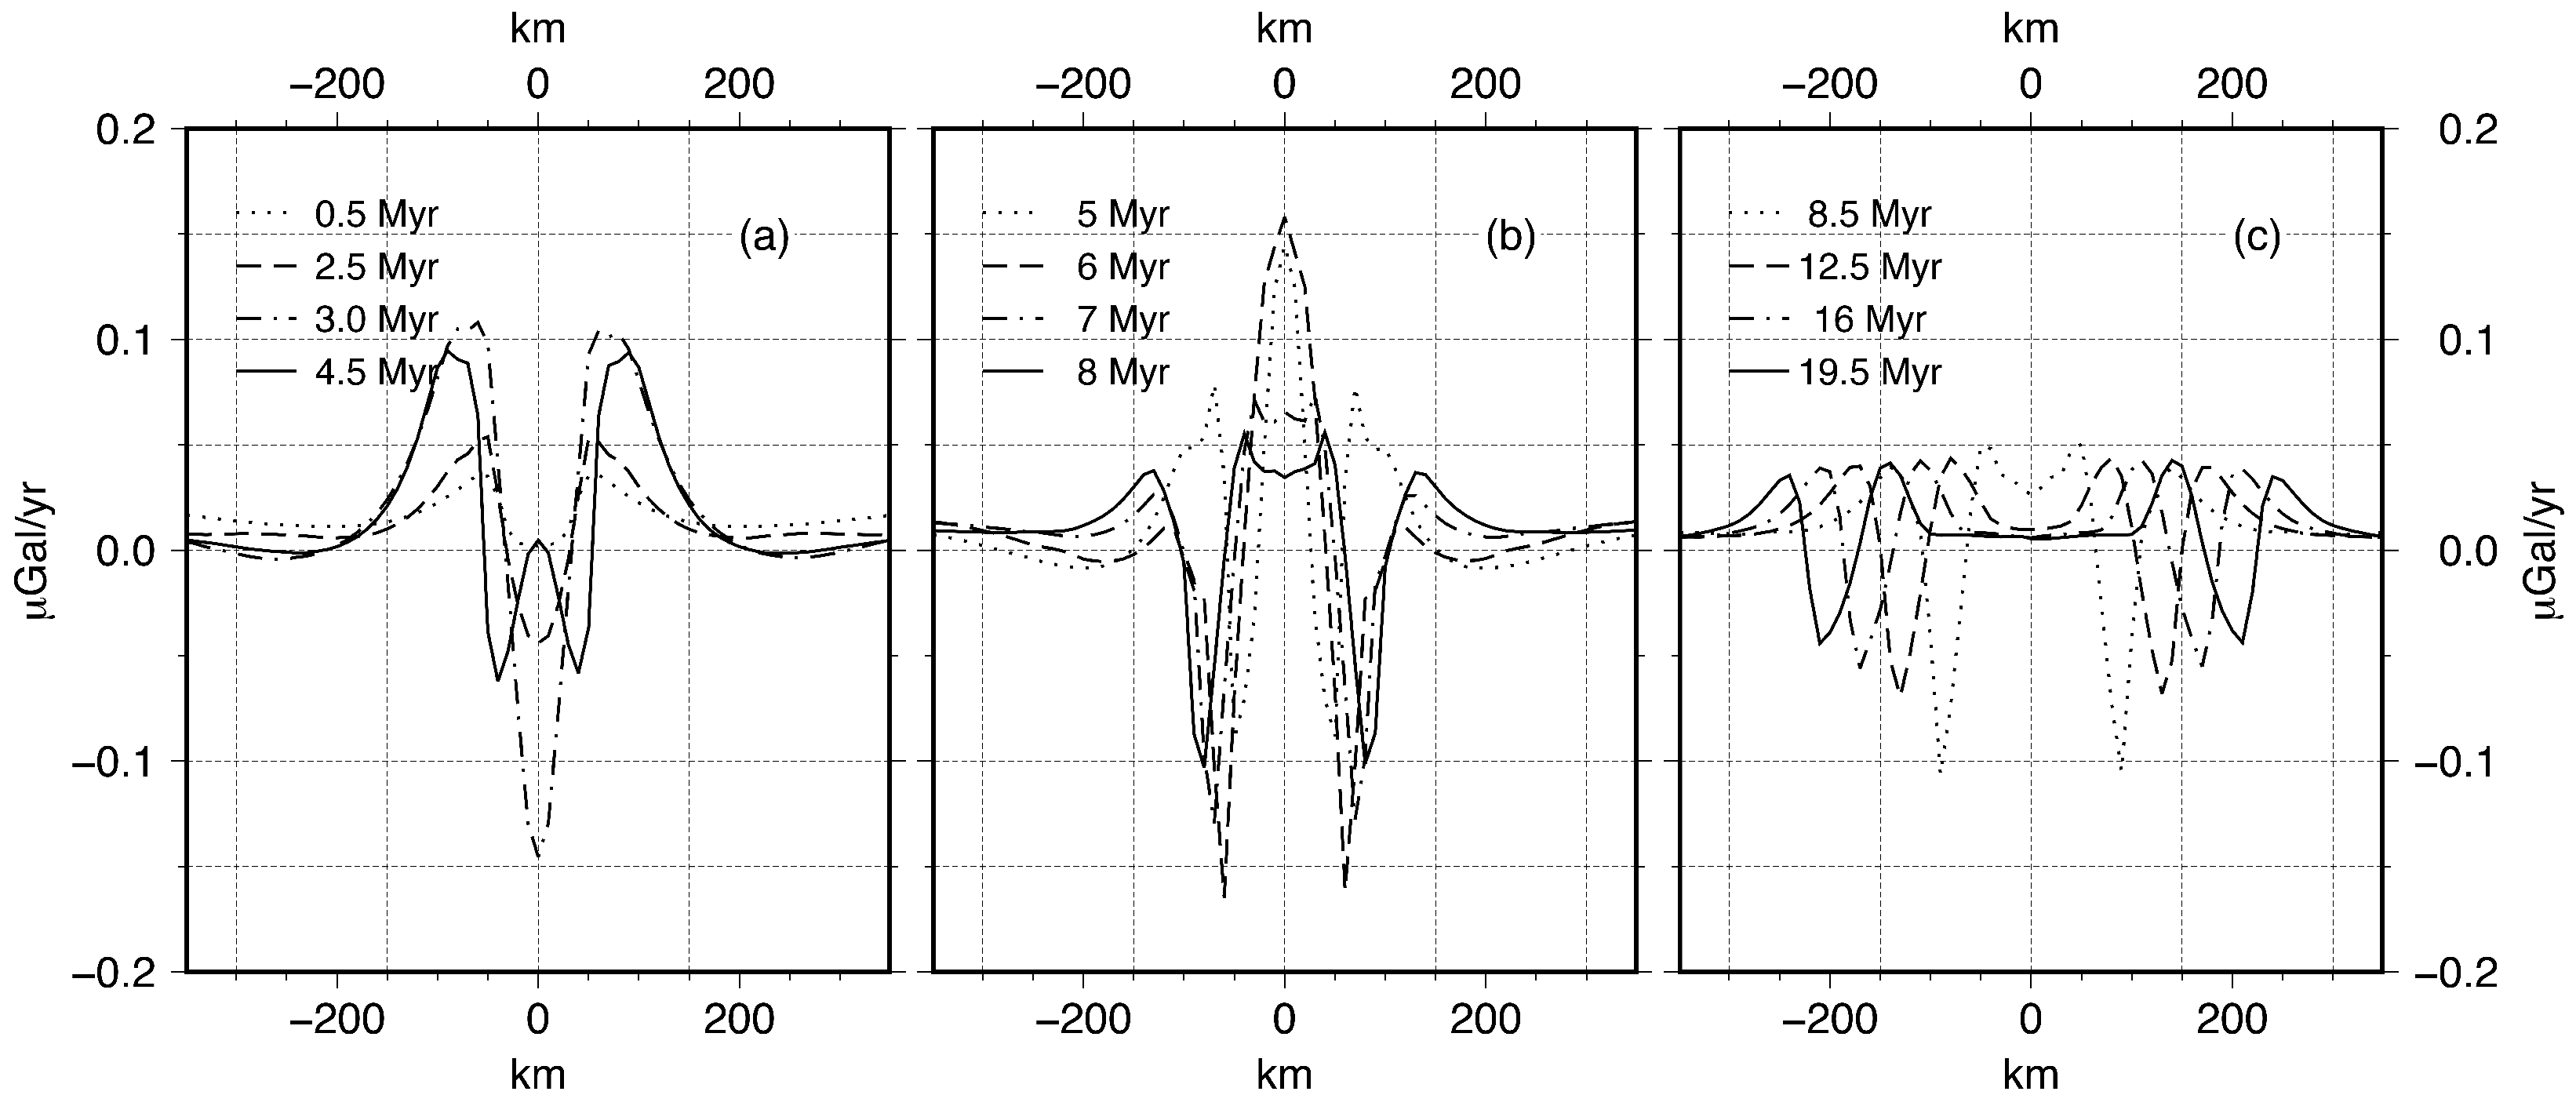
Figure 4 shows the gravity rate of change calculated at the uniform altitude h = 5 km at different times, with a prescribed extensional velocity of 1 cm/yr. In this figure, the gravity rate of change includes contributions from deep-seated density anomalies and dynamic topography. Here, the negative dynamic topography is filled with water.
Three phases can be identified, each with a distinct pattern of gravity rate of change. These phases correspond to the different stages of the oceanization process, which is consistent with what is suggested by [42] regarding oceanization in the Gulf of Aden. The timing has been chosen to highlight the variability of the gravity rate of change during each phase.
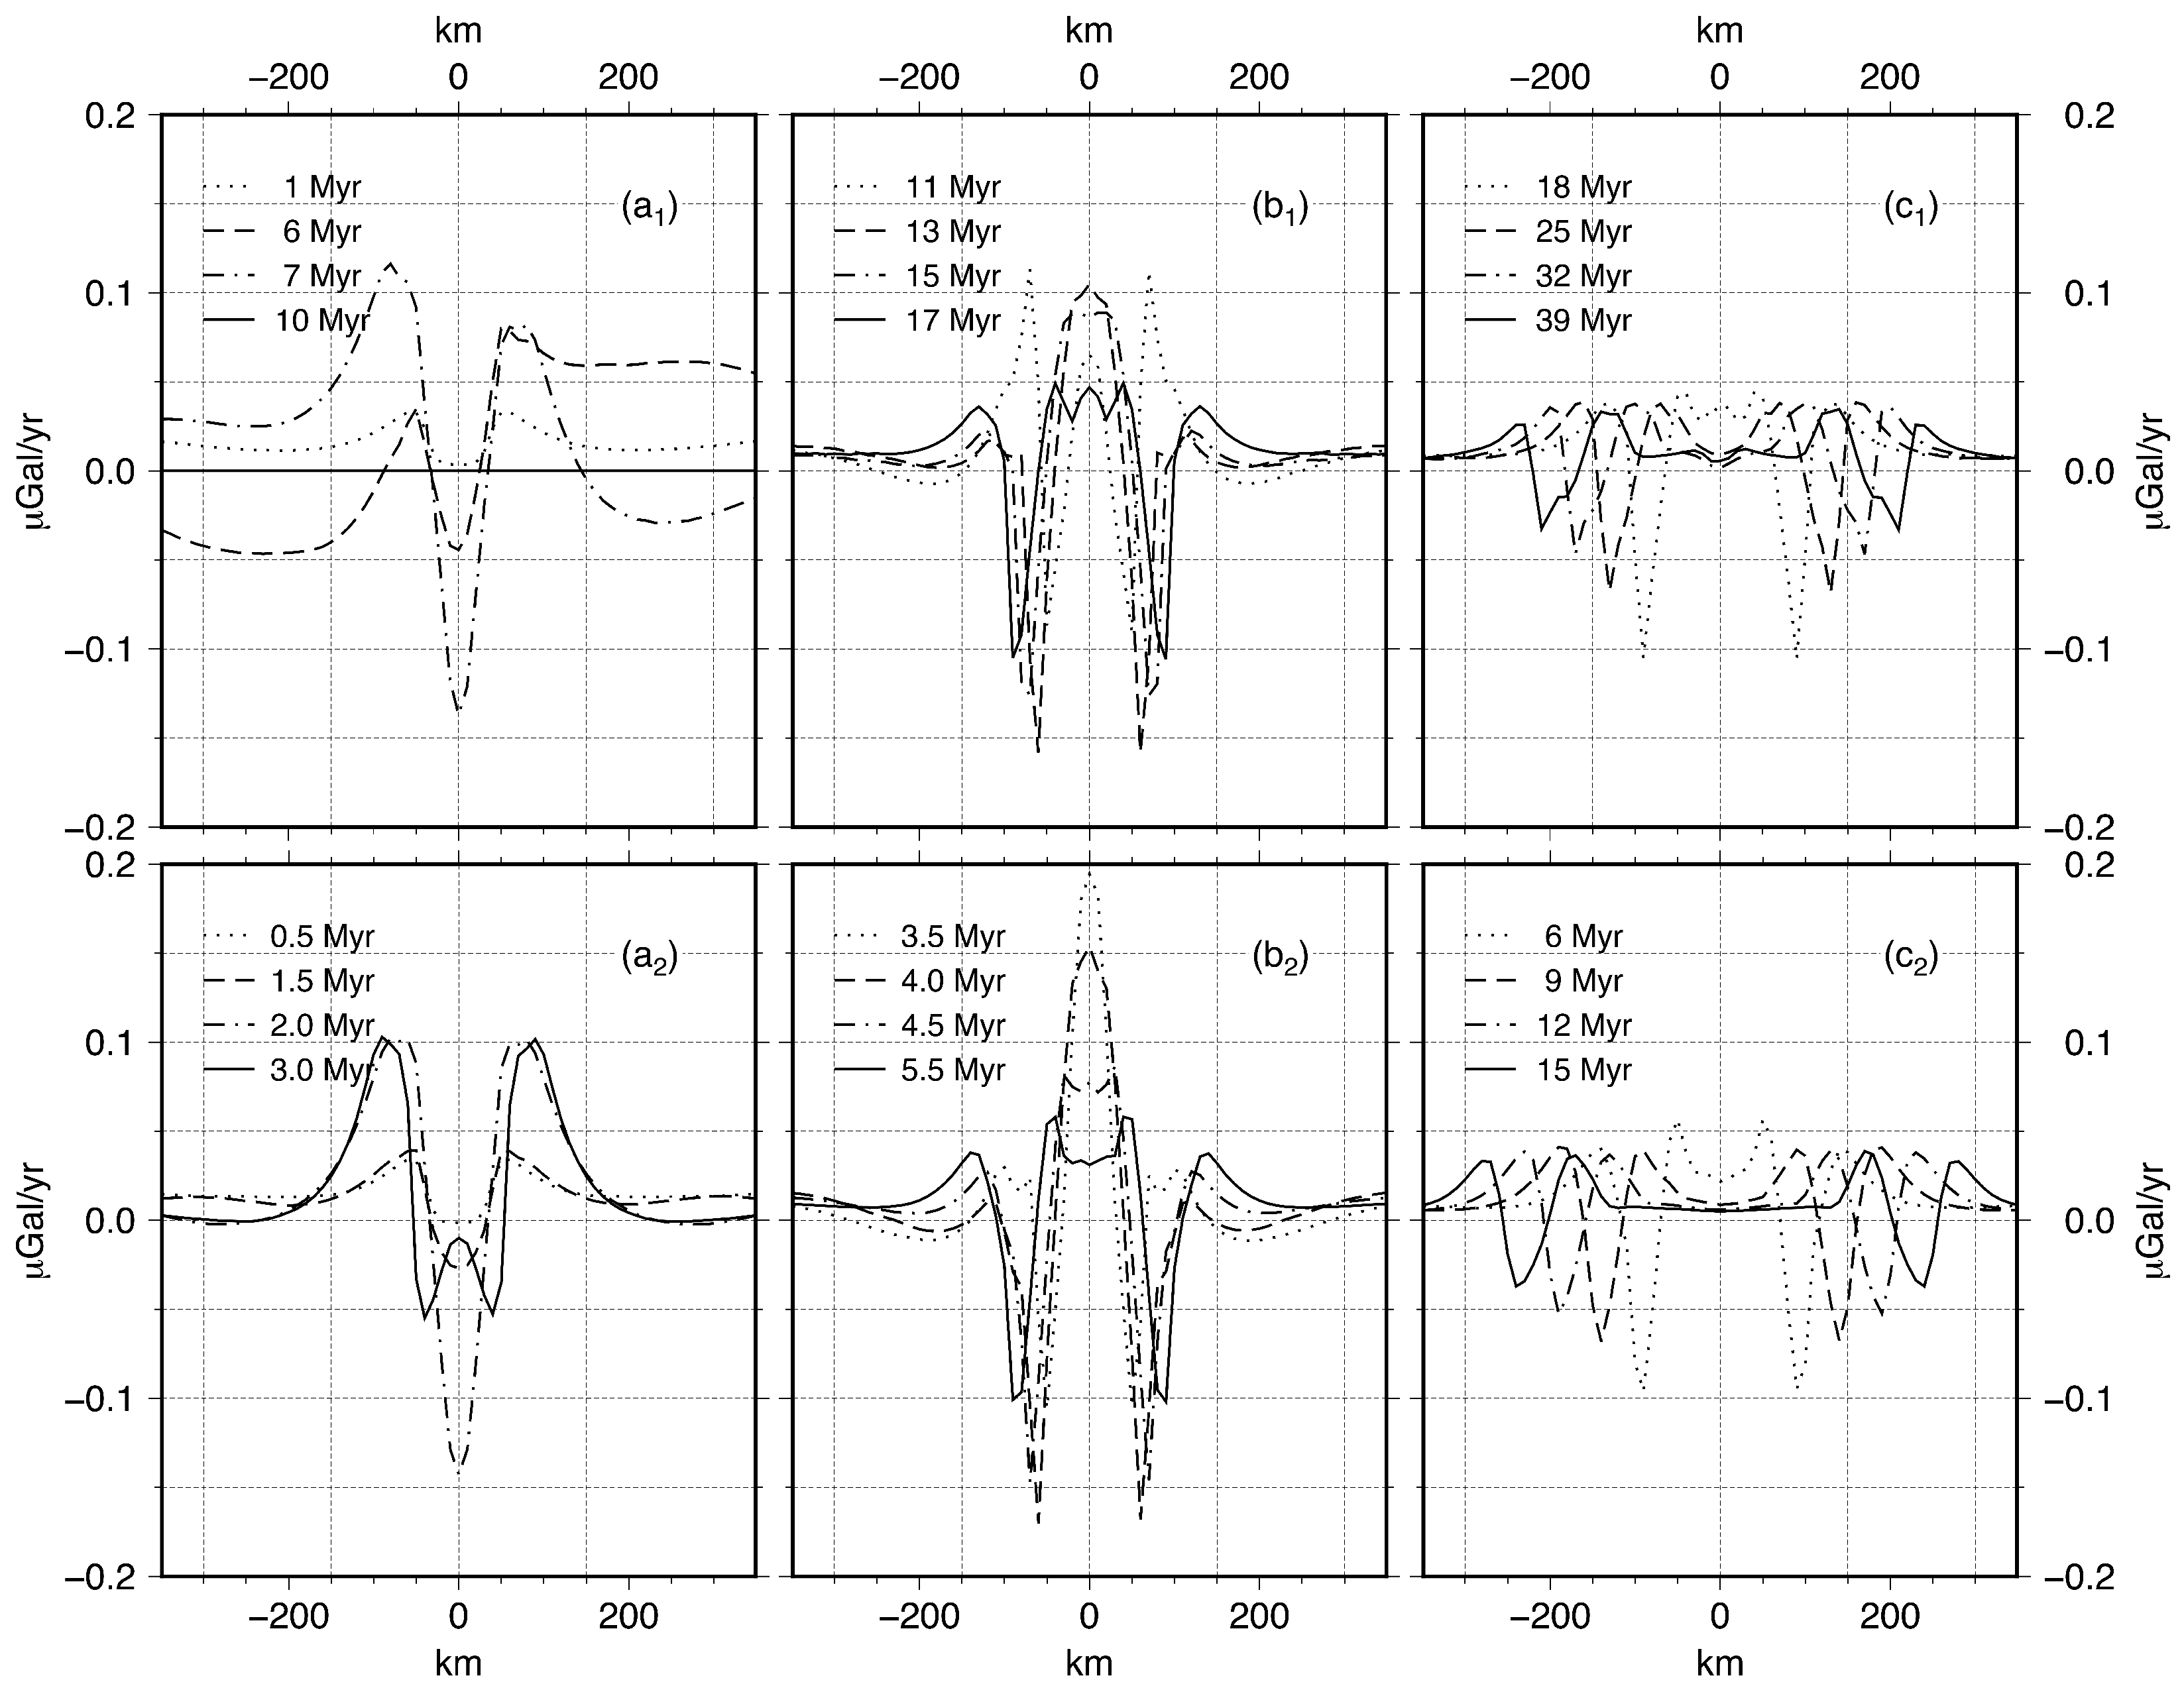
At the onset of extension and crustal thinning (phase I; dotted, dashed, dash-dotted, and solid lines in Figure 4a), the gravity rate of change shows a negative peak, reaching a value as low as −0.15 μGal/yr. This is flanked by two smaller-magnitude positive peaks of 0.10 μGal/yr, then slowly decreases until two minima appear at −50 km and +50 km, with a value of −0.06 μGal/yr. During phase II, these negative minima generate two well-separated minima of −0.1 μGal/yr (solid lines in Figure 4b), while the central maximum reduces (from dotted and dashed lines to dash-dotted and solid lines in Figure 4b), leaving two maxima of 0.05 μGal/yr lying 80 km apart. Two peripheral maxima of about 0.03 μGal/yr, located about 130 km from the center of the rift (solid lines in Figure 4b), become a permanent feature of the gravity rate of change.
During the seafloor spreading and oceanization (phases III–IV in [42]; Figure 4c), the gravity rate of change acquires a stable stationary pattern characterized at each edge of the ridge by a maximum of 0.04 μGal/yr, a minimum of about the same absolute value (i.e., −0.04 μGal/yr), and a smaller relative maximum of 0.03 μGal/yr. This pattern travels outward from the ridge at the extensional velocity.
In short, it is remarkable that each panel of this figure is characterized by a peculiar pattern. The first panel shows two well-developed positive maxima at the edges of the rifting and a decreasing negative minimum in the central region where the ocean is forming, splitting into two smaller minima. In the second panel, the two positive maxima of phase I decrease, accompanied by an increase in the two minima. The central maximum of phase II splits into two maxima. Finally, the third panel shows the steady-state pattern, with two well-separated positive maxima. The inner maximum is higher than the outer maximum, and is separated by a negative minimum of the same magnitude as the inner positive maximum. Between these two configurations, the gravity rate of change vanishes within the wide central part of the oceanized rifting.
Another aspect that deserves to be underlined is the influence of the height of the calculation point P on the gravity rate of change. Figure 5 shows the gravity rate of change (solid red lines in panels a1, b1, and c1) calculated at topographic level (as specified in Section 2.2 and represented by the red lines in panels a2, b2, and c2) for the same model shown in Figure 4. Compared to the value calculated at the same time at a uniform altitude of 5 km (solid black lines in panels a1, b1, and c1), a difference in the magnitude appears during phases I and II in both maximum and minimum values, up to approximately 0.04 μGal/yr, along with the occurrence of high-frequency features in the areas of steepest variations during all rifting phases.
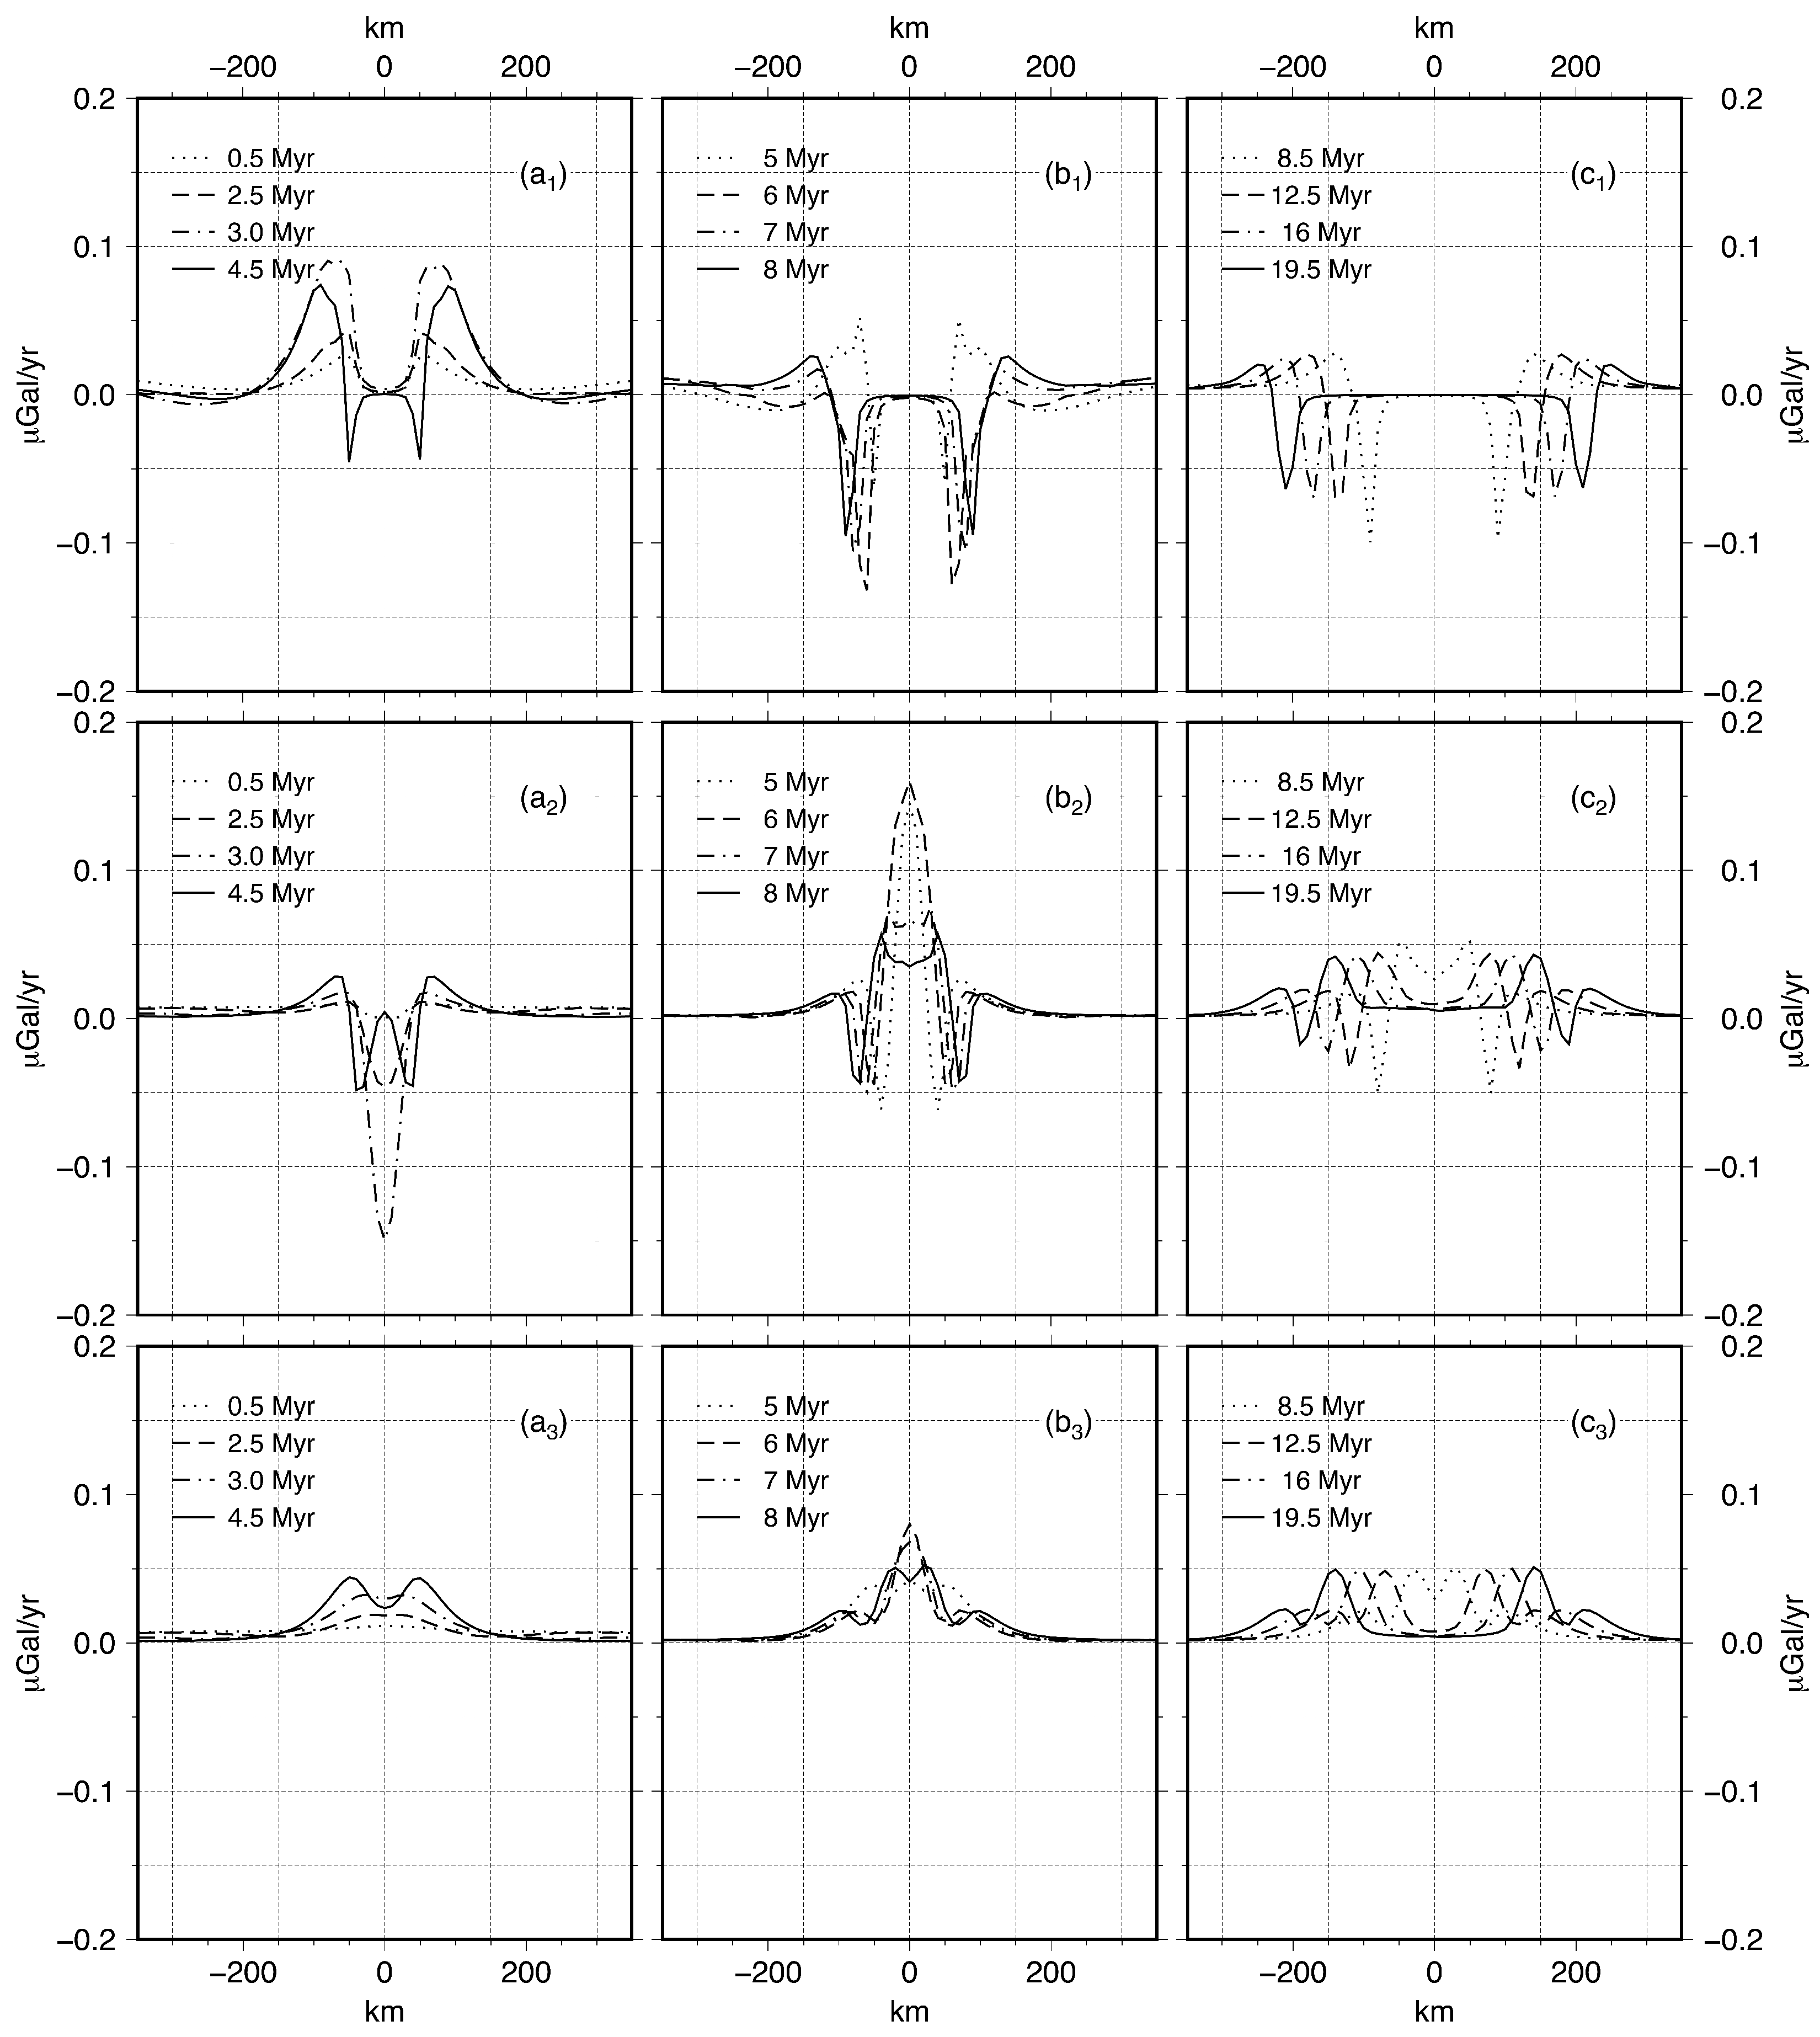
For a better understanding of the patterns in Figure 4, Figure 6 shows the contributions to the gravity rate of change from only the positive dynamic topography (panels a1, b1 and c1) and deep-seated density anomalies, using the same phases as in Figure 4. The negative dynamic topography is filled with either water (panels a2, b2, and c2) or crustal material (panels a3, b3, and c3).
Comparing the three rows, the most striking difference occurs in the central part of the domain between the two extending edges. Here, the gravity rate of change during any stage of the rifting is solely due to deep-seated density anomalies or negative dynamic topography. In contrast, the positive dynamic topography dominates the gravity rate of change immediately outward of the two minima, which decrease from −0.05 μGal/yr during the first phase (Figure 6a1) to −0.1 μGal/yr during the second phase (Figure 6b1), and to −0.06 μGal/yr in the steady state (Figure 6c1), solid lines.
A comparison of panels c1 and c2 of Figure 6 with panel c of Figure 4, which belongs to the final phase of rifting, indicates that the two outermost relative maxima of the complete signal (Figure 3) are contributed by changes of both deep-seated density anomalies (panel c2) and positive dynamic topography (panel c1), at about 50% each. The contribution from the positive dynamic topography is easily interpretable as the response of the system to the adjacent larger-in-magnitude minima. This dipolar pattern of the positive dynamic topography originates from the outward migration of the peripheral bulge. This involves continental crust substituting for air in the outer flanks of the bulge, resulting in a positive density anomaly, and air substituting for crust in the inner flanks, resulting in a negative density anomaly.
It is noteworthy that except for the positive values achieved by the maximum in the central part from −50 km to +50 km in the first two rows of Figure 4, all the other features in Figure 6 are roughly half the size of those in Figure 4. This means that except for the central part of rifting, which is unaffected by the positive dynamic topography, the latter contributes about 50% to the sum of the deep-seated density anomalies and negative topography.
Finally, panels a3–c3 of Figure 6, where the negative dynamic topography is filled with continental crust, show the contribution of deep-seated density anomalies, as they do not include the contributions of positive dynamic topography and the whole upper crust has homogeneous density. It is worth pointing out that filling the negative topography with oceanic crustal material of 3000 km/m3 would not change these results.
A comparison of Figure 4 and Figure 6 portrays a clear picture of an inner maximum of 0.05 μGal/yr, due only to the horizontally moving positive density anomaly at the ocean–continent transition, and a minimum of the same absolute value of −0.05 μGal/yr, due to the outward motion of the inner flank of the positive dynamic topography (which does not offset the first maximum). There is also an outward maximum, which is lower than the first inner one and is contributed by both deep density anomalies and the motion of the outer flank of the positive dynamic topography.

3.1.2. Gravity Rate of Change vs. Density Rate of Change

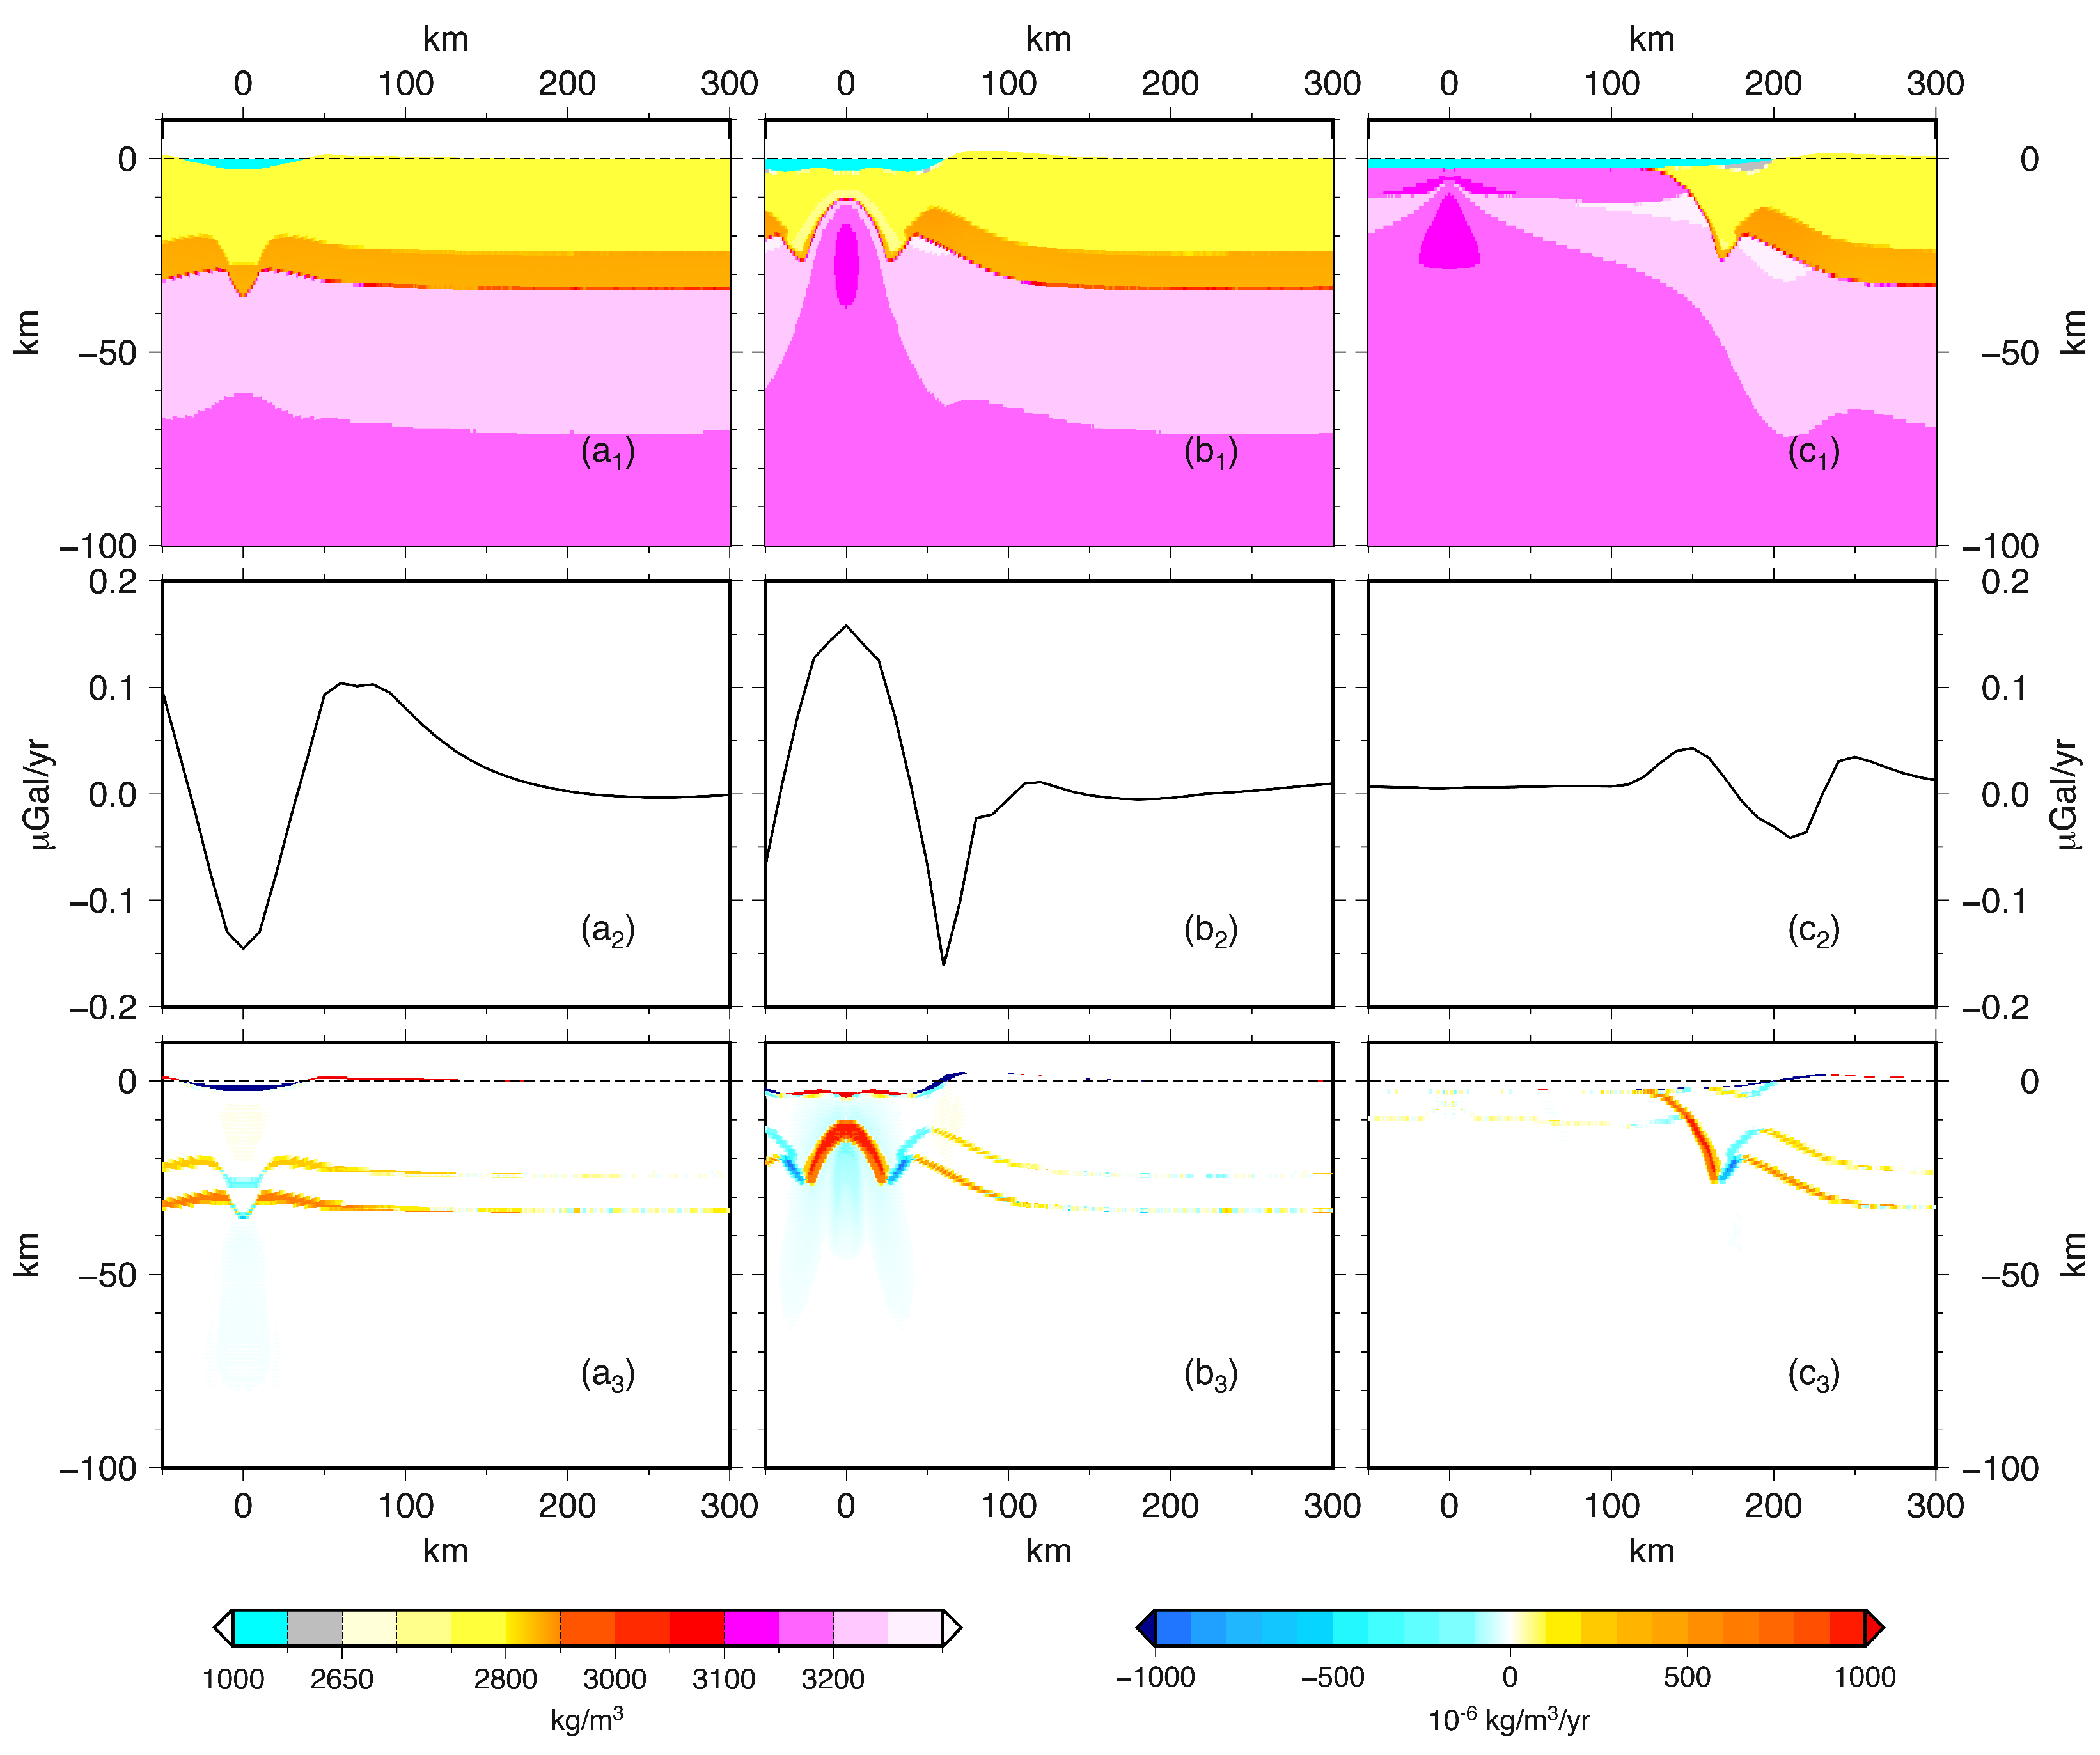
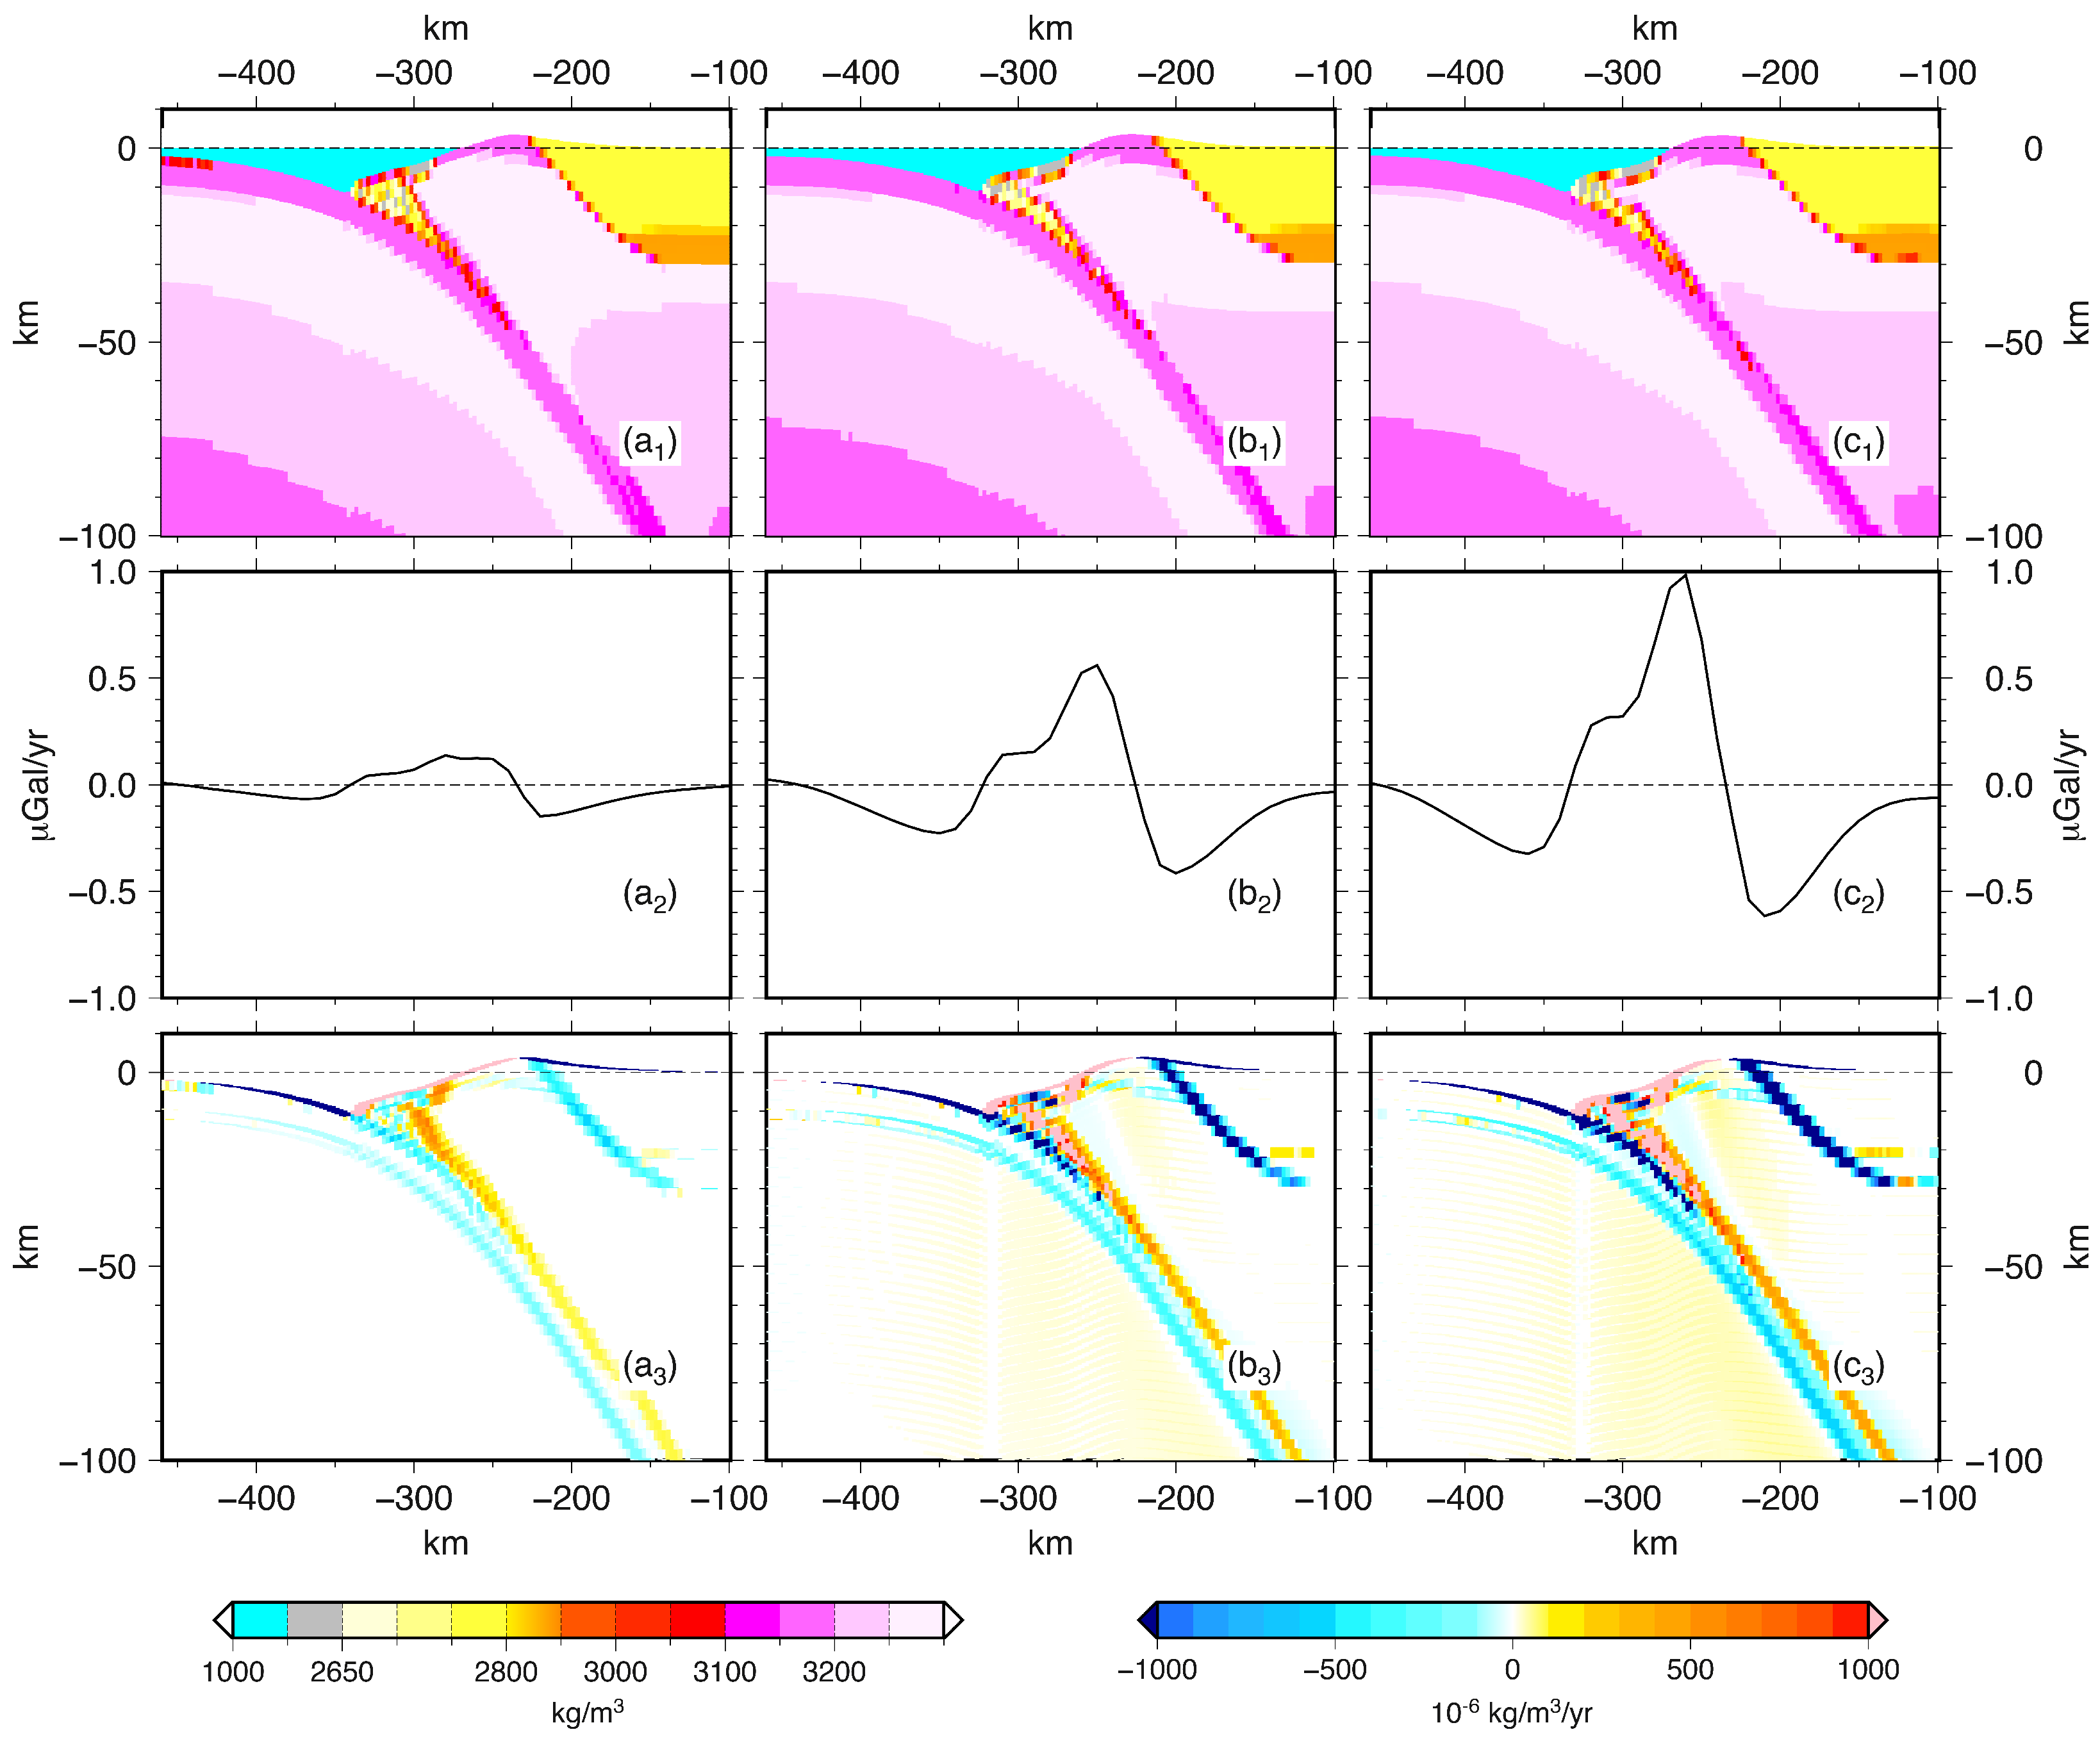
Figure 7 portrays the distribution with depth of the density (top row), gravity rate of change (middle row), and density rate of change (bottom row) at the same time as the top row. These results include a thin layer of water at the top of the oceanic part of the basin, which is caused by the negative dynamic topography (light blue thin layer on the top left). They also include the positive dynamic topography along with the deep-seated density and density change contributions from the early to the late rifting process (from left to right). Comparing these three rows provides physical insights into the results shown in the previous figures.
The first point deserving of attention is the substantial modification in the density distribution compared to the uniform density stratification at the onset of extension (depicted in Figure 1a). The timing has been chosen to provide the density distribution that characterizes the three successive phases of rifting.
The continental crust undergoes a severe thinning in the proximity of the margin (over lengths of 40, 60, and 250 km, from left to right in the columns). There are a few kilometers of bathymetry, or negative dynamic topography (in light blue), because the area is filled with water. From the onset of extension, stress localization is responsible for both the non-uniform thinning of the continental crust and the formation of a region near the edge with the same thickness as the original un-deformed crust. This allows the bathymetry to decrease smoothly towards the continental shorelines. In the right-hand panel of the first row, the continental crust is not yet involved in extension and retains its initial density layering.
The progressive cooling of oceanic lithospheric material (from violet to light violet) from 3100 to 3300 kg/m3 is responsible for a negative dynamic topography, and consequently for the formation of the basin, which is flat from its center to the passive margin and then decreasing in depth. Migration to the right of the ocean–continent transition results in an increase in density from 2800–2900 kg/m3 to 2900–2950 kg/m3 (shown in Figure 7 as a shift from yellow to dark orange) within a thick layer, comparable to that of the lower continental crust. There is also an increase in density at the interfaces between the upper and lower continental crust and between the lower continental crust and the lithospheric mantle (the thin dark orange color in panels a3, b3, c3).
Near the Earth’s surface, the peripheral bulge is barely visible, lying inland from the shoreline. This is a region of uplift adjacent to the downlifting basin.
The domain shows a significant density rate of change (bottom row) from the center of the rift to the un-deformed crust and mantle layers across the three phases, as already illustrated in Figure 4, Figure 5 and Figure 6 in terms of the gravity rate of change, with the highest values occurring in proximity to the ocean–continent transition. The density rate of change occurs where density gradients exist in the horizontal direction, which is concordant with the direction of motion from the Earth’s surface to the bottom of the lithospheric mantle.
From the Earth’s surface downward, we observe three large regions with high rates of change in density. The largest positive region, with a density rate of change of 10−3 kg/m3/yr, is found at depths between 10 km and 30 km. This is due to the outward horizontal migration of the major density contrast between the ocean and the continent, which is shaped by the geometry of this contact (panels a3 and b3). A negative region with a smaller lateral extension and comparable magnitude is due to the migration of the outer border of the thick crustal portion and the overlying basin. A smaller positive region is due to the migration of the peripheral bulge at the surface and the bent interface between the lower crust and the lithospheric mantle. Although tiny in the drawing because of using the same vertical scale as the deep density rate of change, the contribution from the migration of the water-filled basin to the gravity rate of change has a comparable effect to that of deep-seated density anomalies due to their proximity to the 5 km altitude at which gravity is detected (panels a3–c3 of Figure 4). The difference between panels b3 and c3 relates to phases II and III, with the central arc-shaped positive density rate of change (red) not yet split as in phase III. Panel a3, corresponding to phase I, has inverted polarity compared to panels b3 and c3 due to the general changes to lighter material at all depths in the rift zone.
The middle row shows the gravity rate of change corresponding to the density rate of change related to the bottom row, where we observe complete correspondence between the maxima and the minima of the positive and negative gravity rate of change at depth. From phase II onward, the highest positive gravity rate of change migrates over the ocean–continent transition. The minimum corresponds to declining bathymetry and to the outer thinned continental crust between 10 and 30 km depth as well as to the inner part of the peripheral bulge. The secondary maximum corresponds to the outer part of the peripheral bulge as well as to the deep density contrasts.

3.1.3. Gravity Rate of Change vs. Extensional Velocity Prescribed at the Edges

The results presented thus far refer to a rifting occurring at a rate of 1 cm/yr, but can be generalized to any extension rate.
Figure 8 shows the gravity rate of change predicted by rifting models with prescribed extensional velocities of 0.5 cm/yr and 1.5 cm/yr, normalized with respect to the extensional velocities. The timing has been chosen to show the same phases as Figure 4. A comparison with Figure 4 shows that the striking feature is the invariance of the magnitude and pattern of the normalized gravity rate of change with respect to the prescribed velocity, which varies over time during the different phases of evolution but remains the same for all models. This indicates that the physical process governing rifting is linear in terms of extensional velocity, and suggests that the system’s response in terms of the rate of change of gravity is driven by the horizontal migration of the density pattern portrayed in Figure 7.
Figure 4 and Figure 8 collectively show that the gravity rate of change is strictly zero only in the central part of the rifting, specifically in the flat part of the curves in the final phase of the steady state. This does not include the proximity of the ocean–continent contact, where horizontal motion is still active. The peak-to peak actual non-normalized value is approximately 0.03 μGal/yr for 0.5 cm/yr, 0.08 μGal/yr for 1 cm/yr, and 0.11 μGal/yr for 1.5 cm/yr. The time scale for reaching a configuration with a vanishing gravity rate of change in the central part of the rifting depends on the extensional velocity and varies between about 21 Myr for 0.5 cm/yr (panel c1 dashed line) to about 10 Myr for 1.5 cm/yr (panel c2 dashed lines), as shown in Figure 8. We will return to this point at the end of this section.
Before reaching the steady state, rifting is responsible for greater gravity rates of change during phases I and II, which is appropriate for young rifting on Earth. Looking at the first and second columns of Figure 4 and Figure 8, which correspond to phases I and II, it can be seen that the normalized maxima and minima can be as high as 0.1–0.15 μGal/yr and −0.1–−0.15 μGal/yr, with peak-to-peak values as high as 0.2–0.3 μGal/yr. These high values compared to the steady state are not surprising, since they occur over time scales involving millions of years of huge mass readjustments at depth and then at the surface, as shown in the top and bottom rows of Figure 7.
Finally, Figure 9 provides a global view of the evolution in space and time of the gravity rate of change above the rifting and surrounding continental areas, mapping it as function of the distance from the center of the rift (located at 0 km in the horizontal scale) and of the rifting age (along the vertical scale, where t = 0 Myr corresponds to the initiation of rifting). Panels a, b, and c correspond to rifting models with prescribed extensional velocities of 0.5 cm/yr, 1 cm/yr, and 1.5 cm/yr, respectively. Moving horizontally, for a fixed age, the gravity rate of change profiles already shown in Figure 4 and Figure 8 can be recognized. At the early rifting phase (Phase I), an intense negative value of the gravity rate of change appears in the center of the rift, flanked by two positive peaks. With the progression of time, when the dominant mechanism is the emplacement of mantle material that replaces the lighter crust (Phase II), this pattern reverses and a main intense and positive peak of the gravity rate of change develops above the center of the rifting area, followed by two adjacent negative lows and two secondary positive highs located further outward. After breakup, as visualized in Figure 9 by the splitting of the solid black line into two branches that represent the position in time of the passive margins, the two gravity rate of change patterns travel outward in step with the passive margin, remaining localized above it (Phase III and IV). These patterns are well defined in terms of their horizontal extension over the Earth’s surface, and allow us to define the extension of the domain affected by significant gravity rate of change as a function of the age of rifting and the prescribed extensional velocity. One main result is that for each rifting model, the extension of this area remains almost unchanged over time but increases with the increase of the extensional velocity. Considering a gravity rate of change lower than 0.01 μGal/yr (the gray lines in Figure 9) as negligible, the extension of this area varies from about 150–160 km for u e = 0.5 cm/yr (panel a of Figure 9), to about 180–200 km for u e = 1.0 cm/yr (panel b of Figure 9), to about 270–290 km for u e = 1.5 cm/yr (panel c of Figure 9). From Figure 9, it is also possible to estimate how much time is required for the gravity signature to stabilize after the gravity perturbation has passed over a certain position or a certain distance from the center of the rift. At the center of the rift, our results show that the gravity perturbation becomes negligible after a span of time calculated from the beginning of rifting; this time span becomes longer with the extensional velocity, increasing from 11 Myr for u e = 1.5 cm/yr, to 12 Myr for u e = 1.0 cm/yr, to 21 Myr for u e = 0.5 cm/yr. If we instead consider the time of breakup (5 Myr for u e = 1.5 cm/yr, 8 Myr for u e = 1.0 cm/yr, 18 Myr for u e = 0.5 cm/yr) as the reference time (i.e., the time at which the black lines in Figure 9 bifurcate, that is, the end of Phase II), the time spans become shorter with lower extensional velocity, decreasing from about 6 Myr for u e = 1.5 cm/yr, to 4 Myr for u e = 1.0 cm/yr, to 3 Myr for u e = 0.5 cm/y. Moving away from the center of the rift, the time interval after which the gravity rate of change becomes negligible at a certain distance (as calculated from the time of breakup) varies from 8.5 Myr to 17 Myr for u e = 1.5 cm/yr, from 7 Myr to 19.5 for u e = 1.0 cm/yr, and from 11 Myr to 37 Myr for u e = 0.5 cm/yr at distances of 50 km and 200 km from the center of the rift, respectively.

3.1.4. Topography

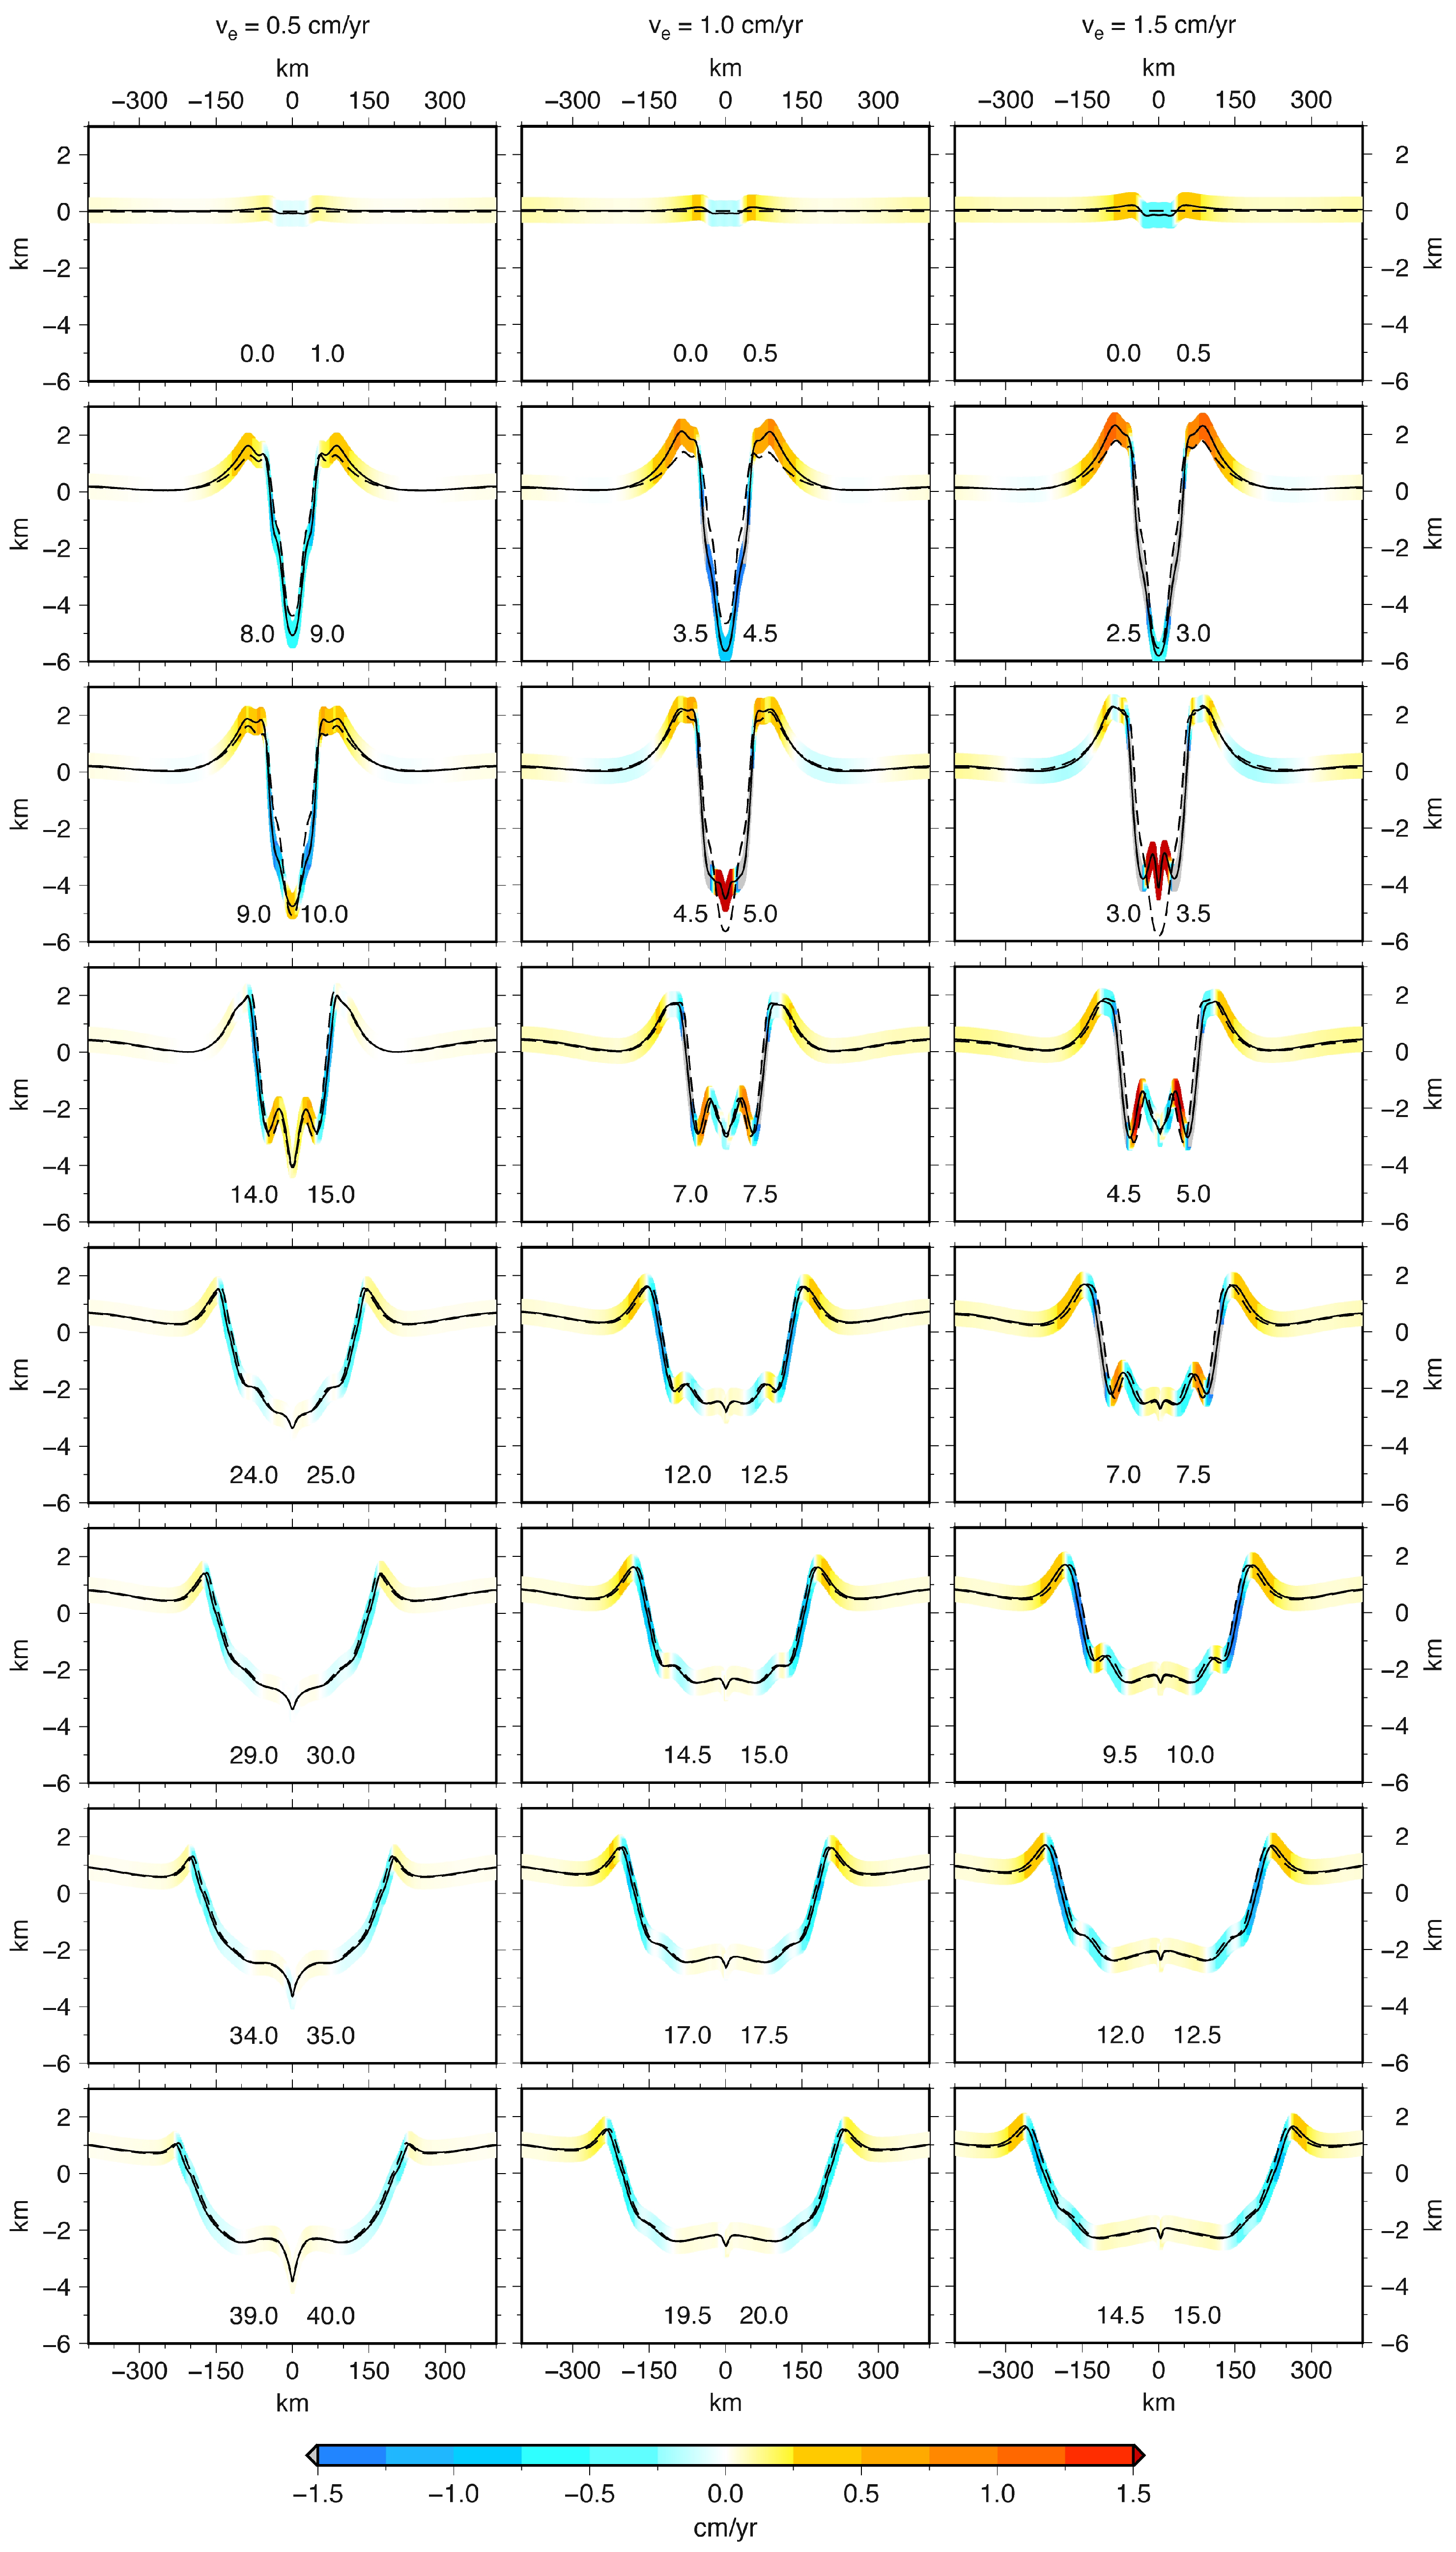
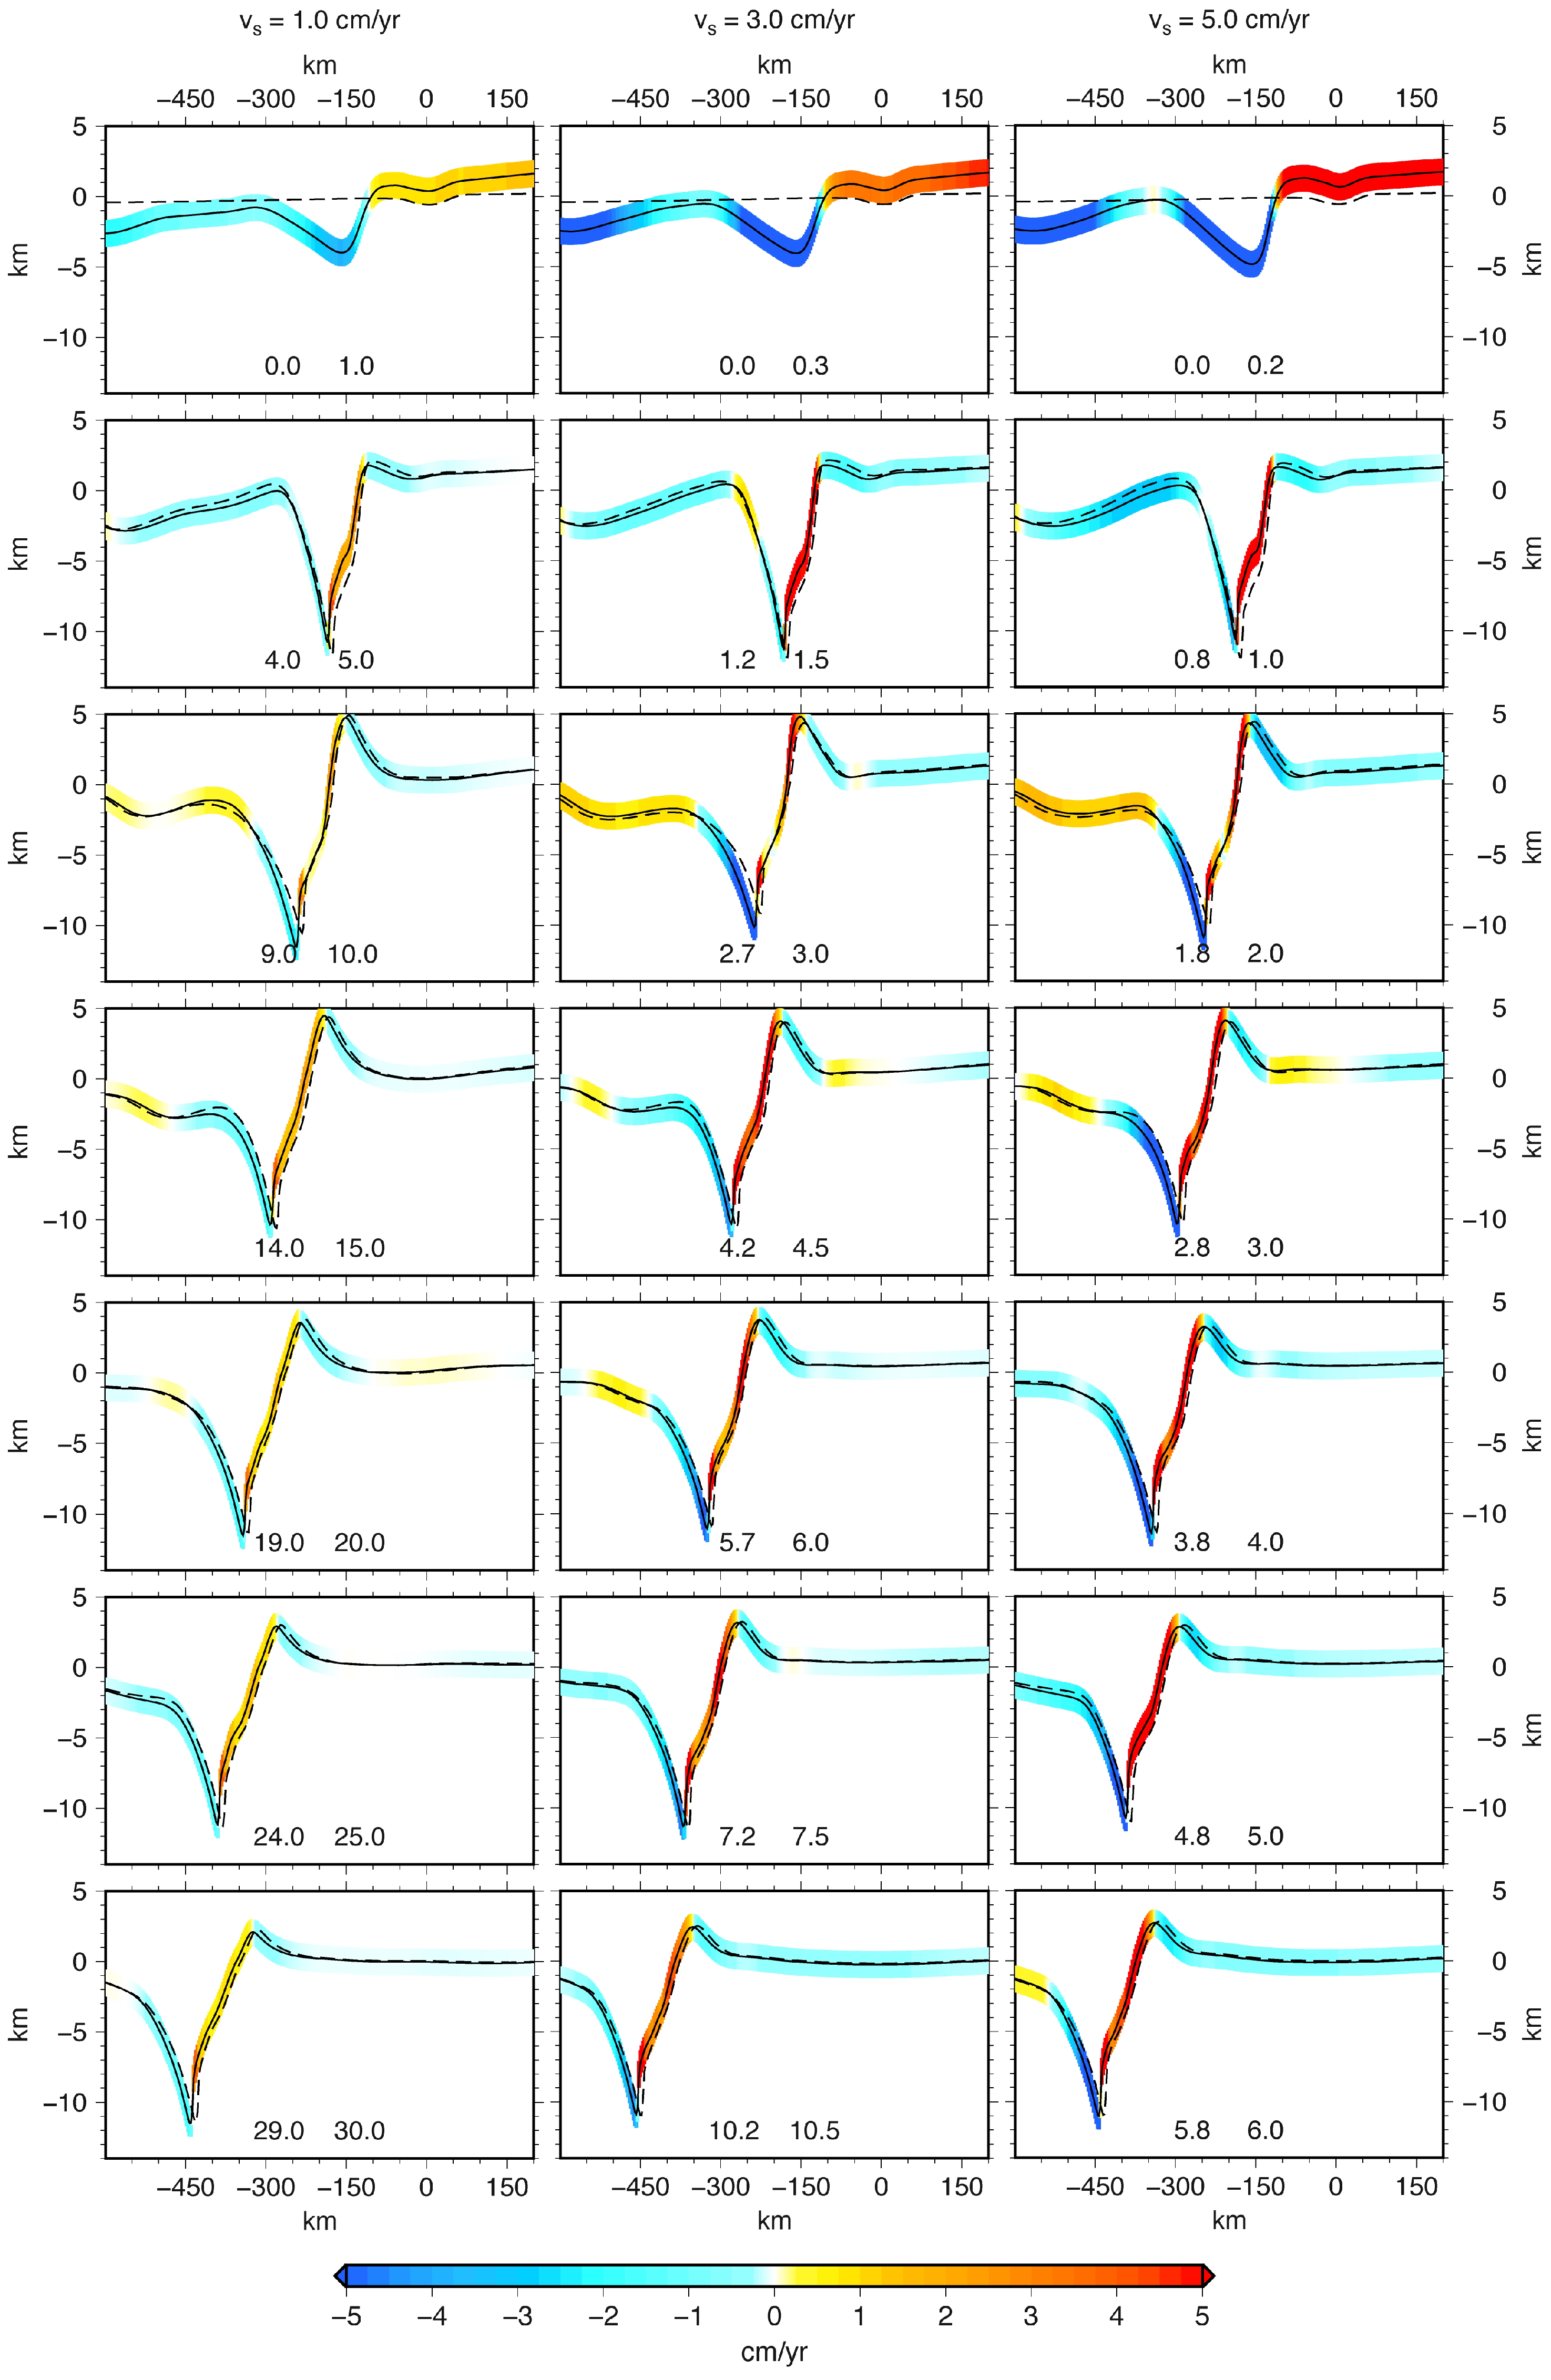
Figure 10 portrays the variation in time of the topography in kilometers, with the two black lines indicating the bathymetry when considering times t 0 (dashed line) and t 1 (continuum line) to compute the rate. The colors indicate the magnitude of the rate and the direction of vertical motion (red for uplift and blue for subsidence, both in cm/yr).
The three phases of rifting are visible in this figure as well. For each extensional velocity a first phase of subsidence is evident over the ridge zone up to a maximum of about 6 km, which is due to the cooling of the emplaced oceanic material. This is flanked by peripheral bulges with heights ranging from about 2 km for low extensional rates (left column) to 3 km for higher extensional rates (right column). During this phase, the maximum rate of uplift ranges from 0.25 cm/yr for low extensional rates to about 1.0 cm/yr for higher extensional rates; the maximum rate of subsidence ranges from 0.4 cm/yr for low extensional rates to more then 1 cm/yr for higher extensional rates. It is worth noting the linear correlation between the time when the maximum subsidence of the ocean basin occurs and the extensional rate, although the maximum peak-to-peak values differ by about 2 km between the slow and fast models.
After this initial fast phase, the vertical rates in the central part of the ocean undergo a reduction in magnitude and even a change in direction, becoming slightly negative at about −0.3 ÷ −0.2 cm/yr in the inner parts of the bulges and positive at about 0.1 ÷ 0.2 cm/yr in the outer and central parts of the rifting. During this phase, the depth of the basin is reduced to around 2 km and the bulges migrate outward, requiring positive outward and negative inward vertical velocities. In the steady state, the positive topography is 1 ÷ 1.5 km and the basin depth is about 2 km. There are negative rates at the basin flanks, which do not diminish below −0.6 ÷ −0.4 cm/yr because these areas have to accommodate the enlargement of the basin. There is also a slightly positive topography at the center at the rate of 0.1 ÷ 0.2 cm/yr, which is due to the refilling of hot oceanic material beneath the basin.
Figure 6 and Figure 10 show that the smaller maximum and the minimum in the gravity rate of change are due to the dynamic topography, which can be assimilated to surface density contrasts; on the other hand, the larger maximum closer to the ridge is due to deep-seated positive density contrasts between the ocean and the continent. Said in another way, positive and negative density contrasts, respectively due to deep-seated density contrasts and to the basin being filled with water, are responsible for the dipolar pattern of the two largest peaks in the gravity rate of change seen in the third column of Figure 6, while the peripheral positive topography is responsible for the secondary positive peak. The gravity rate of change vanishes just as the vertical rates do in Figure 3, Figure 6 and Figure 7 in the flat part of the basin; further from the ridge, the gravity rate of change and vertical velocities of the Earth’s surface differ substantially from zero due to horizontal tectonic motion of the density contrasts. Thanks to the high spatial resolution of our modeling both physically and with respect to gravity, we obtain another piece of fundamental information indicating how the system maintains sizable gravity rates of change. Specifically, the negative dynamic topography, which tends to offset the positive contribution from deep-seated density contrasts, is displaced completely outward with respect to the deepest flat basin, i.e., towards the continent, thereby leaving space for alternating positive and negative gravity rates of change. The negative gravity rate of change has the same absolute amplitude as the positive one due to deep-seated density anomalies. This is expected, since for the negative topography or basin the response of the system tends to compensate for the positive deep density anomalies, while horizontal viscoplastic flow maintains the outward displacement of negative topography in the direction of extension. This in turn impedes the ability of compensation to maintain a gravity rate of change different from zero at the edges of the rift during horizontal motions.

3.2. Subduction

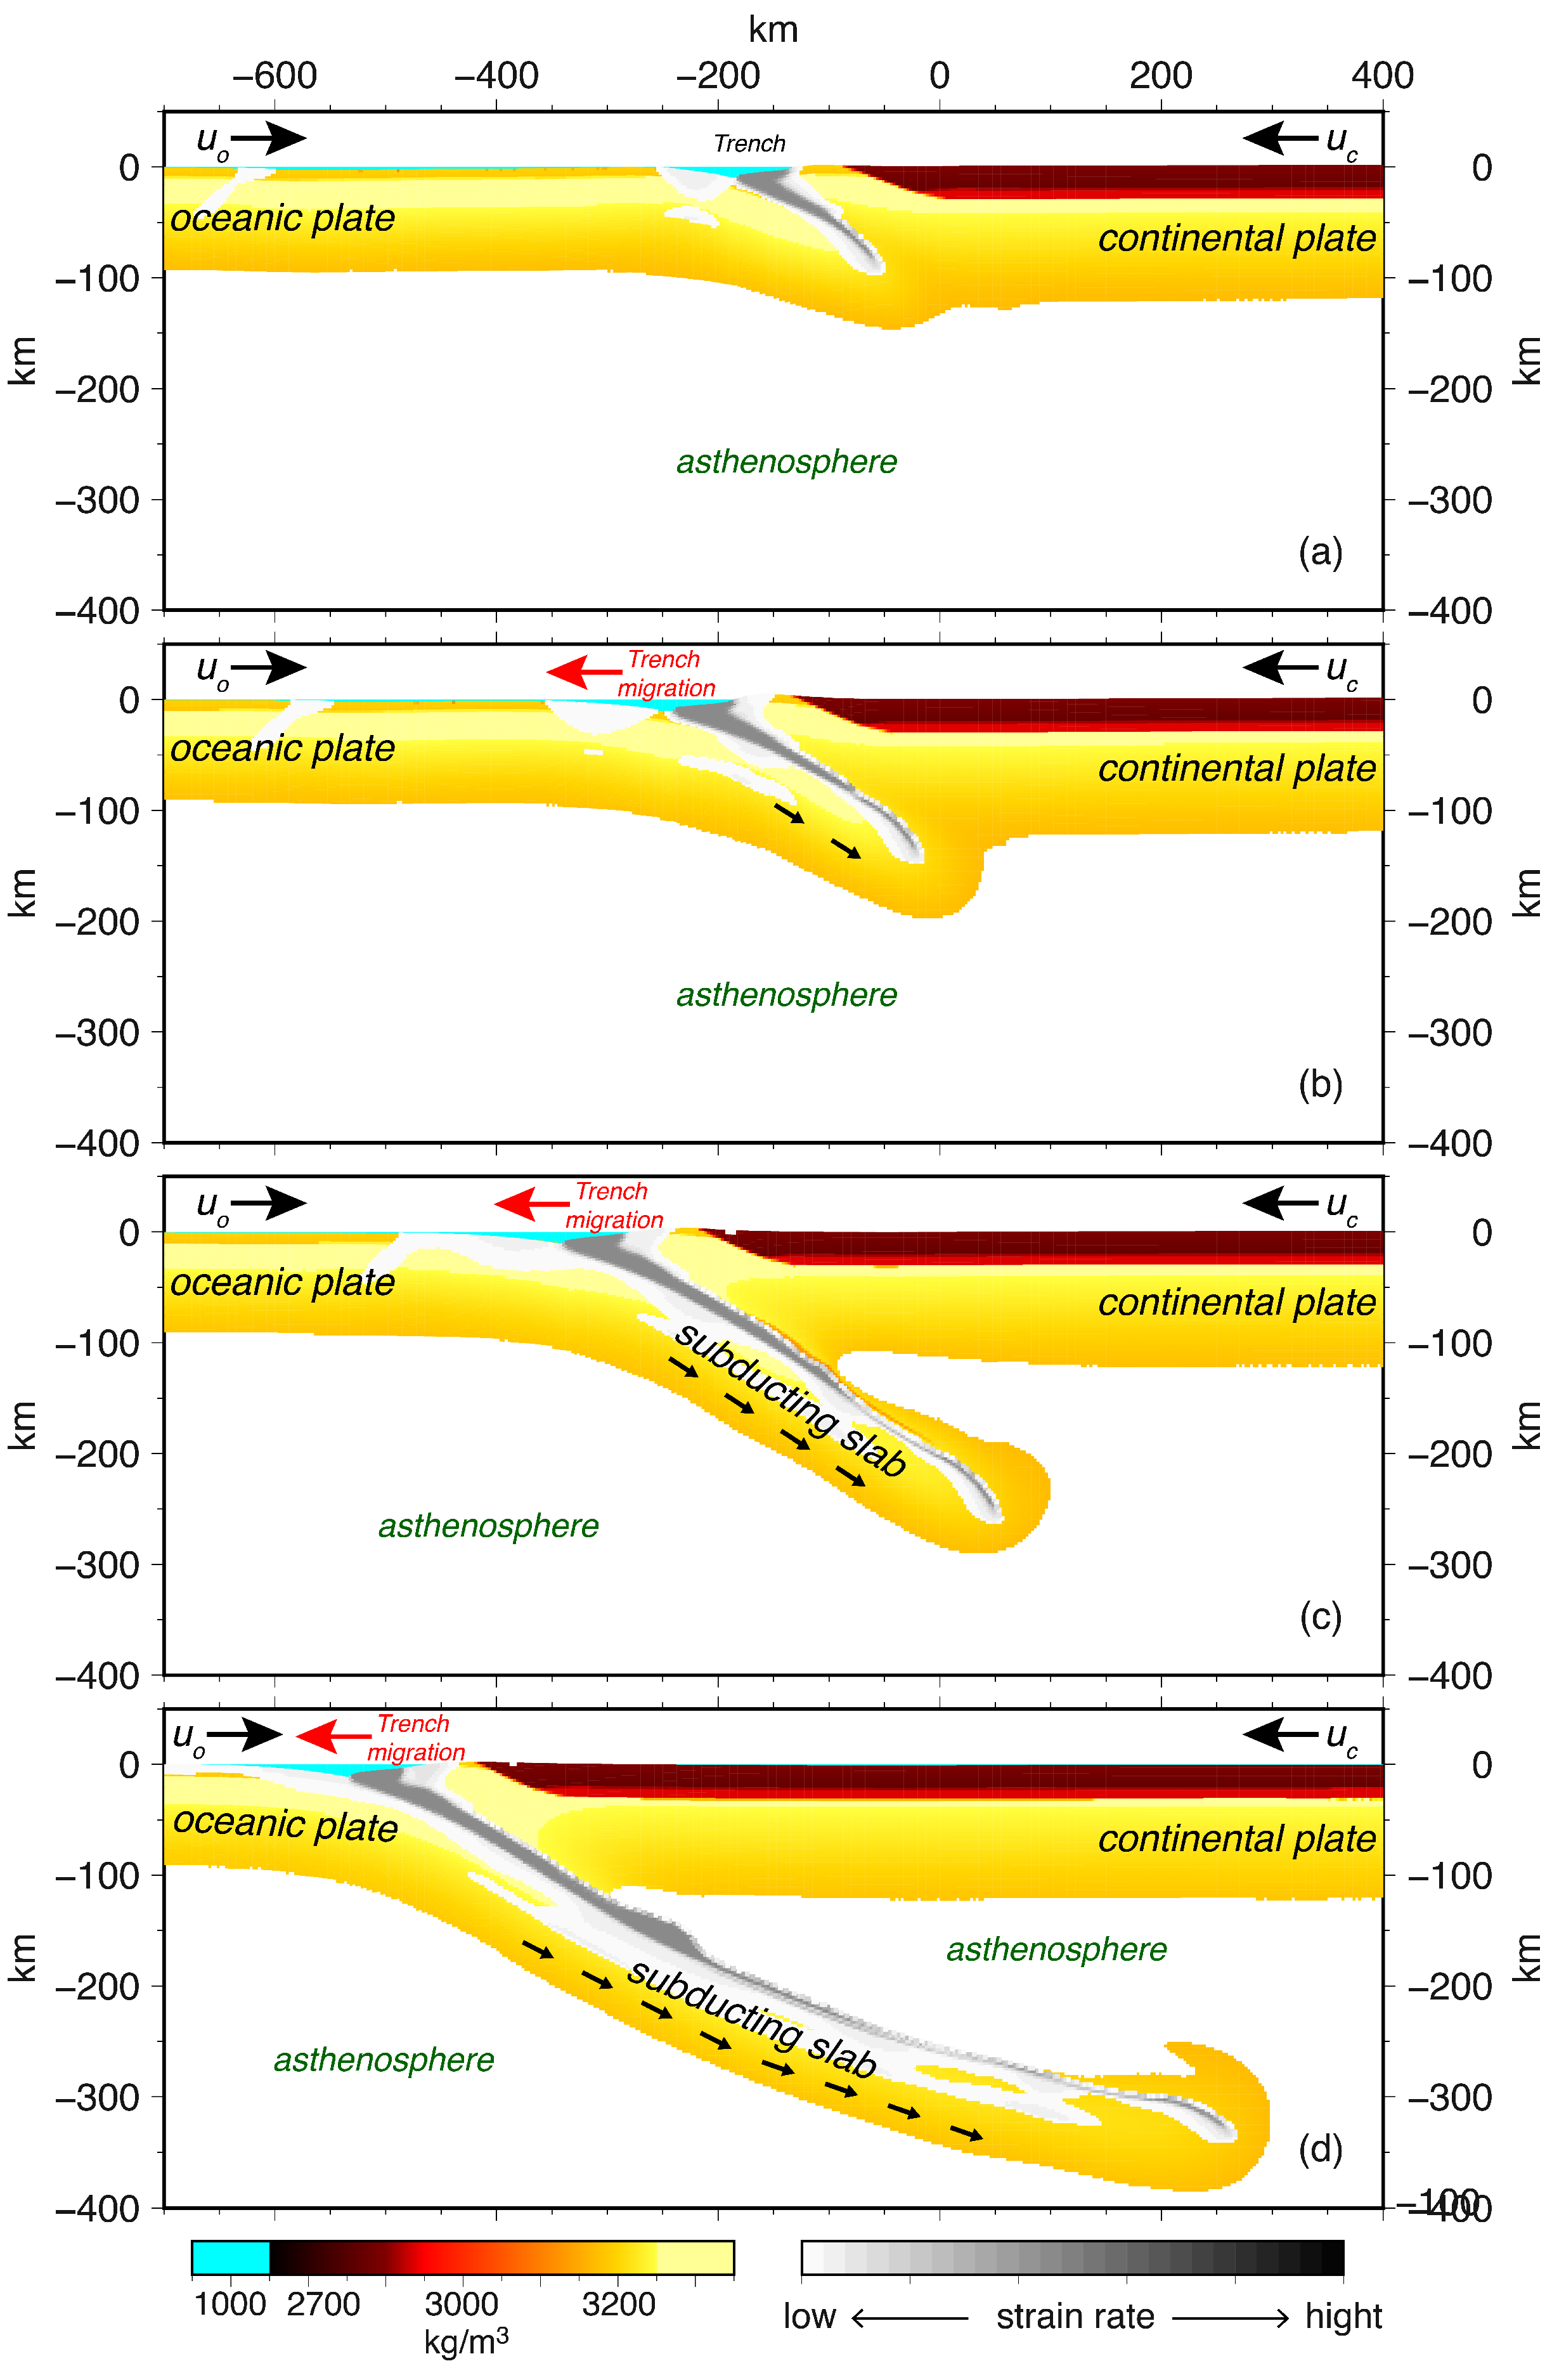
All the analyzed models of ocean–continent subduction are characterized by an initial phase of crustal thickening, with the development of a deep trench and high strain rate localized at the plate margin (panel a of Figure 11). With the progression of convergence, subduction begins; if the trench is not locked, trench migration occurs oceanward, coeval to trench deepening. The strain rate localizes inside the oceanic crust, generating an initial fracture zone, then intensifies and widens along the subduction plane.

3.2.1. Modeled Gravity Rate of Change

Figure 12 shows the gravity rate of change during a subduction forced by a velocity prescribed on both lateral boundaries of the lithosphere (panel b of Figure 1). The gravity rate of change is sampled at different times of evolution and normalized with respect to the prescribed forcing velocity, as was done for rifting in the normalized results of Figure 8. Panels a1–c1 of Figure 12 include all the contributions from deep-seated density anomalies and dynamic topography. The latter accounts for the negative topography filled with water. Panels a2–c2 show the contribution from positive dynamic topography only, a3–c3 from deep density anomalies and negative dynamic topography filled with water, and a4–c4 the contribution of negative dynamic topography filled with crustal material with a density of 2790 kg/m3. As for rifting, panels a1–c1 are obtained by summing a2–c2 and a3–c3.
As was done for rifting, the predicted gravity rate of change induced by subduction is invariant with respect to the prescribed forcing velocity. In contrast to rifting, in the case of subduction we are dealing with a single phase, as the system under scrutiny is divided into a continental and oceanic lithosphere from the onset of convergence.
The patterns of the normalized gravity rate of change show an alternation of two negative peaks separated by one positive peak (panels a1–c1 of Figure 12). These panels represent the total contributions arising from deep-seated density anomalies and dynamic topography. The former are positive and originate from uplifted crust with respect to the air, while the latter originate from water substituting for crust in depressed regions, where we have added the water at heights below zero in altitude.
At the steady state, the gravity rate of change pattern is characterized by a broad positive maximum flanked by two broad minima (solid lines). This pattern moves oceanward at the same rate as trench migration (e.g., 1 cm/yr in panel a1), as shown by the distance of about 300 km traveled in 30 Myr between the peaks of the dotted and solid lines, which is the same as that imposed at the right edge of the model. The distance between the positive and negative peaks is about 150 km, meaning that the horizontal dimension of the whole pattern in which the gravity rate of change differs from zero is 350 km. This horizontal dimension of the gravity rate of change pattern indicates the time span required for the system to attain equilibrium; the gravity rate of change is zero over the continent over a distance of about 100 km, which is the distance covered at the rate of 1 cm/yr in 10 Myr. This time interval is comparable to that required to reach the steady state, as indicated by the dashed line compared to the dash-dotted lines.
Depending on the trench migration velocity, the steady state for the positive gravity rate of change peaks is reached in 30 Myr for 1 cm/yr, 9 Myr for 3 cm/yr, and 6 Myr for 5 cm/yr (the dash-dotted lines in panels a1–c1). Negative minima are subject to larger variations prior to reaching the steady state due to dynamic topography, as can be seen in Section 3.2.3. Trench migration is responsible for the development of significant topographic reliefs in subduction contexts, and as such makes a large contribution to the gravity rate of change. The solid curve normalized minima considering all trench migration velocities vary in the range −0.1 ÷ −0.07 μGal/yr, while the positive maxima vary in the range 0.13 ÷ 0.17 μGal/yr. It is also interesting to consider the peak-to-peak normalized values of 0.21 μGal/yr for 1 cm/yr of trench migration, 0.24 for μGal/yr for 3 cm/yr, and 0.24 μGal/yr for 5 cm/yr. This equates to non-normalized peak-to-peak values of 0.21 μGal/yr for 1 cm/yr, 0.72 μGal/yr for 3 cm/yr, and 1.2 μGal/yr for 5 cm/yr.
Panels a2–c2 of Figure 12 portray the contributions from the positive dynamic topography, indicating that the minima of these panels contribute to the largest minima in a1–c1 and not to the smaller ones. At steady state, the positive peaks in a2–c2 are larger in magnitude compared to the negative ones by at least a factor three, meaning that the oceanward migration of the positive uplifted part of the overriding continental crust is dominant, but contributes to broadening the positive values of a1–c1 and not to increasing the positive peak (from a2 to c2, peak-to-peak normalized values are 0.1 μGal/yr for 1 cm/yr of trench migration, 0.15 μGal/tr for 3 cm/yr, and 0.14 μGal/yr for 5 cm/yr, for non-normalized values of 0.1 μGal/yr, 0.45 μGal/yr, and 0.7 μGal/yr). The positive gravity rate of change is due to the leftward motion of positive topography, which causes dense continental crust to substitute for air. This is in agreement with what we expect from the motion of the positive peak of dynamic topographies at subduction zones [23].
Panels a3–c3 of Figure 12 show the gravity rate of change due to all density anomalies below zero. This excludes the positive dynamic topography of panels a2–c2, where the negative dynamic topography is filled with water, as well as that of panels a4–c4, where the negative dynamic topography is filled with crustal material with a density of 2790 kg/m3. This operation corresponds to applying the Bouguer correction only to the negative dynamic topography of the depressed crust. Thus, panels a3–c3 and a4–c4 highlight the contribution arising from deep-seated density anomalies, as the contributions from the positive topography and negative topography close to the surface are reduced by 1000 kg/m3 in panels a3–c3 or by 2790 kg/m3 in panels a4–c4. Because panels a1–c1 include all the contributions and the negative topography is filled with water, the results of panels a1–c1 can be seen as the sum of panels a2–c2 and a3–c3. Panels a4–c4 show that the contribution from deep-seated density anomalies in the normalized gravity rate of change is characterized by an alternating sequence of a minimum of −0.02 μGal/yr, a positive maximum of 0.06 μGal/yr, and a lower minimum of −0.06 μGal/yr. The largest peak-to-peak value is 0.12 μGal/yr, which remains constant for the three convergence velocities, indicating that the system is linear as regards the deep-seated density anomalies. It is noteworthy that this value is about half of the peak-to-peak value in panels a1–c1, suggesting that the contribution from dynamic topography is equal to that from deep-seated density anomalies. Infilling with a density of 3000 kg/m3 would produce the same results, suggesting that the continental crust is sufficient to hinder the contributions from the dynamic topography. Comparing panels a1–c1 and a4–c4 shows that the first oceanward minimum in panels a1–c1 originates from deep negative density anomalies. When these move oceanward, they substitute denser material, producing a negative rate of change (panels a3–c3) with no contribution from the dynamic topography, which is zero in this region. The broad maxima are due to the oceanward motion of a positive deep density contrast and to the motion of the positive surface topography of panels a2–c2. It is worth noting that the motion of the positive dynamic topography is 50% of the peak-to-peak value and broadens the positive peak of the gravity rate of change, as shown in panels a1–c1. The continental minima originate from the horizontal oceanward motion of negative deep-seated density anomalies, as indicated by panels a4–c4, and to a lesser extent from the negative topography of panels a2–c2.
To better understand the impact of trench migration on gravity changes over time, it is useful to compare the normalized gravity rate of change discussed above for each panel (a1–c1 and a3–c3) with the case of no trench migration (red curves). Only the results for 1 cm/yr and 3 cm/yr are shown, as 5 cm/yr would not provide additional information. The trench, which corresponds to the lowest gravity rate of change, grows at about −100–−50 km oceanward with respect to the initial ocean–continent boundary in panels a1,b1, where the velocity is set to zero at the right edge and remains at the imposed velocity of 1 cm/yr at the left edge. The most striking difference compared to trench migration is the fixity of the red patterns in the horizontal direction, along with the generally lower values (both positive and negative). At steady state (solid red curves), these values attain a rather smooth shape except for the sharp minimum at the trench. There is a global positive rate of change over the shallowest part of the subducting oceanic lithosphere and a sharp minimum at the trench. Before the steady state is reached, the patterns undergo larger changes than in cases involving trench migration, reflecting the complexity of density changes within the subduction environment in the absence of horizontal trench velocity. Nonetheless, it is worth emphasizing that in panels a1 and b1, which include all the contributions, the peak-to-peak values at the steady state are 0.03 ÷ 0.04 μGal/yr; during the transient phase (dashed curves), the peak-to-peak values can be as high as 0.08 ÷ 0.1 μGal/yr. A comparison between panels a1,b1 and a2,b2 shows that the localized negative peak, which varies in time, is caused by the collapse of the positive dynamic topography before the steady state is reached at the fixed trench. Panels a3 and b3, which include both deep density anomalies and negative topography infilled with water, maintain the values of panel a1–c1 except for the minimum towards the continent, since water reduces the density anomaly near the surface compared to air. Filling the negative topography in panels a4 and b4 with dense material reduces the gravity rate of change at the steady state, leaving space for contributions from deep-seated density anomalies (essentially those attributable to the cold slab) of about 0.01 μGal/yr. This is in agreement with the value obtained by [23] for subduction with no trench migration at the steady state.
Similar to Figure 5 for rifting, Figure 13 shows the gravity rate of change (solid red lines in panel a) calculated at topographic level (red lines in panel b) for the same model shown in Figure 12. Compared to the value calculated at a uniform altitude of 5 km (solid black lines in panel a), a difference in magnitude can be seen up to a maximum of approximately 0.05 μGal/yr in both the maximum and minimum values as well as in the occurrence of high-frequency features in the areas of the steepest variations, which is similar to what we observed for rifting.

3.2.2. Gravity Rate of Change vs. Density Rate of Change

Figure 14 (top row) portrays the predicted densities for the three trench migration velocities (from left to right). It can be seen that the pattern migrates oceanward. The middle row portrays the non-normalized gravity rate of change corresponding to the same timing as the top and bottom rows. The bottom row shows the density rate of change, which is responsible for the gravity rate of change in the middle row. Depending on the trench migration velocity, the density distribution at the top is sampled at different times in order to achieve the same horizontal displacement. This portrays the characteristics of a subduction environment, including the mantle wedge area between continental and oceanic lithospheres, a downwarped oceanic lithosphere filled with water and light sediments from continental upper and lower crusts in the trench region, and shallow parts above the subducted oceanic lithosphere. As such, the densities in the color palette cover the whole range of values, from that of the water to that of the mantle material (3300 kg/m3), and depict the subduction environment at the times of the dashed curves in panels a1–c1 of Figure 12 (20 Myr, 6 Myr, and 3.8 Myr, which is close to 4 Myr).
The bottom row shows that there are two mechanisms responsible for density changes: a global one that cools mantle material beneath the oceanic lithosphere as well as within the mantle wedge in the two broad areas where the density rate of change varies between 0 and 200 ×10−6 kg/m3/yr, and a localized mechanism at contacts where the density varies due to the substitution of dense material by light material during horizontal motion and vice versa. From the deepest part of the trench basin to the contact with the continent, the dynamics of the mantle wedge are responsible for both broad and localized positive density rate of change, which is due to the global cooling within the mantle wedge and the replacement of sediments in the basin and in the oceanic upper crust by cooled dense mantle material, extending from the basin to large depths at the contact with the subducted lithosphere. These positive density rates of change are responsible for the maxima in the middle row, ranging from 0.15 μGal/yr for 1 cm/yr to 0.55 μGal/yr for 3 cm/yr and 1.0 μGal/yr for 5 cm/yr. This is the same as the maxima in panels a1–c1 of Figure 8 when non-normalized and compared with the same timings (dashed curves). Two smooth regions with negative density rates of change (in blue) are localized on the retreating and downwarping oceanic lithosphere beneath the basin and at the left edge of the continent. These regions are responsible for the two broad gravity-change minima in the second row. Here the minima due to the leftward motion of the continent are a factor two larger than the first minima on the left under the basin. These figures for the density and density rate of change allow us to visualize the quantitative results of Figure 12.

3.2.3. Topography

Figure 15 portrays the topography (solid lines) and its uplift ( from yellow to light violet) or downlift (from light blue to blue) in steps of about 5 × 10⁵ yr and at timings that allow us to make a direct comparison among the three trench migration velocities. Each column corresponds to a different trench migration velocity, with the scale ranging from −1 cm/yr to 1 cm/yr. The topography pattern is the classical one for subduction environments, with positive topographic relief of a few kilometers and negative topography at the trench, which in our case is about 10 km at the steady state. Observing the changes from the first row to the bottom row, we see a transition from a smooth pattern to a sharper one at steady state. Considering the fifth row, corresponding to the same timing as in the previous figure, the colors overprinting the solid curves show that the blue and yellow–red colors are located in the same regions for both the vertical and density rates of change. In fact, we observe blue on the right flank of the positive topographic relief, indicating downlift due to its oceanward migration, which means that air is substituting for the crust and causing a negative density rate of change. On the left, we observe uplifting of the left flank of the positive topographic relief, which means that the crust is substituting for the air and causing a positive density rate of change. Finally, to the left of the trench, we observe downwarping of the oceanic lithosphere, with water substituting for the crust and causing a negative density rate of change. Notably, the vertical velocities are in the same range as those observed for rifting.

4. Discussion

There are different extensional contexts in nature to which our results can be applied. For example, the present-day setting of the Gulf of Aden is intermediate between panels b and c of Figure 4; the extensional velocity is about 1.25 cm/yr at each edge, and the rift is 35 Myr old [22]. Therefore, it is in a steady state, with a peak-to-peak gravity rate of change of 0.08 μGal/y at the northern and southern coasts of the gulf. Our results can also be applied to incipient active rift zones (phase I of Figure 4, panel a) such as the Okavango–Makgadikgadi Rift Zone in South Africa [43,44], the Magadi and Natron basin in East Africa [33], and the Western Ionian Sea [45]. As for rifting, our results can be applied to various subduction settings, such as along the coasts of South America and the Pacific Northwest [34].
The pattern of the gravity rate of change from rifting is characterized by two maxima: the largest is towards the ridge, due to the horizontal motion of the positive density contrast between the oceanic and continental lithosphere moving away from the ridge, while a smaller one is over the continent, due to the migration of the positive topography. These two maxima are intermingled by a minimum caused by the motion of the sea basin and the thick underlying remnant of the continental crust towards the continent. The peak-to peak values are 0.03 μGal/yr for extensional velocity of 0.5 cm/yr, 0.08 μGal/yr for 1 cm/yr, and 0.11 μGal/yr for 1.5 cm/yr.
In the case of subduction with trench retreat, the pattern of the gravity rate of change is characterized by a positive peak due to the positive density anomalies caused by dense mantle wedge material substituting for lighter upper oceanic crust and sediments in the trench. This peak is flanked by two minima: one due to the presence of water in the basin substituting for the oceanic crust, and the other due to the oceanward migration of the continental crust substituting for denser mantle material. The peak-to-peak values are 0.21 μGal/yr for a trench migration velocity of 1 cm/yr, 0.72 μGal/yr for 3 cm/yr, and 1.2 μGal/yr for 5 cm/yr.
The occurrence of trench migration drives horizontal mass displacement that is just as significant as that due to the vertical mass displacement along the subducting slab but at shallower depths. This means that the gravity rate of change portrays some similarities with that predicted at the margins in extensional systems. Findings on the gravity rate of change occurring during subduction driven by convergence velocities between 1 cm/yr and 3 cm/yr with no trench migration show that the order of magnitude of the gravity rate of change decreases drastically by one order of magnitude compared to trench migration. This confirms previous results obtained by [23].
For both rifting and subduction with trench migration, the magnitude and the pattern of the normalized gravity rate of change are invariant with respect to the prescribed plate velocity. This supports the idea that the fundamental physical mechanism driving the gravity rate of change is the horizontal motion of density contrasts at depth, mostly from the surface to around 30 km, accompanied by changes in the dynamic topography. In both rifting and subduction with trench migration, dense mantle material replaces lighter continental material, resulting in a positive gravity rate of change. In contrast, basin migration in both tectonic processes is responsible for negative contributions. The dynamic topography contributes differently to the gravity rate of change in the rifting and trench migration cases due to the significantly higher topographic relief in subduction zones compared to rifting contexts. Thus, patterns from rifting and subduction with trench migration are characterized by an alternation of maxima and minima due to the interplay of deep density contrasts and dynamic topography. Dynamic topography tends to compensate for the positive contribution to the gravity rate of change from deep density contrasts in both rifting and subduction, with trench migration not present to offset the latter. Thus, horizontal motion is ultimately responsible for maintaining the system out of static equilibrium in proximity of the margins (over 100–150 km), leaving space to complete static equilibrium only in the region completely unaffected by horizontal motion. Focusing on the gravity rate of change from two slow tectonic mechanisms, namely, rifting and subduction, both of which are characterized by either horizontal and vertical motions and are responsible for significant gravity changes, allows us to contribute to filling the still-existing modeling gap in terms of general static tectonics and more realistic modeling. This indicates that slow tectonics, at least in the specific cases considered here, can be expected to induce significant gravity changes. Finally, it is worth emphasizing that the rate of change of gravity due to slow tectonics is at least one order of magnitude higher than that induced by other phenomena, such as the variations in the length of day over the past 2.5 billion years [12] or variations caused by the decrease in the geometrical flattening of the Earth over the past billion years [13,14].

5. Conclusions

We have investigated the gravity rate of change driven by rifting and subduction via 2D finite element modeling of the two tectonic mechanisms. We pursue the target of filling the time scale gap between a purely static gravity field and a time-dependent gravity field caused by transient phenomena. Here, we consider the 105–106 yr tectonic time scale, which leads to a linear variation in gravity over time and to constant patterns of the gravity rate of change during the selected lifetime.
Filling this modeling gap is complementary to filling the gap between GOCE, which detects the static gravity field at high spatial resolution, and GRACE–GRACE-FO, which have been successful in detecting the gravity changes from huge earthquakes, PGR, and GIA. The MAGIC space gravity mission, which is going to be launched around 2030, is expected to fill the gap between these two space gravity missions in terms of geodetic detectability of time-dependent gravity at high spatial and temporal resolutions. MAGIC has been proven to detect medium-sized earthquakes (Ms = 7.0–7.5) thanks to its high spatial and temporal resolution and several years of fly time, which together enable continuous recovery of earthquake gravity signature built up during the mission [5]. Similarly, the linear increase in gravity anomalies caused by rifting and subduction with trench migration, which are responsible for significant gravity changes over the mission’s fly time, makes these processes ideal candidates for deciphering slow tectonic processes in the Earth’s time-dependent gravity field. From this perspective, our findings quantify gravity changes at extensional and convergent plate boundaries, which are characterized by horizontal motions and provide a hint as to how precise geodetic instruments must be in order to detect the low rates of change in gravity due to slow tectonics.

Author Contributions

Conceptualization: A.M.M. and R.S.; formal analysis: V.F., A.M.M., A.R. and R.S.; investigation: V.F., A.M.M. and A.R.; methodology: V.F., A.M.M. and A.R.; project administration: A.M.M.; resources: A.M.M.; software: V.F., A.M.M. and A.R.; supervision: A.M.M. and R.S.; validation: V.F., A.M.M., A.R. and R.S.; visualization: A.M.M.; writing—original draft: V.F., A.M.M., A.R. and R.S.; writing—review: A.M.M. All authors have read and agreed to the published version of the manuscript.

Funding

This research was funded by the Italian Space Agency (ASI) project “NGGM-MAGIC—A breakthrough in understanding the dynamics of the Earth” (contract number 2023-22.HH.0 ASI-UNIMI).

Data Availability Statement

Data will be made available from the corresponding author upon request.

Acknowledgments

We are grateful to the Editor and the three anonymous Reviewers for their insightful comments and suggestions, which greatly improved the manuscript. All figures were made using Generic Mapping Tool (GMT) [46].

Conflicts of Interest

The authors declare no conflicts of interest.

Abbreviations

The following abbreviations are used in this manuscript:
GIAGlacial Isostatic Adjustment
GOCEGravity Field and Steady-State Ocean Circulation Explorer
GRACEGravity Recovery And Climate Experiment
GRACE-FOGRACE Follow-On
MAGICMass Change and Geophysics International Constellation
PGRPost-Glacial Rebound

References

  1. Matsuo, K.; Heki, K. Coseismic gravity changes of the 2011 Tohoku-Oki earthquake from satellite gravimetry. Geophys. Res. Lett. 2011, 38, L00G12. [Google Scholar] [CrossRef]
  2. Li, J.; Chen, J.; Zhang, Z. Seismologic applications of GRACE time-variable gravity measurements. Earthq. Sci. 2014, 27, 229–245. [Google Scholar] [CrossRef]
  3. Zhou, X.; Cambiotti, G.; Sun, W.; Sabadini, R. Co-seismic slip distribution of the 2011 Tohoku (MW 9.0) earthquake inverted from GPS and space-borne gravimetric data. Earth Planet. Phys. 2018, 2, 120–138. [Google Scholar] [CrossRef]
  4. Cambiotti, G. Joint estimate of the coseismic 2011 Tohoku earthquake fault slip and post-seismic viscoelastic relaxation by GRACE data inversion. Geophys. J. Int. 2019, 220, 1012–1022. [Google Scholar] [CrossRef]
  5. Cambiotti, G.; Douch, C.; Cesare, S.; Haagmans, R.; Sneeuw, N.; Anselmi, A.; AM, M.; Sabadini, R. On Earthquake Detectability by the Next-Generation Gravity Mission. Surv. Geophys. 2020, 41, 1049–1074. [Google Scholar] [CrossRef]
  6. Han, S.C.; Sauber, J.; Broerse, T.; Pollitz, F.; Okal, E.; Jeon, T.; Seo, K.-W.; Stanaway, R. GRACE and GRACE Follow-on gravity observations of intermediate-depth earthquakes contrasted with those of shallow events. J. Geophys. Res. Solid Earth 2024, 129, e2023JB028362. [Google Scholar] [CrossRef]
  7. Olsson, P.A.; Milne, G.; Scherneck, H.G.; Ågren, J. The relation between gravity rate of change and vertical displacement in previously glaciated areas. J. Geodyn. 2015, 83, 76–84. [Google Scholar] [CrossRef][Green Version]
  8. Olsson, P.A.; Breili, K.; Ophaug, V.; Steffen, H.; Bilker-Koivula, M.; Nielsen, E.; Oja, T.; Timmen, L. Postglacial gravity change in Fennoscandia—three decades of repeated absolute gravity observations. Geophys. J. Int. 2019, 217, 1141–1156. [Google Scholar] [CrossRef]
  9. Gałdyn, F.; Sośnica, K.; Zajdel, R.; Meyer, U.; Jäggi, A. Long-term ice mass changes in Greenland and Antarctica derived from satellite laser ranging. Remote Sens. Environ. 2024, 302, 113994. [Google Scholar] [CrossRef]
  10. Thompson, S.B.; Creveling, J.R.; Mitrovica, J.X. The sensitivity of tectonic uplift corrections to the penultimate deglacial ice volume and configuration. Quat. Sci. Rev. 2025, 353, 109210. [Google Scholar] [CrossRef]
  11. Khan, S.A.; Sasgen, I.; Bevis, M.; Van Dam, T.; Bamber, J.L.; WahR, J.; Willis, M.; Kjær, K.H.; Wouters, B.; Helm, V.; et al. Geodetic measurements reveal similarities between post–Last Glacial Maximum and present-day mass loss from the Greenland ice sheet. Sci. Adv. 2016, 2, e1600931. [Google Scholar] [CrossRef] [PubMed]
  12. Mancinelli, P.; Ranalli, G.; Pauselli, C. Non-Linear Effects of Gravity Change on Mantle Dynamics. Geosciences 2024, 14, 301. [Google Scholar] [CrossRef]
  13. Varga, P.; Denis, C.; Varga, T. Tidal friction and its consequences in palaeogeodesy, in the gravity field variations and in tectonics. J. Geodyn. 1998, 25, 61–84. [Google Scholar] [CrossRef]
  14. Varga, P. Temporal variation of geodynamical properties due to tidal friction. J. Geodyn. 2006, 41, 140–146. [Google Scholar] [CrossRef]
  15. Ricard, Y.; Fleitout, L.; Froidevaux, C. Geoid heights and lithospheric stresses for a dynamic Earth. Ann. Geophys. 1984, 2, 267–286. [Google Scholar]
  16. Richards, M.A.; Hager, B.H. Geoid anomalies in a dynamic Earth. J. Geophys. Res. Solid Earth 1984, 89, 5987–6002. [Google Scholar] [CrossRef]
  17. Zhong, S.; Gurnis, M. Viscous flow model of a subduction zone with a faulted lithosphere: Long and short wavelength topography, gravity and geoid. Geophys. Res. Lett. 1992, 19, 1891–1894. [Google Scholar] [CrossRef]
  18. Marotta, A.M.; Spelta, E.; Rizzetto, C. Gravity signature of crustal subduction inferred from numerical modelling. Geophys. J. Int. 2006, 166, 923–938. [Google Scholar] [CrossRef]
  19. Bassett, D.; Watts, A. Gravity anomalies, crustal structure, and seismicity at subduction zones: 1. Seafloor roughness and subducting relief. Geochem. Geophys. Geosystems 2015, 16, 1508–1540. [Google Scholar] [CrossRef]
  20. Liu, X.; Zhong, S. The long-wavelength geoid from three-dimensional spherical models of thermal and thermochemical mantle convection. J. Geophys. Res. Solid Earth 2015, 120, 4572–4596. [Google Scholar] [CrossRef]
  21. Mao, W.; Zhong, S. Constraints on mantle viscosity from intermediate-wavelength geoid anomalies in mantle convection models with plate motion history. J. Geophys. Res. Solid Earth 2021, 126, e2020JB021561. [Google Scholar] [CrossRef]
  22. Marotta, A.M.; Barzaghi, R.; Bollino, A.; Regorda, A.; Sabadini, R. The gravitational signature of the dynamics of oceanization in the Gulf of Aden. Tectonophysics 2023, 869, 230110. [Google Scholar] [CrossRef]
  23. Marotta, A.M.; Restelli, F.; Bollino, A.; Regorda, A.; Sabadini, R. The static and time-dependent signature of ocean–continent and ocean–ocean subduction: The case studies of Sumatra and Mariana subductions. Geophys. J. Int. 2020, 221, 788–825. [Google Scholar] [CrossRef]
  24. Gushurst, G.; Mahatsente, R. Lithospheric Structure of the Central Andes Forearc from Gravity Data Modeling: Implication for Plate Coupling. Lithosphere 2020, 2020, 8843640. [Google Scholar] [CrossRef]
  25. Yang, T.; Gurnis, M. Dynamic topography, gravity and the role of lateral viscosity variations from inversion of global mantle flow. Geophys. J. Int. 2016, 207, 1186–1202. [Google Scholar] [CrossRef]
  26. ESA. Gravity Field and Steady-State Ocean Circulation Explorer Mission—GOCE. Report of European Space Agency for Mission Selection; The 4th Candidate Earth Explorer Core Missions, SP-1233; Technical Report; ESA: Noordwijk, The Netherlands, 1999. [Google Scholar]
  27. Rummel, R.; Gruber, T. Gravity and steady-state ocean circulation explorer GOCE. In System Earth via Geodetic-Geophysical Space Techniques; Springer: Berlin/Heidelberg, Germany, 2010; pp. 203–212. [Google Scholar] [CrossRef]
  28. Tapley, B.D.; Bettadpur, S.; Ries, J.C.; Thompson, P.F.; Watkins, M.M. GRACE measurements of mass variability in the Earth system. Science 2004, 305, 503–505. [Google Scholar] [CrossRef]
  29. Tapley, B.D.; Bettadpur, S.; Watkins, M.; Reigber, C. The gravity recovery and climate experiment: Mission overview and early results. Geophys. Res. Lett. 2004, 31, L09607. [Google Scholar] [CrossRef]
  30. Regorda, A.; Thieulot, C.; van Zelst, I.; Erdos, Z.; Maia, J.; Buiter, S. Rifting Venus: Insights from numerical modeling. J. Geophys. Res. Planets 2023, 128, e2022JE007588. [Google Scholar] [CrossRef]
  31. Regorda, A.; Roda, M. Thermo-Mechanical Effects of Microcontinent Collision on Ocean-Continent Subduction System. J. Geophys. Res. Solid Earth 2024, 129, e2024JB029908. [Google Scholar] [CrossRef]
  32. Donea, J.; Huerta, A.; Ponthot, J.P.; Rodríguez-Ferran, A. Arbitrary Lagrangian–Eulerian Methods. In Encyclopedia of Computational Mechanics; John Wiley & Sons, Ltd.: Hoboken, NJ, USA, 2004; Chapter 14. [Google Scholar] [CrossRef]
  33. Lee, H.; Fischer, T.P.; Muirhead, J.D.; Ebinger, C.J.; Kattenhorn, S.A.; Sharp, Z.D.; Kianji, G.; Takahata, N.; Sano, Y. Incipient rifting accompanied by the release of subcontinental lithospheric mantle volatiles in the Magadi and Natron basin, East Africa. J. Volcanol. Geotherm. Res. 2017, 346, 118–133. [Google Scholar] [CrossRef]
  34. Schellart, W.P.; Stegman, D.R.; Freeman, J. Global trench migration velocities and slab migration induced upper mantle volume fluxes: Constraints to find an Earth reference frame based on minimizing viscous dissipation. Earth-Sci. Rev. 2008, 88, 118–144. [Google Scholar] [CrossRef]
  35. Naliboff, J.; Buiter, S.J.H. Rift reactivation and migration during multiphase extension. Earth Planet. Sci. Lett. 2015, 421, 58–67. [Google Scholar] [CrossRef]
  36. Gleason, G.C.; Tullis, J. A flow law for dislocation creep of quartz aggregates determined with the molten salt cell. Tectonophysics 1995, 247, 1–23. [Google Scholar] [CrossRef]
  37. Mackwell, S.J.; Zimmerman, M.E.; Kohlstedt, D.L. High-temperature deformation of dry diabase with application to tectonics on Venus. J. Geophys. Res. Solid Earth 1998, 103, 975–984. [Google Scholar] [CrossRef]
  38. Wilks, K.R.; Carter, N.L. Rheology of some continental lower crustal rocks. Tectonophysics 1990, 182, 57–77. [Google Scholar] [CrossRef]
  39. Petersen, K.D.; Schiffer, C. Wilson cycle passive margins: Control of orogenic inheritance on continental breakup. Gondwana Res. 2016, 39, 131–144. [Google Scholar] [CrossRef]
  40. Chopra, P.N.; Paterson, M.S. The experimental deformation of dunite. Tectonophysics 1981, 78, 453–473. [Google Scholar] [CrossRef]
  41. Turcotte, D.L.; Schubert, G. Geodynamics; Cambridge University Press: Cambridge, UK, 2002. [Google Scholar]
  42. Bollino, A.; Regorda, A.; Sabadini, R.; Marotta, A. From rifting to oceanization in the Gulf of Aden: Insights from 2D numerical models. Tectonophysics 2022, 838, 229483. [Google Scholar] [CrossRef]
  43. Scholz, C.H.; Koczynski, T.A.; Hutchins, D.G. Evidence for incipient rifting in southern Africa. Geophys. J. Int. 1976, 44, 135–144. [Google Scholar] [CrossRef]
  44. Grant, C.; Kolawole, F.; Williams, J. Evolution of rift faulting in incipient, magma-poor divergent plate boundaries: New insights from the Okavango-Makgadikgadi Rift Zone, Botswana. Earth Planet. Sci. Lett. 2024, 646, 118957. [Google Scholar] [CrossRef]
  45. Presti, D. Seismicity supports the theory of incipient rifting in the western Ionian sea, central Mediterranean. Ann. Geophys. 2020, 63, SE225. [Google Scholar] [CrossRef]
  46. Wessel, P.; Smith, W.H.F.; Scharroo, R.; Luis, J.F.; Wobbe, F. Generic Mapping Tools: Improved version released. Eos Trans. Am. Geophys. Union 2013, 94, 409–410. [Google Scholar] [CrossRef]
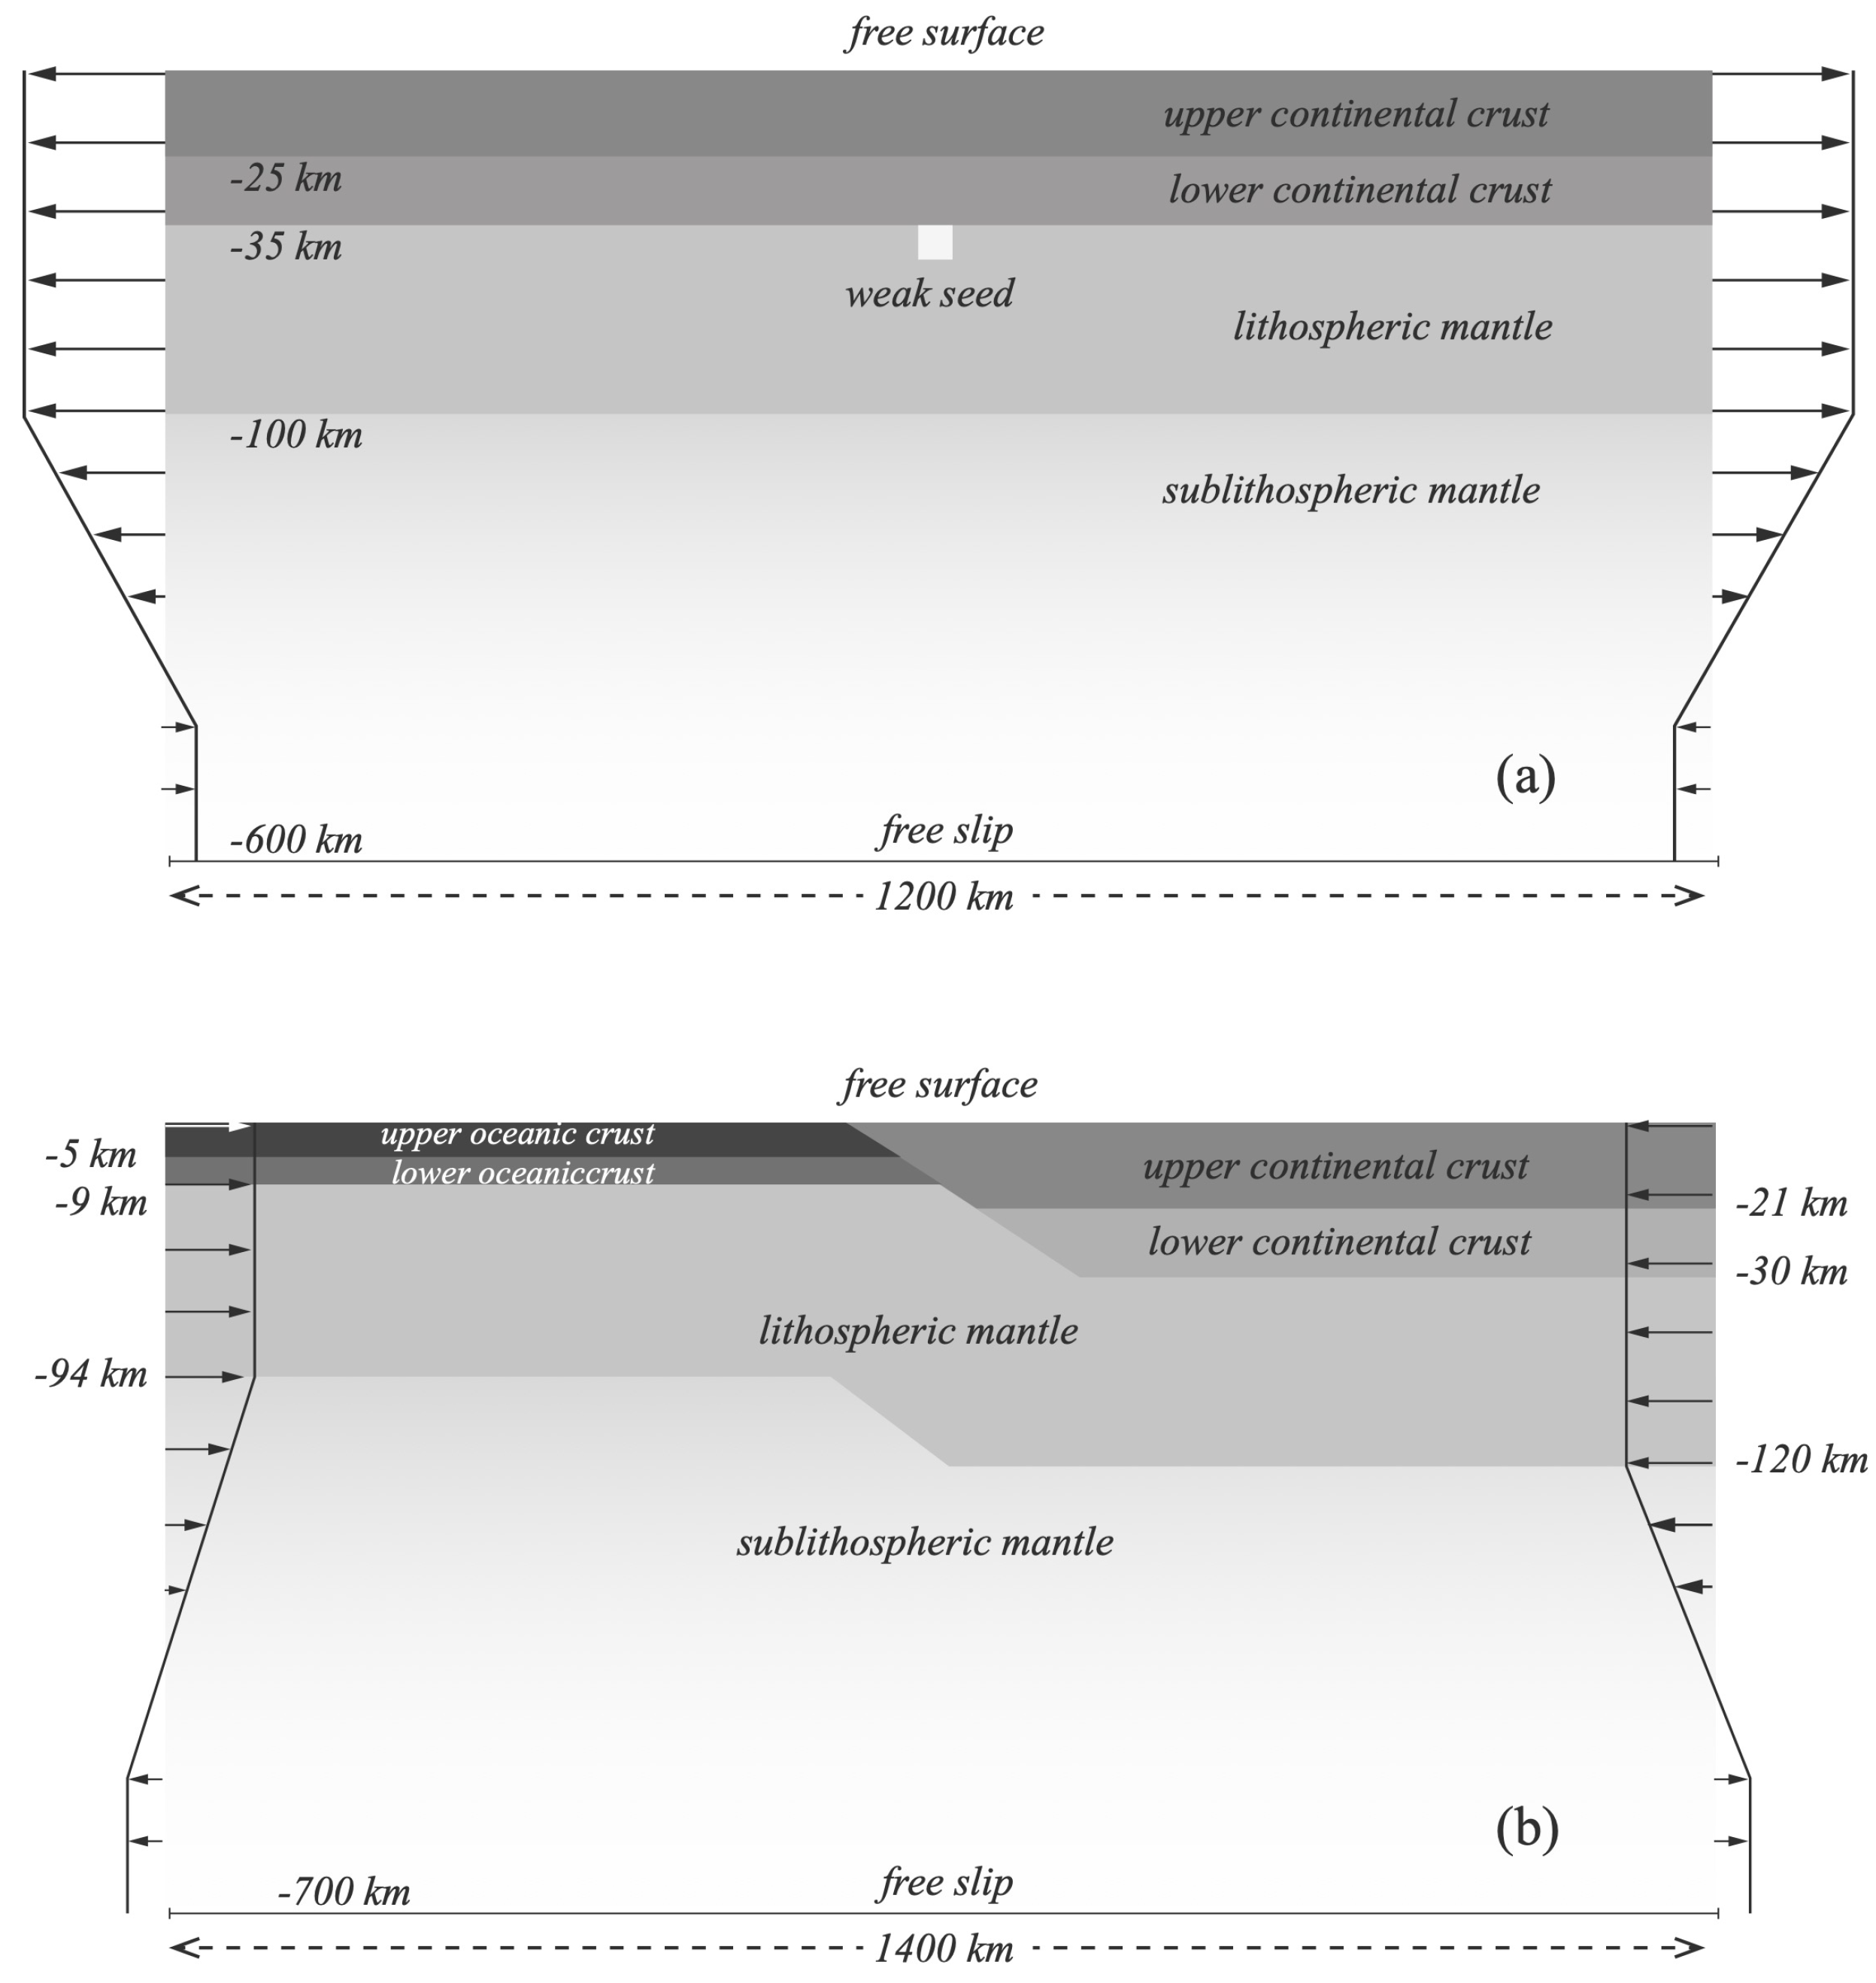
Figure 1. Model setup for rifting (panel (a)) and subduction (panel (b)). Distances are not in scale.
Geosciences 15 00359 g001
Figure 2. (a) Scheme used to compute the volume integrals of Equation (12). Distances are not in scale. (b) Procedure for regularizing the generic prismatic elements.
Geosciences 15 00359 g002
Figure 3. Representation of the different phases characterizing rifting. (a) Early rifting phase. (b) Advanced rifting phase. (c) Post breakup and seafloor spreading phases.
Geosciences 15 00359 g003
Figure 4. Gravity rate of change in μGal/yr during a rifting process occurring by prescribing an extensional velocity ( u e ) of 1 cm/yr at both continental plate boundaries, according to panel a of Figure 1. Panel (a) corresponds to phase I of [42], panel (b) to phase II, and panel (c) to phases III–IV. The gravity rate of change is calculated at the uniform altitude h = 5 km.
Geosciences 15 00359 g004
Figure 5. Gravity rate of change in μGal/yr (red lines in panels (a1)–(c1)) for the same model shown in Figure 4, now calculated at the topographic level shown in panels (a2)–(c2). The solid black lines indicate the value of gravity rate of change calculated at the same time at a uniform altitude of 5 km. The solid and dashed red lines in panels (a2)–(c2) indicate the topographic levels at the two successive times considered in calculating the gravity rate of change, with the solid line indicating the most recent. Cyan color indicates the water infill in areas undergoing subsidence.
Geosciences 15 00359 g005
Figure 6. Contributions to the gravity rate of change from only the positive dynamic topography (panels (a1)–(c1)) and deep-seated density anomalies. The negative dynamic topography is filled either with water (panels (a2)–(c2)) or crustal material (panels (a3)–(c3)). The gravity rate of change is calculated at the uniform altitude h = 5 km.
Geosciences 15 00359 g006
Figure 7. Density in kg/m3 (panels (a1)–(c1)), gravity rate of change in μGal/yr (panels (a2)–(c2)), and density rate of change in 10−6 kg/m3/yr (panels (a3)–(c3)) during a rifting process driven by extensional velocities of 1.0 cm/yr at 3 Myr (phase I), 6 My (phase II) and 20 Myr (phase III) of evolution. The gravity rate of change is calculated at the uniform altitude h = 5 km.
Geosciences 15 00359 g007
Figure 8. Gravity rate of change in μGal/yr during a rifting process occurring by prescribing an extensional velocity ( u e ) of 0.5 cm/yr (panels (a1)–(c1)) and 1.5 cm/yr (panels (a2)–(c2)) at both continental plate boundaries, normalized with respect to the corresponding extensional velocities. The gravity rate of change is calculated at the uniform altitude h = 5 km.
Geosciences 15 00359 g008
Figure 9. Gravity rate of change as function of distance from the trench and time of evolution for rifting models with prescribed velocity ( u e ) of 0.5 cm/yr (panel (a)), 1.0 cm/yr (panel (b)), and 1.5 cm/yr (panel (c)). The gravity rate of change is calculated at the uniform altitude h = 5 km. The solid black line indicates the location of the center of the rift, where breakup occurs when the solid black line forks. From this time onward, the solid black lines indicate the position of the passive margins. The solid gray lines indicate where the gravity rate of change becomes lower than 0.01 μGal/yr. The hatching (both black and gray) is used to predict the location of the black and gray lines in the time domain beyond the numerical simulation.
Geosciences 15 00359 g009
Figure 10. For the rifting models, topography (dashed black curves, in km) corresponding to the first prescribed time at the bottom left in each panel and vertical rates (colored curves in cm/yr) corresponding to the latest prescribed times (bottom right in each panel), providing the direction of vertical motion (red for positive or uplift, blue for negative or downlift). The first column stands for an extensional velocity of 0.5 cm/yr, the second for an extensional velocity of 1 cm/yr and the third for an extensional velocity of 1.5 cm/yr.
Geosciences 15 00359 g010
Figure 11. Representation showing the evolution of a subduction setting characterized by trench migration. (a) Initial convergence phase. (b) Beginning of subduction and trench migration. (c) Intermediate and (d) advanced phases of subduction and trench migration.
Geosciences 15 00359 g011
Figure 12. Gravity rate of change in μGal/yr during trench migration forced by a velocity ( u c ) of 1 cm/yr (panels (a1)–(a4)), 3 cm/yr (panels (b1)–(b4)), and 5 cm/yr (panels (c1)–(c4)) prescribed at both lateral boundaries of the lithosphere according to panel (b) of Figure 1. The values are normalized with respect to the prescribed velocities. Timing refers to time lapse from the onset of convergence. The red lines in panels (ai,bi) indicate how the gravity rate of change varies at the same times when no trench migration is allowed. The gravity rate of change is calculated at the uniform altitude h = 5 km.
Geosciences 15 00359 g012
Figure 13. (a) Gravity rate of change in μGal/yr for the same model as in Figure 12, calculated at the topographic levels shown in panel (b). The solid black line indicates the value of gravity rate of change calculated at the same time at a uniform altitude of 5 km. The solid and dashed red lines in panel (b) indicate the topographic levels at the two successive times considered to calculate the gravity rate of change, with the solid line indicating the most recent. Cyan color indicates the water infill in areas undergoing subsidence.
Geosciences 15 00359 g013
Figure 14. Density in kg/m3 (panels (a1)–(c1)), gravity rate of change in μGal/yr (panels (a2)–(c2)), and density rate of change in 10−6 kg/m3/yr (panels (a3)–(c3)) during a trench migration process forced by velocities ( u c ) of 1 cm/yr (panels (a1)–(c1)), 3 cm/yr (panels (a2)–(c2)), and 5 cm/yr (panels (a3)–(c3)) at prescribed times (as for panel (b) of Figure 1). The gravity rate of change is calculated at the uniform altitude h = 5 km.
Geosciences 15 00359 g014
Figure 15. Topography (dashed black curves) in km for the subduction models with trench migration. These curves correspond to the first prescribed time at the bottom left in each panel, while the vertical rates (colored curves in cm/yr) correspond to the latest prescribed times (bottom right in each panel), providing the direction of vertical motion (red for positive or uplift, blue for negative or downlift). The first column stands for a forcing velocity u c of 0.5 cm/yr, the second for an extensional velocity of 1 cm/yr, and the third for an extensional velocity of 1.5 cm/yr.
Geosciences 15 00359 g015
Table 1. Values of the compositional parameters used in the present analysis.
Initial ThicknessDensityHeat CapacityConductivityThermal ExpansionRadiogenic Heat Production
HρCpKαH
Layer (km) (kg/m3) (K m2/s2)(W/m/K)(10−5/K) (10−6 μW/m2)
Sediments -26508002.53.281.3
Upper Continental Crustrm2528008002.53.281.3
sm21
Lower Continental Crustrm1029508002.53.281.3
sm7
Upper Oceanic Crustrm-32008002.63.281.3
sm5 1.8 0.2
Lower Oceanic Crustrm------
sm432008002.63.280.2
Lithospheric Mantlerm65–903300 *12502.253.00.0
sm81–90
Asthenospheric Mantlerm580–6063300 *12502.253.00.0
sm500–610
Serpentine -300012502.253.00.0
Melt -290012502.253.00.0
* At reference temperature T r e f = 273.15 K. rm: rifting model; sm: subduction model. When not explicitly stated, the two models use the same parameter value.
Disclaimer/Publisher’s Note: The statements, opinions and data contained in all publications are solely those of the individual author(s) and contributor(s) and not of MDPI and/or the editor(s). MDPI and/or the editor(s) disclaim responsibility for any injury to people or property resulting from any ideas, methods, instructions or products referred to in the content.