Abstract
Almost two years after the devastating 1999 MW7.6 Chi-Chi earthquake, a new concept of time termed natural time (NT) was introduced in 2001 that reveals unique dynamic features hidden behind the time series of complex systems. In particular, NT analysis enables the study of the dynamical evolution of a complex system and identifies when the system enters a critical stage. Since the observed earthquake scaling laws indicate the existence of phenomena closely associated with the proximity of the system to a critical point, here we apply NT analysis to seismicity that preceded the 3 April 2024 MW7.4 Hualien earthquake. We find that in the beginning of September 2023 the order parameter of seismicity exhibited a clearly detectable minimum. Such a minimum demonstrates that seismic electric signal (SES) activity initiated which comprises several low-frequency transient changes of the electric field of the Earth preceding major earthquakes.
1. Introduction
Earthquakes (EQs) exhibit complex correlations in time, space, and magnitude, and the opinion prevails (e.g., [1] and references therein) that the EQs are critical phenomena. Two years after the disastrous Chi-Chi EQ that occurred in 1999, a new concept of time termed natural time (NT) [2] was introduced that identifies when a complex system approaches the critical point (CP). This concept generally enables the estimation of the time of an impending major EQ occurrence. Because almost 25 years later, the MW7.4 Hualien EQ occurred on 3 April 2024, it is of major importance to investigate whether the NT analysis could identify in advance the occurrence of these two major EQs in Taiwan region, i.e., the Chi-Chi EQ and the Hualien EQ, shown in Figure 1. To achieve such an investigation, the following steps are made: In the next Section 2, the basic points of natural time analysis are presented including the procedure of the derivation of the order parameter of seismicity by means of which one can approach the CP. In a subsequent Section 3, it is explained that the fluctuations of the order parameter of seismicity are minimized before major EQs. Our main results are presented in Section 4 and discussed in Section 5. Finally, Section 6 presents our conclusions.
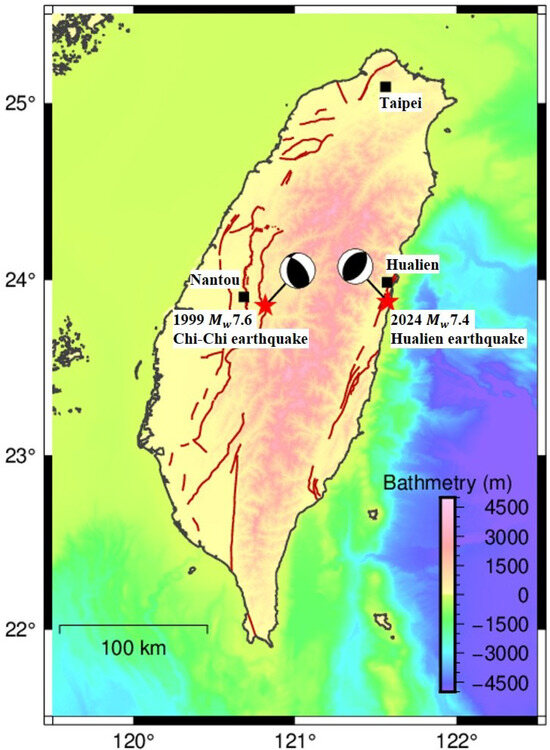
Figure 1.
Map of Taiwan depicting the epicenters and the EQ mechanisms for the 1999 Chi-Chi and the 2024 Hualien EQs.
2. Natural Time Background
For a time series comprising N events, we define as natural time , corresponding to the event that occurred k-th in order, the quantity [2,3,4]. Hence, in NT we ignore the conventional time durations between successive events. For each event, we consider, however, its energy denoted by and study the pairs , where . Due to its definition, for the k-th event can be considered as a probability that equals the aforementioned normalized energy.
In NT analysis, we investigate the properties of the distribution by means of the quantity , where with the angular natural frequency. In terms of probability theory, is the characteristic function of for all .
As is well known [5], when can provide information for the distribution since the derivatives (for m positive integer) as are related to the moments of .
The quantity of NT can be defined through the Taylor expansion where
A careful inspection reveals (see Chapter 6 of [3]) that the quantity may be considered as an order parameter of seismicity.
Another quantity that is useful in NT analysis is the entropy S in natural time [2,3,4]:
Entropy S, which exhibits [3] concavity and Lesche stability [6,7], is a dynamic entropy [3,4,8,9] fundamentally different from the Shannon entropy [10]:
or the Tsallis entropy (see, e.g., [11,12,13,14,15]):
introduced by Tsallis [16] in 1988. When are positive independent and identically distributed random variables, we obtain the so-called “uniform” distribution [3,4] and the corresponding entropy in natural time is .
Being a dynamic entropy, S changes its value to when we consider time reversal that reverses the order of the events, i.e., . In this case, we have
Thus, time reversal leads to a change of the entropy in NT, which is given by (for its applications see [3,4,8,9] and the references therein).
3. The Fluctuations of the Order Parameter of Seismicity
For the study of the fluctuations of the order parameter of seismicity , we should have a set of values for each target EQ. To this end, we consider the successive EQs that took place within a window of W events just before the target EQ in the seismic catalog. The window length W is selected so that it covers a period of a few months. We do so because the lead time of seismic electric signal (SES) activities (which are [3] series of low-frequency (≤1 Hz) variations in the electric—and magnetic [17]—field of the Earth that precede EQs, see, e.g., [3,18,19,20,21]) varies from a few weeks to months (see Chapter 7 of [3]).
Within each window of W EQs, we consider sub-excerpts of successive N = 6 EQs (since at least six EQs are needed [22] for obtaining reliable ) of energy and NT each. Assuming and sliding within the window of W EQs, , we calculate using Equation (1) for each j. Then, we repeat the calculation for , hence acquiring values. Using this statistical ensemble, we can estimate the average and the standard deviation of values just before the target EQ. We define (see, e.g., [3,4]) the variability that quantifies the fluctuations of within this window of W EQs as follows:
This value of is designated to the -th event in the EQ time series, which is the target EQ.
The change through time of can be obtained by sliding event by event the window of W EQs through the EQ catalog. In order to indicate the length W of the window used in the calculation of , the notation () is utilized.
The seismicity of Japan was analyzed [22] in NT from 1 January 1984 until the time of M9 Tohoku EQ on 11 March 2011. The length W used in our analysis corresponds to the number of EQs that would happen in the region in a time period of a few months. The following results were obtained: The deepest minimum during the whole studied period was observed almost 2 months before the M9 Tohoku EQ. Distinct minima of of smaller depth, were also found one month to three months before the occurrence of all other Japanese major EQs ( 7.6, depth < 400 km) during 1984–2011. Specifically, by employing the seismic catalog of the Japan Meteorological Agency (JMA) and analyzing in NT all EQs within with , one has 47,204 EQs since 1984 until the occurrence of the 2011 M9 Tohoku EQ. This leads to an average rate of EQs per month. Sarlis et al. [22] studied the fluctuations of the order parameter of seismicity using and and in order to identify the aforementioned precursory minima considered the concurring local minima of and that satisfy the condition with a ratio within the limits . This analysis led to that are precursory to all shallow EQs with 7.6 as well as to minima that preceded strong EQs of smaller magnitude, see Tables 1 and 2 of [22].
The resulting EQ prediction method was found to be statistically significant, see, e.g., [23] and the references therein, even when considering [24] the recent method of event coincidence analysis [25,26,27]. Furthermore, very recently a procedure was suggested based on natural time through which one can identify when the accumulation of stresses before major EQs (of magnitude M8.2 or larger) occurs [9] as well as how an additional procedure can improve the estimation of the occurrence time of an impending EQ by using the entropy change of seismicity in natural under time reversal [8].
4. Results
Here, we focus our attention to the Taiwan region shown in Figure 1. We employ the United States National Earthquake Information Center (NEIC) PDE EQ catalog which is openly available by the United States Geological Survey (USGS), apply a magnitude cut-off and analyze in NT all EQs with inside the aforementioned region since 1981. This way, starting from 1981 were left with 2712 EQs until the M7.4 Hualien EQ that took place at 23:58 UTC on 2 April 2024. Following [22], we first consider the monthly rate of EQ occurrence which is EQs/month. Thus, in accordance with the aforementioned study in Japan, we focus our attention to and . Figure 2 shows the results for and obtained when analysing seismicity for the concerned period (1 January 1981 to the time of occurrrence of the Hualien EQ) of approximately 43 years (cf. to obtain the first values of we need at least W EQs and this is the reason why start later than 1 January 1981 in Figure 2). Upon making the selection (see also the lower panel of Figure 2)
and
we are left with precursory minima on 20 August 1999 for the Chi-Chi earthquake that occurred one month later and on 5 September 2023 for the Hualien earthquake that occurred almost seven months later shown in Figure 3A and Figure 3B, respectively. Here, we note that these two events are the strongest in Taiwan during the last 60 years according to the International Seismological Center [28,29] (their ISC event numbers are 1,718,616 and 637,103,828, respectively). We recall that from the totality of the concurring local minima observed for and only the ones that satisfy the inequality shown in Equation (7) having an within the range defined by the relation of Equation (8) are considered here. For example, as can be seen in the lower panel of Figure 2 while falls below the value 0.137 (shown by the thick red horizontal line) often only in five cases the concurrent is such that satisfies the relation of Equation (8). In such cases, both and are marked with red and blue circles, respectively, in Figure 2.
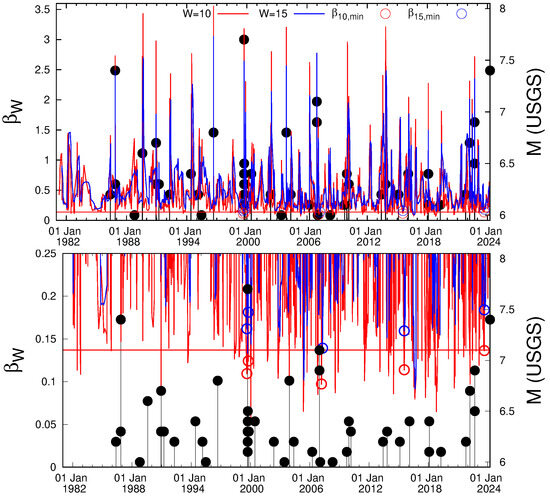
Figure 2.
The variabilites for (red) and (blue) versus the conventional time (UTC) for the seismicity within since 1981 to the time of occurrence of the Hualien EQ. The black impulses ending at solid circles indicate EQ occurences. The magnitude of each EQ can be read in the right scale. The horizontal line corresponds to 0.137 while the red and blue circles mark the minima identified by the conditions shown in Equations (7) and (8). The validity of these two conditions can be verified in the lower panel, which is a zoomed-in area of the upper panel in expanded vertical scale.
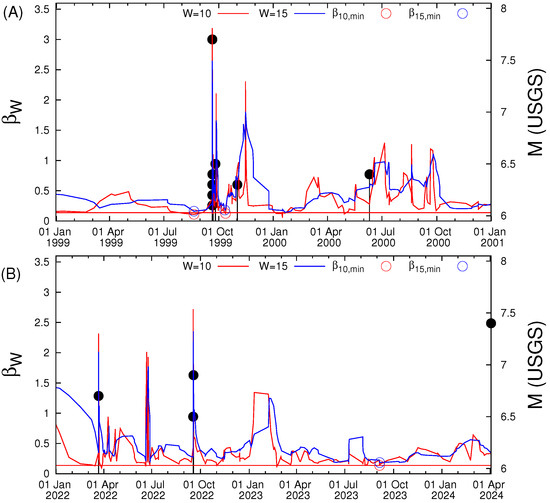
Figure 3.
Excerpts of Figure 2 before (A) the Chi-Chi and (B) the Hualien EQs.
As a result, apart from the aforementioned two precursory minima we also obtain three other minima marked with circles in Figure 2. The first of these minima occurs during the period 11 to 13 October 1999 and is shown in Figure 3A; it precedes an M6.3 earthquake that occurred at 17:53 UTC on 1 November 1999 at N E . The other two minima are shown in Figure 4: the one taking place on 10 March 2007 with a value (see the lower panel of Figure 4) which is smaller than observed before the Chi-Chi EQ (see the lower panel of Figure 2) and hence in principle can be excluded from further analysis, and the other on 28 July 2015 preceded the 5 February 2016 M6.4 EQ at NE.
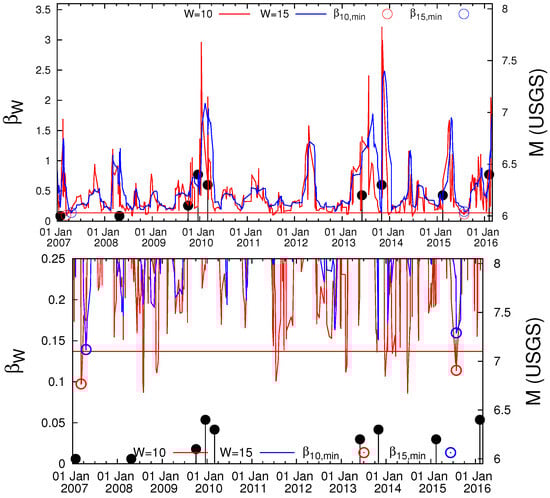
Figure 4.
Excerpt of Figure 2 during the period 1 January 2007 to 1 March 2016. In the lower panel, we show a zoom of the upper panel in expanded vertical scale.
In order to investigate the statistical significance of the aforementioned results concerning both Chi-Chi and Hualien EQs we work as follows: assuming that both Chi-Chi and Hualien EQs occurred after 7 months at the most after the observation of , we can separate the almost 43-year period of our study (actually 519 months) in 74 seven-month periods. Considering that the minimum on October 1999 covers the same seven-month period with the precursory one on 20 August 1999 and that the minimum in 2007 can be discarded as mentioned in the previous paragraph, we are left with the three active seven-month periods of alarm corresponding to a total duration of 4% of the study period. Figure 5 shows the corresponding receiver operating characteristics (ROC) diagram [30] by means of which we can conclude that the probability p to observe such a result by chance is less than 0.8%.
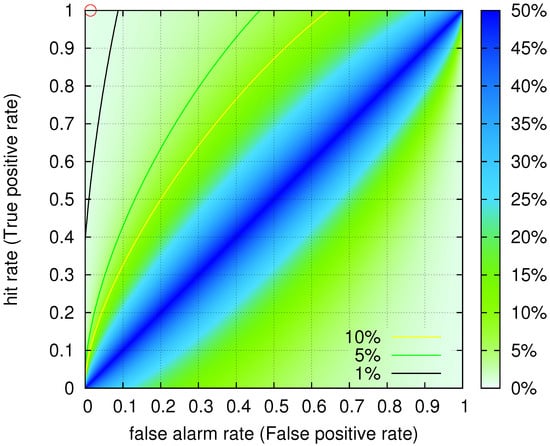
Figure 5.
ROC diagram corresponding to the EQ prediction method discussed in the text. The target is to predict Chi-Chi and Hualien EQs using the conditions shown in Equations (7) and (8) when considering seven-month periods. The colour contours indicate the probability p to obtain by chance a point in the ROC plane when 2(=P) events out of 74(=) are to be predicted (for details on the meaning of the hit rate, the false alarm rate, and the method used to estimate the p-values see [31]). The operation point of the present EQ prediction method is indicated by the open circle and has a p-value 0.75%.
5. Discussion
As shown in detail in Chapter 5 of [4], the determination of a precursory variability minimum allows an estimation of the occurrence time of an impending strong EQ. In particular, Varotsos et al. [32] have shown that when a precursory is observed, it is accompanied by a simultaneous SES activity. SES activity indicates that the region around the future hypocenter has reached criticality, thus we can employ NT analysis of the seismicity (i.e., of the EQs with ) inside the region candidate to suffer the strong EQ and obtain an estimation of its occurrence time (for a large variety examples see [3,4]). This is possible by comparing the normalized power spectrum of the ongoing seismicity to the critical one given by [2,3,4]
A coincidence between and that indicates the proximity to the impending strong EQ occurrence is characterized by the following criteria (see [3] and Section 5.3 of [4]):
(1) The “average” distance between the curves of and of Equation (9) for should be .
(2) The final approach of the evolving of seismicity to the value should be such that gradually decreases with time and finally reaches (from above) that of the critical state, i.e., (the latter value can be obtained [2,3] by a Taylor expansion of Equation (9) around ).
(3) At the coincidence, i.e., when , both entropies S and of the seismicity in natural time must be smaller than .
(4) Since this process (critical dynamics) is considered to be self-similar, the occurrence time of the coincidence should not markedly vary upon changing the magnitude threshold used in the calculation of seismicity.
(5) The final approach of (see criterion 2) starts on a date at which the entropy change of the seismicity exhibits a local minimum.
For example, in the case of the M9.0 Tohoku EQ in Japan that occurred at 14:46 LT on 11 March 2011, the variability minimum was observed [22] on 5 January 2011 coinciding with the observation of anomalous variations of the magnetic field of the Earth [33,34] and the analysis of the subsequent seismicity in the area around the Tohoku epicenter (see, e.g., [4,35]) showed that in the morning (≈09:00 LT) of 10 March 2011 the above criteria for coincidence have been reached (Varotsos et al. [8] showed that this estimation can be improved to 20:00LT on 10 March 2011).
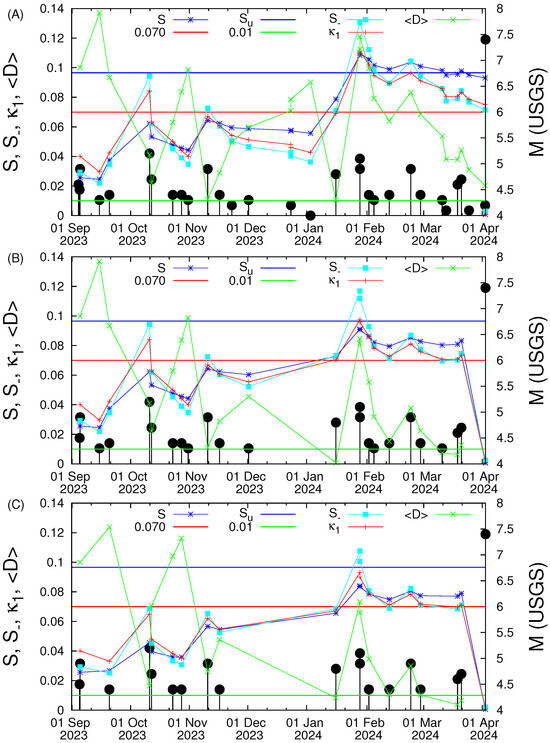
Here, we consider our study area shown in Figure 1 and calculate the evolution of , S, and for the seismicity that occurred after the observed on 5 September 2023. Figure 6 depicts the aforementioned quantities versus the conventional time for various values of . We observe that for , Figure 6A, the average distance never satisfies the first criterion for coincidence since it approaches a minimum value of ≈0.02 upon the occurrence of an M4.2 EQ almost 4 hours before the Hualien EQ. Interestingly, both S and are smaller than and criterion 5 is satisfied. Increasing the magnitude threshold to and 4.4, see Figure 6B,C, respectively, we observe that all five criteria for coincidence are statisfied on 19 March 2024, i.e., less than two weeks before the M7.4 Hualien EQ.
Returning now to the case of the M7.6 1999 Chi-Chi EQ, we have a variability minimum on 20 August 1999 almost one month before this EQ as already mentioned. The number of EQs inside our study area after 20 August 1999 is very small to allow a study similar to that presented in the previous paragraph for the case of Hualien EQ. We only note that upon the occurrence of a M4.1 EQ on 4 September 1999 we obtain and both S and are smaller than .
It is noteworthy that NT is the basis for EQ nowcasting which is the most recent method for seismic risk estimation [36,37,38,39,40,41,42,43,44,45,46,47,48,49,50,51]. EQ nowcasting has been introduced by Rundle et al. [52] based on the concept of NT and may additionally provide useful information about the epicenters of future EQs [53,54,55]. This is achieved when EQ nowcasting is combined with the identification of variability minima of the order parameter of seismicity. Such applications have been made both in regional (Eastern Mediterranean [53] and Southern California, Mexico and Central America [54]) and global scale [55]. It is in our future plans to employ EQ nowcasting in a similar fashion for the study of the whole area of Eastern Asia.
6. Conclusions
Natural time analysis enables the introduction of an order parameter of seismicity, the fluctuation of which exhibits a statistically significant minimum before a major EQ.
Natural time analysis is shown to identify well in advance the two strongest earthquakes that occurred in Taiwan during the last 60 years (i.e., the 1999 MW7.6 Chi-Chi and the 3 April 2024 MW7.4 Hualien EQ).
Author Contributions
Conceptualization, P.A.V., N.V.S., E.S.S., T.N., and Q.H.; methodology, P.A.V., N.V.S., E.S.S., Q.H., J.-Y.L., M.K., and T.N.; software, N.V.S. and E.S.S.; validation, J.-Y.L., M.K., and T.N.; formal analysis, P.A.V., N.V.S., and E.S.S.; investigation, P.A.V., N.V.S., E.S.S., Q.H., J.-Y.L., M.K. and T.N.; resources, N.V.S., E.S.S., and J.-Y.L.; data curation, N.V.S. and E.S.S.; writing—original draft preparation, P.A.V., N.V.S., E.S.S., and J.-Y.L.; writing—review and editing, P.A.V., N.V.S., E.S.S., Q.H., J.-Y.L., M.K., and T.N.; visualization, N.V.S., E.S.S., and J.-Y.L.; supervision, P.A.V.; project administration, P.A.V. All authors have read and agreed to the published version of the manuscript.
Funding
This research received no external funding.
Data Availability Statement
The EQ data used in this paper are openly available by USGS at https://earthquake.usgs.gov/earthquakes/search/ (accessed on 29 November 2024).
Conflicts of Interest
The authors declare no conflicts of interest.
References
- Holliday, J.R.; Rundle, J.B.; Turcotte, D.L.; Klein, W.; Tiampo, K.F.; Donnellan, A. Space-Time Clustering and Correlations of Major Earthquakes. Phys. Rev. Lett. 2006, 97, 238501. [Google Scholar] [CrossRef] [PubMed]
- Varotsos, P.A.; Sarlis, N.V.; Skordas, E.S. Spatio-Temporal complexity aspects on the interrelation between Seismic Electric Signals and Seismicity. Pract. Athens Acad. 2001, 76, 294–321. [Google Scholar]
- Varotsos, P.A.; Sarlis, N.V.; Skordas, E.S. Natural Time Analysis: The New View of Time. Precursory Seismic Electric Signals, Earthquakes and other Complex Time-Series; Springer: Berlin/Heidelberg, Germany, 2011. [Google Scholar] [CrossRef]
- Varotsos, P.A.; Sarlis, N.V.; Skordas, E.S. Natural Time Analysis: The New View of Time, Part II. Advances in Disaster Prediction using Complex Systems; Springer Nature AG: Cham, Switzerland, 2023. [Google Scholar] [CrossRef]
- Feller, W. An Introduction to Probability Theory and Its Applications, Volume 2; Wiley: New York, NY, USA, 1971. [Google Scholar]
- Lesche, B. Instabilities of Renyi entropies. J. Stat. Phys. 1982, 27, 419. [Google Scholar] [CrossRef]
- Lesche, B. Renyi entropies and observables. Phys. Rev. E 2004, 70, 017102. [Google Scholar] [CrossRef]
- Varotsos, P.; Sarlis, N.; Skordas, E.; Nagao, T.; Kamogawa, M. Natural time analysis together with non-extensive statistical mechanics shorten the time window of the impending 2011 Tohoku M9 earthquake in Japan. Commun. Nonlinear Sci. Numer. Simul. 2023, 125, 107370. [Google Scholar] [CrossRef]
- Varotsos, P.; Sarlis, N.; Nagao, T. Complexity measure in natural time analysis identifying the accumulation of stresses before major earthquakes. Sci. Rep. 2024, 14, 30828. [Google Scholar] [CrossRef]
- Shannon, C.E. A Mathematical Theory of Communication. Bell Syst. Tech. J. 1948, 27, 379–423. [Google Scholar] [CrossRef]
- Tsallis, C.; Mendes, R.S.; Plastino, A.R. The role of constraints within generalized nonextensive statistics. Phys. A Stat. Mech. Appl. 1998, 261, 534–554. [Google Scholar] [CrossRef]
- Abe, S. Stability of Tsallis entropy and instabilities of Rényi and normalized Tsallis entropies: A basis for q-exponential distributions. Phys. Rev. E 2002, 66, 046134. [Google Scholar] [CrossRef]
- Silva, R.; França, G.S.; Vilar, C.S.; Alcaniz, J.S. Nonextensive models for earthquakes. Phys. Rev. E 2006, 73, 026102. [Google Scholar] [CrossRef]
- Tsallis, C. Introduction to Nonextensive Statistical Mechanics; Springer: Berlin/Heidelberg, Germany, 2009. [Google Scholar] [CrossRef]
- Livadiotis, G.; McComas, D.J. Beyond kappa distributions: Exploiting Tsallis statistical mechanics in space plasmas. J. Geophys. Res. Space Phys. 2009, 114, A11105. [Google Scholar] [CrossRef]
- Tsallis, C. Possible generalization of Boltzmann-Gibbs statistics. J. Stat. Phys. 1988, 52, 479–487. [Google Scholar] [CrossRef]
- Sarlis, N.; Varotsos, P. Magnetic field near the outcrop of an almost horizontal conductive sheet. J. Geodyn. 2002, 33, 463–476. [Google Scholar] [CrossRef]
- Zlotnicki, J.; Kossobokov, V.; Le Mouël, J.L. Frequency spectral properties of an ULF electromagnetic signal around the 21 July 1995, M=5.7, Yong Deng (China) earthquake. Tectonophysics 2001, 334, 259–270. [Google Scholar] [CrossRef]
- Ramírez-Rojas, A.; Flores-Márquez, E.L.; Guzmán-Vargas, L.; Gálvez-Coyt, G.; Telesca, L.; Angulo-Brown, F. Statistical features of seismoelectric signals prior to M7.4 Guerrero-Oaxaca earthquake (México). Nat. Hazards Earth Syst. Sci. 2008, 8, 1001–1007. [Google Scholar] [CrossRef]
- Ramírez-Rojas, A.; Telesca, L.; Angulo-Brown, F. Entropy of geoelectrical time series in the natural time domain. Nat. Hazards Earth Syst. Sci. 2011, 11, 219–225. [Google Scholar] [CrossRef]
- Orihara, Y.; Kamogawa, M.; Nagao, T.; Uyeda, S. Preseismic anomalous telluric current signals observed in Kozu-shima Island, Japan. Proc. Natl. Acad. Sci. USA 2012, 109, 19125–19128. [Google Scholar] [CrossRef]
- Sarlis, N.V.; Skordas, E.S.; Varotsos, P.A.; Nagao, T.; Kamogawa, M.; Tanaka, H.; Uyeda, S. Minimum of the order parameter fluctuations of seismicity before major earthquakes in Japan. Proc. Natl. Acad. Sci. USA 2013, 110, 13734–13738. [Google Scholar] [CrossRef]
- Sarlis, N.V.; Skordas, E.S.; Christopoulos, S.R.G.; Varotsos, P.A. Natural Time Analysis: The Area under the Receiver Operating Characteristic Curve of the Order Parameter Fluctuations Minima Preceding Major Earthquakes. Entropy 2020, 22, 583. [Google Scholar] [CrossRef]
- Christopoulos, S.R.G.; Skordas, E.S.; Sarlis, N.V. On the Statistical Significance of the Variability Minima of the Order Parameter of Seismicity by Means of Event Coincidence Analysis. Appl. Sci. 2020, 10, 662. [Google Scholar] [CrossRef]
- Donges, J.; Schleussner, C.F.; Siegmund, J.; Donner, R. Event coincidence analysis for quantifying statistical interrelationships between event time series. Eur. Phys. J. Spec. Top. 2016, 225, 471–487. [Google Scholar] [CrossRef]
- Schleussner, C.F.; Donges, J.F.; Donner, R.V.; Schellnhuber, H.J. Armed-conflict risks enhanced by climate-related disasters in ethnically fractionalized countries. Proc. Natl. Acad. Sci. USA 2016, 113, 9216–9221. [Google Scholar] [CrossRef]
- Siegmund, J.F.; Siegmund, N.; Donner, R.V. CoinCalc—A new R package for quantifying simultaneities of event series. Comput. Geosci. 2017, 98, 64–72. [Google Scholar] [CrossRef]
- Di Giacomo, D.; Storchak, D.A.; Safronova, N.; Ozgo, P.; Harris, J.; Verney, R.; Bondár, I. A New ISC Service: The Bibliography of Seismic Events. Seismol. Res. Lett. 2014, 85, 354–360. [Google Scholar] [CrossRef]
- International Seismological Centre. On-Line Event Bibliography. Available online: https://www.isc.ac.uk/event_bibliography/bibsearch.php (accessed on 8 December 2024).
- Fawcett, T. An introduction to ROC analysis. Pattern Recogn. Lett. 2006, 27, 861–874. [Google Scholar] [CrossRef]
- Sarlis, N.V.; Christopoulos, S.R.G. Visualization of the significance of Receiver Operating Characteristics based on confidence ellipses. Comput. Phys. Commun. 2014, 185, 1172–1176. [Google Scholar] [CrossRef]
- Varotsos, P.A.; Sarlis, N.V.; Skordas, E.S.; Lazaridou, M.S. Seismic Electric Signals: An additional fact showing their physical interconnection with seismicity. Tectonophysics 2013, 589, 116–125. [Google Scholar] [CrossRef]
- Han, P.; Hattori, K.; Xu, G.; Ashida, R.; Chen, C.H.; Febriani, F.; Yamaguchi, H. Further investigations of geomagnetic diurnal variations associated with the 2011 off the Pacific coast of Tohoku earthquake (Mw 9.0). J. Asian Earth Sci. 2015, 114, 321–326. [Google Scholar] [CrossRef]
- Han, P.; Hattori, K.; Huang, Q.; Hirooka, S.; Yoshino, C. Spatiotemporal characteristics of the geomagnetic diurnal variation anomalies prior to the 2011 Tohoku earthquake (Mw 9.0) and the possible coupling of multiple pre-earthquake phenomena. J. Asian Earth Sci. 2016, 129, 13–21. [Google Scholar] [CrossRef]
- Varotsos, P.A.; Sarlis, N.V.; Skordas, E.S. Identifying the occurrence time of an impending major earthquake: A review. Earthq. Sci. 2017, 30, 209–218. [Google Scholar] [CrossRef]
- Rundle, J.B.; Luginbuhl, M.; Giguere, A.; Turcotte, D.L. Natural Time, Nowcasting and the Physics of Earthquakes: Estimation of Seismic Risk to Global Megacities. Pure Appl. Geophys. 2018, 175, 647–660. [Google Scholar] [CrossRef]
- Luginbuhl, M.; Rundle, J.B.; Hawkins, A.; Turcotte, D.L. Nowcasting Earthquakes: A Comparison of Induced Earthquakes in Oklahoma and at the Geysers, California. Pure Appl. Geophys. 2018, 175, 49–65. [Google Scholar] [CrossRef]
- Luginbuhl, M.; Rundle, J.B.; Turcotte, D.L. Natural Time and Nowcasting Earthquakes: Are Large Global Earthquakes Temporally Clustered? Pure Appl. Geophys. 2018, 175, 661–670. [Google Scholar] [CrossRef]
- Luginbuhl, M.; Rundle, J.B.; Turcotte, D.L. Statistical physics models for aftershocks and induced seismicity. Phil. Trans. R. Soc. A 2018, 377, 20170397. [Google Scholar] [CrossRef]
- Pasari, S. Nowcasting Earthquakes in the Bay of Bengal Region. Pure Appl. Geophys. 2019, 176, 1417–1432. [Google Scholar] [CrossRef]
- Pasari, S.; Sharma, Y. Contemporary Earthquake Hazards in the West-Northwest Himalaya: A Statistical Perspective through Natural Times. Seismol. Res. Lett. 2020, 91, 3358–3369. [Google Scholar] [CrossRef]
- Rundle, J.B.; Donnellan, A. Nowcasting Earthquakes in Southern California With Machine Learning: Bursts, Swarms, and Aftershocks May Be Related to Levels of Regional Tectonic Stress. Earth Space Sci. 2020, 7, e2020EA001097. [Google Scholar] [CrossRef]
- Rundle, J.B.; Donnellan, A.; Fox, G.; Crutchfield, J.P.; Granat, R. Nowcasting Earthquakes:Imaging the Earthquake Cycle in California with Machine Learning. Earth Space Sci. 2021, 8, e2021EA001757. [Google Scholar] [CrossRef]
- Pasari, S.; Simanjuntak, A.V.H.; Mehta, A.; Neha; Sharma, Y. Nowcasting earthquakes in Sulawesi Island, Indonesia. Geosci. Lett. 2021, 8, 27. [Google Scholar] [CrossRef]
- Pasari, S.; Simanjuntak, A.V.H.; Mehta, A.; Neha; Sharma, Y. A synoptic view of the natural time distribution and contemporary earthquake hazards in Sumatra, Indonesia. Nat. Hazards 2021, 108, 309–321. [Google Scholar] [CrossRef]
- Pasari, S.; Simanjuntak, A.V.H.; Mehta, A.; Neha; Sharma, Y. The Current State of Earthquake Potential on Java Island, Indonesia. Pure Appl. Geophys. 2021, 178, 2789–2806. [Google Scholar] [CrossRef]
- Pasari, S.; Verma, H.; Sharma, Y.; Choudhary, N. Spatial distribution of seismic cycle progression in northeast India and Bangladesh regions inferred from natural time analysis. Acta Geophys. 2023, 71, 89–100. [Google Scholar] [CrossRef]
- Pasari, S. Nowcasting earthquakes in Iran: A quantitative analysis of earthquake hazards through natural times. J. Afr. Earth Sci. 2023, 198, 104821. [Google Scholar] [CrossRef]
- Rundle, J.; Donnellan, A.; Fox, G.; Ludwig, L.; Crutchfield, J. Does the Catalog of California Earthquakes, with Aftershocks Included, Contain Information about Future Large Earthquakes? Earth Space Sci. 2023, 10, e2022EA002521. [Google Scholar] [CrossRef]
- Rundle, J.B.; Baughman, I.; Zhang, T. Nowcasting Earthquakes With Stochastic Simulations: Information Entropy of Earthquake Catalogs. Earth Space Sci. 2024, 11, e2023EA003367. [Google Scholar] [CrossRef]
- Devi, S.; Pasari, S. Nowcasting earthquakes in the Philippines archipelago. J. Seismol. 2025, 29, 505–524. [Google Scholar] [CrossRef]
- Rundle, J.B.; Turcotte, D.L.; Donnellan, A.; Grant Ludwig, L.; Luginbuhl, M.; Gong, G. Nowcasting earthquakes. Earth Space Sci. 2016, 3, 480–486. [Google Scholar] [CrossRef]
- Varotsos, P.K.; Perez-Oregon, J.; Skordas, E.S.; Sarlis, N.V. Estimating the epicenter of an impending strong earthquake by combining the seismicity order parameter variability analysis with earthquake networks and nowcasting: Application in Eastern Mediterranean. Appl. Sci. 2021, 11, 10093. [Google Scholar] [CrossRef]
- Perez-Oregon, J.; Varotsos, P.K.; Skordas, E.S.; Sarlis, N.V. Estimating the Epicenter of a Future Strong Earthquake in Southern California, Mexico, and Central America by Means of Natural Time Analysis and Earthquake Nowcasting. Entropy 2021, 23, 1658. [Google Scholar] [CrossRef]
- Christopoulos, S.R.G.; Varotsos, P.K.; Perez-Oregon, J.; Papadopoulou, K.A.; Skordas, E.S.; Sarlis, N.V. Natural Time Analysis of Global Seismicity. Appl. Sci. 2022, 12, 7496. [Google Scholar] [CrossRef]
Disclaimer/Publisher’s Note: The statements, opinions and data contained in all publications are solely those of the individual author(s) and contributor(s) and not of MDPI and/or the editor(s). MDPI and/or the editor(s) disclaim responsibility for any injury to people or property resulting from any ideas, methods, instructions or products referred to in the content. |
© 2025 by the authors. Licensee MDPI, Basel, Switzerland. This article is an open access article distributed under the terms and conditions of the Creative Commons Attribution (CC BY) license (https://creativecommons.org/licenses/by/4.0/).