Abstract
The integration of new technologies across scientific disciplines, including rock slope engineering, is increasingly essential. The use of drones and advanced software tools for mapping and analyzing large rocky slopes in detail has become indispensable and highly beneficial. In this context, this paper examines the process and key parameters involved in generating a high-resolution 3D terrain model and evaluating rock-mass stability using advanced software tools (UgCS version 5.5.0, ArcGIS version 3.4.3, Drone2Map version 2024.2.1, DSE version 3.02, and Rocfall3D version 1.014). These technologies facilitate the identification of hazard zones on rocky slopes in monuments of archaeological interest. The evaluation of this modeling approach is conducted at the monolithic rock of Ancient Corinth (Acrocorinth), one of Greece’s most significant archaeological sites. This study focuses on assessing its vulnerability to rockfalls and identifying hazard zones. This methodology involves the development of a 3D rockfall analysis system and the implementation of a specialized hazard matrix for the quantitative assessment of rockfall risk. This approach enables the development of a decisive model for mitigating rockfall hazards, ensuring the safety of visitors in high-traffic areas such as major archaeological sites.
1. Introduction
Rockfall phenomena represent one of the most critical geohazards [1,2,3] in areas with steep topography and discontinuous rock masses, with increasing interest in regions where urban and cultural heritage sites are located [4,5]. Various researchers have highlighted the importance of combining traditional geological surveys with advanced remote sensing techniques, such as UAV-based photogrammetry and LiDAR [6,7], to effectively detect and evaluate rockfall hazards [8,9,10]. Also, with the same technology, methodologies have been developed for landslide monitoring that concern either the monitoring of existing phenomena or the assessment of older phenomena [11,12]. In other cases, many landslide models also incorporate kinematic analysis [13,14] or seismic data for more realistic results [15].
In the last decade, several studies have increasingly adopted structure-from-motion (SfM) techniques and 3D point cloud analysis to assess discontinuities and simulate possible rockfall trajectories [16,17]. Technological advances are complementing existing classical methods that have developed inference methodologies for rockfall mitigation and other phenomena, but they lack primary data from large areas and data accuracy. These methods provide accurate data for numerical simulations, contributing to better risk mitigation strategies in vulnerable archaeological areas [5,18,19]. Considering these developments, the present study applies a fully digital methodology to analyze the stability of rocky slopes and identify hazard zones in the surrounding area of the archaeological site of Ancient Corinth (Acrocorinth) in Greece.
Acrocorinth is a 575 m-high limestone cliff that dominates the plain of the modern and ancient city of Korinthos (Corinth) in Greece. At the top of the cliff stands the largest castle of the Peloponnese peninsula and one of the oldest fortifications, continuously occupied from the Archaic period to the early nineteenth century. Today, the fortified cliff is one of the most important archaeological sites in Greece, with many visitors, and it is very important to analyze its vulnerability to rockfalls. The Acrocorinth cliff rises to the south of ancient Corinth, one of the most important cities in antiquity. Due to its strategic location, supervising the communication routes towards the Peloponnese peninsula, its natural defense, as well as its sufficiency of water sources, Acrocorinth served as the acropolis of Corinth and the refuge of the Corinthians in periods of enemy incursions.
Imposing walls, 3000 m long, reinforced with a moat and three monumental lines of defense at its vulnerable western part, form an impregnable castle that has never been conquered. The oldest building phase dates to the Archaic period, during the reign of the tyrant Kypselos and his successors (657–583 BC), but large-scale programs of wall expansions were undertaken by the Byzantines (4th c. AD-1458) and, later, by the Ottomans (1458–1687, 1715–1823) and the Venetians (1687–1715), who ruled the area for almost four centuries.
The walls enclose an area of approximately 240,000 sq. m. A sanctuary dedicated to Aphrodite, the goddess of beauty, with an early Christian Basilica on its ruins, three Christian churches and a Muslim Mosque, the so-called ‘Frankish’ tower, the ancient fountain of Ano Peirene, and a large Byzantine cistern stand out among the various buildings of the timeless settlement formed on the cliff. After 1823, Acrocorinth was gradually abandoned by its inhabitants and became a hospitable area for valuable and threatened species and habitats, protected by the Natura 2000 Network (code GR 2530003).
Nowadays, Acrocorinth and its castle form part of the homonymous extended archaeological site under the protection of the Hellenic Ministry of Culture and the Regional Ephorate of Antiquities of Corinthia. Long-lasting excavations and preservation projects, financed by the Hellenic Republic and the European Union, aim at restoring the monuments and enhancing the castle, offering thousands of visitors both a unique archaeological tour following walking trails with directional signs and information panels, and an amazing view of the northern Peloponnese and the southern Central Greece, including the Corinthian and Saronic Gulfs. A time-consuming and expensive project runs in parallel in response to point rockfalls, collapses, and deformations of the ancient walls, ensuring the safety of visitors to the emblematic Acrocorinth [20,21,22,23].
The current research analyzes the potentiality of rockfalls at the entrance of the archaeological site, the footbridge, and the visitor access road, and examines the wider area, which is an active geomorphological field where rockfalls have been occurring for centuries. The phenomenon of rocks and boulders falling from the steep slopes of Acrocorinth is considered diachronic, with evidence of rockfalls dating back to ancient times. In the present research, due to the steep morphology and the difficulty of recording all discontinuities that prevail along the site’s slopes, a drone with rtk (real-time kinematic positioning) and a high-definition camera was used to survey the high and steep slopes. The purpose of this was to create a high-resolution 3D terrain model that can clarify in detail the geometric features of the discontinuities of the rock mass as they have been described by other researchers [1,24], as well as detect rockfall seeders and characterize them based on other published works [6,19]. Similar works, though not on archaeological sites, have been carried out by other researchers [25,26].
For the study area, preliminary work has been conducted [27], which focused on a smaller area of the archaeological site and on the drone flight methodology in order to find the optimal way for creating an easy-to-use 3D terrain model with photogrammetry.
This paper presents an integrated methodology that uses high-resolution photogrammetry, 3D ground models of steep rocky slopes, and 3D modelling and kinematic analysis software to identify hazard zones in areas of great archaeological importance and produce hazard maps for visitor safety.
2. Materials and Methods
2.1. Geology of the Study Area
Acrocorinth is a prominent tectonic structure representing a typical horst and is located west-southwest of the canal of Corinth, 5.6 km south of the modern city of Korinthos (Figure 1).
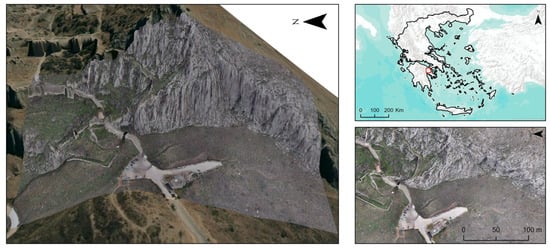
Figure 1.
The Acrocorinth tectonic structure in a 3D view plan as exposed WSW of the canal of Corinth. The red square shows the location of the study area.
Generally, east-dipping low-angle thrust faults affect the predominant alpine Middle Jurassic limestones of the structure, which are intercepted by shales and cherts [28]. Due to the latest extensional phase, high-angle normal faults were formed, affecting the pre-existing alpine limestones. As a result, a series of neotectonic structures, such as horsts and grabens, has formed. A typical example of the above-mentioned structures is the Acrocorinth horst. This structure is bounded by two west–east trending normal faults downthrown to the north and to the south, respectively. A north–south trending thrust fault bounds the Acrocorinth to the west. Shales and Jurassic limestones occupied the footwall and the hanging wall of this thrust, respectively, whereas thick upper Pliocene–Pleistocene to Quaternary clastic sediments uncomfortably cover the alpine formations in the adjacent areas.
The geological formations identified in the research area (from the oldest to youngest) are presented in more detail in Figure 2.
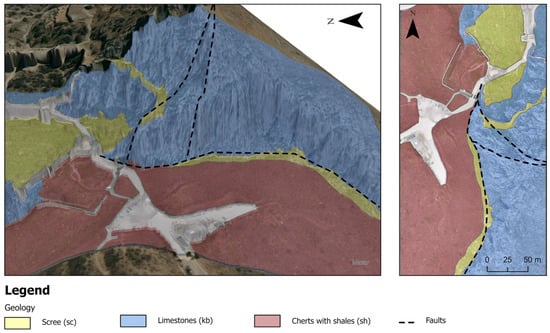
Figure 2.
Geological map of the study area. Scree (sc): Loose-structured materials with a clayey to clayey-sandy composition and scattered shales. They originate from the erosion of the rocky background. Limestones (kb): Sublithographic, thick-plated to thin-bedded, in places dolomitized light-grey limestones with nodules or bands of cherts. Cherts with shales (sh): A system of thin-bedded cherts and shales with dark brownish-red color, which is bibliographically reported to develop within the main mass of Jurassic limestones. On the surface, they present a weathering mantle usually of small thickness.
2.2. Methodology
Different oriented hazard maps with the use of GIS have been presented by several researchers, with some of them supporting targeted risk assessment and protective infrastructure planning [29,30,31]. The methodology used for hazard mapping in this research follows the same basic principle, but with the addition of high-resolution terrain models from which all the necessary information for further analysis is extracted. This includes the introduction of the terrain model into (a) a Discontinuity Set Extractor (DSE) program, (b) an interactive analysis of orientation based geological data program, and (c) a rockfall 3D program and the extraction of the necessary information and importation with other geological data into the ArcGIS framework to produce hazard maps for the protection and safety of humans.
For this purpose, a planned drone flight was carried out through UgCS (Universal Ground Control Software) with flight data that gives a GSD (Ground Sampling Distance) value of <0.5 cm, allowing the detection of rock mass discontinuities in a similar way as other published works have proposed [32,33,34]. Generally, a GSD index value ≤ 1 cm/pixel allows the detection of the rock mass discontinuity properties, and is ideal for detailed geotechnical analyses [32,33]. In the current work, the generated model had a pixel size of 0.4 cm, so it could be used for detecting discontinuities and performing the later kinematic analyses.
Having the high-resolution 3D model, the data are imported into the DSE software version 3.02 [35] to extract the rock mass characteristics (slope inclination and dip/dip direction of discontinuities). DSE is a specialized software tool used for the semi-automatic extraction of rock discontinuities (defining dip and dip direction of discontinuity orientation and their frequency) from point clouds derived from UAV photogrammetry files. This is a method widely recognized in the literature for rock slope analysis [35].
Data extracted from DSE are compared with measurements derived in the field with conventional methods (geological compass) and assessed with the use of the Rocscience Dips program [36] to check if further improvements are necessary in the proposed digital methodology. In addition, the 3D terrain model is imported into the RocFall3 program [37] to determine the kinetic energy and other important parameters of potential rockfalls in the entire area. The initial velocity and the mass of rocks are used as inputs in the 3D model as proposed by other published works [26,38] for assessing rockfall kinetic energy, impact severity, and protective structure design [39]. Simultaneously, the slope mass rating (SMR) is calculated for all slope sectors to classify the rocky slopes according to their quality and stability [40,41] and identify the most unfavorable joints [42]. Therefore, a complete digitized method is created to assess all potential threats arising from the rock mass and its discontinuities, regardless of its accessibility.
It must be noted that the 3D terrain model is created with ESRI’s ArcGIS-Drone2Map software (2024.2.1 version), which is directly connected to ArcGIS Pro software (3.4.3 version), for further processing and filling in data without any additional conversions. ArcGIS with its extensions is a widely used Geographic Information System (GIS) that enables the management, analysis, visualization, and integration of geospatial data [2,3,29]. By importing the terrain information into the ArcGIS Pro software, along with other important rock mass parameters, such as SMR and rockfall kinetic energy, in the form of raster files and superposing them, a spatial hazard map is finally produced. The methodological process is presented below as a flow chart (Figure 3).
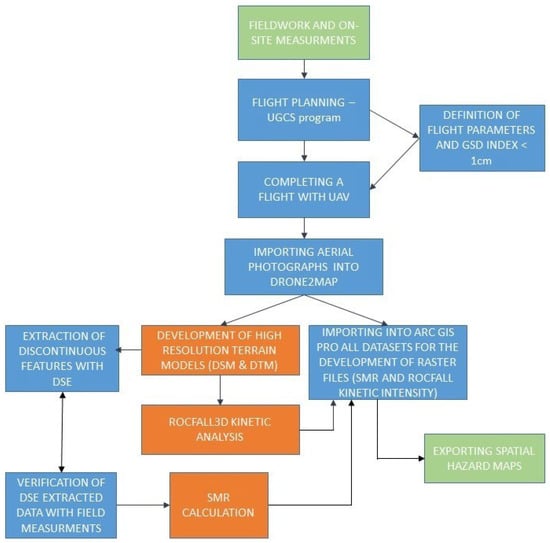
Figure 3.
Flowchart of the proposed methodology for the development of hazard maps in rocky slopes (key steps of methodology are highlighted in orange).
The key steps of the process are highlighted in orange in Figure 3 and include: (1) development of high-resolution terrain models, (2) analysis of the main principal discontinuity sets affecting slope stability, (3) detailed 3D kinetic analysis of rockfall, and (4) establishment of a hazard matrix with different hazard categories.
2.3. Drone Setting and Flight Planning
In order to achieve a correct and accurate 3D terrain model that represents the study area (Figure 4), some preparation in the field is required.
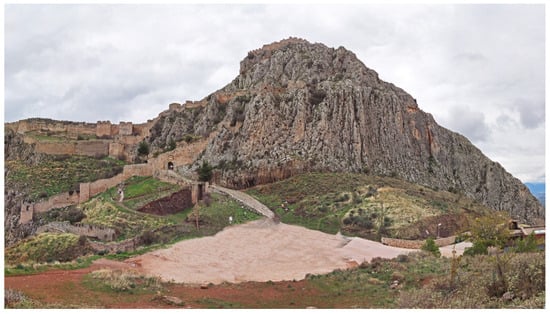
Figure 4.
Panoramic view of the Acrocorinth cliff in which the 3D terrain model was created.
Especially in this case, where the terrain model is exploited to develop conclusions and gather evidence about the discontinuities of the rock mass, it is very important to create a high-resolution terrain model with aerial photographs. To achieve this, the following considerations are used: (a) with the rtk unit present in the drone, the maximum possible assurance of the correct position of the aerial photographs for their subsequent connection is achieved; and (b) using the UgCS program, the flight is planned with the correct routes to ensure the necessary overlap between the photographs, a constant distance between the drone and the slope, accuracy in the shooting position, and a constant shooting angle.
All the above parameters contribute to the small value of the GSD index, which concerns the sharpness of the photos. When planning the flight through the UgCS program, a budget is made for the GSD index in order to achieve the necessary index. It is worth noting that in this case, due to the existing steep slopes, a vertical flight was performed. Overall, through programming with the UgCS software version 5.5.0, the flight time was minimized, and the minimum possible value of GSD for the accuracy of the 3D terrain model was achieved. By minimizing the GSD index, a more representative representation of the study ground and more accurate information about the discontinuity system are achieved.
The GSD index refers to the physical distance on the ground represented by each pixel of an image obtained through aerial or satellite systems. It is a critical indicator for image quality and analysis, as it affects the detail and accuracy of the image [43]. Analysis with a GSD of less than 1 cm enables the identification of all discontinuities ranging from very small to very large in length and with an aperture greater than 1 cm, which is ideal for producing an accurate and high-resolution terrain model. The model generated through this method is highly reliable for discontinuity extraction using the DSE software and for 3D rockfall simulation of any detached rock. The model used for these operations had a pixel size of 0.4 cm, which is a very good resolution for these applications.
Figure 5 shows the planned flight with the calculated data, flight time, number of photos, GSD, and area covered. It is worth noting that flight planning allowed the required memory occupied by aerial photographs to be minimized, which is particularly important for faster processing.
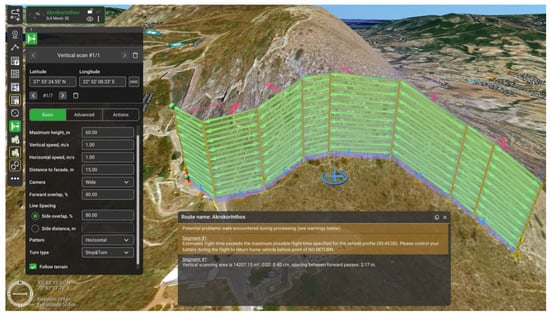
Figure 5.
Scheduled flight with calculated data, flight time, number of photos, GSD, and area covered.
2.4. Three-Dimensional Terrain Model
Agisoft Metashape and cloud compare programs are used for many corresponding tasks in similar works. However, in this research, ESRI’s Drone2Map software version 2024.2.1 was used for two main reasons. Initially, it is a similar program to Agisoft Metashape, but it communicates directly with ArcGIS Pro, where an advanced analysis can be carried out directly using additional data from other sources, such as cartographic, geological, and climatic data. Also, the type of file that is generated can be directly imported into other software programs related to discontinuity analysis, like DSE and Rocfall3, which are used for discontinuity extraction and rockfall simulations, respectively. This gives the ability to combine various data from different sources without converting files, thus avoiding falsifying the accuracy of the measurements.
Overall, the selection of Drone2Map is based on its direct interoperability with ArcGIS Pro, as well as its ability to import files in LAS/OBJ formats without the need for conversions, an advantage that preserves the georeferencing accuracy of the data. In contrast to Agisoft, which requires manual exports and conversions, Drone2Map maintains a unified data workflow and significantly reduces processing time. Additionally, Drone2Map organizes and categorizes the generated data in a format that is immediately readable and usable within ArcGIS Pro, unlike Agisoft. Furthermore, the ability to incorporate supplementary thematic data (geological layers, SMR sublayers, topographic data, and climatic layers) within ArcGIS Pro provides significant analytical flexibility that is not easily achievable with other software.
After completing the flight, all the aerial photos and flight data were imported into the Drone2Map software, and a 3D terrain model was created with a high resolution and clarity for further extraction of the discontinuity characteristics of the examined rock mass.
Figure 6 shows an enlarged section of the created 3D terrain model of Acrocorinth, and Table 1 presents the types of files created by the Drone2Map software. With the viewing tools provided by the program, we can focus as much as we need and easily observe the rock mass discontinuity details that have been captured based on the design mentioned above. Moreover, the program gives the option to create a DSM (Digital Surface Model) and a DTM (Digital Terrain Model), which are useful for subsequent analysis in the Rocfall3 program for the kinetic study of rock falls. The basic file types that are created and are easy to use are the las and obj formats.
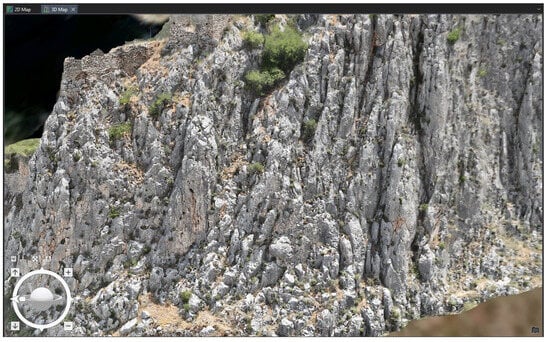
Figure 6.
Enlarged section of the created 3D terrain model of Acrocorinth.

Table 1.
Types of files created by the Drone2Map software when importing point cloud files.
2.5. Discontinuity Extraction, Rock Slope Rating, and Rockfall Kinetic Analysis
Based on the available three-dimensional terrain model, the characteristics of the discontinuities were extracted using the DSE software, allowing for the identification of the corresponding pole vectors. Field measurements were subsequently processed in the Dips software version 8.027 to calculate the respective pole orientations, facilitating verification between digital and field-derived data. The terrain model also served as the basis for simulating rockfall trajectories and computing associated kinetic energies.
SMR values were also estimated for each slope sector in the entire study area using data obtained from field surveys and laboratory testing. The SMR classification, which represents a modification of the RMR system, incorporates both the geometrical configuration of the slope and the orientation of discontinuities relative to the slope gradient, and is employed for evaluating rock mass quality and stability as well as estimating the likelihood of rockfall occurrence.
The SMR value for each slope sector is calculated using the following formula [40]:
where RMRb is calculated as the sum of five components: (a) the uniaxial compressive strength of the intact rock, (b) the Rock Quality Designation (RQD), (c) the spacing of discontinuities, (d) the condition of discontinuities, and (e) the influence of groundwater conditions.
SMR = RMRb − (F1 × F2 × F3) + F4
F1 is influenced by the degree of parallelism between the strike of the joints and that of the slope face, and more specifically by the angular difference between the dip direction of the joint in question and the slope dip direction.
F2 accounts for the dip angle of the joint, which is particularly relevant in cases of planar failure.
F3 presents the geometrical relationship between the slope dip and the joint dip.
F4 serves as a correction factor that considers the excavation method applied to the slope under analysis.
Generally, five distinct rock mass classes are proposed based on the SMR system [40,44]. Class V (SMR < 20) is categorized as very poor, typically associated with large planar or soil-like failures. Class IV (SMR between 20 and 40) is considered poor, where planar failures and large wedge instabilities may occur. Class III (SMR between 40 and 60) is described as fair, necessitating systematic support for both joints and wedges. Class II (SMR between 60 and 80) is rated as good, generally requiring only localized or occasional support for specific blocks. Finally, Class I (SMR between 80 and 100) represents very good or completely stable conditions, where no support measures are deemed necessary.
In the Acrocorinth cliff, the unfavorable oriented discontinuities are the main factor causing failures, with overturns and falls of rectangular pieces of small-medium size rocks that can reach a size of 1–1.3 m3. As already mentioned in the Methodology Section, the generated 3D terrain model was imported into the RocFall3 program, and the geology of the area (limestone and cherts with shales) was applied to the model. Hundreds of trajectories were then run to simulate the movement of the detached rocks along the steep slopes of the survey area. As for the coefficients of restitution used, they were taken from research carried out for Greek limestones [45].
3. Results
3.1. Preliminary Delimitation of the Study Area
Initially, a preliminary delineation of the study area was made based on its morphological characteristics and the visitor accessibility, and the area was divided into four zones (Figure 7).
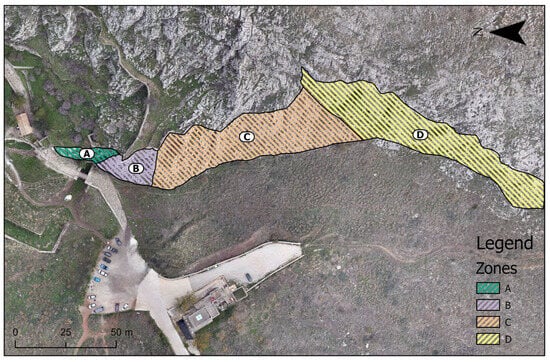
Figure 7.
Preliminary delimitation of the study area. Zone A is relatively low in height, located to the right of the entrance to the archaeological site, where there is also a small footbridge. Zone B is located in the continuation of Zone A in a southwesterly direction and has a higher elevation than Zone A. It is located close to a footpath between the parking area and the footbridge. According to officials’ testimonies, falling rocks are noted at regular intervals, which are dangerous for visitors to the site. Zone C is a continuation of Zone B in a southeasterly direction until the slope changes direction. The height towards this direction continues to increase, without any serious human activity observed. Several visitors take walks around the perimeter of this zone, and a parking area and shop exist downslope. According to officials’ testimonies, sparse falling rocks have been noted, which are dangerous for the visitors. Zone D is located southeast of Zone C, outside the perimeter of the archaeological site, and lower than Zone C.
3.2. Discontinuity Analysis
As mentioned before, DSE software was used to extract the principal poles of discontinuities (dip and dip direction) in the entire research area (Table 2 and Figure 8).

Table 2.
Principal poles extraction from DSE software.
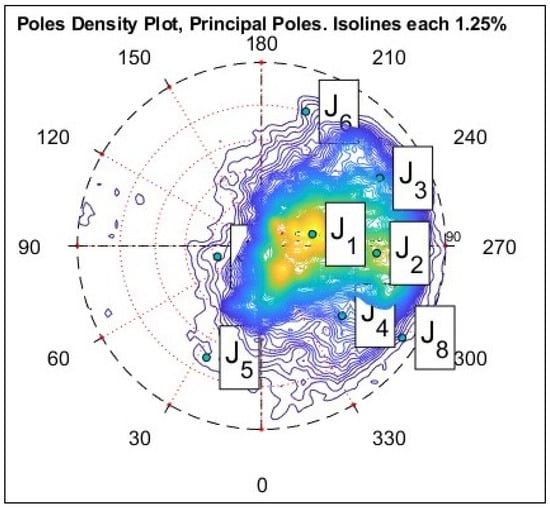
Figure 8.
Stereodiagram of the discontinuity poles using the DSE software.
In addition, field work carried out over the entire area of the rocky slope of Acrocorinth created a record of 100 measurements of discontinuity planes along with their features (orientation in dip/dip direction, aperture, spacing, continuity, etc.). All the recorded data were then imported into the Rocscience Dips program for further analysis, and the following results were exported (Table 3 and Figure 9).

Table 3.
Principal poles extraction from the Dips software.
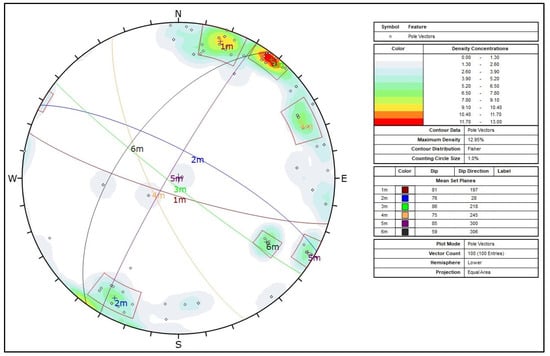
Figure 9.
Stereodiagram of the discontinuity poles and the principal planes using the Dips software.
By comparing the results as derived by the DSE and Dips programs, it seems that there is a coincidence among the discontinuities J3-4m, J4-6m, and J8-5m. However, the principal planes derived from both programs, J1 (32/257) and 3m (86/218), have a significant difference between them, so that a further analysis of the digital data sets is necessary to understand the reason for this difference.
The discontinuity planes that proved to be the most unfavorable with respect to the differently oriented slopes of faces A, B, C, and D, which affect the stability of the rock mass, were used in the subsequent SMR calculations.
3.3. SMR Calculation and Rock Fall Simulation
SMR was calculated on the preliminary delimited areas A, B, C, and D and provided the following results (Table 4).

Table 4.
SMR values for the distinctive areas A, B, C, and D of the Acrocorinth cliff.
The results of the rockfall simulations executed in the entire area of research are given in Figure 10, in terms of the kinetic energy of the detached rocks. These results were imported into the ArcGIS Pro software in ASCII format for the relevant raster calculations.
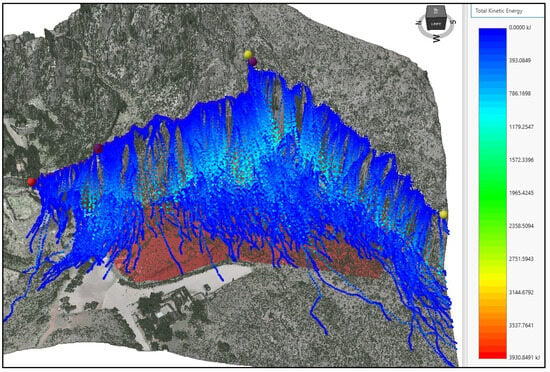
Figure 10.
Three-dimensional image of the distribution of kinetic energy from various rock fall trajectories performed along various rock paths with the use of Rocfall3 software version 1.014.
The data from the simulations carry all the necessary information, such as the local coordinates and elevation of the Digital Terrain Model, as well as the kinetic energy that each rock has acquired during its movement along a specific trajectory that starts from the most likely point of detachment and ends at the point where its movement is zeroed. The simulation results are then converted into digital files in raster-geotiff format that can be processed with ArcGIS Pro software to provide the necessary kinetic energies or rock fall intensity at any point or location throughout the survey area.
3.4. Spatial Hazard Zonation
To create the final hazard map, all the produced raster-geotiff files are imported into ArcGIS Pro. Once imported, the kinetic energy or intensity file is graded according to the classes shown in Table 5 as suggested by similar research conducted for a road infrastructure project [31].

Table 5.
Grades and classes of intensity used in rock fall susceptibility.
In addition, the SMR file is classified according to the categories presented in Table 6, based on the classification proposed by another study [39].

Table 6.
Grades and classes of rock mass stability with the use of SMR.
The above grades from Table 6 and Table 7 are then applied to extract the corresponding raster files of kinetic energy and SMR in the entire area of Acrocorinth (Figure 11 and Figure 12).

Table 7.
Values of hazard matrix = intensity X SMR.
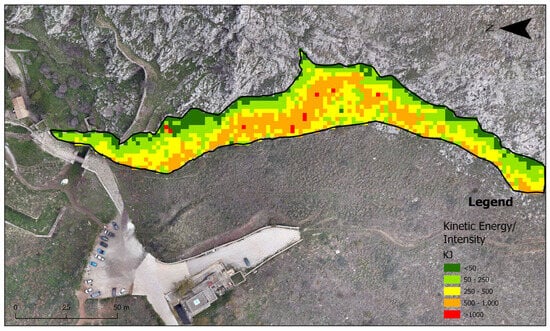
Figure 11.
Τhe distribution of kinetic energy/intensity throughout the study area.
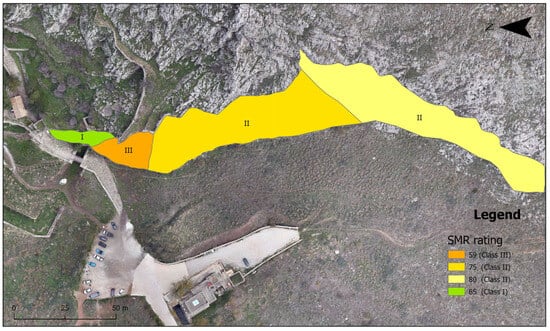
Figure 12.
The distribution of SMR throughout the study area.
The spatial distribution of kinetic energy values, as calculated through RocFall3 and visualized in the GIS environment, reveals distinct zones of rockfall intensity across the study area. The resulting kinetic energy/intensity map categorizes energy levels into five classes, ranging from low (<50 kJ) to extremely high (>1000 kJ). The highest kinetic energy values, represented by red and orange cells, are predominantly located in the central and lower sections of the slope, indicating areas where rockfall trajectories tend to converge and where acceleration due to topographic gradient is maximized. These zones signify elevated impact potential, posing a significant threat to both infrastructure and visitor safety.
Conversely, the upper boundary of the slope and peripheral areas are predominantly characterized by green tones, corresponding to low-energy impacts (<250 kJ), suggesting either reduced trajectory lengths or early energy dissipation due to terrain roughness or obstruction. The presence of concentrated clusters of moderate to high kinetic energy (250–1000 kJ) in the vicinity of access paths and structural features indicates a localized increase in risk and highlights the importance of detailed spatial assessment in culturally sensitive environments.
Slope mass rating results in a zoned map that categorizes the study area into different stability classes. According to the derived values, four distinct zones were delineated, ranging from Class I (very good stability) to Class III (fair stability). The most stable area (SMR = 85, Class I) is located in the western part of the site, near the entrance and adjacent to the fortification wall, suggesting minimal structural discontinuity and favorable orientation relative to the slope.
The majority of the slope surface falls within Class II (SMR values between 75 and 80), indicating good rock mass quality with occasional support possibly required. These zones dominate the central and eastern extents of the slope and reflect consistent discontinuity orientations and moderate slope angles. A localized area in the central-western segment exhibits an SMR value of 59 (Class III), indicating fair stability and potential susceptibility to block detachment or small-scale failures.
This classification provides a reliable basis for evaluating the relative stability of each slope segment and prioritizing monitoring or intervention measures. When integrated with the distribution of kinetic energy, the SMR enhances the spatial understanding of rockfall hazard, as presented in Table 7.
Three main hazard categories are extracted from the table above: (a) a low hazard (green) category, with values equal or less than 0.1; (b) a moderate hazard (orange) category, with values higher than 0.1 until the value of 2; and (c) a high hazard (red) category with values higher than 2. Similarly, the final rockfall hazard map produced using this methodology has three main hazard categories: low, moderate, and high (Figure 13).
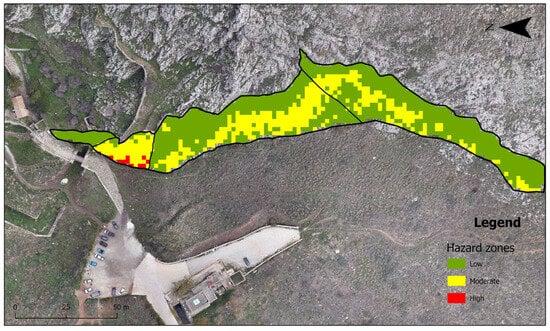
Figure 13.
Hazard map of the study area based on the kinetic energy of rockfalls and the SMR values.
The highest percentage observed on the hazard map is classified as low hazard. The moderate hazard category occupies a significant part of the study area, especially within Zone B, which is located near the entrance to the archaeological site and the parking area. Finally, the high hazard category occupies a very small part of the study area, within Zone B.
4. Discussion
Cultural heritage sites worldwide are recognized as areas of substantial indirect value, both from a religious and historical-cultural perspective. The high volume of visitors further amplifies their vulnerability and the associated risk. In Greece, many of these monuments—including the archaeological site of Acrocorinth—are located in mountainous regions with steep rocky escarpments, inherently exposing them to rockfall phenomena. To mitigate these risks, it is imperative to study the geological conditions that contribute to rockfalls and to evaluate the hazards that may pose a threat to both the monument and its visitors. It is important to acknowledge that rockfall modeling carries inherent uncertainties, largely due to the complexity of terrain and rock mechanics, as variables such as block shape, surface roughness, and friction are difficult to quantify with precision [46,47,48].
This study focuses on the assessment of rockfall hazard on a steep rocky slope located below the eastern fortification walls of Acrocorinth and adjacent to the main visitor access path. The methodology implemented follows an integrated approach combining field investigation, photogrammetric data acquisition, and geospatial analysis. To support this, a high-resolution 3D terrain model was produced through UAV photogrammetry, as used in similar studies [49,50].
The proposed methodology includes fieldwork and geological measurements aiming to characterize the rock mass and its discontinuities and validate the subsequent computational inputs and outputs. Flight planning is conducted using the UGCS software version 5.5.0, with flight parameters adjusted to ensure GSD of less than 0.5 cm. The UAV flight is executed accordingly, and the high-resolution aerial imagery is imported into Drone2Map to generate Digital Surface Models (DSMs) and Digital Terrain Models (DTMs). Discontinuity features are extracted using the DSE software and verified against field measurements. A comparative analysis between field-collected measurements and those derived from the generated 3D point cloud revealed minimal differences in the calculated orientations. Given the challenges posed by the site’s steep topography, the application of point cloud methodologies is shown to be a reliable and effective alternative to conventional survey techniques [51,52,53]. These digital approaches not only enhance the identification of discontinuity orientation but also contribute to rock mass classification. Any discrepancies in dip and dip direction between UAV and field-based data should be evaluated by a geologist with expertise in structural geology to determine their significance for further analyses, such as kinematic evaluation.
Another important aspect of the proposed methodology is the execution of kinetic rockfall analyses using a 3D rockfall software program, followed by the calculation of the SMR index for each slope sector. All spatial datasets are subsequently imported into the ArcGIS Pro framework to produce raster files, culminating in the development of detailed spatial hazard maps. The hazard categories output on the maps depend on the classification of each parameter entered in ArcGIS Pro and the hazard matrix decided to be used for the specific application.
Despite the advantages of UAV photogrammetry, certain limitations should be acknowledged. These include dependency on favorable weather conditions, difficulty capturing overhangs or shaded zones, and potential inaccuracies when converting DSMs to DTMs in vegetated areas [50]. However, in the context of Acrocorinth, the absence of vegetation mitigates these effects, ensuring that the Digital Surface Model is representative of true ground surface conditions. Additionally, while semi-automated methods improve efficiency, they may still require manual filtering to eliminate noise or irrelevant planes from the discontinuity dataset.
Regarding the hazard map that was developed in this study, it can be said that it serves as a critical tool for prioritizing risk mitigation strategies. It facilitates the identification of high-risk impact zones where the installation of protective structures—such as rockfall barriers or energy-dissipating nets—is deemed necessary. Furthermore, the delineation of moderate to low hazard areas supports the safe planning of visitor pathways and the implementation of zoning regulations. When combined with SMR-based stability assessments, kinetic energy distribution enhances the overall understanding of rockfall dynamics and provides a reliable foundation for integrated geohazard management in archaeological contexts.
Model outputs are inevitably influenced by uncertainties, especially in simulations involving complex geometries and fractured rock masses. Studies consistently show that 2D rockfall models often overestimate kinetic energy and bounce height due to their linear trajectory constraints, whereas 3D models account for terrain variability and lateral dispersion, leading to more realistic path predictions [47,54]. Additionally, variability in block shapes, restitution coefficients, and roughness leads to divergent outcomes across modeling platforms [55,56,57]. Field validation and model calibration—through high-resolution terrain data, block size measurements, and comparison with past events—are essential to ensuring credible hazard assessments [31,49,58]. In this context, the integration of multi-source data and robust simulation frameworks, as demonstrated in this study, significantly enhances the reliability of predictive modeling and risk-informed decision-making.
The presented methodology holds significant potential for broader applications. Similar UAV-based approaches have been implemented in the Poggio Baldi landslide (Italy), aiding in rockfall hazard mapping for cultural and natural sites [49]. In Latin America, data collection with the help of remote techniques such as structure from motion, accompanied by slope mass rating and kinematic analysis, has supported the analysis of slope stability along the Penipe–Baños road, which is situated in Ecuador [59]. In Asia, 3D simulations have informed risk mitigation for open-pit mines, highways, and tunnels vulnerable to large-scale rockfall activity [51,53,55]. These examples highlight the scalability of the presented methodology to various environmental, infrastructural, and cultural contexts. Its adaptability to both archaeological heritage and civil protection underscores its utility in cross-disciplinary geohazard management frameworks.
5. Conclusions
This study demonstrated an integrated digital methodology for evaluating rockfall hazards in the archaeological site of Acrocorinth, a location of high cultural significance and steep morphological complexity. The proposed workflow successfully combined UAV-based photogrammetry, geotechnical field surveys, and advanced geospatial and geomechanical modeling tools to deliver a comprehensive rockfall hazard assessment.
The high-resolution 3D terrain model, produced through a carefully planned drone flight using UGCS software, allowed for an exceptionally low Ground Sampling Distance (GSD ≤ 0.5 cm/pixel), ensuring high fidelity in capturing surface discontinuities. This model was critical in identifying rock mass features using the DSE software, and the results were cross-validated with conventional compass-based field measurements using DIPS, revealing strong agreement between the two methods.
The study focused on simulating rockfall behavior using RocFall3. This parameter provided insight into the dynamic characteristics of potential rockfalls across the study area. Concurrently, field-derived geomechanical data were used to compute slope mass rating (SMR) values, offering a classification of rock mass stability across the different zones.
The integration of SMR values with kinetic energy results in ArcGIS Pro enabled the development of a spatially referenced hazard map, categorizing the entire site into low, moderate, and high rockfall risk zones. This map provides valuable input for cultural heritage protection planning and risk mitigation strategies.
The findings confirm the applicability of UAV-based photogrammetry and 3D modeling for rockfall risk assessments in inaccessible and protected heritage environments. Moreover, the hazard zonation map can serve as a decision-support tool for prioritizing maintenance works and the design of mitigation measures, particularly in high-risk areas like Zone B near the visitor entrance and parking area.
Future work should involve long-term monitoring, periodic re-evaluation of the rock mass, and integration with real-time sensor technologies to ensure the continued safety and preservation of the site. The digital methodology presented here is replicable and can be transferred to other archaeological sites exposed to similar geological hazards.
Author Contributions
Conceptualization, E.C. and N.D.; methodology, E.C., N.D. and P.P.; validation, N.D., P.P. and M.A.; formal analysis, E.C., N.D. and P.P.; investigation, E.C., N.D. and M.A.; resources, N.D., P.P. and M.A.; data curation, E.C., M.M., N.D. and P.P.; writing—original draft preparation, E.C. and N.D.; writing—review and editing, E.C. and N.D.; visualization, M.M. and N.D.; supervision, N.D.; project administration, N.D. and P.P.; funding acquisition, N.D. and P.P. All authors have read and agreed to the published version of the manuscript.
Funding
This research received no external funding.
Data Availability Statement
Data are available from the authors upon request.
Acknowledgments
We would like to thank the Hellenic Ministry of Culture, Ephorate of Antiquities of Corinthia, for their support, which helped us to conduct this survey.
Conflicts of Interest
The authors declare no conflicts of interest.
Abbreviations
The following abbreviations are used in this manuscript:
| UAV | Unmanned Aerial Vehicle |
| UgCS | Universal Ground Control Software |
| GSD | Ground Sampling Distance |
| SfM | Structure from motion |
| DSE | Discontinuity Set Extractor |
| DEM | Digital Elevation Model |
| DSM | Digital Surface Model |
| DTM | Digital Terrain Model |
| RTK | Real-time kinematic positioning |
| SMR | Slope mass rating |
References
- Ribacchi, R.; Riccioni, R. Use of Rockfall hazard rating systems for hazard mapping at regional scale. Landslides 2005, 2, 53–66. [Google Scholar]
- Zhou, C.; Esaki, T.; Mitani, Y. Spatial probabilistic modeling of slope failure using an integrated GIS Monte Carlo simulation approach. Eng. Geol. 2003, 68, 373–386. [Google Scholar] [CrossRef]
- Barlow, J.; Lim, M.; Rosser, N.J.; Petley, D.N.; Brain, M.J.; Norman, E. Modeling cliff erosion using negative power law scaling of rockfalls. Geomorphology 2012, 139–140, 416–424. [Google Scholar] [CrossRef]
- Carrea, D.; Abellán, A.; Derron, M.H. 3D rockfall modeling in urban areas using high resolution GIS data and LiDAR point clouds. Nat. Hazards Earth Syst. Sci. 2015, 15, 991–1001. [Google Scholar]
- Loupasakis, C.; Tsangaratos, P.; Gatsios, T.; Eleftheriou, V.; Parcharidis, I.; Soupios, P. Investigating the stability of the Hill of the Acropolis of Athens, Greece, using fuzzy logic and remote sensing techniques. Remote Sens. 2023, 15, 1067. [Google Scholar] [CrossRef]
- Abellán, A.; Oppikofer, T.; Jaboyedoff, M.; Rosser, N.J.; Lim, M.; Lato, M.J. Terrestrial laser scanning of rock slope instabilities. Earth Surf. Process. Landf. 2014, 39, 80–97. [Google Scholar] [CrossRef]
- Oppikofer, T.; Jaboyedoff, M.; Keusen, H.R. Collapse at the eastern Eiger flank in the Swiss Alps. Nat. Geosci. 2009, 2, 531–535. [Google Scholar] [CrossRef]
- Jaboyedoff, M.; Oppikofer, T.; Abellán, A.; Derron, M.H.; Loye, A.; Metzger, R.; Pedrazzini, A. Use of LIDAR in landslide investigations: A review. Nat. Hazards 2012, 61, 5–28. [Google Scholar] [CrossRef]
- Gigli, G.; Casagli, N. Semi-automatic extraction of rock mass structural data from high resolution LIDAR point clouds. Int. J. Rock Mech. Min. Sci. 2011, 48, 187–198. [Google Scholar] [CrossRef]
- Abellán, A.; Vilaplana, J.M.; Martínez, J. Application of a long-range terrestrial laser scanner to a detailed rockfall study at Vall de Núria (Eastern Pyrenees, Spain). Eng. Geol. 2006, 88, 136–148. [Google Scholar] [CrossRef]
- Nikolakopoulos, K.; Kavoura, K.; Depountis, N.; Kyriou, A.; Argyropoulos, N.; Koukouvelas, I.; Sabatakakis, N. Preliminary results from active landslide monitoring using multidisciplinary surveys. Eur. J. Remote Sens. 2017, 50, 280–299. [Google Scholar] [CrossRef]
- Nikolakopoulos, K.; Kavoura, K.; Depountis, N.; Argyropoulos, N.; Koukouvelas, I.; Sabatakakis, N. Active landslide monitoring using remote sensing data, GPS measurements and cameras on board UAV. In Proceedings of the SPIE 9644, Earth Resources and Environmental Remote Sensing/GIS Applications VI, Toulouse, France, 21 September 2015; p. 96440E. [Google Scholar] [CrossRef]
- Turner, A.K.; Schuster, R.L. Landslides: Investigation and Mitigation (Special Report 247); Transportation Research Board: Washington, DC, USA, 1996. [Google Scholar]
- Kavoura, K.; Konstantopoulou, M.; Depountis, N.; Sabatakakis, N. Slow-moving landslides: Kinematic analysis and movement evolution modeling. Environ. Earth Sci. 2020, 79, 130. [Google Scholar] [CrossRef]
- Servou, A.; Vagenas, N.; Depountis, N.; Roumelioti, Z.; Sokos, E.; Sabatakakis, N. Rockfall Intensity under Seismic and Aseismic Conditions: The Case of Lefkada Island, Greece. Land 2023, 12, 172. [Google Scholar] [CrossRef]
- Papaioannou, S.; Papathanassiou, G.; Marions, V. Rockfall Hazard Evaluation in a Cultural Heritage Site: Case Study of Agia Paraskevi Monastery, Monodendri, Greece. Geosciences 2025, 15, 92. [Google Scholar] [CrossRef]
- Yakar, M.; Ulvi, A.; Yiğit, A.Y.; Alptekin, A. Discontinuity set extraction from 3D point clouds obtained by UAV photogrammetry in a rockfall site. Surv. Rev. 2022, 54, 409–423. [Google Scholar] [CrossRef]
- Albarelli, D.; Mavrouli, O.; Nyktas, P. Identification of potential rockfall sources using UAV-derived point cloud. Bull. Eng. Geol. Environ. 2021, 80, 6539–6561. [Google Scholar] [CrossRef]
- Volkwein, A.; Schellenberg, K.; Labiouse, V.; Agliardi, F.; Berger, F.; Bourrier, F.; Dorren, L.K.A. Rockfall characterization and structural protection—A review. Nat. Hazards Earth Syst. Sci. 2011, 11, 2617–2651. [Google Scholar] [CrossRef]
- Blegen, C.W.; Broneer, O.; Stillwell, R.; Bellinger, A.R. Corinth, Vol. III, Part 1: Acrocorinth. Excavations in 1926; Harvard University Press: Cambridge, MA, USA, 1930. [Google Scholar]
- Carpenter, R.; Bon, A. Corinth, Vol. II, Part 2: The Defenses of Acrocorinth and the Lower Town; Harvard University Press: Cambridge, MA, USA, 1936. [Google Scholar]
- Koumoussi, A. The Acrocorinth; Archaeological Receipts Fund: Athens, Greece, 2001. [Google Scholar]
- Athanasoulis, D. The Castle of Acrocorinth and Its Enhancement Project (2006–2009); Hellenic Ministry of Culture and Tourism, 25th Ephorate of Byzantine Antiquities: Ancient Corinth, Greece, 2009. [Google Scholar]
- Hoek, E.; Bray, J. Rock Slope Engineering, 3rd ed.; Institution Mining and Metallurgy: London, UK, 1981; 372p. [Google Scholar]
- Sarro, R.; Riquelme, A.; García, G.H.; Mateos, R.M.; Tomàs, R.; Pastor, J.L.; Cano, M.; Herrera, G. Rockfall Simulation Based on UAV Photogrammetry Data Obtained during an Emergency Declaration: Application at a Cultural Heritage Site. Remote Sens. 2018, 10, 1923. [Google Scholar] [CrossRef]
- Guzzetti, F.; Crosta, G.; Detti, R.; Agliardi, F. STONE: A computer program for the three-dimensional simulation of rock-falls. Comput. Geosci. 2002, 28, 1079–1093. [Google Scholar] [CrossRef]
- Chatziangelis, E.; Depountis, N.; Pelekis, P. Three-dimensional modelling for the delineation of hazard zones on rocky slopes in areas of archaeological interest. In Engineering Geology & Geotechnics: Building for the Future, Proceedings of the 4th European Regional Conference of IAEG, Dubrovnik, Croatia, 8–12 October 2024; Kovacevic, M.S., Libric, L., Basic, M., Eds.; International Society for Soil Mechanics and Geotechnical Engineering: London, UK; pp. 81–88.
- Collier, R.B.; Collier, D. Shaping the Political Arena: Critical Junctures, the Labor Movement, and Regime Dynamics in Latin America; Princeton University Press: Princeton, NJ, USA, 1991. [Google Scholar]
- Saroglou, C. GIS-Based Rockfall Susceptibility Zoning in Greece. Geosciences 2019, 9, 163. [Google Scholar] [CrossRef]
- Corominas, J.; Matas, G.; Ruiz-Carulla, R. Quantitative analysis of risk from fragmental rockfalls. Landslides 2019, 16, 5–21. [Google Scholar] [CrossRef]
- Depountis, N.; Nikolakopoulos, K.; Kavoura, K.; Sabatakakis, N. Description of a GIS-based rockfall hazard assessment methodology and its application in mountainous sites. Bull. Eng. Geol. Environ. 2020, 79, 645–658. [Google Scholar] [CrossRef]
- Song, J.; Du, S.; Yong, R.; Wang, C.; An, P. Drone Photogrammetry for Accurate and Efficient Rock Joint Roughness Assessment on Steep and Inaccessible Slopes. Remote Sens. 2023, 15, 4880. [Google Scholar] [CrossRef]
- Sturzenegger, M.; Stead, D. Close-range terrestrial digital photogrammetry and terrestrial laser scanning for discontinuity characterization on rock cuts. Eng. Geol. 2009, 106, 163–182. [Google Scholar] [CrossRef]
- Zhang, Y.; Yue, P.; Zhang, G.; Guan, T.; Lv, M.; Zhong, D. Augmented Reality Mapping of Rock Mass Discontinuities and Rockfall Susceptibility Based on Unmanned Aerial Vehicle Photogrammetry. Remote Sens. 2019, 11, 1311. [Google Scholar] [CrossRef]
- Riquelme, A.J.; Abellán, A.; Tomás, R.; Jaboyedoff, M. A new approach for semi-automatic rock mass joints recognition from 3D point clouds. Comput. Geosci. 2014, 68, 38–52. [Google Scholar] [CrossRef]
- Rocscience Dips, version 8.027; [Computer Software]; Rocscience Academic Bundle: Toronto, ON, Canada, 2023.
- Rocscience RocFall3, version 1.014; [Computer Software]; Rocscience Academic Bundle: Toronto, ON, Canada, 2024.
- Hungr, O.; Corominas, J.; Eberhardt, E. Estimating landslide motion mechanism, travel distance and velocity. In Landslide Risk Management; CRC Press: Boca Raton, FL, USA, 2005; pp. 109–138. [Google Scholar]
- Stevens, W. Rocfall: A Tool for Probabilistic Analysis, Design of Remedial Measures and Prediction of Rockfalls. Master’s Thesis, University of Toronto, Toronto, ON, Canada, 1998. [Google Scholar]
- Romana, M.A. Geomechanical classification for slopes: Slope mass rating. Compr. Rock Eng. 1985, 3, 575–599. [Google Scholar]
- Pastor, J.L.; Riquelme, A.J.; Tomás, R. Clarification of the slope mass rating parameters assisted by SMRTool. Bull. Eng. Geol. Environ. 2019, 78, 6131–6142. [Google Scholar] [CrossRef]
- Palmström, A. Measurement and Characterization of Rock Mass Jointing; A.A. Balkema Publishers: Rotterdam, The Netherlands, 2001. [Google Scholar]
- Colomina, I.; Molina, P. Unmanned aerial systems for photogrammetry and remote sensing: A review. ISPRS J. Photogramm. Remote Sens. 2014, 92, 79–97. [Google Scholar] [CrossRef]
- Romana, M.; Serón, J.; Montalar, E. SMR Geomechanics classification: Application, experience and validation. In Proceedings of the 10th ISRM Congress, Sandton, South Africa, 8–12 September 2003; pp. 981–984. [Google Scholar]
- Sabatakakis, N.; Depountis, N.; Vagenas, N. Evaluation of Rockfall Restitution Coefficients. In Engineering Geology for Society and Territory—Volume 2; Lollino, G., Giordan, D., Crosta, G.B., Corominas, J., Azzam, R., Wasowski, J., Sciarra, N., Eds.; Springer: Cham, Switzerland, 2015. [Google Scholar] [CrossRef]
- Ma, K.; Liu, G. Three-Dimensional Discontinuous Deformation Analysis of Failure Mechanisms and Movement Characteristics of Slope Rockfalls. Rock Mech. Rock Eng. 2022, 55, 275–296. [Google Scholar] [CrossRef]
- Akın, M.; Dinçer, İ.; Orhan, A.; Varol, O.O. A Comparative Study on Rockfall Block Motion Characteristics Using 3-D and 2-D Rockfall Simulations: A Case Study from Cappadocia (Mazı, Türkiye). Nat. Hazards 2025, 121, 2265–2291. [Google Scholar] [CrossRef]
- Al-E’Bayat, M.; Guner, D.; Sherizadeh, T.; Asadizadeh, M. Numerical Investigation for the Effect of Joint Persistence on Rock Slope Stability Using a Lattice Spring-Based Synthetic Rock Mass Model. Sustainability 2024, 16, 894. [Google Scholar] [CrossRef]
- Robiati, C.; Mastrantoni, G.; Francioni, M.; Eyre, M.; Coggan, J.; Mazzanti, P. Contribution of High-Resolution Virtual Outcrop Models for the Definition of Rockfall Activity and Associated Hazard Modelling. Land 2023, 12, 191. [Google Scholar] [CrossRef]
- Vanneschi, C.; Rindinella, A.; Salvini, R. Hazard Assessment of Rocky Slopes: An Integrated Photogrammetry–GIS Approach Including Fracture Density and Probability of Failure Data. Remote Sens. 2022, 14, 1438. [Google Scholar] [CrossRef]
- Zhang, W.; Zhao, X.; Pan, X.; Wei, M.; Yan, J.; Chen, J. Characterization of High and Steep Slopes and 3D Rockfall Statistical Kinematic Analysis for Kangyuqu Area, China. Eng. Geol. 2022, 308, 106807. [Google Scholar] [CrossRef]
- Kong, D.; Wu, F.; Saroglou, C.; Sha, P.; Li, B. In-Situ Block Characterization of Jointed Rock Exposures Based on a 3D Point Cloud Model. Remote Sens. 2021, 13, 2540. [Google Scholar] [CrossRef]
- Li, M.; Xiu, Z.; Han, J.; Meng, F.; Wang, F.; Ji, H. Characterization and Stability Analysis of Rock Mass Discontinuities in Layered Slopes: A Case Study from Fushun West Open-Pit Mine. Appl. Sci. 2024, 14, 11330. [Google Scholar] [CrossRef]
- Abbruzzese, J.M.; Labiouse, V. A New Cadanav Methodology for Rock Fall Hazard Zoning Based on 3D Trajectory Modelling. Geosciences 2020, 10, 434. [Google Scholar] [CrossRef]
- Yan, J.; Chen, J.; Tan, C.; Zhang, Y.; Liu, Y.; Zhao, X.; Wang, Q. Rockfall Source Areas Identification at Local Scale by Integrating Discontinuity-Based Threshold Slope Angle and Rockfall Trajectory Analyses. Eng. Geol. 2023, 313, 106993. [Google Scholar] [CrossRef]
- Lukačić, H.; Noël, F.; Jaboyedoff, M.; Krkač, M. Impact of Discontinuity Data Acquisition Methods on Rockfall Susceptibility Assessment Using High-Resolution 3D Point Cloud. Eng. Geol. 2024, 340, 107677. [Google Scholar] [CrossRef]
- Macciotta, R.; Gräpel, C.; Skirrow, R. Fragmented Rockfall Volume Distribution from Photogrammetry-Based Structural Mapping and Discrete Fracture Networks. Appl. Sci. 2020, 10, 6977. [Google Scholar] [CrossRef]
- Hantz, D.; Corominas, J.; Crosta, G.B.; Jaboyedoff, M. Definitions and Concepts for Quantitative Rockfall Hazard and Risk Analysis. Geosciences 2021, 11, 158. [Google Scholar] [CrossRef]
- Jordá-Bordehore, L.; Albán, L.G.; Valenzuela, R.C.; Bravo, G.; Menoscal-Menoscal, M.; Larreta, E.; Garces, D.; Mulas, M. An Analysis of Slope Stability in the Penipe–Baños Road by Applying Empirical Methods, Kinematic Analysis and Remote Photogrammetry Techniques. Geosciences 2023, 13, 366. [Google Scholar] [CrossRef]
Disclaimer/Publisher’s Note: The statements, opinions and data contained in all publications are solely those of the individual author(s) and contributor(s) and not of MDPI and/or the editor(s). MDPI and/or the editor(s) disclaim responsibility for any injury to people or property resulting from any ideas, methods, instructions or products referred to in the content. |
© 2025 by the authors. Licensee MDPI, Basel, Switzerland. This article is an open access article distributed under the terms and conditions of the Creative Commons Attribution (CC BY) license (https://creativecommons.org/licenses/by/4.0/).