Article

Impact of Climate Conditions on the Sensitivity of Long-Term Annual River Flow in a Cascade-Dammed River System: The Brda River Case Study (Poland)

by
Dawid Szatten
1,*,
Edward Zbigniew Łaszyca
2,
Alberto Bosino
3,
Mattia De Amicis
3 and
Oleksandr Obodovskyi
1,4
1
Faculty of Geographical Sciences, Kazimierz Wielki University in Bydgoszcz, Kościeleckich Square 8, 85-033 Bydgoszcz, Poland
2
Bydgoszcz Airport Meteorological Office, Paderewskiego 1, 86-005 Białe Błota, Poland
3
Department of Earth and Environmental Sciences, University of Milano-Bicocca, Piazza della Scienza, 1, 20126 Milano, Italy
4
Faculty of Geography, Taras Shevchenko National University of Kyiv, Academika Glushkova Av. 2a, 03127 Kyiv, Ukraine
*
Author to whom correspondence should be addressed.
Geosciences 2025, 15(6), 197; https://doi.org/10.3390/geosciences15060197
Submission received: 14 April 2025 / Revised: 8 May 2025 / Accepted: 21 May 2025 / Published: 23 May 2025
(This article belongs to the Topic Basin Analysis and Modelling)

Abstract

:
Maintaining the sustainable quantity and quality of water resources is crucial for fluvial systems, as well as for human life. This study describes the long-term annual river flow within the Brda River catchment of Poland, a fluvial system subjected to the strong hydrotechnical transformations of a cascade of dams. Our research was based on the following hydrological data (1951–2021), meteorological data (1971–2021), and climate scenarios (2022–50) to determine observed and simulated annual river flows. In this research, rising trends in the mean annual temperature and in the annual precipitation in the Brda River basin have been observed. In addition, significant research findings were the three complete river flow oscillations observed to date, and the further predicted river flow oscillations that have been projected by 2050. We modified the Turc model by linking the forecast of river flow patterns to the precipitation factor. Moreover, we predict a decrease in the river flow in the Brda River catchment of up to 10%. These studies, integrated with river flow scenarios, explicitly indicate that a river flow crisis will occur by 2050. However, it can be reduced through dam operation systems and good environmental practices in river basin management plans. This research contributes to the formulation of a sustainable management model for a cascade-dammed river that considers climate challenges.

1. Introduction

Climate change increases hydrogeological extremes, including floods and droughts (e.g., [1,2,3,4]), which activate landslides and contribute to soil erosion and land degradation processes [5,6]. Shared Socioeconomic Pathways (SSPs) stated in the IPCC [7] that a global temperature increase from 1.5 °C to 4.8 °C will have a negative impact on the climate, human health, and economy. Climate change has a direct consequence on people in the natural environment and necessitates a sustainable approach to natural resources [8]. However, human impact on the environment is increasing, contributing to higher levels of land degradation processes and emissions of air pollutants [9]. This trend can be directly observed in the natural environment. Long-term changes in water quality [10] and quantity [11] are indicators of human pressure on the environment. Most research on climate and water regime changes has focused on discharge trends [12,13,14,15,16], seasonal river discharge variations [17], basin water models [18], hydropower potential models [19], and hydrodynamic–hydrological machine learning models [20].
Climate change and excessive greenhouse gas emissions profoundly impact hydrological cycles [21]. Sustainable water resource management requires the consideration of future climate change and its connection with hydrological conditions in catchments on a global scale [22]. To present future climate change, the Representative Concentration Pathway (RCP) scenarios recommended by the Intergovernmental Panel on Climate Change [21] are widely used [23,24,25,26,27,28]. The RCP scenarios delineate three trajectories for the evolution of greenhouse gas emissions throughout the 21st century: a stringent mitigation pathway (RCP2.6), intermediate pathway (RCP4.5, RCP6.0), and a pathway characterized by exceptionally high greenhouse gas emissions (RCP8.5). Based on the RCP4.5 scenario, it is assumed that by 2100, due to natural and anthropogenic factors, the atmospheric concentration of carbon dioxide will increase to 540 ppm, accompanied by a radiative forcing value of 4.5 W·m−2. The RCP2.6 scenarios were deemed unrealistic, as the 400 ppm threshold has already been surpassed, whereas the RCP6.0 scenario outlines are less optimistic, and the RCP8.5 scenario implies the irreversible destabilization of Earth’s climate system.
Depending on the research area, studies on water discharge differ in terms of scale, from a global scale (e.g., [29,30,31,32,33]) to a catchment scale [34,35,36]. Natural and human-induced processes acting on the catchment scale are reflected in land use/land cover transformations [37,38,39,40], directly contributing to increasing soil erosion processes and sediment availability and indirectly acting on the course of fluvial processes. Studies on river flow variations have been conducted using statistical analyses [41], the IHA method [36,39,42,43], the HBV model [44,45,46], the THREW model [20,47], and SWAT models [13,48,49].
River flow alterations are necessarily associated with the construction of dams and river cascades [50] and dam removals [51], which directly cause changes in sediment continuity [52,53] and disrupt ecological continuity [54], contributing to multiple changes in the water regime and riverbed morphology. In the face of climate change, observations on cascade-dammed rivers are crucial to meeting the need for water for human consumption, agriculture, hydropower, and flood control. The Brda River catchment has been extensively studied in the past [39,53,55] and was selected here to re-evaluate the existing knowledge in the light of climate change and the cumulative impact of cascading dams on human water resources.
A comprehensive quantitative assessment was carried out to determine the pattern of the long-term changes in the river flow of a cascade-dammed river. Based on statistical analyses, we evaluated the sensitivity of the annual river flow to climatic conditions. Furthermore, this study leveraged the EURO-CORDEX simulations to describe the current state of knowledge of climate projections in Europe [56]. Finally, based on a modified Turc model, we projected the sensitivity of annual river flows to future changes in climate forcing conditions. This model calculates discharge from a catchment based on prior data regarding predictors such as air temperature and precipitation [57,58,59]. Overall, the abovementioned research showed that the Turc method can be a relevant tool for water balance analysis and planning purposes at a catchment scale, particularly in situations where direct measurements are unavailable. However, it is crucial to recognize the limitations of the Turc method, namely the following: (i) the obtained accuracy of the model depends on the calibration coefficients based on the observed data and regional characteristics, (ii) the availability of reliable data or predictive models of future climate features, (iii) the omission of the catchment characteristics, such as topography, soil type, and land use, and (iv) failure to take into account evapotranspiration, which is extremely important especially in the summer, when low water flow dominates. Our study proposes an adjustment to the Turc model coefficients to consider local catchment characteristics, in particular the precipitation supply component.
We tested the following research hypotheses: (i) Long-term variations in water flow are a result of climate change and human activity; is it possible to identify an increase or decrease in the frequency and/or amplitude of river flow oscillations over the period under consideration? (ii) A cascade-dammed river regime reflected the pressure related to the dam’s operation; is the operation system of hydropower plants (HPPs) and the change in the operational regime from hydropeaking to run-of-river reflected in the hydrological conditions in the longitudinal profile of the Brda River? (iii) Simulated river flow tends to coincide with projected climate change; does the spatial–temporal forecast of temperature and precipitation presented in climate models have a negative (or positive) influence on the forecast river flow at the Brda River catchment scale? (iv) Projected changes in the river flow under the strong pressure of hydrotechnical structures will require the sustainable management of water resources on the overall catchment scale; the final output of the research is the establishment of two framework scenarios forecasting an inhibited or deteriorated river flow crisis in the Brda River catchment. Research on hydrological observations is important, as it allows us to determine the long-term trends of changes stemming from climate change and human activity, but also points to the need for new research methods to enable the long-term sustainable management of water resources in catchments transformed by hydrotechnical structures.

2. Materials and Methods

2.1. Study Area

The Brda is one of the largest lowland rivers in Poland, with a catchment exceeding 4661 km2 [60] (Figure 1). The river is 245 km long and starts on a moraine upland formed by meltwater runoff during the younger phases of the Pomeranian stage of the last glaciation [61]. The uplands were built from postglacial clays separated by vari-grained sands, while the bottom of the valley was filled with outwash sand. According to the Corine Land Cover [62] database obtained from the Copernicus Land Monitoring Service, the Brda catchment is mainly covered by forest and arable land, which account for 46.9% and 36.6%, respectively, of the area. A decrease in forest and an increase in arable land and anthropogenic areas is a characteristic trend in the longitudinal profile of the Brda River catchment [55]. Moreover, lakes in the upper catchment significantly affect the surface water storage [63]. In contrast, the lower reaches of the river (from km 75.1 to its outlet into the Vistula River [the largest river in Poland]) were strongly transformed due to the presence of the hydrotechnical structures.
In the middle course of the Brda River, one of the oldest dam reservoirs in Poland is located—Mylof. Three other reservoirs (Koronowo, Tryszczyn, and Smukała) form the Lower Brda Cascade (LBC), with a single operational system. Table 1 shows the general characteristics of the dams.
A significant determinant of the water regime of a river section transformed by hydrotechnical structures is the operational system of hydropower plants (HPPs). In 2001, the operational system replaced a hydropeaking regime with a run-of-river regime for both the Mylof HPP [64] and the LBC [55]. As stipulated in the water use permits, the environmental flow for the Mylof Dam is 6.0 m3·s−1, whereas, for LBC, the water management instruction only requires that the environmental flow of 15.0 m3·s−1 be maintained below the last cascade reservoir (Smukała), to allow for a maximum flow of 45 m3·s−1 during the HPP operation. However, the run-of-river regime operation of the HPP Koronowo is possible for the use of water resources up to 120.0 m3·s−1 [65]; therefore, significant flow disturbances were observed along a 17.8 km section of the river.
Moreover, the entire estuary section of the Brda River within the city of Bydgoszcz has also been strongly transformed due to hydrotechnical structures (water mills and weirs, etc.) since the Middle Ages, when the water regime was controlled by two small weirs at Bydgoszcz and Czersko Polskie [66].

2.2. Materials

2.2.1. Hydrological Data

This study is based on daily discharge data provided by the Institute of Meteorology and Water Management—National Research Institute (IMWM-NRI) for three gauging stations (Figure 1). The data describe the flow conditions of the Brda catchment (Table 2) and are supplemented with discharge data (Q) (recorded by the Piła Młyn gauging station at the inlet of the LBC) gathered by HPP Koronowo until 2013.

2.2.2. Meteorological Data

The meteorological data are supplied by stations at Chojnice, Piła, and Toruń (Table 3) operating under the auspices of the Institute of Meteorology and Water Management—National Research Institute (IMWM-NRI) from 1971 to 2021.
The mean daily temperature (T) was derived from methods employed by the IMWM-NRI from 1 January 1996 [67]. Precipitation (P) in mm was measured using rain gauges in accordance with the methods used by the IMWM-NRI [68].
T and P data were interpolated for the stations provided in Table 3 for the period 1971–2021 using the ‘Angular Distance Weighted’ tool in SAGA GIS software (v. 2.3.2) for the Brda River catchment. The T and P values for analyzing the gauging station location were obtained using ‘Add Grid Values to the Point’ tool in SAGA. However, due to the close distance between the stations in Tuchola and Piła Młyn, the P and T values were very similar, and were acquired for both above stations. In addition, daily data were used to calculate the mean annual temperature (°C) and annual precipitation (mm). The data were aligned using a seven-element variable, and linear trends were determined. A seven-element variable was calculated as the time period’s moving average, where the average value for n-year includes the range of 3 years back and 3 years forward. The statistical significance of the trends was verified with Student’s t-test, assuming a level of significance of 0.05 using the Microsoft Excel “Analysis ToolPak”.

2.2.3. Climate Scenarios

The projected river flow for the Brda River catchment was based on meteorological data on the mean annual temperature (T) and precipitation (P) published under the Klimada 2.0 project (https://klimada2.ios.gov.pl/klimat-scenariusze-portal/ accessed on 30 October 2023), based on the climatic scenarios of EURO-CORDEX [56]. Datasets for T and P included annual values for 2022–50, with a spatial resolution of ~12.5 km according to the methodology described by Mezghani et al. [69]. The data reflecting climatic scenarios are consistent with four global Representative Concentration Pathways (RCPs) of atmospheric concentration changes in CO2, according to the report by the Intergovernmental Panel on Climate Change (IPCC) [70].

2.3. Methods

2.3.1. Delimiting Trends of Flow Variability

Long-term trends in water flow were based on the integral curves method successfully applied to lowland rivers by Lukіanets et al. [71], where the dimensionless ki index was calculated for the annual discharge characteristics, determined according to hydrological data (Qav average; Qmin minimum; Qmax maximum) using Formula (1):
k i = Q i Q ¯ f ( i ) = k i 1
where ki is a modular index, Qi is the value of the i-th expression of the array, Q ¯ is the arithmetic mean, and ∑(ki − 1) is the sum of deviations.
The curve of ki reflects the sum of deviations for the annual mean for Qav, Qmin, and Qmax, and the standard deviation is the angle α between the trend line and the X-axis. An upward ki curve denotes a rising trend in the river flow. In contrast, a downward ki curve indicates a falling trend in the river flow. The higher the tgα, the greater the rate of flow rate increase/decrease. A period that contains one rising trend and one falling trend in discharge intensity corresponds to one complete river flow oscillation [41].

2.3.2. Sensitivity of Annual River Flow to Climate Conditions

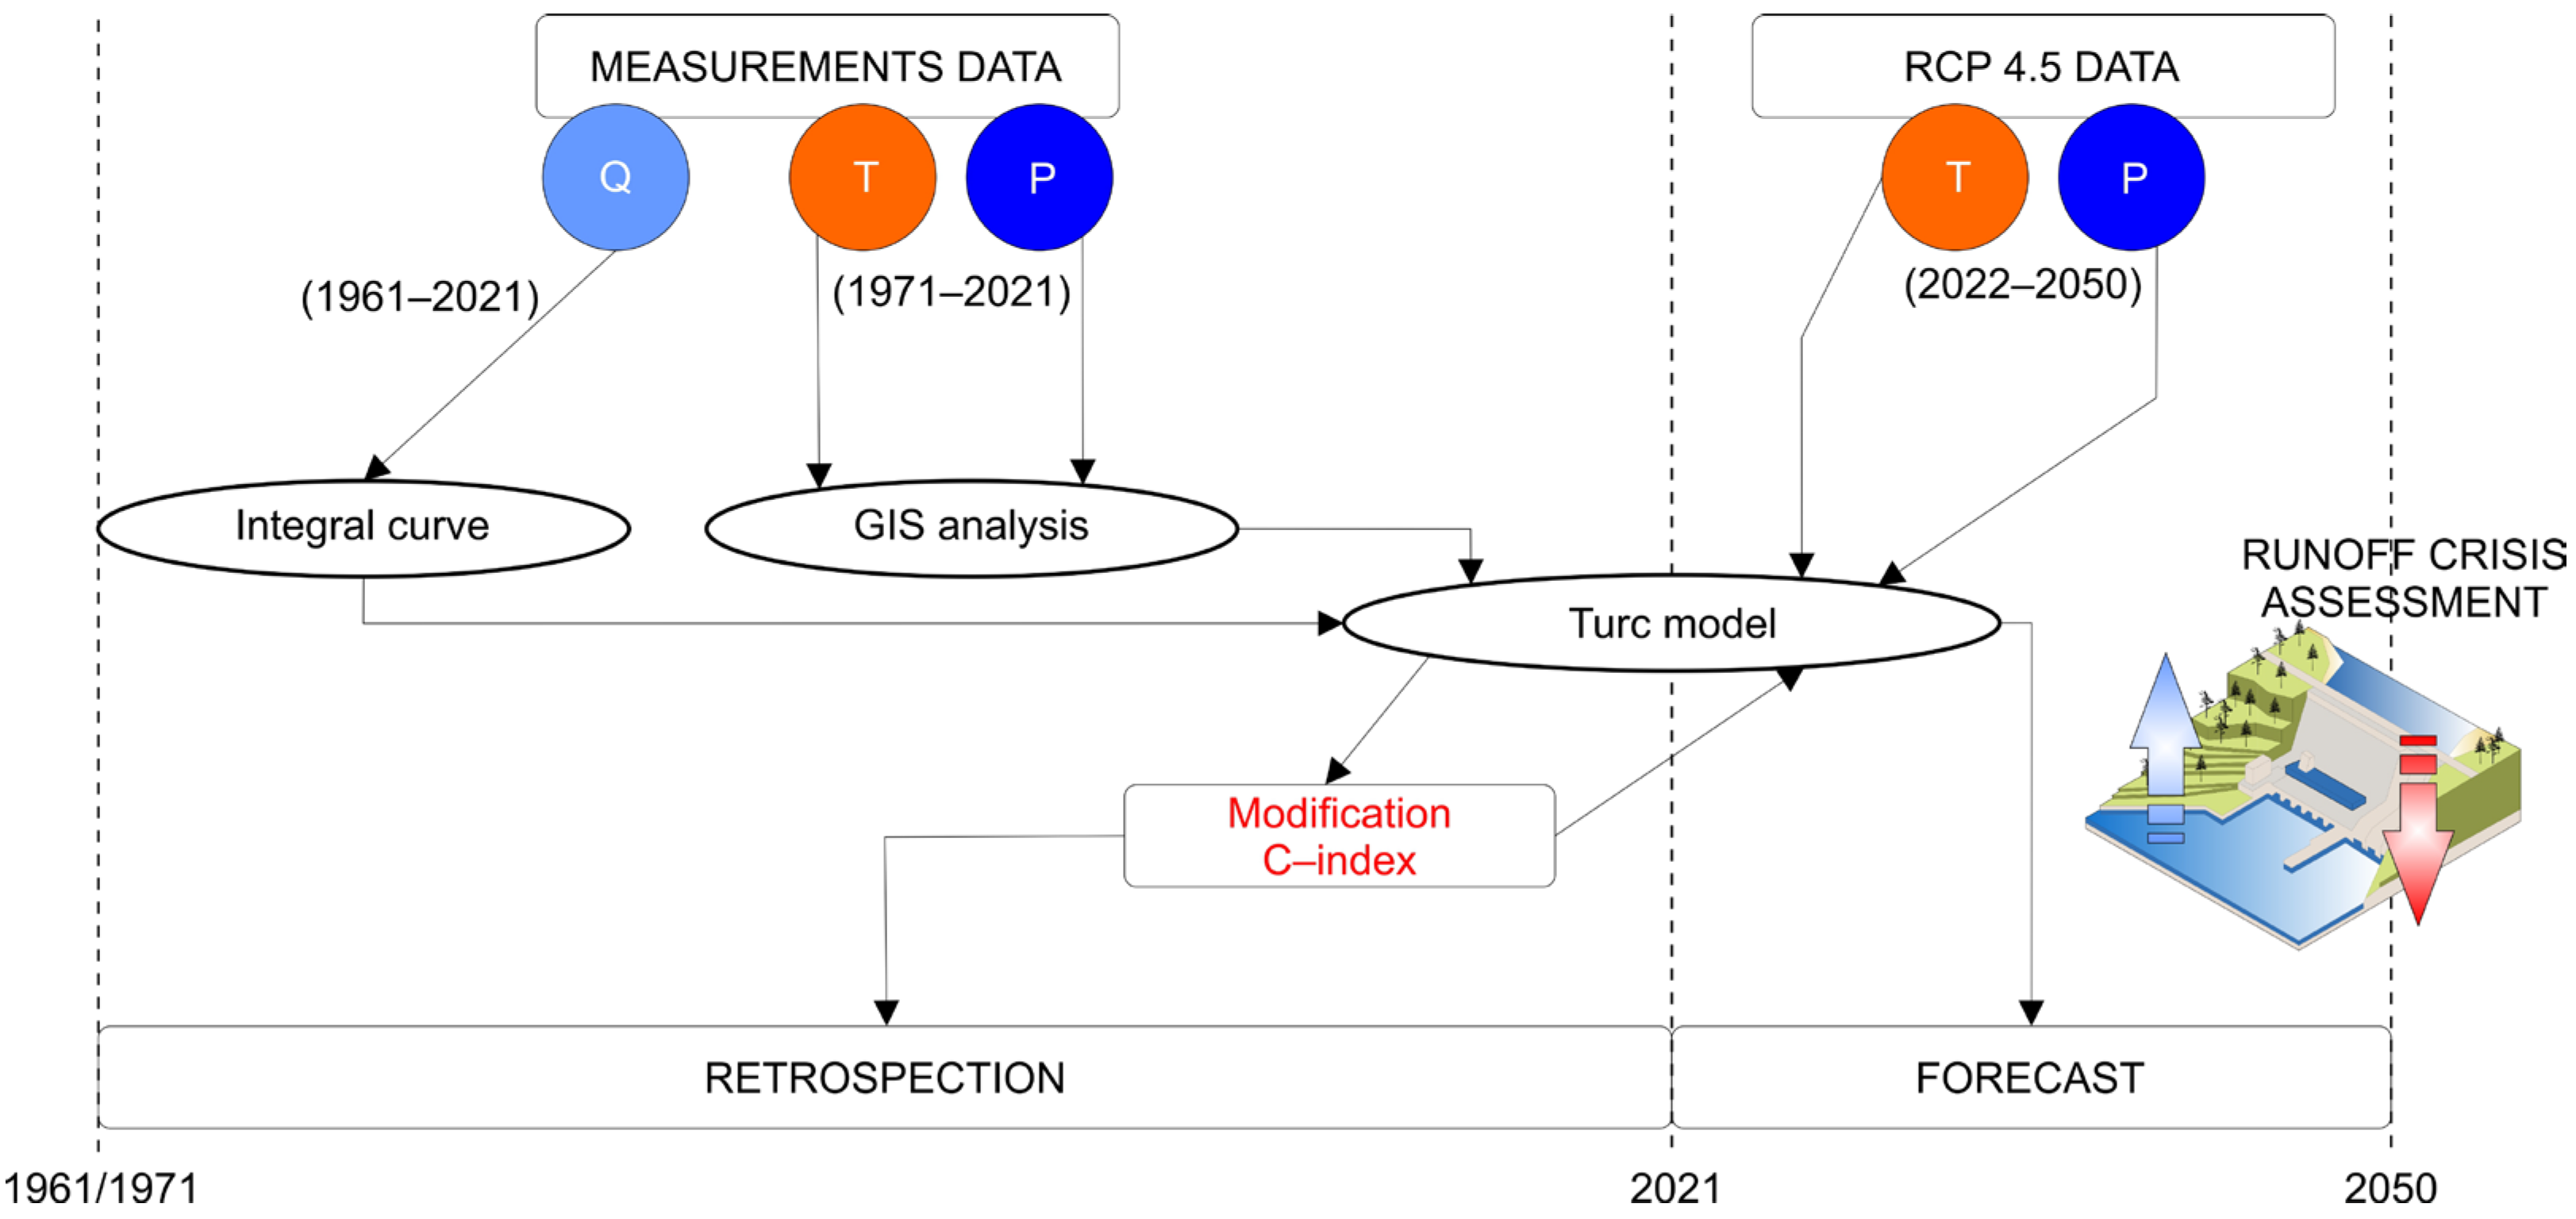
The hydrological conditions can be forecasted by combining a river flow analysis with a climate sensitivity analysis, based on a retrospection of empirical river flow data. For the retrospection of river flow (QO) conditions (1961–2021) to enable suitable adjustments to be made to the model and forecast (QS) (2021–50) (Figure 2), we used the model described by Turc [72]. In that retrospection, we considered that the annual river flow is a known function of temperature (T) and precipitation (P), calculated using Formulas (2)–(5). The data of four gauging stations within the Brda River catchment were taken into consideration for this study (Figure 1, Table 2).
Q = P 1 L c L 2 + P 2
L = 300 + 25 T + 0.05 T 3
P > ( 1 c ) 0.5 L
where Q is the annual observed river flow (mm), P is the average annual sum of precipitation (mm), T is the annual mean temperature (°C), L is the regression coefficient related to T, and c is the calibration indicator. Formula (2) is valid only if Formula (4) is satisfied.
Correct model validation underlies the adequate selection of the calibration index (c) separately for each gauging station, according to Formula (5) [72]:
c = L 1 Q P 2 P 2 L 2 ,
The calibration factor c computed for the retrospective period from 1971 to 2021 for all analyzed gauging stations featured large discrepancies (Table 4), which reflected the variation in catchment factors in the longitudinal profile shaping the river flow. We modified the Turc model and proposed that the calibration factor should be dependent on the correlation between the precipitation factor (P) and the c factor, calculated according to Formula (5) for the past 30 years (Table 4). A new calibration factor c′ was introduced, which was characterized by a considerably lower discrepancy level, to calculate the annual simulated river flow (QS) (mm) for the period from 2020 to 2050.

3. Results

3.1. Reference Meteorological Conditions

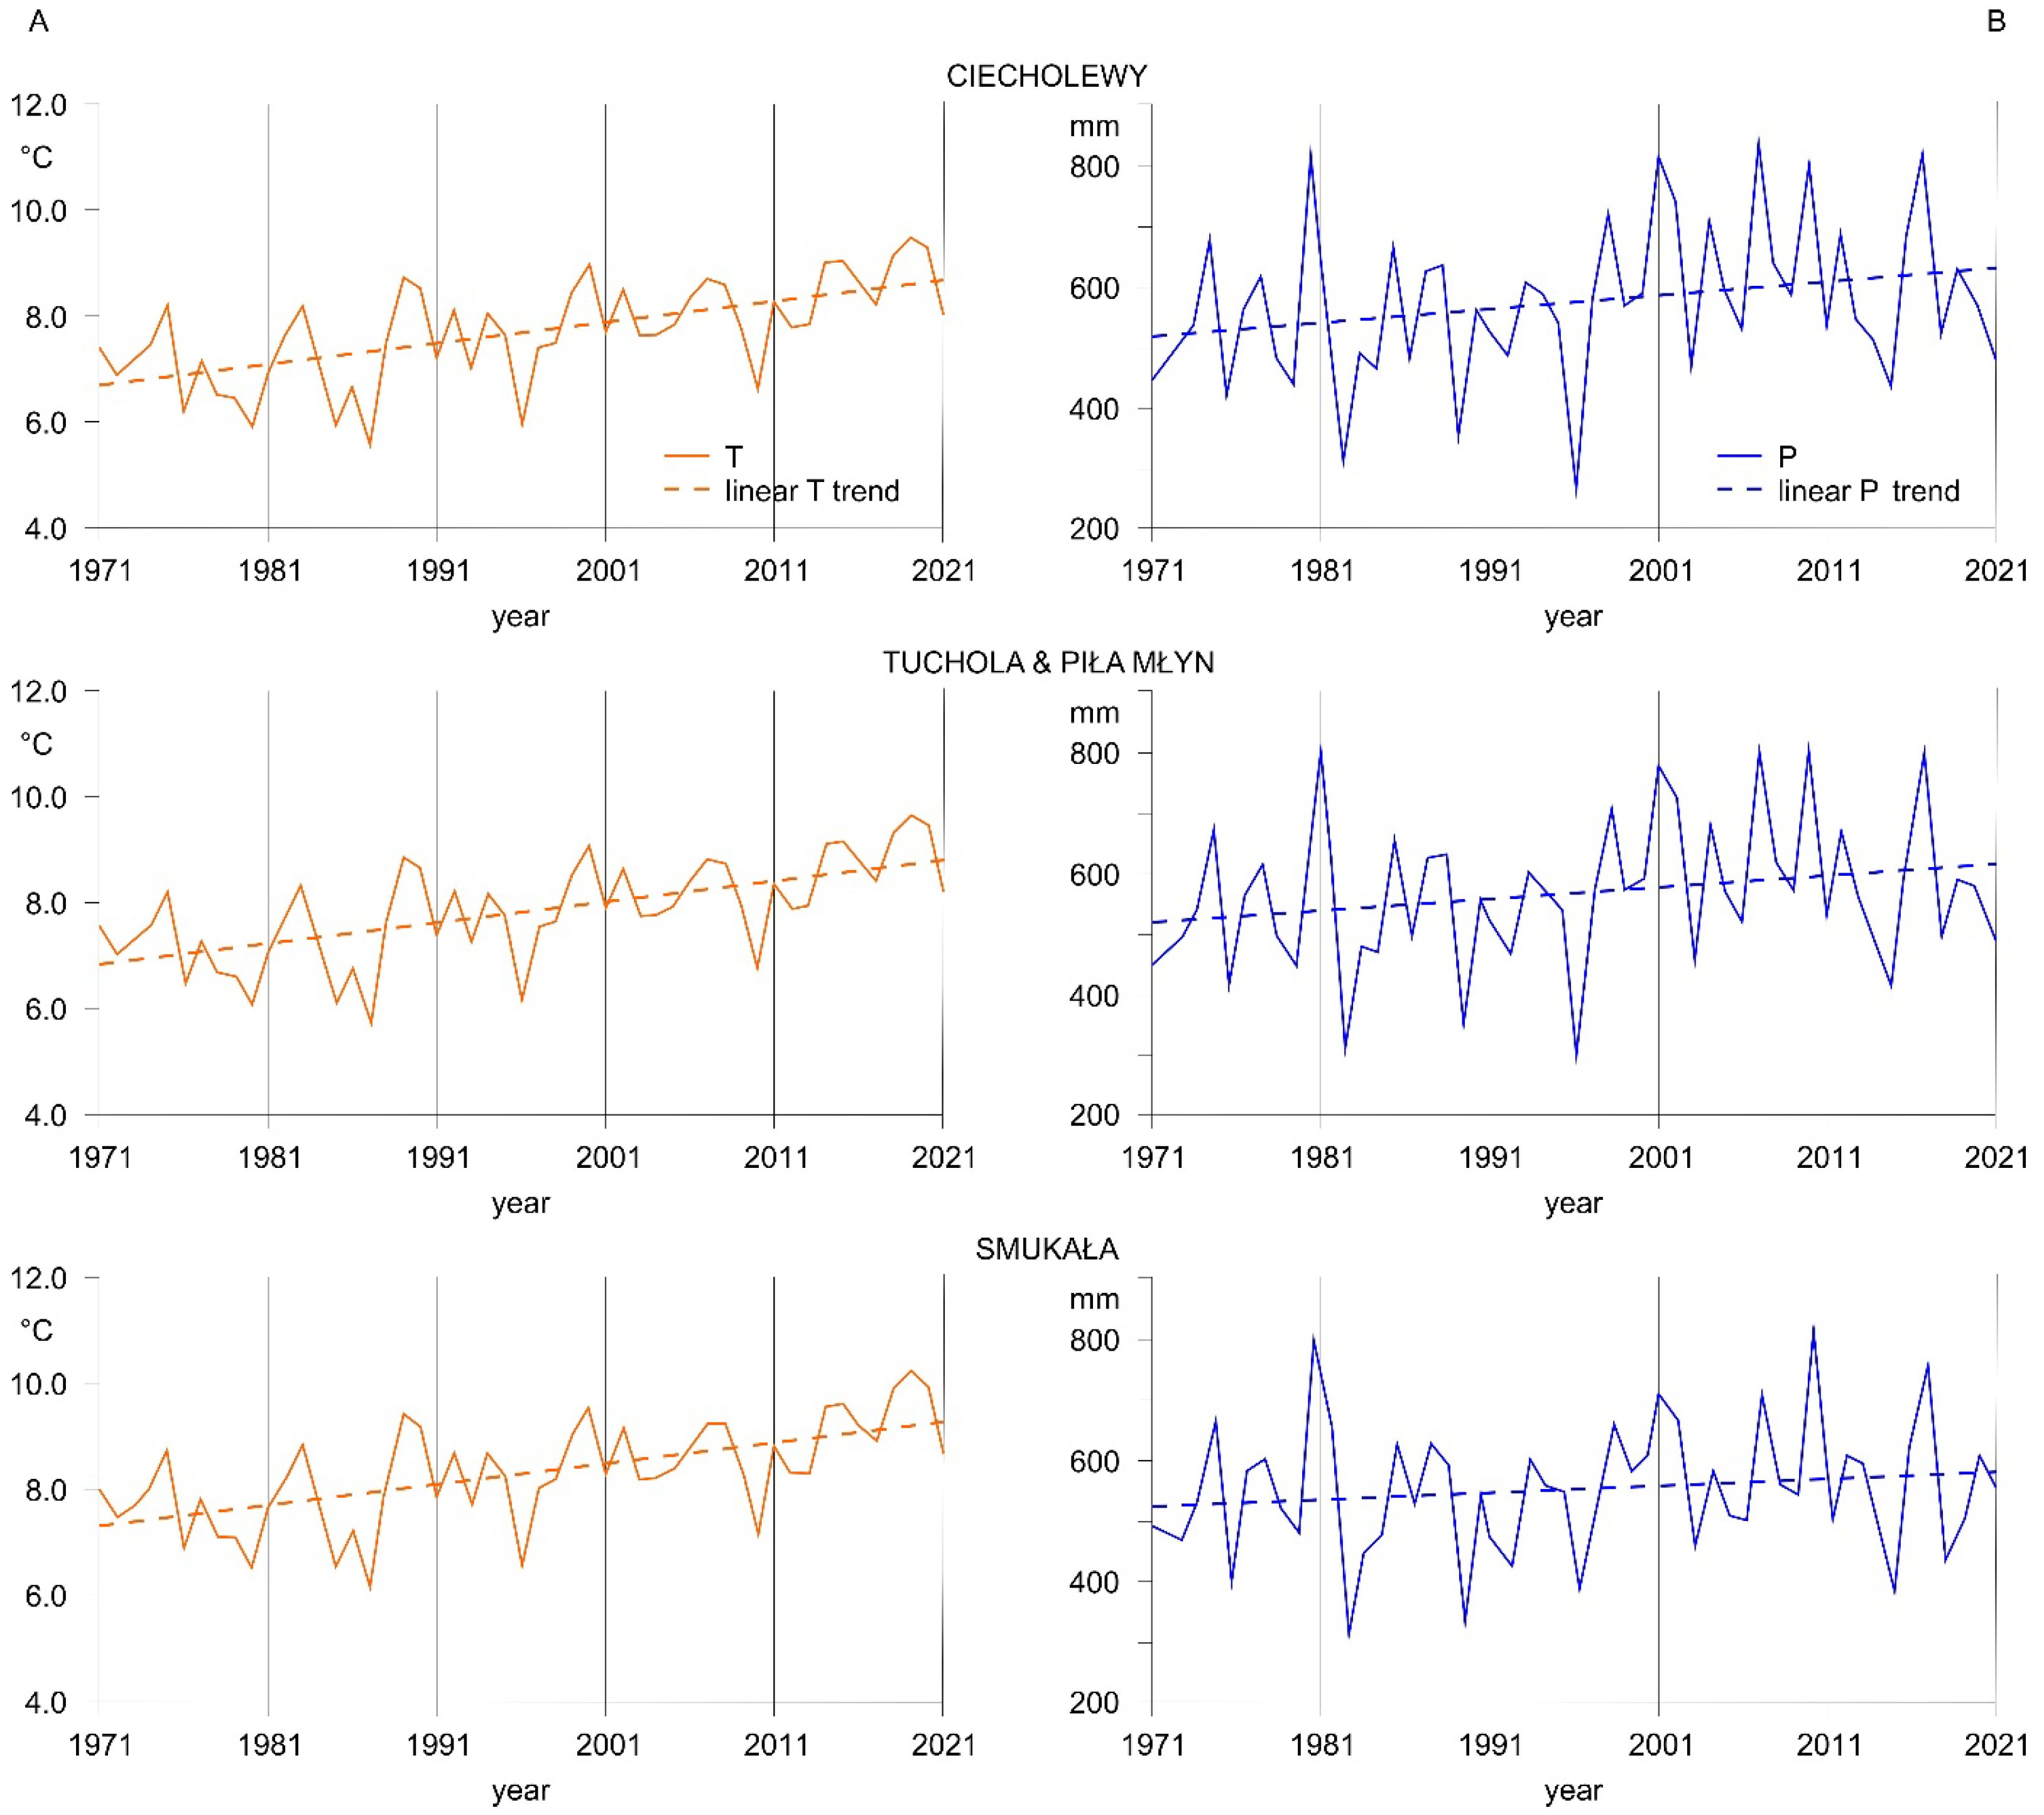
The observed multi-annual changes in the mean annual temperature for the analyzed sites were similar, with a tendency to increase towards the south. From 1971 to 2010, the average annual air temperature value ranged from 5.6 °C to 9.5 °C, with random variation (Figure 3A). From 2010, an explicit upward trend of temperature can be observed, reaching maxima ranging from 9.5 °C in the northern part of the Brda River catchment (Ciecholewy) to 10.2 °C in the south (Smukała). Looking at the entire period from 1971 to 2021, a statistically significant upward T trend was visible for all analyzed sites (Figure 3A).
The distribution of annual precipitation from 1971 to 2021 indicates relatively small differences between sites, with a downward trend continuing to the south. The examined period featured lower precipitation levels in the late 1980s, early 1990s, and the end of the second decade of the 21st century. The analyzed period shows a statistically insignificant upward trend for all surveyed stations (Figure 3B).

3.2. Assessment of Long-Term River Flow Oscillation and Trends

Analysis of the long-term mean annual variability of river flow in the Brda River catchment showed that all gauging stations exhibited rising and falling trends, though they varied in terms of number, duration, and sequence.
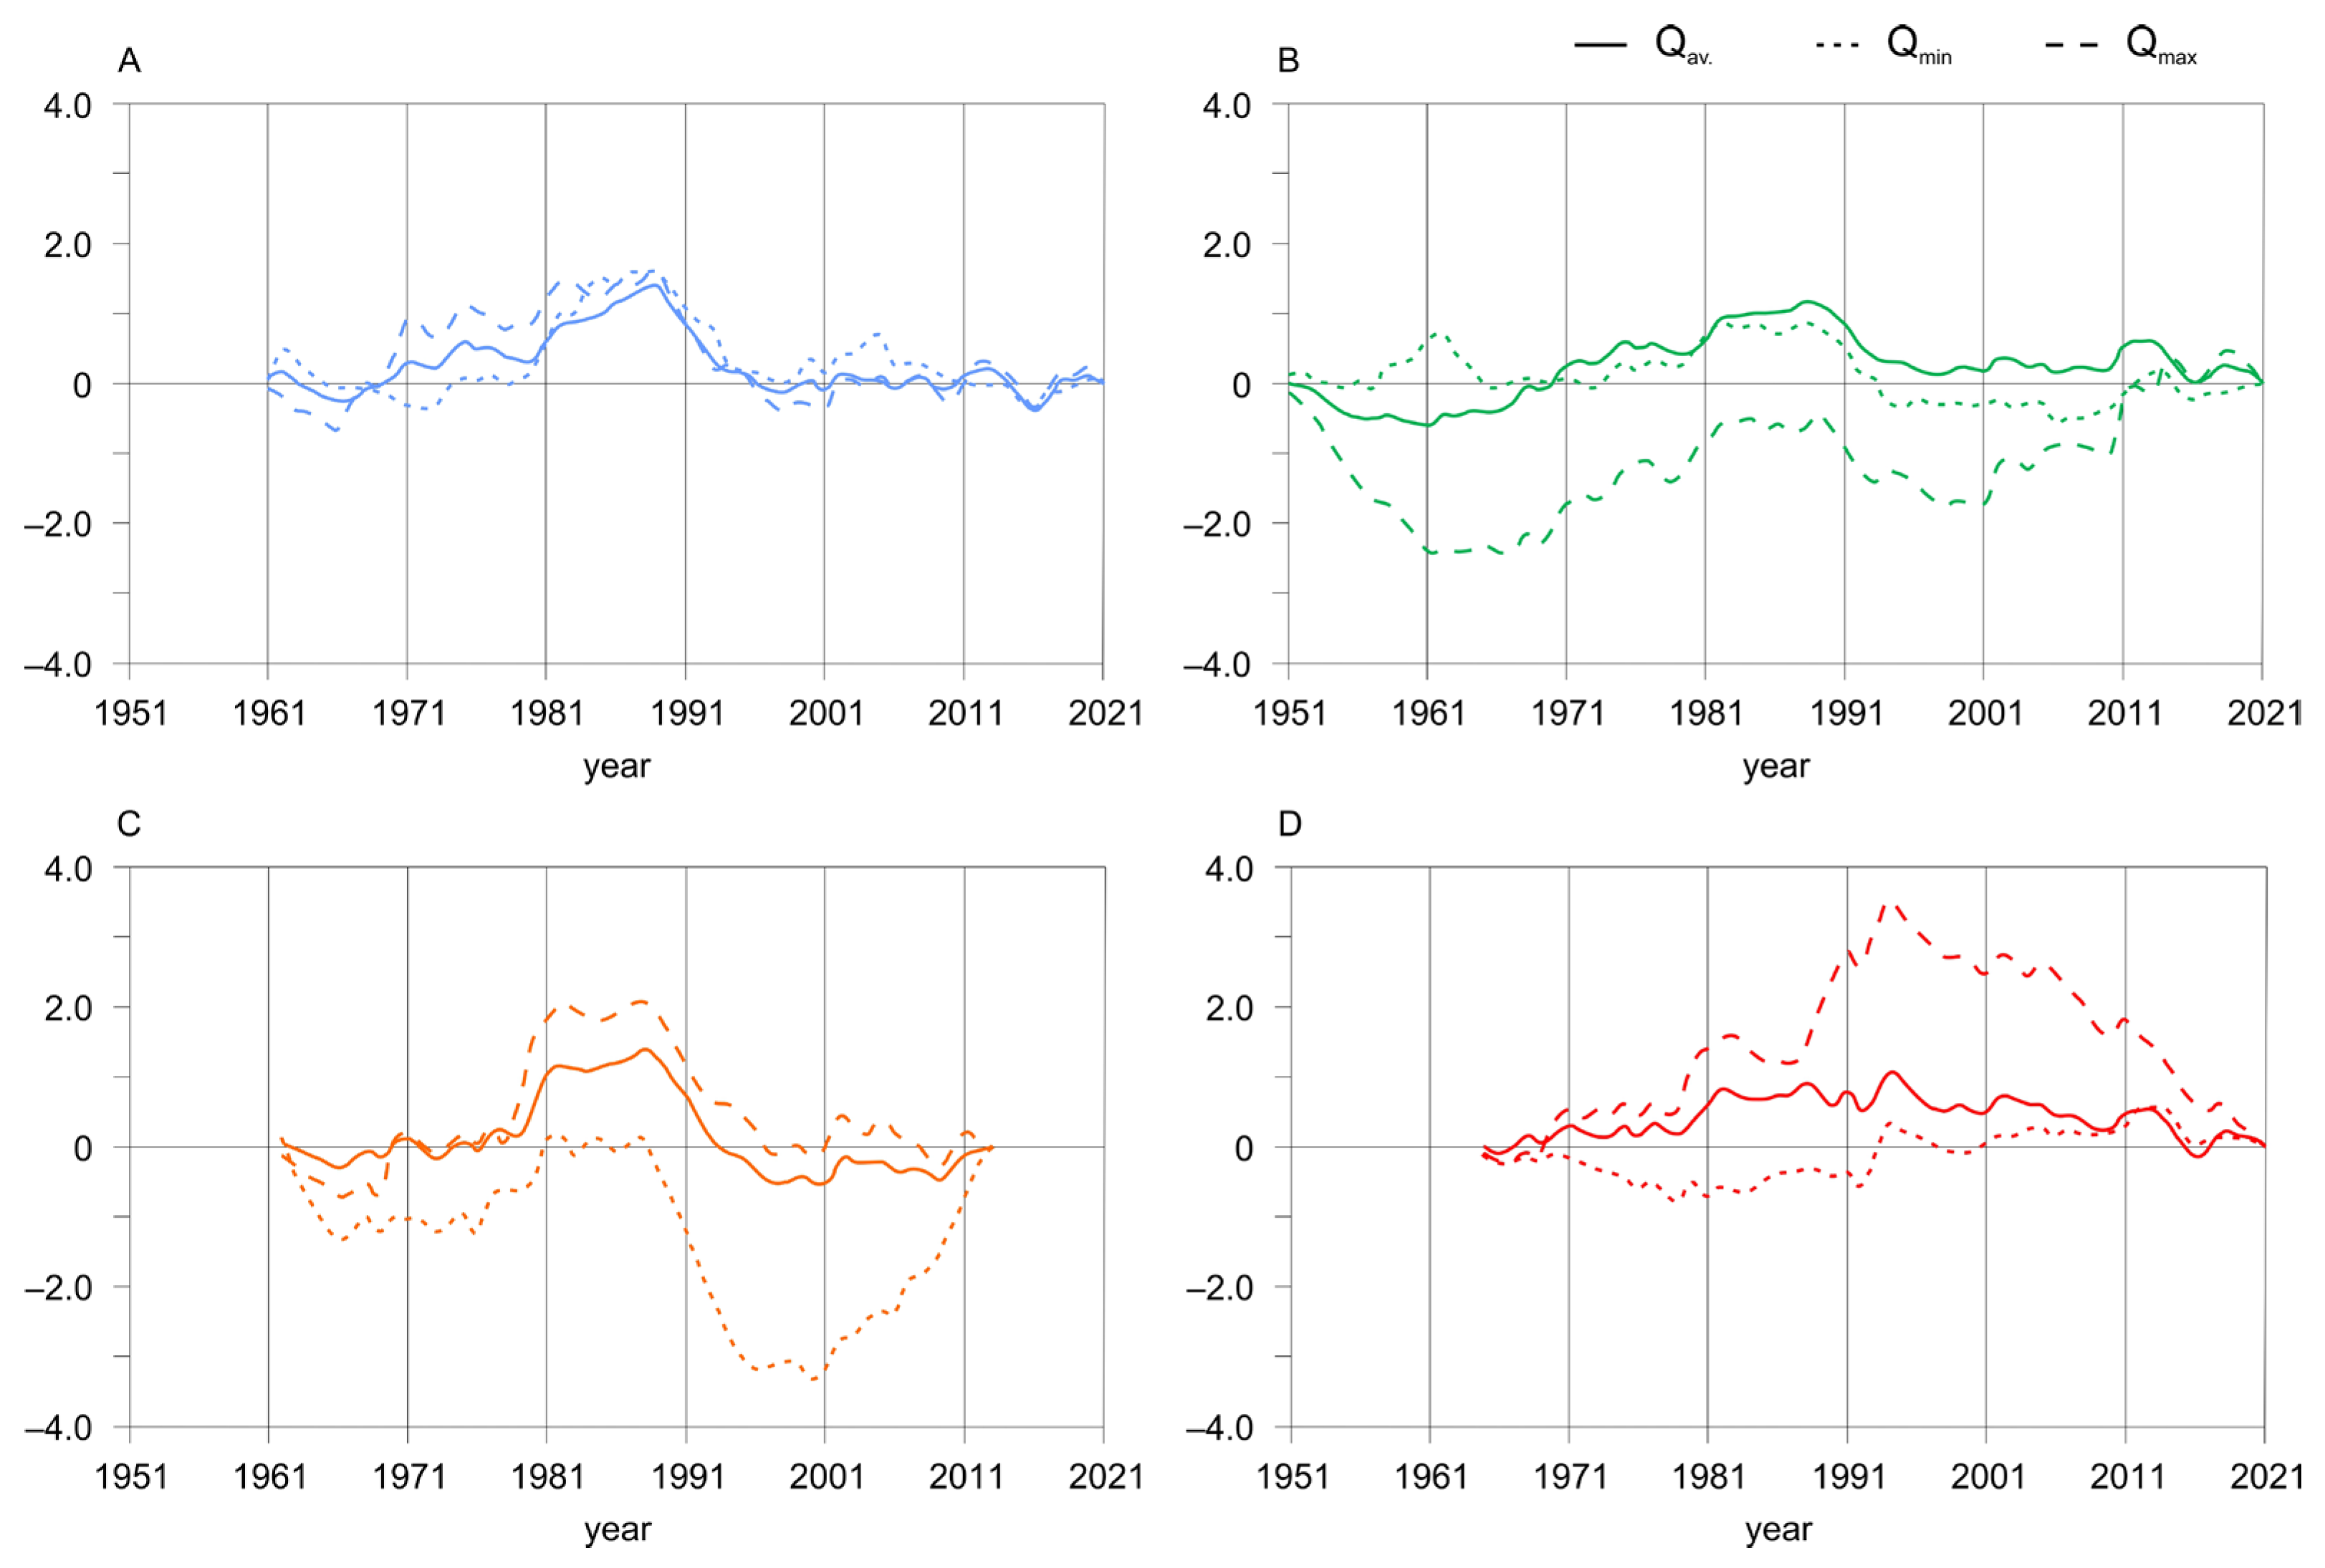
From 2021, two complete water flow oscillations were observed at the gauging stations in Ciecholewy and Tuchola, and a third water flow oscillation commenced in 2013 (Figure 4A,B). For the gauging station in Ciecholewy, the ki curves for all analyzed discharge characteristics (Qav, Qmax, and Qmin) appear similar, which testifies to discharge uniformity at that site. In the case of the gauging station in Tuchola, we saw an explicit deviation of the ki curve for Qmax, which may be associated with the presence of the Mylof dam affecting the maximum river flow, and points to a high-capacity potential to store water in the middle section of the Brda River catchment (Figure 4B).
The ki curves for Qav and Qmax for the Piła Młyn gauging station (Figure 4C) correspond to the two sites located above it—Ciecholewy and Tuchola (Figure 4A,B). However, the duration of the second river flow oscillation covers the entire analyzed period (until 2021). In contrast, for the Qmin curve, a considerable decrease in value was noted, which can be attributed to the long-term water deficit of this section of the Brda River catchment (Figure 4C).
The ki curve of the Smukała gauging station, on other hand, differs from the previously mentioned curves. The sequence of the increasing trends of the river discharge changed, i.e., the upward trend of the first discharge oscillation began only with the commissioning into operation of the LBC, whereas during the second flow oscillation (since 1994), we have so far only observed a downward trend of the discharge. In addition, the deviation in the ki curve for Qmax implies that the cascade has a high-capacity potential to store water (Figure 4D).
It should be highlighted that the first complete river flow oscillation for the analyzed gauging stations did not start upon the commencement of discharge monitoring (see Table 5), but earlier. However, considering that no previous hydrological monitoring data are available for these stations, and considering their sufficient overall duration, these years can be regarded as the beginning of a complete flow oscillation.
When analyzing the period until 2021, attention should be paid to the trend shared by almost all the analyzed gauging stations, namely a reduction in duration in the river flow oscillations (Table 5), except at the LBC closing gauging station (Smukała), where water management operations disturb its duration.
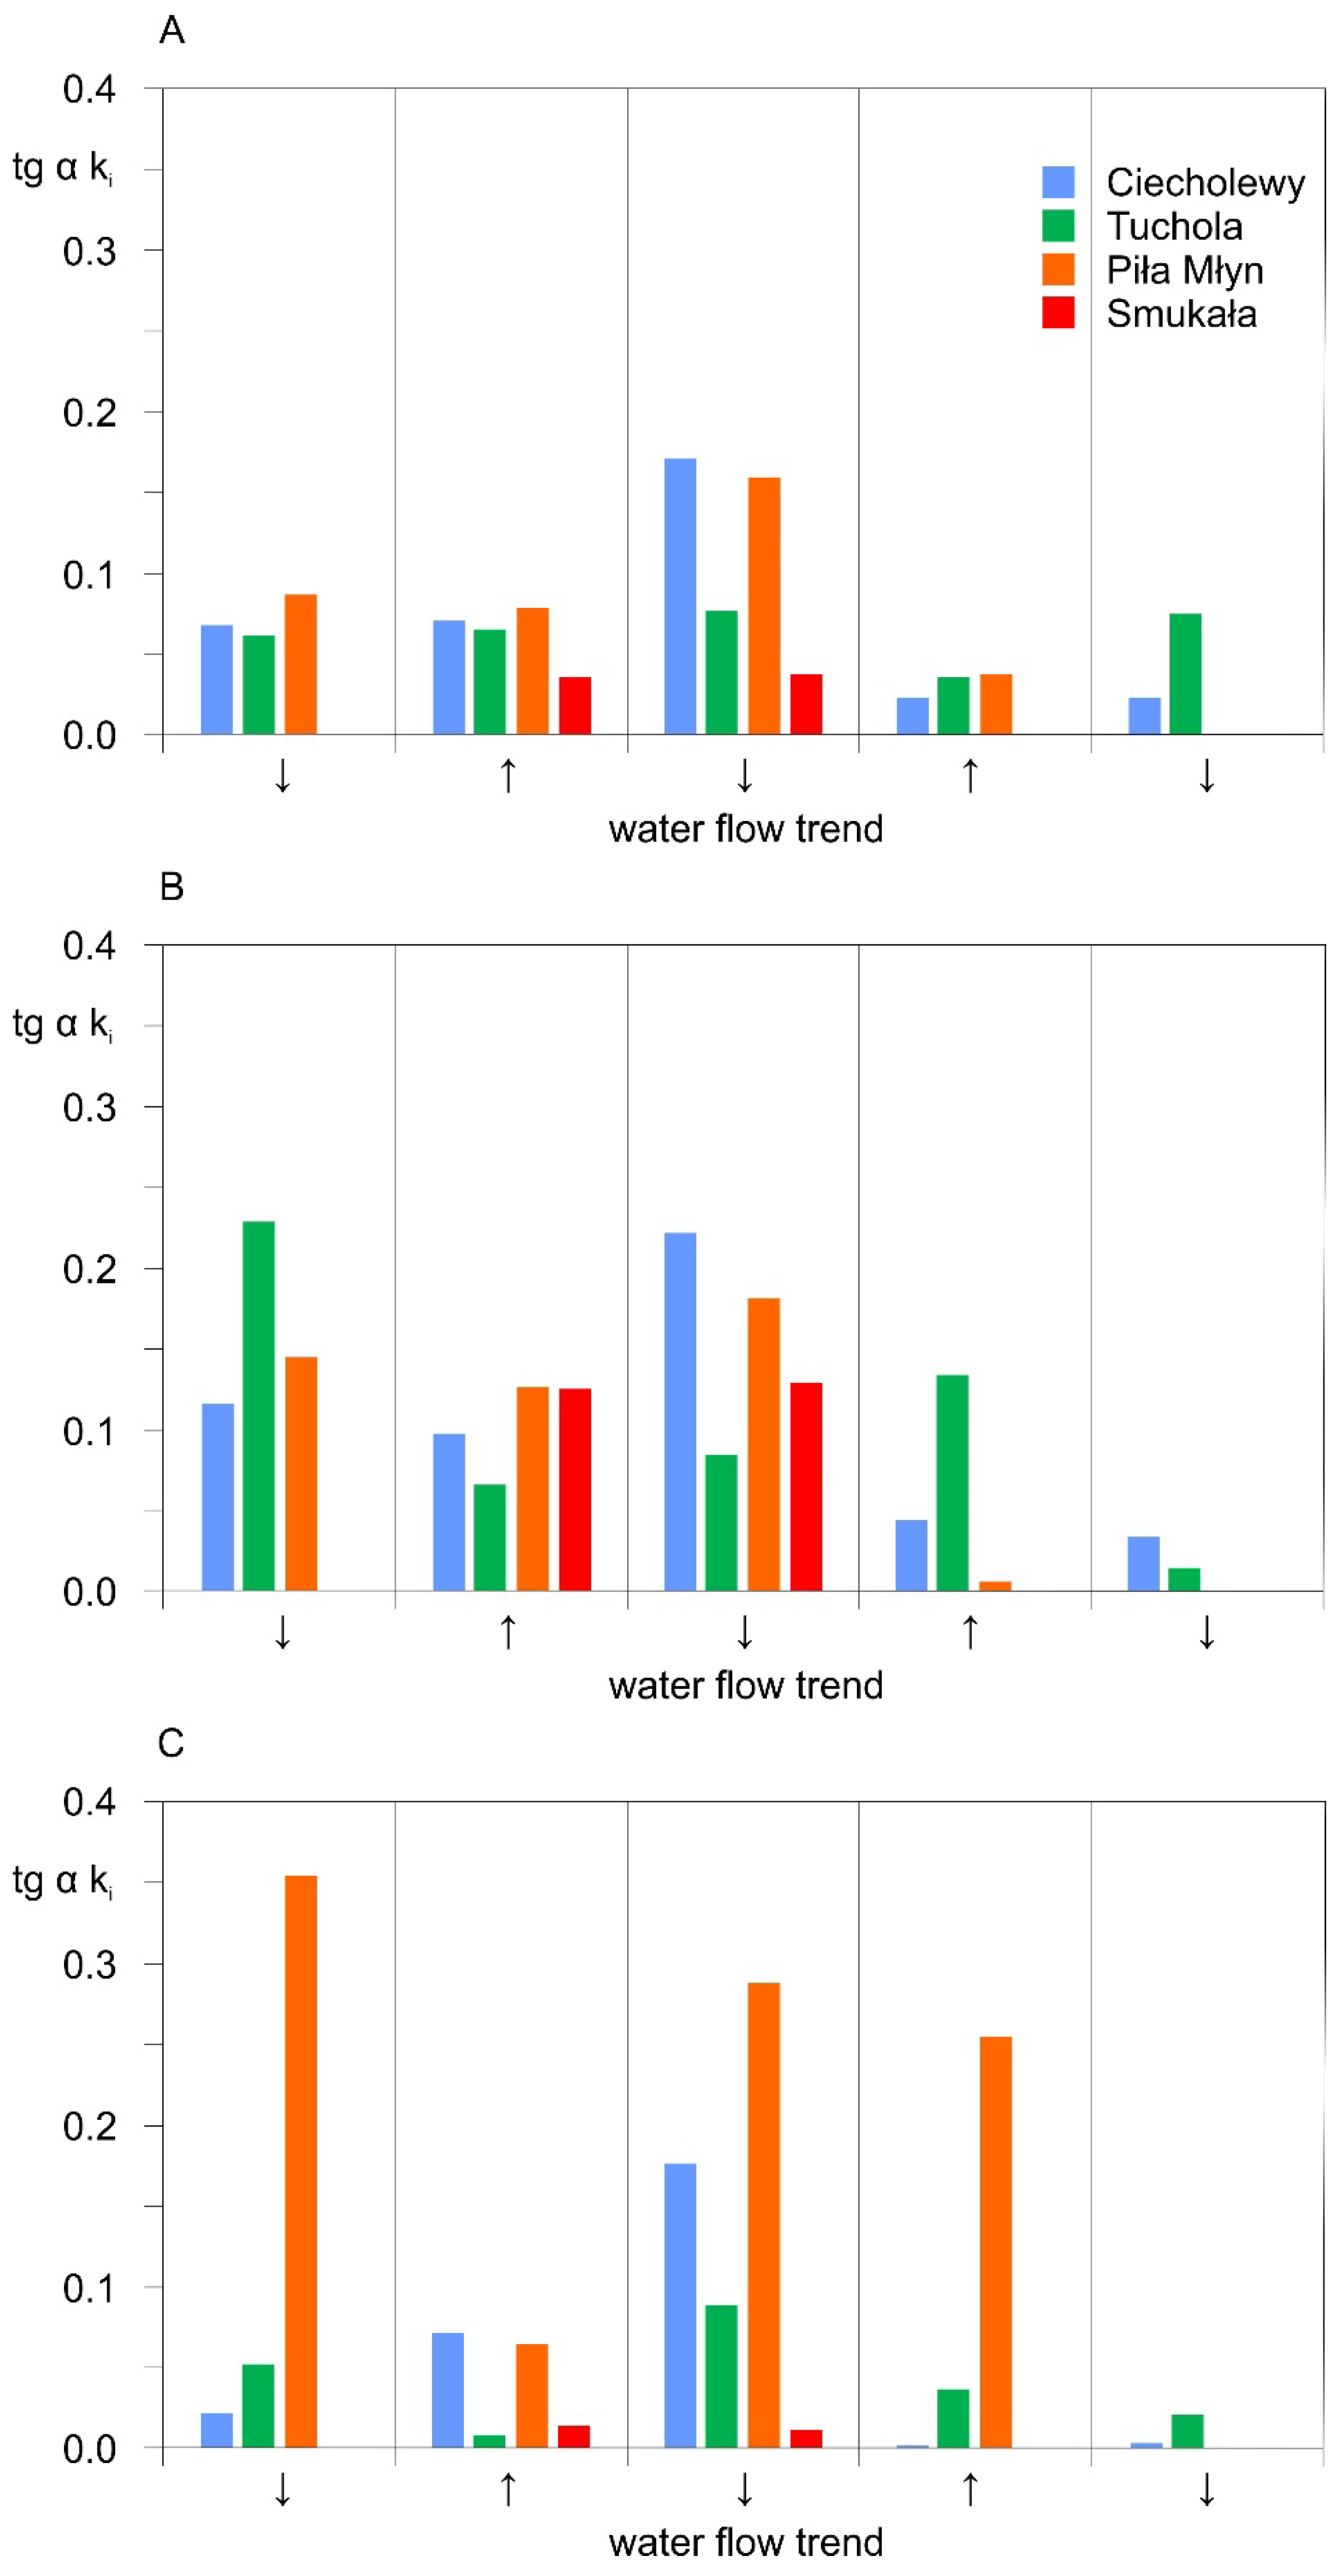
The intensity of the downward and upward trends in a river flow oscillation, recorded according to the deviation of angle α of the ki curve, strongly varies in space and time (Figure 5). In each complete river flow oscillation, the downward discharge trend is more dynamic, which leads to an increase in the catchment-scale water deficit that exceeds the capacity for replenishment. This was particularly evident for the gauging station Piła Młyn in terms of Qmin. At the same time, it should be noted that the variation in river flow trends for the Smukała gauging station located below the LBC is relatively small and similar to that of the Ciecholewy gauging station in the upper part of the Brda River catchment (Figure 5).

3.3. Observed and Simulated River Flow

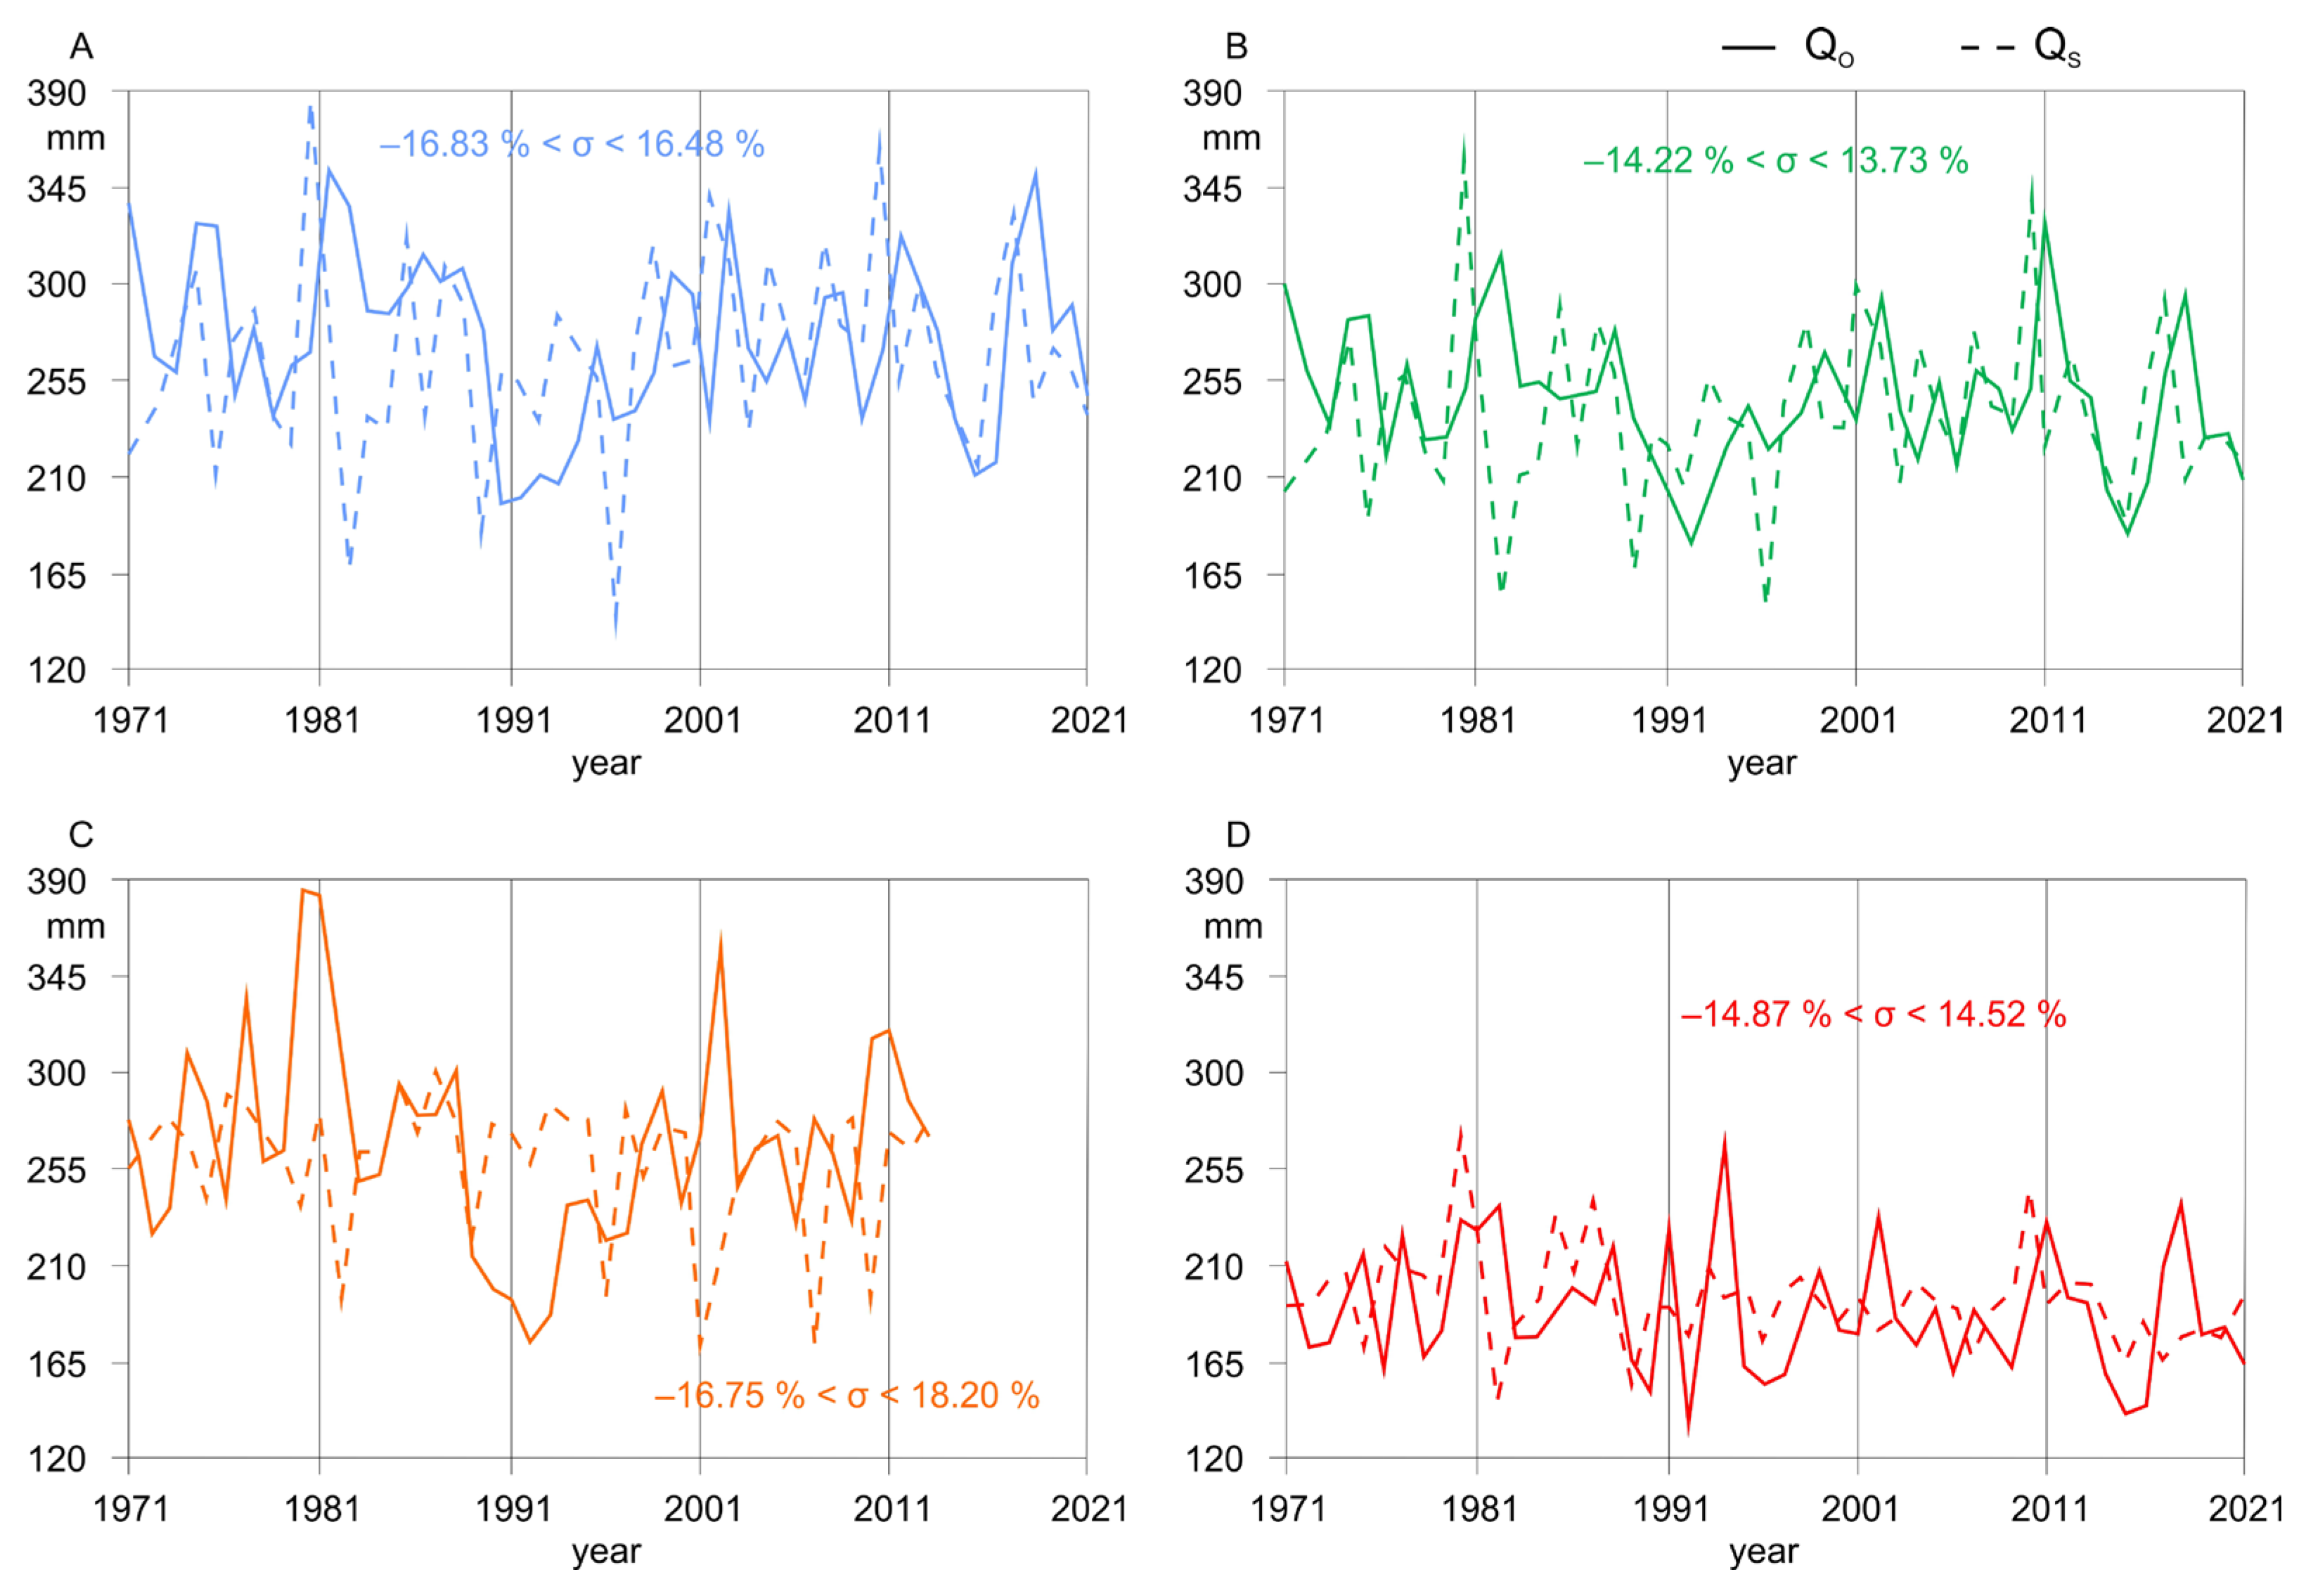
In general, the dynamics of the observed annual river flow (QO) for the analyzed gauging stations in the Brda River catchment from 1971 to 2021 showed a downward trend (Figure 6), which suggests an increasing water deficit in the catchment. In addition, a decrease in the absolute values of QO was recognized along the longitudinal profile of the Brda River. The amplitude of the QO values was greatest (212 mm) for the gauging station in the backwater zone of the Koronowo Reservoir (Piła Młyn), and for gauging stations in the upper reaches of the Brda River catchment, it ranged from 155 mm for Ciecholewy to 147 mm for Tuchola. For the gauging station below the LBC (Smukała station), the QO was the lowest, amounting to 127 mm.
The simulated annual river flow (QS), calculated using the modified Turc model, generally corresponds to the QO (Figure 6). The curve variances occurred in short periods for both the Ciecholewy gauging station (which can be attributed to fluctuations in the precipitation at the beginning of the 1990s) and for the Piła Młyn gauging station (attributable to the water management of the Koronowo Reservoir). The calculated mean deviation (σ) based on the QO and QS for the reference period of 1971 to 2021 ranges from 13.73% for the Tuchola gauging station to 18.20% for the Piła Młyn gauging station (Figure 6). The resulting values imply that the modified Turc model works well, considering that the modified calibration factor c′ is dependent on the precipitation factor in the catchment area.
Based on the modified Turc model, we were able to determine long-term climate-change impacts on the annual river flow in the Brda River catchment. A variable number of successive river flow oscillations until 2050 was established depending on the analyzed gauging station (Table 5). Another complete river flow oscillation, due to end in 2050 according to the forecast, is anticipated for the Ciecholewy gauging station. For the other two gauging stations (Tuchola and Piła Młyn), two more river flow oscillations were forecast, while the second river flow oscillation was incomplete and consisted of only a decreasing annual flow trend. The last gauging station, Smukała, has a simulated annual river flow that differs from the other sites analyzed (Ciecholewy, Tuchola, and Piła Młyn). Here, after the observed downward trend that continued until 2021, the forecast showed it continuing as one long-lasting downward river flow oscillation until 2034, followed by a short upward trend until 2040. The next (and last) 10 years of the forecast period show an incomplete downward trend in river flow.
In summary, using the QO and QS, different numbers of flow oscillation were identified for the analyzed gauging stations (Table 5): three for Ciecholewy and Smukała and two for Tuchola and Piła Młyn.
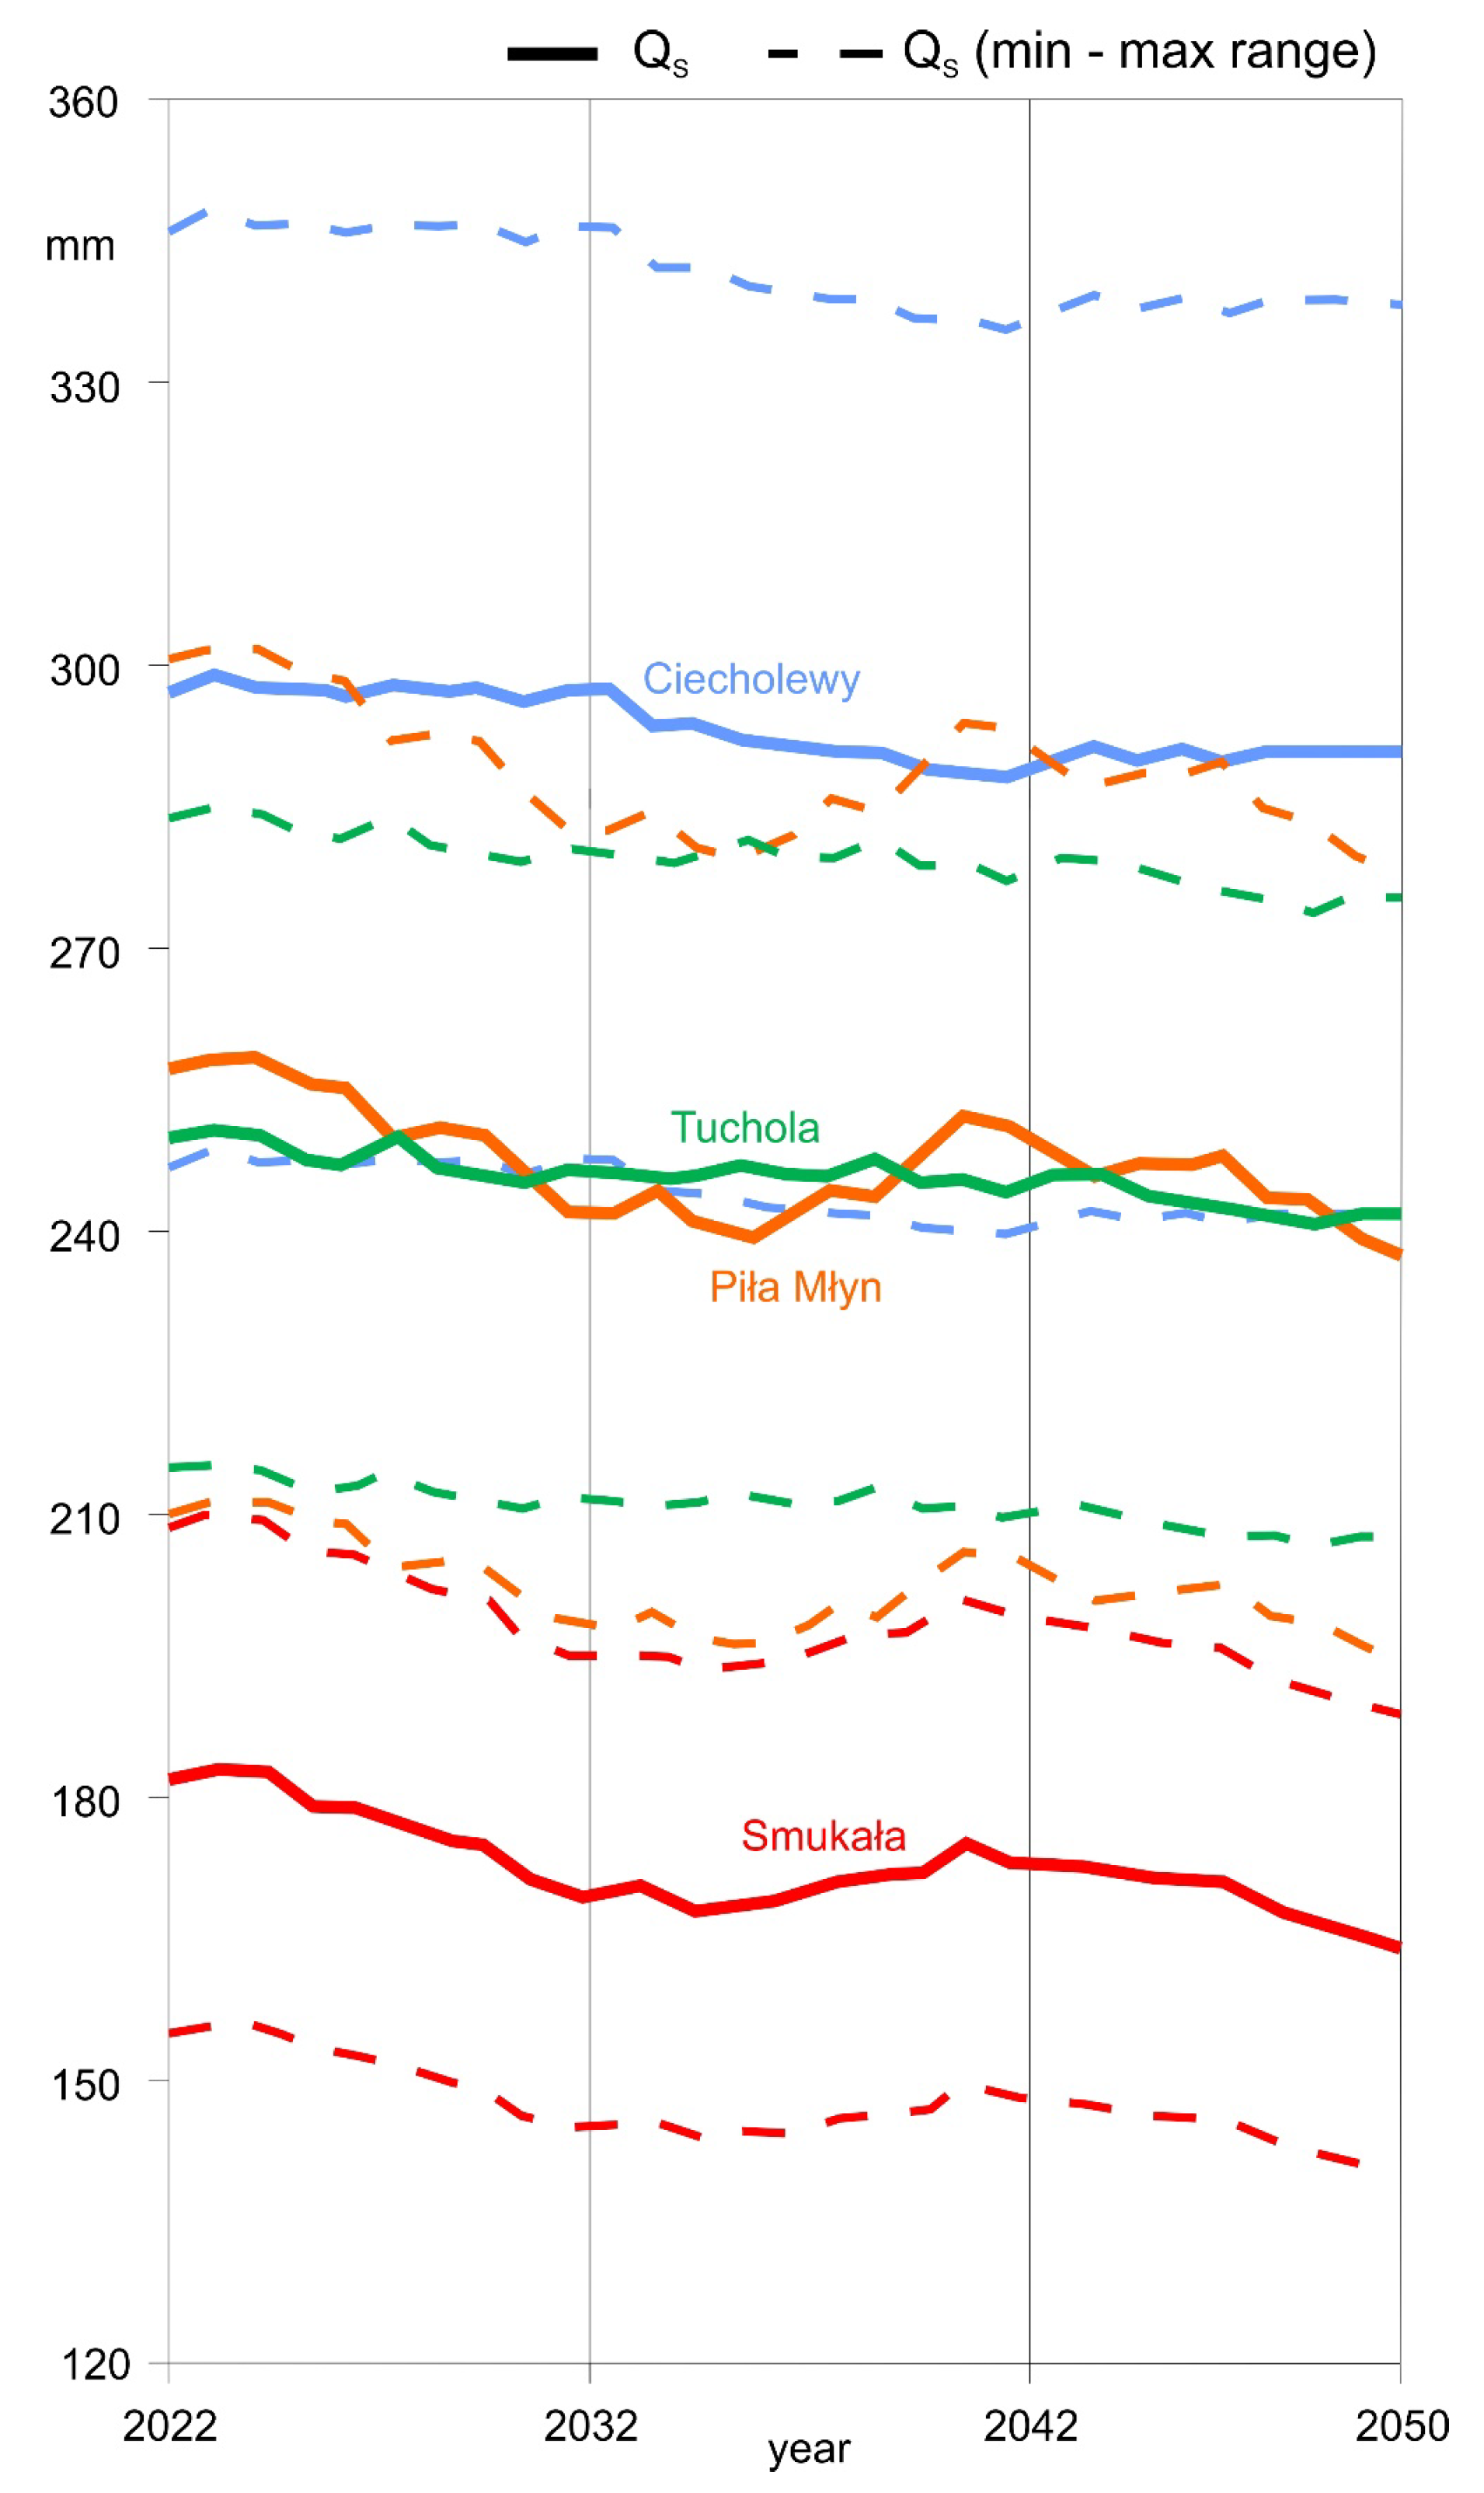
For the first projected river flow oscillation, all the analyzed gauging stations showed a reduction in QS (relative to 2022), ranging from 1.77% (Tuchola) to 7.48% (Smukała) (Figure 7). Next, the results of the forecast indicate a short-term increase in the QS at the end of the river flow oscillation, which is associated with the projected increase in annual precipitation according to RCP4.5, and which is the most explicit for stations in the lower reaches of the catchment (Piła Młyn and Smukała) (Figure 7). In the second projected river flow oscillation, there was a small increase in the QS for the Ciecholewy gauging station (0.79%), and for the other stations, the water deficit increased, and the QS decreased within a range from 0.58% (Piła Młyn) to 2.21% (Smukała).

4. Discussion

4.1. Identification of Factors Determining River Flow Crisis for a Cascade-Dammed River

The observed climate change resulting from direct and indirect human activities contributes to modifying the water regime in cascade-dammed river catchments. The observed upward trends in the mean annual temperature (Figure 3A) and annual precipitation (Figure 3B) are indisputable evidence of climate change occurring in the Brda River catchment. These results are consistent with trends observed on a regional scale [73,74], as well as on a global scale [75]. Due to the lack of previous comprehensive studies on the variability of water runoff in the entire Brda River catchment, our study is unique. Previous studies on the response of low flows of Polish rivers to climate change [76], and maximum river runoff in Poland under climate warming conditions [77], showed partially that the river flow of the Brda River catchment has decreased. For the studied Brda River catchment, they showed a predominance of periods of discharge deficits (Figure 4), more pronounced amplitudes of the downward trends in river flow oscillations (Figure 5), and general downward trends in the QO and QS (Figure 6), which makes it unlikely that the water resources caused by climate change will be replenished. Temperature has a more significant effect on mid-latitude rivers than rainfall quantity does [78]. However, the precipitation factor (P) in the Brda River catchment is significant, which allows us to use this climatic factor in adapting the c coefficient (Formula (6), Table 4) to modify the Turc model [72]. In addition, changes in the amount of precipitation can lead to floods or droughts [79], which have been observed in the past at the estuary of the Brda River catchment [80]. Only the Ciecholewy gauging station showed a high uniformity in the assessment of river flow changes (Figure 4A). This uniformity is due to the natural characteristics of the catchment: the predominance of forest cover [39], the geological structure of the catchment being dominated by postglacial formations [61], and the lake–river system [81]. Here, the important role of environmental factors in shaping the discharge should be mentioned.
It is a common finding that reservoirs change water regimes [43,82,83,84], and in extreme cases, a new sub-basin is formed with an operating system different from that of the main river [53]. The nature of the operating regime of the dam is exceptionally significant for the development of hydrological conditions in cascade-dammed rivers. The highest alteration occurs in the hydropeaking regime, which not only leads to discharge fluctuations, but also alters the relief of the river channel [52]. However, even the run-of-river regime, which complies with the environmental requirements of the Water Framework Directive [85], has an impact. In the conducted study, this alteration was observed for the gauging station below the Mylof Dam, and below the LBC. In the first case, deviations in ki curves for the Qmin assumed a negative value (Figure 4C). This proves the impact of the small water storage capacity of the middle reaches of the Brda River catchment. In the second case, the ki curve for the Qmax assumed positive values (Figure 4D), and it proved a significant increase in the water storage capacity of the LBC. Simultaneously, the lowest amplitude of the QO (Figure 6) was recorded for the Smukała gauging station, which also points to the compensatory role of reservoirs in shaping the discharge, as corroborated by Lopez-Moreno et al. [86].
The Brda River catchment is a typical lowland catchment in which groundwater supply predominates [63], resulting from the presence of glacial sediments with good infiltration rates [61]. Hence, the ki curve deviation recorded at the Piła Młyn and Smukała gauging stations (Figure 4C,D) implies the important roles of Mylof and LBC, respectively, in water regime development. The most relevant evidence of river flow crisis due to human activity is the varying number of river flow oscillations during the analysis period (Table 5). This is an unusual situation that indicates a disturbance of river flow. The studies showed the reducing importance of the climatic factors (mainly precipitation) in shaping river flow, in favor of the operation of dams.

4.2. Sustainable Management Model for Cascade-Dammed Rivers Facing Climate Challenges

Our research has shown that climate change in the Brda River catchment is aggravating the river flow crisis, which will affect the ability to use water resources in the near future. According to the global indicator framework based on the Agenda for Sustainable Development [8], adaptation to climate change, including extreme weather, drought, flooding, and other disasters, necessitates the proposal of a sustainable management model for cascade-dammed rivers that considers climate challenges.
The reduction in the QS calculated according to the modified Turc model for RCP4.5 (Figure 7) was projected for all gauging stations in the Brda River catchment, indicating a reduced possibility to use Brda’s water resources both for hydropower generation and for supplying the population with drinking water and water for agriculture. Nowadays, 7% of the world’s population live in water stress areas [87], and around three-quarters of annual renewable freshwater resources used by humans are consumed by agricultural irrigation [88]. Ensuring the sufficient quantity and quality of water resources for humans is an essential challenge for future generations [89].
Two scenarios were proposed for a cascade-dammed river in response to a projected river flow crisis. The first scenario was for an inhibited crisis, and the second was for a deteriorated crisis.
The river flow crisis can be mitigated by acting at various levels on a catchment scale: from microscale actions increasing retention through the construction of small ponds [90], to macroscale actions, including projects provided for river basin management plans [91], drought prevention plans [92], and flood risk management plans [93], complying with the environmental requirements of the Water Framework Directive [85] in terms of climate change adaptation. The catalog of feasible measures includes the protection and enhancement of forest retention [94], the protection and enhancement of retention in agricultural areas [95], the retention and management of rainwater and meltwater in urbanized areas [96], the protection of existing aquatic and water-dependent ecosystems [97], the reconstruction of water-damming structures to meet environmentally sustainable objectives and social–ecological trends [51], and the restoration of natural hydromorphological processes in the riverbed [98].
The key to sustainable hydropower concerns the generation of electricity from water resources while achieving a balance between the water storage capacities of the catchment at a long-term scale (hydrological factor), maximum hydropower efficiency (economical factor), and the environmentally sustainable use (ecological factor) of water resources. The run-of-river regime, complying with the Water Framework Directive [85] and operating within the LBC [55], appears to be the most appropriate operation system for HPPs. However, in view of the climate crisis, institutions and stakeholders managing hydrotechnical infrastructure should consider the long-term trend of river flow (Figure 4) and a successfully implemented forecast of QS (Figure 7) using the modified Turc model [72].
Human factors play an essential role in the climate crisis, as humans are the main source of the problem, and their behaviors determine the future. The APA report [99] indicates that climate change will affect the key elements of human civilization security and infrastructure, including food production, water access, and hydropower. Therefore, conscious education, management, and information regarding the river flow crisis have a decisive role in terms of the proper future management of water resources.
Conversely, the second scenario considers an increased river flow crisis associated with an increase in urbanized areas [37], the deforestation of the catchment, drying of peatland [100], lack of sustainable water management of HPPs and, in extreme cases, incorrect dam removal [51], leading to limitations in the water storage capacity of the catchment, where the reservoir itself loses its capacity and the water table is lowered, which contributes to increasing the river flow crisis in the catchment.

5. Conclusions

This study evaluates the impact of climatic conditions on the sensitivity of the long-term annual river flow in the cascade-dammed Brda River. In particular, climate change and human activity have affected the long-term river flow in the cascade-dammed river. The river flow crisis in the catchment analyzed was mainly determined by natural conditions. This was demonstrated by the ability to successfully link river flows (QO) with the precipitation factor (P) using the modified Turc method. Considering the RCP4.5 climate scenario assuming a general upward trend in both the annual mean temperature values and annual precipitation, river flow forecasts were prepared for the Brda River catchment. The results of the model explicitly show a reduction in the QS by 2050 of up to 10%, suggesting a river flow crisis.
The study also revealed the significant importance of human activity in transforming the water regime into a cascade-dammed river, reflected primarily in river flow oscillation characteristics. Specific variations in the number—two or three—a shortened duration, and, in some cases, the sequence of river flow oscillations imply a strong modification in the water regime due to the operation of HPPs. The run-of-river operation system of HPPs has proven to be more favorable for sustainable water resource development, considering the deficiencies due to the river flow crisis. The results of this study contain important information that can be used to sustainably manage water resources in cascade-dammed catchments considering climate challenges.
The main innovation of this study is its integrated assessment of long-term changes in cascade-dammed river flow that enables, with the greatest possible precision, forecasts of hydrological conditions based on commonly used climate models. Considering the projected river flow crisis, cascade-dammed rivers should be managed in a way that will make it possible to stop the environmental degradation of the fluvial system, enabling the sustainable use of water resources according to societal and economic needs.

Author Contributions

Conceptualization, D.S. and O.O.; methodology, D.S., A.B., M.D.A. and O.O.; software, D.S. and E.Z.Ł.; validation, O.O.; formal analysis, D.S., A.B., M.D.A. and O.O.; investigation, D.S., E.Z.Ł., A.B., M.D.A. and O.O.; resources, E.Z.Ł.; data curation, E.Z.Ł.; writing—original draft preparation, D.S. and A.B.; writing—review and editing, M.D.A. and O.O.; visualization, D.S.; supervision, A.B. and M.D.A.; project administration, D.S. and O.O.; funding acquisition, D.S. and O.O. All authors have read and agreed to the published version of the manuscript.

Funding

This research was funded by Kazimierz University in Bydgoszcz, grant number BS/2016/N2.

Data Availability Statement

The data presented in this study are available upon request from the corresponding author.

Acknowledgments

Thank you to Tim Bombley for help with the English editing of the manuscript.

Conflicts of Interest

The authors declare no conflicts of interest.

References

  1. Meresa, H.K.; Gatachew, M.T. Climate change impact on river flow extremes in the Upper Blue Nile River basin. J. Water Clim. Change 2018, 10, 759–781. [Google Scholar] [CrossRef]
  2. Roudier, P.; Jafet Andersson, C.M.; Donnelly, C.; Feyen, L.; Wouter Greuell, W.; Ludwig, F. Projections of future floods and hydrological droughts in Europe under a +2 °C global warming. Clim. Change 2016, 135, 341–355. [Google Scholar] [CrossRef]
  3. Madsen, H.; Lawrence, D.; Lang, M.; Martinkov, M.; Kjeldsen, T.R. Review of trend analysis and climate change projections of extreme precipitation and floods in Europe. J. Hydrol. 2014, 519, 3634–3650. [Google Scholar] [CrossRef]
  4. Kwok, R.; Untersteiner, N. The thinning of Arctic sea ice. Phys. Today 2011, 64, 36–41. [Google Scholar] [CrossRef]
  5. Shou, K.J.; Lin, J.F. Evaluation of the extreme rainfall predictions and their impact on landslide susceptibility in a sub-catchment scale. Eng. Geol. 2020, 265, 105434. [Google Scholar] [CrossRef]
  6. Prăvălie, R.; Nita, I.A.; Patriche, C.; Niculiță, M.; Birsan, M.V.; Roșca, B.; Bandoc, G. Global changes in soil organic carbon and implications for land degradation neutrality and climate stability. Environ. Res. 2021, 201, 111580. [Google Scholar] [CrossRef]
  7. Intergovernmental Panel on Climate Change (IPCC). Climate Change 2021: The Physical Science Basis. Contribution of Working Group I to the Sixth Assessment Report of the Intergovernmental Panel on Climate Change; Masson-Delmotte, V., Zhai, P., Pirani, A., Connors, S.L., Péan, C., Berger, S., Caud, N., Chen, Y., Goldfarb, L., Gomis, M.I., et al., Eds.; Cambridge University Press: Cambridge, UK, 2001. [Google Scholar] [CrossRef]
  8. Agenda for Sustainable Development 2030, Transforming Our World, A/RES/70/1. Available online: https://www.un.org/en/development/desa/population/migration/generalassembly/docs/globalcompact/A_RES_70_1_E.pdf (accessed on 16 December 2023).
  9. Sillmann, J.; Aunan, K.; Emberson, L.; Büker, P.; Van Oort, B.; O’Neill, C.; Otero, N.; Pandey, D.; Briseboiset, A. Combined impacts of climate and air pollution on human health and agricultural productivity. Environ. Res. Lett. 2021, 16, 093004. [Google Scholar] [CrossRef]
  10. Bentivoglio, F.; Calizza, E.; Rossi, D.; Carlino, P.; Careddu, G.; Rossi, L.; Costantini, M.L. Site-scale isotopic variations along a river course help localize drainage basin influence on river food webs. Hydrobiologia 2015, 770, 257–272. [Google Scholar] [CrossRef]
  11. Han, Z.; Long, D.; Fang, Y.; Hou, A.; Hong, Y. Impacts of climate change and human activities on the flow regime of the dammed Lancang River in Southwest China. J. Hydrol. 2019, 570, 96–105. [Google Scholar] [CrossRef]
  12. Tomer, M.D.; Schilling, K.E. A simple approach to distinguish land-use and climate-change effects on watershed hydrology. J. Hydrol. 2009, 376, 24–33. [Google Scholar] [CrossRef]
  13. Kim, J.; Choi, J.; Choi, C.; Park, S. Impacts of changes in climate and land use/land cover under IPCC RCP scenarios on streamflow in the Hoeya River Basin, Korea. Sci. Total Environ. 2013, 452–453, 181–195. [Google Scholar] [CrossRef] [PubMed]
  14. Zaghloul, M.S.; Ghaderpour, E.; Dastour, H.; Farjad, B.; Gupta, A.; Eum, H.; Achari, G.; Hassan, Q.K. Long Term Trend Analysis of River Flow and Climate in Northern Canada. Hydrology 2022, 9, 197. [Google Scholar] [CrossRef]
  15. Wang, C.; Zhang, H. Trend and Variance of Continental Fresh Water Discharge over the Last Six Decades. Water 2020, 12, 3556. [Google Scholar] [CrossRef]
  16. Meresa, H.K. River flow characteristics and changes under the influence of varying climate conditions. Nat. Resour. Model. 2020, 33, e12242. [Google Scholar] [CrossRef]
  17. Yang, D.; Li, C.; Hu, H.; Lei, Z.; Yang, S.; Kusuda, T.; Koike, T.; Musiake, K. Analysis of water resources variability in the Yellow River of China during the last half century using historical data. Water Resour. Res. 2004, 40, e002763. [Google Scholar] [CrossRef]
  18. Modi, A.; Tare, V.; Chaudhuri, C. Usage of long-term river discharge data in water balance model for assessment of trends in basin storages. Model. Earth Syst. Environ. 2021, 7, 953–966. [Google Scholar] [CrossRef]
  19. Lehner, B.; Czisch, G.; Vassolo, S. The impact of global change on the hydropower potential of Europe: A model-based analysis. Energy Policy 2005, 33, 839–855. [Google Scholar] [CrossRef]
  20. Morovati, K.; Tian, F.; Kummu, M.; Shi, L.; Tudaji, M.; Nakhaei, P.; Marcelo, O.A. Contributions from climate variation and human activities to flow regime change of Tonle Sap Lake from 2001 to 2020. J. Hydrol. 2023, 616, 128800. [Google Scholar] [CrossRef]
  21. Intergovernmental Panel on Climate Change (IPCC). Climate Change 2013: The Physical Science Basis. Contribution of Working Group I to the Fifth Assessment Report of the Intergovernmental Panel on Climate Change; Cambridge University Press: Cambridge, UK; New York, NY, USA, 2013. [Google Scholar]
  22. Du, N.; Fathollahi-Fard, A.M.; Wong, K.Y. Wildlife resource conservation and utilization for achieving sustainable development in China: Main barriers and problem identification. Environ. Sci. Pollut. Res. 2023, 1–20. [Google Scholar] [CrossRef]
  23. Moss, R.H.; Edmonds, J.A.; Hibbard, K.A.; Manning, M.R.; Rose, S.K.; van Vuuren, D.P.; Carter, T.R.; Emori, S.; Kainuma, M.; Kram, T.; et al. The next generation of scenarios for climate change research and assessment. Nature 2010, 463, 747–756. [Google Scholar] [CrossRef]
  24. Arora, V.K.; Scinocca, J.F.; Boer, G.J.; Christian, J.R.; Denman, K.L.; Flato, G.M.; Kharin, V.V.; Lee, W.G.; Merryfield, W.J. Carbon emission limits required to satisfy future representative concentration pathways of greenhouse gases. Geophys. Res. Lett. 2011, 38, e046270. [Google Scholar] [CrossRef]
  25. van Vuuren, D.P.; Edmonds, J.; Kainuma, M.; Riahi, K.; Thomson, A.; Hibbard, K.; Hurtt, G.C.; Kram, T.; Krey, V.; Lamarque, J.-F.; et al. The representative concentration pathways: An overview. Clim. Change 2011, 109, 5–31. [Google Scholar] [CrossRef]
  26. Chaturvedi, R.K.; Joshi, J.; Jayaraman, M.; Bala, G.; Ravindranath, N.H. Multi-Model Climate Change Projections for India under Representative Concentration Pathways. Curr. Sci. 2012, 103, 791–802. Available online: http://www.jstor.org/stable/24088836 (accessed on 14 March 2004).
  27. Gao, Y.; Fu, J.S.; Drake, J.B.; Lamarque, J.-F.; Liu, Y. The impact of emission and climate change on ozone in the United States under representative concentration pathways (RCPs). Atmos. Chem. Phys. 2013, 13, 9607–9621. [Google Scholar] [CrossRef]
  28. Marcinkowski, P. Projections of Climate Change Impact on Stream Temperature: A National-Scale Assessment for Poland. Appl. Sci. 2024, 14, 10900. [Google Scholar] [CrossRef]
  29. Peterson, B.J.; Holmes, R.M.; McCelland, J.W.; Vorosmarty, C.J.; Lammers, R.B.; Shiklomanov, A.I.; Shiklomanov, I.A.; Rahmstorf, S. Increasing River Discharge to the Arctic Ocean. Science 2002, 298, 2171–2173. [Google Scholar] [CrossRef]
  30. Berezovskaya, S.; Yang, D.; Kane, D.L. Compatibility analysis of precipitation and runoff trends over the large Siberian watersheds. Geophys. Res. Lett. 2004, 31, L21502. [Google Scholar] [CrossRef]
  31. Dai, A.; Qian, T.; Trenberth, K.E.; Milliman, J.D. Changes in Continental Freshwater Discharge from 1948 to 2004. J. Clim. 2009, 22, 2773–2792. [Google Scholar] [CrossRef]
  32. Shi, X.; Qin, T.; Nie, H.; Weng, B.; He, S. Changes in Major Global River Discharges Directed into the Ocean. Int. J. Environ. Res. Public Health 2019, 16, 1469. [Google Scholar] [CrossRef]
  33. Heinicke, S.; Volkholz, J.; Schewe, J.; Gosling, S.N.; Schmied, H.M.; Zimmermann, S.; Mengel, M.; Sauer, I.J.; Burek, P.; Chang, J.; et al. Global hydrological models continue to overestimate river discharge. Environ. Res. Lett. 2024, 19, 074005. [Google Scholar] [CrossRef]
  34. Chormański, J. Analysis of urbanization impact on changes in river discharge—A case study of the Biała River catchment. Stud. Geotech. Mech. 2012, 34, 19–32. [Google Scholar] [CrossRef]
  35. Duan, W.; He, B.; Chen, Y.; Zou, S.; Wang, Y.; Nover, D.; Chen, W.; Yang, G. Identification of long-term trends and seasonality in high-frequency water quality data from the Yangtze River basin, China. PLoS ONE 2018, 13, e0188889. [Google Scholar] [CrossRef] [PubMed]
  36. Habel, M.; Nowak, B.; Szadek, P. Evaluating indicators of hydrologic alteration to demonstrate the impact of open-pit lignite mining on the flow regimes of small and medium-sized rivers. Ecol. Indic. 2023, 157, 111295. [Google Scholar] [CrossRef]
  37. Foley, J.A.; DeFries, R.; Asner, G.P.; Barford, C.; Bonan, G.; Carpenter, S.R.; Champin, S.; Coe, M.; Daily, G.; Gibbs, H.; et al. Global Consequences of Land Use. Science 2005, 309, 570–574. [Google Scholar] [CrossRef]
  38. Dosdogru, F.; Kalin, L.; Wang, R.; Yen, H. Potential impacts of land use/cover and climate changes on ecologically relevant flows. J. Hydrol. 2020, 584, 124654. [Google Scholar] [CrossRef]
  39. Szatten, D.; Habel, M. Effects of Land Cover Changes on Sediment and Nutrient Balance in the Catchment with Cascade-Dammed Waters. Remote Sens. 2020, 12, 3414. [Google Scholar] [CrossRef]
  40. Feranec, J.; Jaffrain, G.; Soukup, T.; Hazeu, G. Determining changes and flows in European landscapes 1990–2000 using CORINE land cover data. Appl. Geogr. 2010, 30, 19–35. [Google Scholar] [CrossRef]
  41. Obodovskyi, O. River Runoff in Ukraine Under Climate Change Conditions; LAP Lambert Academic Publishing: Kiev, Ukraine, 2020; p. 180. [Google Scholar]
  42. Cui, T.; Tian, F.; Yang, T.; Wen, J.; Khan, M.Y.A. Development of a comprehensive framework for assessing the impacts of climate change and dam construction on flow regimes. J. Hydrol. 2020, 590, 125358. [Google Scholar] [CrossRef]
  43. Szmańda, J.B.; Gierszewski, P.J.; Habel, M.; Luc, M.; Witkowski, K.; Bortnyk, S.; Obodovskyi, O. Response of the Dnieper River fluvial system to the river erosion caused by the operation of the Kaniv hydroelectric power plant (Ukraine). Catena 2021, 202, 105265. [Google Scholar] [CrossRef]
  44. Lindström, G.; Johansson, B.; Persson, M.; Gardelin, M.; Bergström, S. Development and test of the distributed HBV-96 hydrological model. J. Hydrol. 1997, 201, 272–288. [Google Scholar] [CrossRef]
  45. Booij, M.J.; Krol, M.S. Balance between calibration objectives in a conceptual hydrological model. Hydrol. Sci. J. 2010, 55, 1017–1032. [Google Scholar] [CrossRef]
  46. Osuch, M.; Lawrence, D.; Meresa, H.K.; Napiórkowski, J.J.; Romanowicz, R.J. Projected changes in flood indices in selected catchments in Poland in the 21st century. Stoch. Environ. Res. Risk Assess. Res. J. 2017, 31, 2435–2457. [Google Scholar] [CrossRef]
  47. Tian, F.; Hou, S.; Morovati, K.; Zhang, K.; Nan, Y.; Lu, X.X.; Ni, G. Exploring spatio-temporal patterns of sediment load and driving factors in Lancang-Mekong River basin before operation of mega-dams (1968–2002). J. Hydrol. 2023, 617, 128922. [Google Scholar] [CrossRef]
  48. Mekonnen, D.G.; Moges, M.A.; Mulat, A.G.; Shumitter, P. The impact of climate change on mean and extreme state of hydrological variables in Megech watershed, Upper Blue Nile Basin, Ethiopia. In Extreme Hydrology and Climate Variability; Melesse, A.M., Abtew, W., Senay, G., Eds.; Elsevier: Amsterdam, The Netherlands, 2019; pp. 123–135. [Google Scholar] [CrossRef]
  49. Acharyya, R.; Mukhopadhyay, A.; Habel, M. Coupling of SWAT and DSAS Models for Assessment of Retrospective and Prospective Transformations of River Deltaic Estuaries. Remote Sens. 2023, 15, 958. [Google Scholar] [CrossRef]
  50. Belletti, B.; Garcia de Leaniz, C.; Jones, J.; Bizzi, S.; Börger, L.; Segura, G.; Castelletti, A.; van de Bund, W.; Aarestrup, K.; Barry, J.; et al. More than one million barriers fragment Europe’s rivers. Nature 2020, 588, 436–441. [Google Scholar] [CrossRef]
  51. Habel, M.; Mechkin, K.; Podgorska, K.; Saunes, M.; Babiński, Z.; Chalov, S.; Absalon, D.; Podgórski, Z.; Obolewski, K. Dam and reservoir removal projects—A mix of social-ecological trends and cost-cutting attitudes. Sci. Rep. 2020, 10, 19210. [Google Scholar] [CrossRef]
  52. Gierszewski, P.J.; Habel, M.; Szmańda, J.; Luc, M. Evaluating effects of dam operation on flow regimes and riverbed adaptation to those changes. Sci. Total Environ. 2020, 710, 136202. [Google Scholar] [CrossRef]
  53. Szatten, D.; Brzezińska, M.; Bosino, A. New sediment continuum measurements in the Brda River (Poland): The results of the functioning of the 50-year Koronowo dam. J. Soils Sediments 2023, 23, 3219–3240. [Google Scholar] [CrossRef]
  54. Revenga, C.; Brunner, J.; Henniger, N.; Kassem, K.; Payne, R. Pilot Analysis of Global Ecosystems: Freshwater Systems; World Resources Institute: Washington, DC, USA, 2020; p. 100. [Google Scholar]
  55. Szatten, D.; Habel, M.; Babiński, Z. Influence of Hydrologic Alteration on Sediment, Dissolved Load and Nutrient Downstream Transfer Continuity in a River: Example Lower Brda River Cascade Dams (Poland). Resources 2021, 10, 70. [Google Scholar] [CrossRef]
  56. Jacob, D.; Petersen, J.; Eggert, B.; Alias, A.; Christensen, O.B.; Bouwer, L.M.; Braun, A.; Colette, A.; Déqué, M.; Georgievski, G.; et al. EURO-CORDEX: New high-resolution climate change projections for European impact research. Reg. Environ. Change 2014, 14, 563–578. [Google Scholar] [CrossRef]
  57. Konukcu, F.; Istanbulluoglu, A.; Kocaman, I. Determination of the water yields for small basins in semi-arid areas: Application of the modified Turc method to the Turkey’s conditions. J. Cent. Eur. Agric. 2005, 6, 263–268. Available online: https://jcea.agr.hr/articles/257_DETERMINATION_OF_THE_WATER_YIELDS_FOR_SMALL_BASINS_IN_SEMI_ARID_AREAS_APPLICATION_OF_THE_MODIFIED_TURC_METHOD_TO_THE_TURKEY_S_C_en.pdf (accessed on 3 April 2025).
  58. Horvat, B.; Rubinic, J. Annual runoff estimation—An example of karstic aquifers in the transboundary region of Croatia and Slovenia. Hydrol. Sci. J. 2006, 51, 314–324. [Google Scholar] [CrossRef]
  59. Snizhko, S.I.; Obodovskyi, O.G.; Shevchenko, O.G.; Grebin, V.V.; Didovets, I.S.; Kuprikov, I.V.; Pochaievets, O.O. Regional Assessment Changes of The Rivers Runoff of Ukrainian Carpathians Region Under Climate Changes. Ukr. Geogr. 2020, 2, 20–29. [Google Scholar] [CrossRef]
  60. Map of the Polish Hydrographic Division. Department of Hydrography and Morphology of River Channels Institute of Meteorology and Water Management. 2007. Available online: http://mapa.kzgw.gov.pl/ (accessed on 10 December 2016).
  61. Galon, R. Morfologia doliny i sandru Brdy. Stud. Soc. Scient. Tor. 1953, C, 1–6. [Google Scholar]
  62. Corine Land Cover. Copernicus Land Monitoring Service, 2018. Available online: https://sdi.eea.europa.eu/catalogue/copernicus/api/records/71c95a07-e296-44fc-b22b-415f42acfdf0?language=all (accessed on 4 December 2020).
  63. Jutrowska, E. Antropogeniczne Zmiany Warunków Hydrologicznych w Dorzeczu Brdy; Biblioteka Monitoringu Srodowiska: Bydgoszcz, Poland, 2007; p. 128. [Google Scholar]
  64. Studium Regionu Doliny Brdy; Biuro Planów Regionalnych: Warszawa, Poland, 1953.
  65. Pozwolenie Wodnoprawne na Szczególne Korzystanie z Wód Rzeki Brdy Dla Potrzeb Elektrowni Wodnej Smukała; Biuro Wojewody Kujawsko-Pomorskiego. 2004. Available online: http://archiwum.kujawsko-pomorskie.pl/index.php?option=com_content&task=view&id=20512&Itemid=665 (accessed on 10 September 2020).
  66. Szatten, D. Wpływ zabudowy hydrotechnicznej na występowanie ekstremalnych stanów wody na przykładzie Brdy skanalizowanej. Inżynieria Ekol. 2016, 46, 55–60. [Google Scholar] [CrossRef]
  67. Urban, G. Ocena wybranych metod obliczania średniej dobowej, miesięcznej i rocznej wartości temperatury powietrza (na przykładzie Sudetów Zachodnich i ich przedpola). Opera Corcon. 2010, 47, 23–34. Available online: https://opera.krnap.cz/apex/apex_util.get_blob?s=6643063503717&a=103&c=6251526924540477&p=8&k1=926&k2=&ck=_PO5bGOfXQcH9Y5pVqgg_7N2W1FG2FMIXVVBuXWwdUYaOCK2lIvPWSKuO9Bojl0dA74EDCyNCCIzBfcTpmdyCw&rt=CR (accessed on 3 April 2025).
  68. Klemm, S. IOM Report. 39. Catalogue of National Standard Precipitation Gauges; World Meteorological Organization: Geneva, Switzerland, 1989; p. 50. [Google Scholar]
  69. Mezghani, A.; Dobler, A.; Haugen, J.E.; Benestad, R.E.; Parding, K.M.; Piniewski, M.; Kardel, I.; Kundzewicz, Z.W. CHASE-PL Climate Projection dataset over Poland—Bias adjustment of EURO-CORDEX simulations. Earth Syst. Sci. Data 2017, 9, 905–925. [Google Scholar] [CrossRef]
  70. Intergovernmental Panel on Climate Change (IPCC). Climate Change 2014: Synthesis Report. Contribution of Working Groups I, II and III to the Fifth Assessment Report of the Intergovernmental Panel on Climate Change; Pachauri, R.K., Meyer, L.A., Eds.; IPCC: Geneva, Switzerland, 2014; Available online: https://www.ipcc.ch/site/assets/uploads/2018/02/SYR_AR5_FINAL_full.pdf (accessed on 12 June 2023).
  71. Lukianets, O.I.; Obodovskyi, O.G.; Grebin, V.V.; Moskalenko, S.O.; Pochaievets, O.O.; Korniienko, V.O. Forecast estimates of water runoff of rivers of Ukraine on the basis of stochastic patterns of its long-term fluctuations. Ukr. Geogr. J. 2021, 4, 18–29. [Google Scholar] [CrossRef]
  72. Turc, L. Water Balance of Soils: Relationship Between Precipitation, Evapotranspiration and Runoff. Ann. Agron. 1954, 5, 491–595. [Google Scholar]
  73. Kożuchowski, K.; Żmudzka, E. Ocieplenie w Polsce, skala i rozkład sezonowy zmian temperatury powietrza w drugiej połowie XX wieku. Przegl. Geofiz 2001, Z.1–, 81–90. [Google Scholar]
  74. Piniewski, M.; Mezghani, A.; Szcześniak, M.; Kundzewicz, Z.W. Regional projections of temperature and precipitation changes: Robustness and uncertainty aspects. Meteorol. Z. 2017, 26, 223–234. [Google Scholar] [CrossRef]
  75. Trenberth, K.E.; Fasullo, J.T. An apparent hiatus in global warming? Earth’s Future 2013, 1, 19–32. [Google Scholar] [CrossRef]
  76. Wrzesiński, D.; Marsz, A.A.; Sobkowiak, L.; Styszyńska, A. Response of Low Flows of Polish Rivers to Climate Change in 1987–1989. Water 2022, 14, 2780. [Google Scholar] [CrossRef]
  77. Brzezińska, W.; Wrzesiński, D. Maximum River Runoff in Poland Under Climate Warming Conditions. Quaest. Geogr. 2025, 44, 85–105. [Google Scholar] [CrossRef]
  78. Priya, A.K.; Muruganandam, M.; Rajamanickam, S.; Sivarethinamohan, S.; Gaddam, M.K.R.; Velusamy, P.; Gomathi, R.; Gokulan, R.; Gurugubelli, T.R.; Muniasamy, S.K. Impact of climate change and anthropogenic activities on aquatic ecosystem—A review. Environ. Res. 2023, 238, 117233. [Google Scholar] [CrossRef]
  79. Rezvani, R.; Rahimi, M.M.; Na, W.; Najafi, M.R. Accelerated lagged compound floods and droughts in northwest North America under 1.5 °C–4 °C global warming levels. J. Hydrol. 2023, 624, 129906. [Google Scholar] [CrossRef]
  80. Gorączko, M. Przebieg i skutki wezbrań na Wiśle w rejonie Bydgoszczy w latach 2010–2011. In Gospodarowanie Wodą w Warunkach Zmieniającego Się Środowiska; Marszelewski, W., Ed.; Monografie Komisji Hydrologicznej PTG: Toruń, Poland, 2011; pp. 75–84. [Google Scholar]
  81. Choiński, A. Zróżnicowanie i Uwarunkowania Zmienności Przepływów Rzek Polskich; Scientific Society Press UAM: Poznań, Poland, 1988; p. 99. [Google Scholar]
  82. Vörösmarty, C.J.; Sharma, K.P.; Fekete, B.M.; Copeland, A.H.; Holden, J.; Marble, J.; Lough, J.A. The storage and aging of continental run off in large reservoir systems of the world. Ambio 1997, 26, 210–219. [Google Scholar]
  83. Obodovskyi, O.; Habel, M.; Szatten, D.; Rozlach, Z.; Babiński, Z.; Maerker, M. Assessment of the Dnieper Alluvial Riverbed Stability Affected by Intervention Discharge Downstream of Kaniv Dam. Water 2020, 12, 1104. [Google Scholar] [CrossRef]
  84. Zhang, Z.; Liu, J.; Huang, J. Hydrologic impacts of cascade dams in a small headwater watershed under climate variability. J. Hydrol. 2020, 590, 125426. [Google Scholar] [CrossRef]
  85. Directive 2000/60/EC of the European Parliament and of the Council of 23 October 2000 Establishing a Framework for Community Action in the Field of Water Policy. Available online: https://eur-lex.europa.eu/eli/dir/2000/60/oj (accessed on 21 October 2019).
  86. Lopez-Moreno, J.I.; Vicente-Serrano, S.M.; Beguerıa, S.; Garcıa-Ruiz, J.M.; Portela, M.M.; Almeida, A.B. Dam effects on droughts magnitude and duration in a transboundary basin: The Lower River Tagus, Spain and Portugal. Water Resour. Res. 2009, 45, W02405. [Google Scholar] [CrossRef]
  87. Fischer, G.; Heilig, G.K. Population momentum and the demand on land and water resources. Phil. Trans. R. Soc. 1997, 352, 869–889. Available online: https://www.jstor.org/stable/56531 (accessed on 14 January 2023). [CrossRef]
  88. Shiklomanov, I.A. The world’s water resources. In Proceedings of the International Symposium to Commemorate 25 Years of the IHD/IHP, Paris, France, 15–17 March 1990; UNESCO/IHP: Paris, France, 1991; pp. 93–126. [Google Scholar]
  89. Cosgrove, W.J.; Loucks, D.P. Water management: Current and future challenges and research directions. Water Resour. Res. 2015, 51, 4823–4839. [Google Scholar] [CrossRef]
  90. Mioduszewski, W. Mała retencja w lasach elementem kształtowania i ochrony zasobów wodnych. Stud. I Mater. Cent. Edukac. Przyr. -Leśnej 2008, 2, 33–48. Available online: http://malaretencja.pl/images/publikacje/W._Mioduszewski_MaaRetencjawLasach.pdf (accessed on 3 April 2025).
  91. Rozporządzenie Rady Ministrów z Dnia 18 Października 2016 r. w Sprawie Planu Gospodarowania Wodami na Obszarze Dorzecza Wisły. Journal of in Laws 2016, Item 1911. Available online: https://isap.sejm.gov.pl/isap.nsf/DocDetails.xsp?id=WDU20160001911 (accessed on 22 November 2023).
  92. Rozporządzenie Ministra Infrastruktury z Dnia 15 Lipca 2021 r. w Sprawie Przyjęcia Planu Przeciwdziałania Skutkom Suszy. Journal of Laws in 2021, Item 1615. Available online: https://isap.sejm.gov.pl/isap.nsf/DocDetails.xsp?id=WDU20210001615 (accessed on 22 November 2023).
  93. Rozporządzenie Ministra Infrastruktury z Dnia 18 Października 2022 r. w Sprawie Przyjęcia Planu Zarządzania Ryzykiem Powodziowym Dla Obszaru Dorzecza Wisły. Journal of Laws in 2022, Item 2739. Available online: https://isap.sejm.gov.pl/isap.nsf/DocDetails.xsp?id=WDU20220002739 (accessed on 22 November 2023).
  94. So, K.; Rogers, C.A.; Li, Y.; Arain, M.A.; Gonsamo, A. Retention forestry as a climate solution: Assessing biomass, soil carbon and albedo impacts in a northern temperate coniferous forest. Sci. Total Environ. 2024, 947, 174680. [Google Scholar] [CrossRef]
  95. Halperin, S.; Koehn, C.R.; Johnson, K.K.; Brandt, J.S. Systematic conservation planning for private working lands: Identifying agricultural protection areas for climate solutions, biodiversity habitat, and ecosystem services. Biol. Conserv. 2004, 297, 110735. [Google Scholar] [CrossRef]
  96. Zwierzchowska, I.; Fagiewicz, K.; Poniży, L.; Lupa, P.; Mizgajski, A. Introducing nature-based solutions into urban policy—Facts and gaps. Case study of Poznań. Land Use Policy 2019, 85, 161–175. [Google Scholar] [CrossRef]
  97. WWAP United Nations World Water Assessment Programme. The United Nations World Water Development Report 2018: Nature-Based Solutions for Water; UN Water Report: New York, NY, USA, 2018; Available online: https://unesdoc.unesco.org/ark:/48223/pf0000261424 (accessed on 16 June 2023).
  98. Hamidova, E.; Bosino, A.; Franceschi, L.; De Amicis, M. Nature-Based Solution Integration to Enhance Urban Geomorphological Mapping: A Methodological Approach. Land 2024, 13, 467. [Google Scholar] [CrossRef]
  99. Clayton, S.; Manning, C.M.; Krygsman, K.; Speiser, M. Mental Health and Our Changing Climate: Impacts, Implications, and Guidance; American Psychological Association, and ecoAmerica: Washington, DC, USA, 2017; p. 70. [Google Scholar]
  100. Fracasso, I.; Dinella, A.; Giammarchi, F.; Marinchel, N.; Kołaczek, P.; Lamentowicz, M.; Marcisz, K.; Łokas, E.; Miecznik, M.; Bragazza, L.; et al. Climate and human impacts inferred from a 1500-year multi-proxy record of an alpine peatland in the South-Eastern Alps. Ecol. Indic. 2022, 145, 109737. [Google Scholar] [CrossRef]
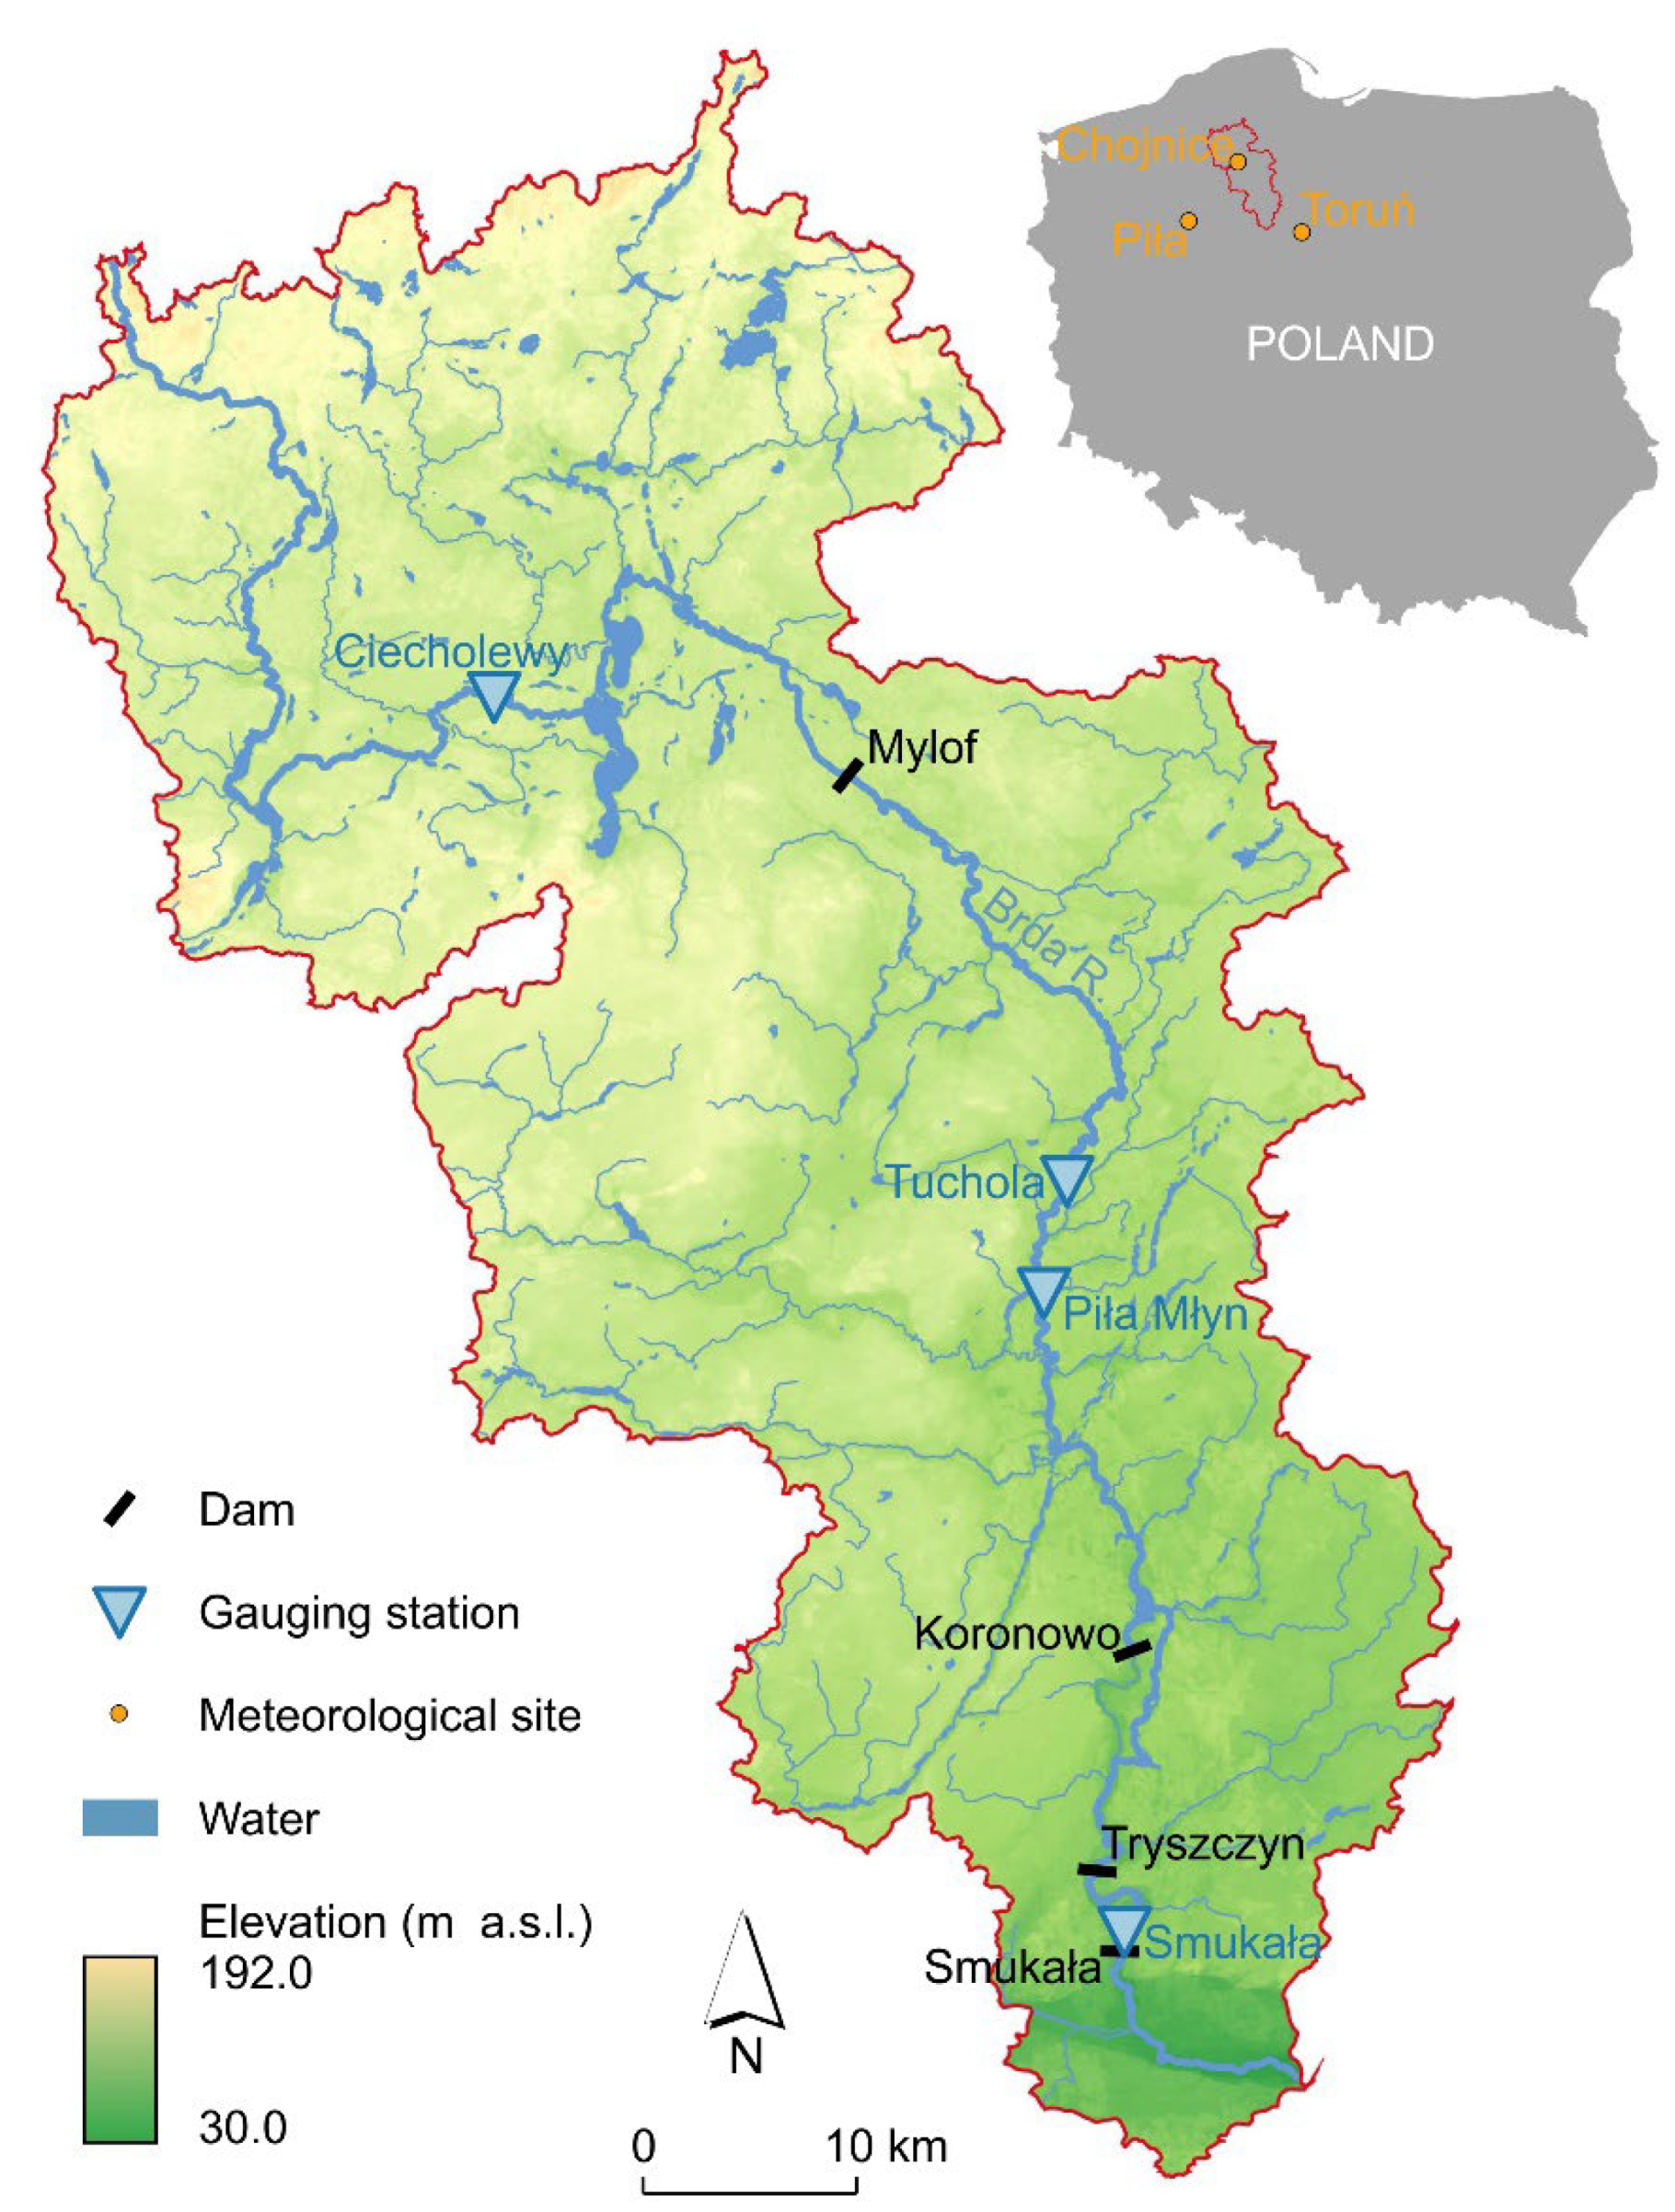
Figure 1. The Brda River catchment includes gauging stations and reservoirs (background map—open source of Digital Elevation Model from geoportal.gov.pl).
Geosciences 15 00197 g001
Figure 2. Research workflow on the Brda River catchment.
Geosciences 15 00197 g002
Figure 3. Average annual air temperature (A) (in °C) and annual sums of precipitation (in mm) (B) in the Brda River catchment, calculated foranalyzed sites for the period 1971–2021.
Geosciences 15 00197 g003
Figure 4. River-flow oscillation including a long-term trend in discharge determined using the integral curves method for Qav, Qmax, and Qmin at gauging stations within the Brda River catchment: (A)—Ciecholewy, (B)—Tuchola, (C)—Piła Młyn, and (D)—Smukała, for the years 1951–2021.
Geosciences 15 00197 g004
Figure 5. The value of tan α (ki) for decreasing (↓) and increasing (↑) trends in river flow oscillation for Qav (A), Qmax (B), and Qmin (C) at the analyzed gauging stations in the Brda River catchment from 1951 to 2021.
Geosciences 15 00197 g005
Figure 6. Comparison of observed annual river flow (QO) and simulated annual river flow (QS) (in mm) calculated according to the modified Turc model in the Brda River catchment for: (A)—Ciecholewy, (B)—Tuchola, (C)—Piła Młyn, and (D)—Smukała, for the reference period 1971–2021.
Geosciences 15 00197 g006
Figure 7. The simulated annual river flow (QS) calculated according to the modified Turc model, for climate scenario RCP4.5 in the Brda River catchment for analyzed sites for the period 2022 to 2050.
Geosciences 15 00197 g007
Table 1. Characteristics of dams in the longitudinal profile of the Brda River catchment.
No.ReservoirYearKmArea
(in km2)
Capacity
(in mln m3)
Water Damming (in m)
1.Mylof1848123.110.516.210.0
2.Koronowo196149.1 40.1 *14.3681.024.7
3.Tryszczyn196231.50.871.84.6
4.Smukała195122.30.942.27.5
* HPP in Samociążek.
Table 2. Characteristics of the gauging stations used in this study.
No.Water GaugeA (km2·10−3)KilometersParameterScope of Observation
1.Ciecholewy0.712166.7Q
in m3·s−1
1961–2021
2.Tuchola2.60585.91951–2021
3.Piła Młyn2.80075.11962–2013
4.Smukała4.47220.11965–2021
Table 3. Meteorological site of IMWM-NRI network.
No.StationLatitudeLongitudeElevation
in m a.s.l.
ParametersScope of Observation
1.Chojnice53°42′55″ N17°31′57″ E164T, in °C
P, in mm
1971–2021
2.Piła53°07′52″ N16°44′54″ E721971–2021
3.Toruń53°02′31″ N18°35′43″ E691971–2021
Table 4. Calibration factor c using Formula (5) and verified calibration factor c′ (based on the P/c correlation) for gauging stations in the Brda River catchment.
No.Gauging Stationc (1971–2021)Correlation Coefficient P/cNew Formulac′ (2022–2050)
1.Ciecholewy−0.926–164.015−0.695c′ = (−0.0075 × Pa) + 6.61081.174–1.366
2.Tuchola−0.887–14.333−0.744c′ = (−0.0065 × Pa) + 5.46691.026–1.168
3.Piła Młyn−0.009–12.167−0.735c′ = (−0.0158 × Pa) + 11.7671.138–1.532
4.Smukała−0.960–16.899−0.801c′ = (−0.0077 × Pa) + 5.62370.594–0.796
Table 5. Matrix of upward (↑) and downward (↓) flow rate trends for analysis gauging stations in the Brda River catchment from 1951 to 2050.
Gauging StationFull River Flow Oscillation
IIIIIIIV
Ciecholewy1961 ↓ 1966 ↑ 1989
28 years
1989 ↓ 1998 ↑ 2013
24 years
2013 ↓ 2041 ↑ 2050
37 years
Tuchola1951 ↓ 1961 ↑ 1988
37 years
1988 ↓ 2001 ↑ 2013
25 years
2013 ↓ 2030 ↑ 2038
25 years
2038 ↓ 2050
12 years *
Piła Młyn1962 ↓ 1966 ↑ 1988
26 years
1988 ↓ 2000 ↑ 2023
35 years
2023 ↓ 2035 ↑ 2040
17 years
2040 ↓ 2050
10 years *
Smukała1965 ↑ 1994
29 years *
1994 ↓ 2034 ↑ 2040
46 years
2040 ↓ 2050
10 years *
* Incomplete river flow oscillation.
Disclaimer/Publisher’s Note: The statements, opinions and data contained in all publications are solely those of the individual author(s) and contributor(s) and not of MDPI and/or the editor(s). MDPI and/or the editor(s) disclaim responsibility for any injury to people or property resulting from any ideas, methods, instructions or products referred to in the content.