Abstract
The carbonate reservoir of the NT oilfield in the Precaspian Basin is a fracture-pore type with an extremely complex fracture network, comprising both high-angle structural fractures and abundant low-angle bedding-parallel fractures. Both fracture types significantly impact waterflood development, making effective prediction and characterization of the complex fracture network crucial for optimizing waterflooding and development plans. Using core, imaging logging, conventional logging, seismic, and production performance data, we predicted the distribution of high-angle structural and low-angle bedding-parallel fractures. A discrete fracture network (DFN) was constructed by grouping fractures based on strike and dip angles, and the influences of fractures with different dip angles on the initial production of individual wells and production decline rates were analyzed. Results show that high-angle fracture distribution is effectively predicted by combining imaging logging data with seismic volumes processed via ant-tracking technology, while low-angle fractures are well predicted using conventional logging, imaging logging, and seismic data processed by dip deviation. High-angle fractures are predominantly developed near and parallel to faults; low-angle fractures are mainly distributed in fold limbs. Fractures were grouped into northeast, southeast, southwest, northwest high-angle fractures, and low-angle fractures. Fracture modeling indicates a reservoir fracture porosity of 0~0.27% and permeability of 10~100 mD. With increasing fracture density, single-well initial productivity and production decline rates are higher in high-angle fracture zones than in low-angle fracture zones. Low-angle fractures contribute to ~56.45% of high-angle fractures’ production and affect production decline at ~82.5% of high-angle fractures’ level. This method is significant for predicting and modeling complex fracture networks in other reservoirs.
1. Introduction
Natural fractures are present in over half of the world’s discovered carbonate reservoirs, exerting significant impacts on hydrocarbon seepage, waterflood development, and reservoir productivity [1,2,3,4]. Consequently, predicting and characterizing these fractures is critical for effective hydrocarbon exploitation in carbonate reservoirs.
Current research primarily focuses on high-angle structural fractures (>30°), which are categorized into large-scale (identifiable via seismic data) and small-scale (detectable through core or imaging logging) types, with distinct prediction methods. Large-scale fractures are predicted using seismic data processed via ant-tracking technology [5,6,7], and small-scale high-angle fractures are modeled through interwell interpolation of imaging logging data [6,8,9,10], constrained by ant-tracked large-scale seismic volumes. Fracture modeling typically involves grouping fractures by strike [11,12]. However, low-angle fractures (≤30°) have been overlooked in predictive and modeling efforts. Prior studies on low-angle fractures have focused on qualitative descriptions of their developmental characteristics [11,12,13,14], the establishment of developmental models [15], and discussions of their contributions to reservoir development [16,17], with limited attention to their prediction and modeling.
The NT oilfield contains both high-angle structural fractures and widespread low-angle bedding-parallel fractures. Previous research in this field has centered on sedimentary processes [18,19,20,21,22], diagenesis [23,24,25,26], and geodynamic evolution [27,28], with fracture-related studies focusing on origins, formation timing [29], identification via conventional and imaging logging [22,30] and connectivity of the fracture network [31]. Li et al. [17] demonstrated that low-angle bedding-parallel fractures enhance reservoir permeability in the NT oilfield, emphasizing the need to consider both high- and low-angle fractures in fracture prediction and modeling here.
This study presents a case study of the NT oilfield, aiming to separately predict the distribution of high- and low-angle fractures by integrating core, imaging logging, conventional logging, seismic, and production performance data. A fracture model was subsequently developed by grouping fractures based on their strike and dip, with constraints from these predicted distributions, thereby facilitating effective characterization of the complex fracture network. To our knowledge, this represents the first discrete fracture network model that incorporates both high- and low-angle fractures, with implications for predicting and modeling complex fracture networks in other reservoirs. Additionally, the method of using conventional logging data to predict low-angle fractures is significant for improving the accuracy of low-angle fracture predictions.
2. Geological Setting
The Precaspian Basin is one of the most important hydrocarbon basins in the world, with an area of 500,000 km2 [32]. The NT oilfield is located in the central area of the eastern slope of the Enbeksk-Zharamysskaya uplift zone, which is on the eastern margin of the Precaspian Basin (Figure 1a,b). The structure of the NT oilfield is an anticline (Figure 1c). The Carboniferous KT-I Formation is an important oil-producing formation, with a thickness of 300 m (Figure 1d). It is divided into layer A1, A2, A3, Б1, Б2, B1, B2, B3, B4, and B5, and the layer A1 and part of layer A2 was denuded because of the paleokarst. The deposition of the KT-I Formation is extremely complex, developing evaporated platform facies in A Group, restricted platform facies in Б Group, and open platform facies in B Group. The content of dolomite and limestone in Group A is 53% and 47%, respectively, and the lithology of Б Group and B Group is dominated by limestone. The study area has experienced three tectonic movements [32,33]. Specifically, the tectonic framework of high in the west and low in the east formed because of the Uralian collision in the Late Carboniferous. The relative elevation between the east and west in the study area is enlarged due to the Hercynian orogeny in the Late Permian. The Cimmerian orogeny in the Late Triassic led to the tectonic inversion, developing the new tectonic framework of high in the east and low in the west. There are 13 faults and a large number of structural fractures in the study area, trending NE–SW and NW–SE owing to the three tectonic movements (Figure 1c). Low-angle bedding-parallel fractures are well developed due to the release of overburden pressure caused by the uplift of strata. The petrophysical properties in the study area are relatively good, with an average porosity of 16.9% and an average permeability of 107.3 mD [21]. The reservoir had been developed by a depletion-type drive since 2005, and waterflooding was adopted in 2013. The water channeling is serious because of the existence of fractures in the study area. So far, the composite water cut of the oilfield is 27.7%, and the water cut of individual wells is from 0 to 98%.
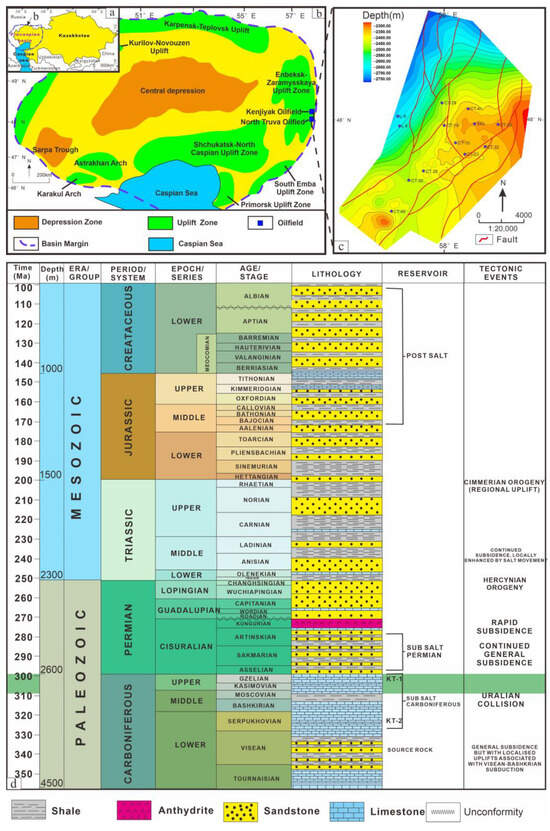
Figure 1.
Geological setting of the study area. (a) Location of the Precaspian Basin [21]; (b) Tectonic framework of the Precaspian Basin [21]. (c) Top structure map of the NT oilfield [17]. (d) Stratigraphic column and target layers of the NT oilfield.
3. Data and Methods
3.1. Data Collection
This study primarily utilized data from coring, imaging logging, conventional logging, seismic surveys, well testing, and production performance analyses.
The study area contains 17 cored wells with a total coring length of 447.55 m. Based on core data, the genetic types of fractures with varying dip angles were meticulously counted, providing a foundation for fracture prediction and modeling.
Twenty-one full-interval imaging logging wells are evenly distributed across the study area, with interpretation results provided by Schlumberger. Imaging logging yields information on the percentage of fractures with different strikes and dip angles, as well as linear fracture density (P10) and volumetric fracture intensity (P32) for individual wells.
A total of 336 wells, with an average spacing of 500 m, were equipped with conventional logging curves, including natural gamma-ray (GR), spontaneous potential (SP), photoelectric absorption cross-section index (PE), dual lateral logging (deep and shallow), micro-spherically focused log (MSFL), caliper logging (CAL), acoustic logging (AC), density logging (DEN), and neutron logging (CN). Conventional logging data, provided by the Research Institute of Petroleum Exploration and Development, China, offer insights into low-angle fractures in individual wells.
Seismic data provide information on the distribution of large-scale fractures and constrain the characterization of small-scale interwell fractures. Well testing data were sourced from the Research Institute of Petroleum Exploration and Development.
Decline rates were calculated using production performance data, with calculations focused on the interval where the first constant flow occurred. Fitting was performed using an exponential function.
3.2. Prediction of Different Dip-Angle Fractures
Fractures in the study area were classified into high-angle and low-angle types, with 30° serving as the boundary, based on seismic and conventional logging data.
Previous research has extensively focused on the prediction and modeling of high-angle fractures, with distinct methods proposed for large-scale and small-scale fracture characterization [7,34,35]. Large-scale fractures were predicted through seismic data utilizing ant-tracking technology. For small-scale fractures, prediction was achieved via interwell interpolation of high-angle fracture data identified from imaging logging, constrained by the seismic data volume.
In contrast, limited efforts have been directed toward low-angle fracture prediction. Here, low-angle fracture distribution was predicted through interwell interpolation of low-angle fractures identified from imaging logging, constrained by a low-angle fracture constraint. This constraint was constructed by interwell interpolation of low-angle fractures identified from conventional logging, with constraints derived from seismic data processed using dip deviation (Figure 2).
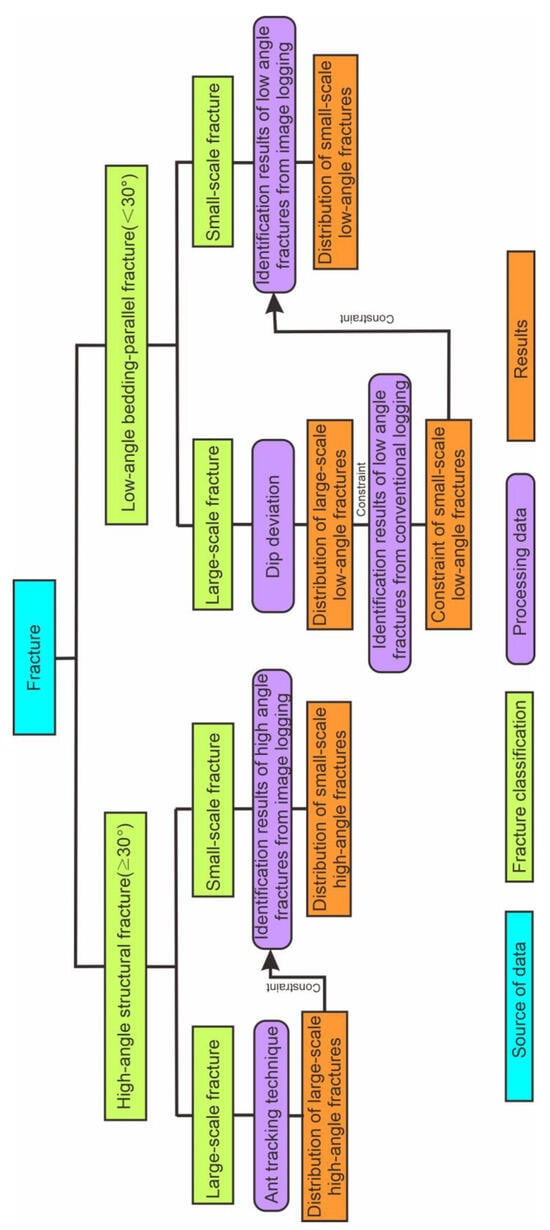
Figure 2.
A flowchart showing the steps to predict the distribution of different dip-angle fractures.
3.2.1. Prediction of High-Angle Fracture
Ant-tracking technology is widely recognized as an effective method for predicting high-angle fractures, with its reliability validated across multiple oilfields [36,37]. This technique employs the ant algorithm to extract fracture-related attributes from seismic data, enabling the prediction of large-scale high-angle fracture distributions.
The ant algorithm is inspired by the foraging behavior of natural ants. Within a seismic volume, an initial ant boundary is defined, allowing a large number of virtual ants to be evenly distributed throughout the volume. When a grid meets preset conditions (e.g., corresponding to faults or fractures), ants within that grid release pheromones, attracting ants from other grids to continue tracking grids that satisfy the preset conditions. Through this positive feedback mechanism, faults or fractures are tracked and marked.
Ant-tracking technology typically involves four key steps: preprocessing of seismic data, generation of seismic ant attribute volumes, extraction of fracture surfaces, and establishment of the final fracture interpretation model [38,39]. Its application requires the configuration of six parameters: initial ant boundary, ant track deviation, ant step size, allowed illegal steps, required legal steps, and stop criteria. The function of each parameter and its values in this study are detailed in Table 1. Notably, this method primarily targets high-angle fractures (>30°) and does not account for low-angle fractures (≤30°).

Table 1.
Values of different parameters of ant-tracking technology in KT-I Formation of NT oilfield.
High-angle fractures identified via imaging logging were interpolated between wells using a Gaussian random function simulation, constrained by the prediction results of large-scale fractures. The major and minor ranges were set to 3000 m and 2500 m, respectively. These steps were used to construct the density volume of small-scale high-angle fractures.
3.2.2. Prediction of Low-Angle Fractures
Stratum dip-angle processing calculates the dip angle of seismic reflection waves by comparing changes in adjacent seismic traces, while dip deviation quantifies the lateral variation in stratum dip angles. Dip deviation processing can track signals with rapid dip angle changes along specific directions and exhibits strong responses to low-angle faults. Thus, seismic data volumes processed via dip deviation were used to predict low-angle fault distributions, providing constraints for low-angle fracture analysis.
To address the high costs of coring and imaging logging, various methods have been proposed to predict single-well fractures using conventional logging data [40,41]. Studies have confirmed that dual laterolog and tri-porosity logging show strong responses to fractures, with conventional logging achieving relatively high identification rates for low-angle fractures [42,43,44]. In this study, low-angle fracture prediction was performed using the three-porosity ratio (Rp) and resistivity correction for invasion relative difference ratio (RTC) [40].
The Rp calculation process is as follows:
where ΦN is the neutron porosity, ΦD is the density porosity, ΦS is the acoustic porosity, and ΦT is the total porosity. Neutron porosity and density porosity are the total rock porosity, while acoustic logging mainly reflects the porosity of the rock matrix; thus, the constructed Rp mainly reflects the secondary porosity. When Rp > 0, it shows that fractures exist there. The larger the Rp is, the more the fractures develop. Therefore, the results of the Rp can be used to evaluate the fracture intensity.
The steps of fracture prediction by using RTC are as follows:
where RTC is the ratio between the difference in deep and shallow laterolog and the shallow laterolog, Rlls is the value of the shallow laterology, and Rt is the value of formation invasion-corrected resistivity. The calculation formula of Rt is Rt = 2.589Rlld − 1.589Rlls, where Rlld is the value of deep laterology. When RTC ≥ 0, the well interval develops high-angle fractures. When RTC < 0, the well interval develops low-angle fractures. However, due to the influence of fluid in fractures and the filling degree of fractures, sometimes the RTC has a low identification rate for the low-angle fractures. The dual laterolog is the only conventional logging method that can identify fracture dip angles.
Comparison of fracture identification results from RTC and Rp with those from imaging logging reveals that RTC exhibits a high recognition rate for high-angle fractures (72%) but a low rate for low-angle fractures (28%), which is primarily attributed to the influence of fracture fluids and filling degree. In contrast, Rp achieves a high recognition rate for low-angle fractures (80%) but a low rate for high-angle fractures (40%) [45]. Notably, fracture dip angles in these analyses are determined via imaging logging.
Evidently, RTC is suitable for predicting high-angle fracture distributions but unsuitable for low-angle fractures in the study area due to its low recognition rate for the latter. Rp identification results, however, encompass both high-angle and low-angle fractures; thus, it cannot be directly used to predict low-angle fractures alone, as it also identifies some high-angle fractures (albeit with low efficiency).
To address this, the criterion RTC ≥ 0 was employed to distinguish high-angle fractures within Rp-identified fractures. For intervals where Rp identifies fractures and RTC ≥ 0, the fractures are classified as high-angle, and the corresponding Rp value is set to 0. Conversely, for intervals where Rp identifies fractures and RTC < 0, the fractures are classified as low-angle, with the original Rp value retained (Figure 3a,b). The resulting Rp values, filtered using the RTC ≥ 0 criterion, represent the intensity of low-angle fractures.
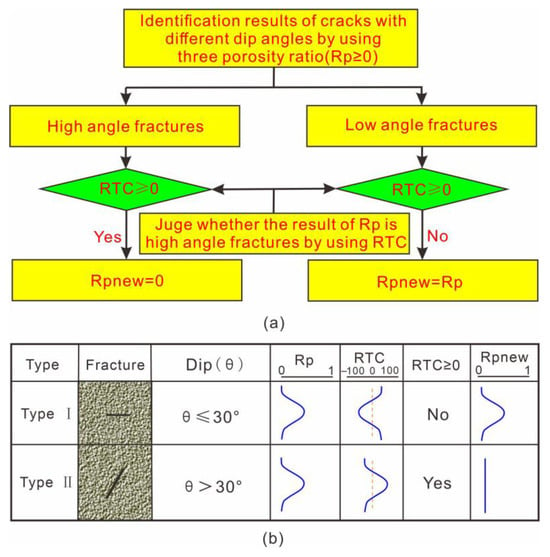
Figure 3.
Flow chart of fracture identification by using conventional logging. (a) Fracture identification was processed by using conventional logging. (b) Identification results of different dip-angle fractures.
Through the above steps, the fracture intensity of a single-well low-angle fracture is obtained, and the constrained body of low-angle fractures is established by interwell interpolation for conventional logging using a Gaussian random function simulation with the constraint of seismic data processed by dip deviation [46]. The major range and the minor range were set to 2500 m and 2000 m, respectively. The density body of small-scale low-angle bedding-parallel fractures was built up by implementing interwell interpolation for imaging logging with the constraint of the constrained body of low-angle fractures established by conventional logging and seismic data.
3.3. Fracture Modeling
Previous workers have put forward that fractures can be grouped according to the fracture strike to accurately characterize the fractures in different directions [7,12,47]. This method cannot be applied to characterize the fractures in our study area because of the existence of both high-angle fractures and low-angle fractures. Hence, the fractures were grouped according to both the strike and the dip angles of fractures in this study. The fractures in the study area were divided into five groups according to the strikes and dip angles of fractures, including the NE high-angle fractures, SE high-angle fractures, SW high-angle fractures, NW high-angle fractures, and low-angle fractures; and every well with image-logging data can divide the fractures into these five groups, such as well L-6 and well CT-10 (Figure 4a,b). According to the proportion of the number of fractures in different groups in the study area, the constraints of high-angle fractures in the different strikes were established.
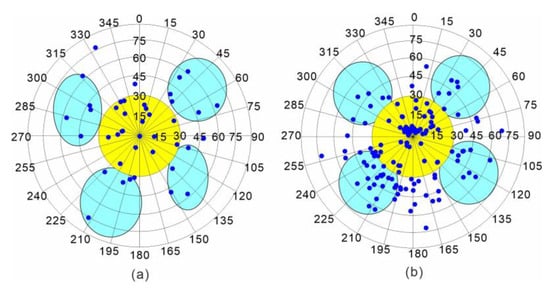
Figure 4.
Results of fracture grouping in different groups according to imaging logging. (a) Rose diagram of well L-6 (N = 42). (b) Rose diagram of well CT-10 (N = 150). The low-angle fractures group is showed in yellow.
The discrete small-scale high-angle fracture network and the discrete small-scale low-angle fracture network were established, respectively, with the constraints of high-angle fracture density body and low-angle fracture density body. The fractures are simulated by a rectangle with an aspect ratio of 2:1. The fracture length is obtained according to well test analysis and core data.
Previous studies have believed that there is a correlation between fracture length and aperture [48]. The relationship between fracture length and opening, according to the statistical results of imaging logging, is as follows (Figure 5):
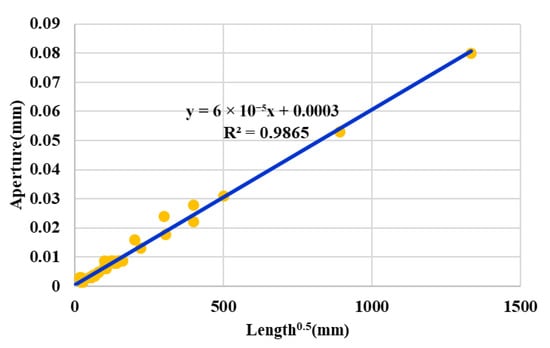
Figure 5.
Relationship between length and aperture in KT-I Formation of NT oilfield.
The meter is the unit of length and aperture. After the above parameters were set, the fractures were upscaled by applying the Oda method [49], which calculated the porosity and permeability of fractures in each grid according to the fracture aperture, length, and area.
4. Results
4.1. Fracture Characteristics
The genetic types of high- and low-angle effective fractures reveal four distinct fracture types in the study area: structural fractures, bedding-parallel fractures, dissolution fractures, and stylolites, with stylolites being nearly fully filled (Figure 6).

Figure 6.
Fracture identification results according to the core. (a) Structural fractures. (b) Bedding-parallel fractures. (c) Dissolution fractures. (d) Stylolites. The yellow arrow is used to tip readers what is the core information in the Figure.
Low-angle effective fractures dominate the study area, accounting for 76.4% (Figure 7a). High-angle effective fractures are predominantly structural fractures, while low-angle effective fractures are primarily bedding-parallel fractures (Figure 7b,c). High-angle dissolution fractures are mainly derived from structural fractures, and low-angle dissolution fractures chiefly originate from bedding-parallel fractures.
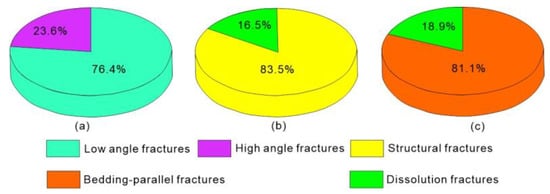
Figure 7.
Proportion of different genetically effective fractures in cores. (a) Proportion of different dip-angle fractures (N = 1152). (b) Proportion of different genetic high-angle effective fractures (N = 272). (c) Proportion of different genetic low-angle effective fractures (N = 880).
Thus, predicting high-angle fractures in the study area primarily involves mapping the distribution of structural fractures, whereas predicting low-angle fractures focuses on characterizing the distribution of bedding-parallel fractures.
Well test analysis displays that the average length of fractures in the study area is 164 m (Table 2). The length of fractures obtained from well test analysis is the weighted mean of the length of high-angle fractures and low-angle fractures. According to the coring data, the average length of high-angle fractures and low-angle fractures is 105.42 mm and 86.81 mm, respectively (Figure 8). The average length of low-angle fractures in the core is about 82.34% of the average length of high-angle fractures. The proportion of the number of high-angle fractures and low-angle fractures in the core is 23.6% and 76.4%, respectively. According to the relationship between the average length of low-angle fractures and the average length of high-angle fractures, and the proportion of the number of high-angle fractures and low-angle fractures in the core, the length of low-angle fractures and high-angle fractures can be obtained:
where the H is the length of the high-angle fractures, and the L is the length of the low-angle fractures. The average length of high-angle fractures and low-angle fractures is 189.57 m and 156.09 m, respectively. Therefore, the parameters of different fracture groups were set as Table 3.

Table 2.
Well-testing data in the NT oilfield.
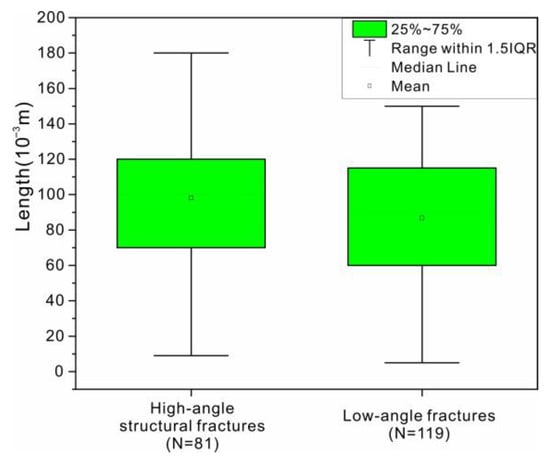
Figure 8.
The length of high-angle fractures and low-angle fractures in the core in the NT oilfield.

Table 3.
Values of parameters of the discrete fracture network.
In addition to the length factor, aperture is another key parameter affecting underground fluid seepage. Both structural fractures and bedding fractures are Type II sliding fractures. By statistically analyzing the relationship between fracture aperture and cumulative number, it was found that the apertures of both structural fractures and bedding fractures exhibit the characteristics of a power function distribution, and the smaller the aperture, the greater the cumulative number of fractures (Figure 9).
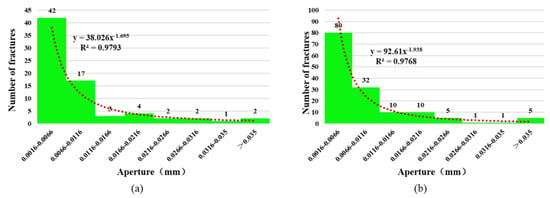
Figure 9.
Distribution features for structural fractures and bedding-parallel fractures. (a) Distribution features for structural fractures. (b) Distribution features for bedding-parallel fractures.
4.2. Distribution of Different Dip-Angle Fractures
4.2.1. Distribution of Large-Scale Fractures
Predictions of large-scale fractures based on seismic data processed via ant-tracking show that these fractures are distributed along faults, and their distribution indicates that faults control small-scale fractures (Figure 10).
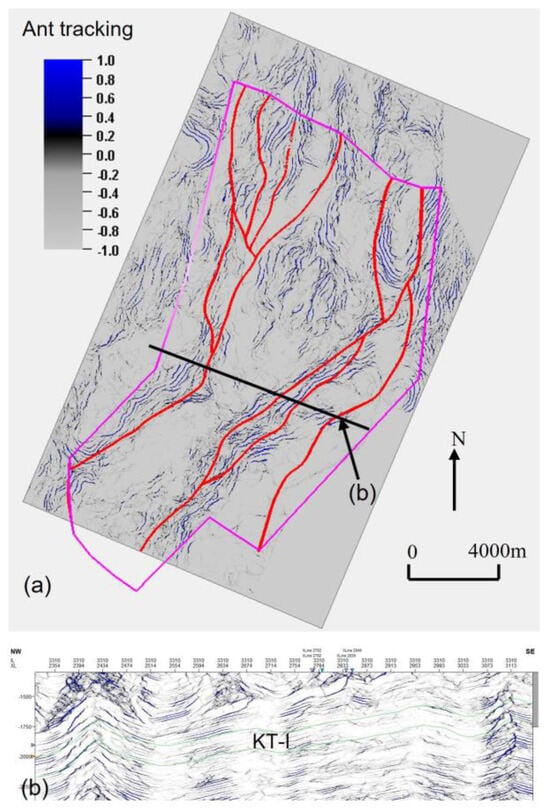
Figure 10.
Distribution of large-scale fractures. (a) Time slice of T = −2060 s for the ant-tracking results. (b) Section of ant-tracking results.
4.2.2. Distribution of Small-Scale High-Angle Fractures
Fracture prediction results show that the distribution of small-scale high-angle fractures has two features: (1) Fractures are more developed at the high part of the anticline than the low part of the anticline; (2) fractures are primarily developed near to the faults (Figure 11).
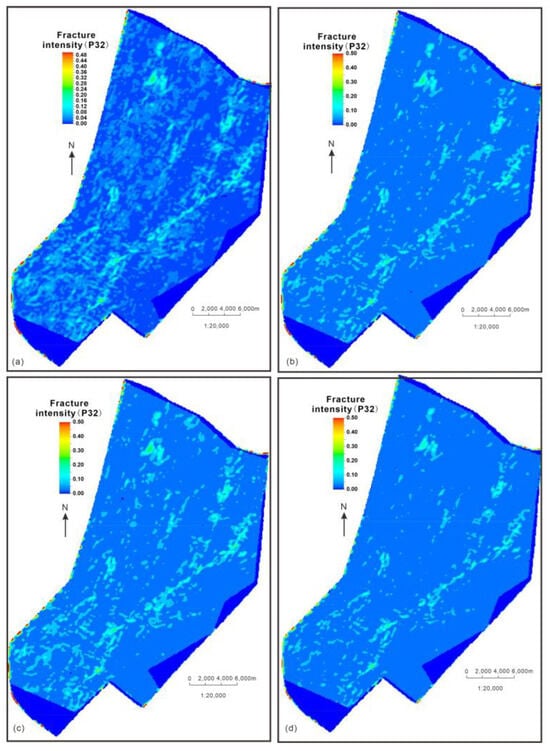
Figure 11.
Distribution of small-scale high-angle fractures. (a) Distribution of high-angle fractures in the northeast direction. (b) Distribution of high-angle fractures in the southeast direction. (c) Distribution of high-angle fractures in the southwest direction. (d) Distribution of high-angle fractures in the northwest direction.
4.2.3. Prediction Results of Small-Scale Low-Angle Fractures
The discrepancy between the dip trend and the instantaneous dip supports the prediction of low-angle fractures. Low-angle fractures predicted from the dip deviation data volume are predominantly distributed in the limbs of the anticline, which is consistent with core observations. This validates the accuracy of the predictions (Figure 12).
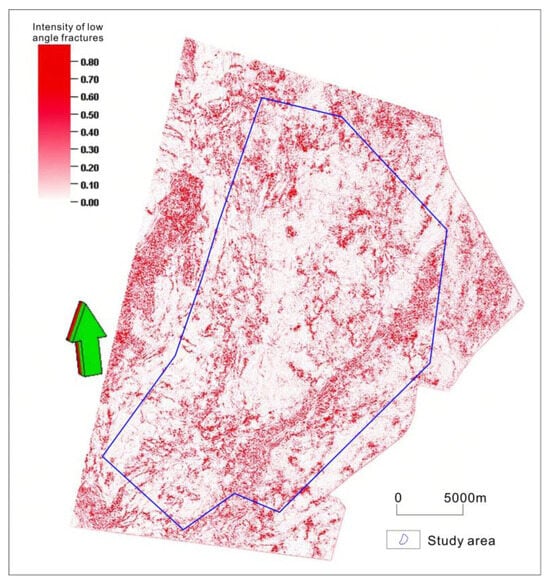
Figure 12.
Fracture prediction results of low−angle fractures using dip deviation data volume.
The prediction results of low-angle fractures, according to the seismic data processed by dip deviation, have an excellent correspondence with the low-angle fractures identified by imaging logging vertically, suggesting that the seismic data processed by dip deviation can be used to predict the distribution of low-angle fractures (Figure 13).
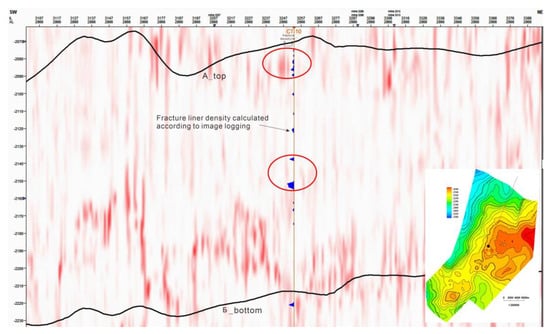
Figure 13.
Comparison between low−angle fracture identification results of dip deviation data volume and imaging logging.
The small-scale low-angle fractures in the study area were also successfully predicted by the comprehensive application of Rp and RTC. The accuracy of the prediction results is as high as 78% (Figure 14), demonstrating that the proposed fracture prediction method in this paper can be applied to predict the low-angle fractures in the study area.
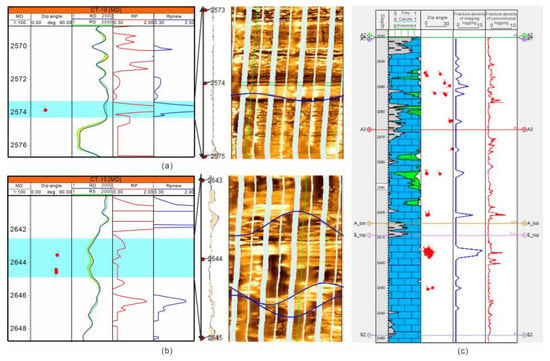
Predictions of small-scale low-angle fractures indicate that bedding-parallel low-angle fractures are predominantly developed in the limbs of the anticline. Li et al. [50] have discussed the origin of this phenomenon in detail from a mechanical perspective. During the formation of low-angle fractures, the burial depth of the limbs of the present-day anticline was relatively shallow, and the strata in this zone formed a certain angle with the Earth’s horizontal plane, which facilitated the formation of low-angle fractures (Figure 15).
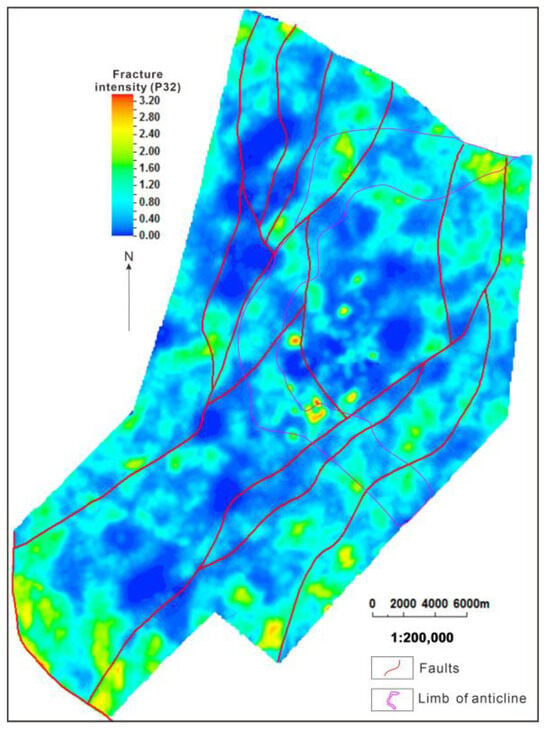
Figure 15.
Distribution of low-angle fractures.
4.3. Fracture Modeling Results
The grid cell of the modeling is divided into 80 m (length) × 80 m (width) × 1 m (height). The modeling was upscaled by using the Oda method [49], and the results display that the porosity and permeability of fractures in the study area are mainly distributed between 0~0.27% and 10~100 mD, respectively (Figure 16).
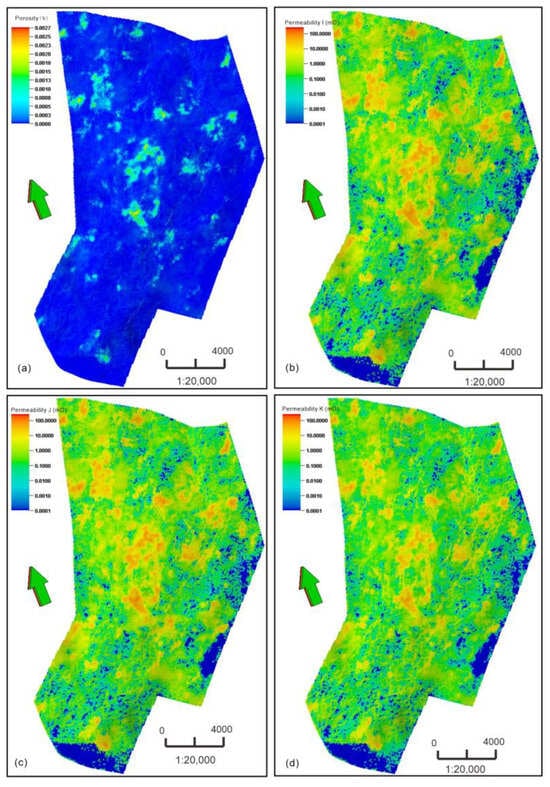
Figure 16.
Fracture porosity model and permeability model in the NT oilfield. (a) Distribution of fracture porosity. (b) Distribution of fracture permeability in the I direction. (c) Distribution of fracture permeability in the J direction. (d) Distribution of fracture permeability in the K direction.
5. Discussion
5.1. Model Accuracy Verification
The primary metric for evaluating the accuracy of static models is the ability of numerical simulations to match field dynamic data via history matching [51]. History matching aims to align simulated reservoir performance with actual field behavior as closely as possible. The degree of agreement between simulated and actual reservoir performance, thus, serves as a measure of the geological model’s accuracy.
Numerical simulations were performed using the three-dimensional, three-phase black oil model in Eclipse 2011 software. History matching was conducted with a monthly time step, and oil wells were operated under a constant fluid production regime. Results indicate good agreement between simulated and actual performance, as evidenced by the fitting curves for comprehensive water cut, cumulative liquid production, and formation pressure (Figure 17a–c). Fitting errors for these parameters are all within 3%, confirming the accuracy of the established reservoir geological model.
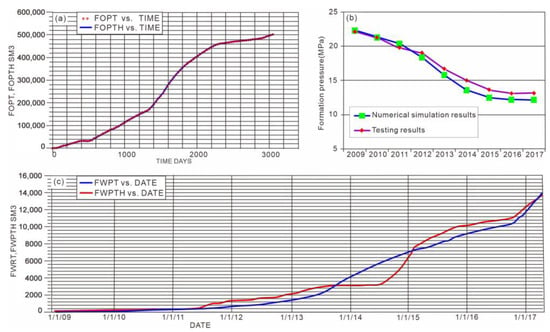
Figure 17.
Fitting result of numerical simulation. (a) Comparison between actual oil production and predicted oil production. FOPT is the simulated oil production data, and the FOPTH is the actual oil production data. (b) Comparison between actual formation pressure and predicted formation pressure. FWPT is the simulated water production data, and the FWPTH is the actual water production data. (c) Comparison between actual water production and predicted water production.
Model accuracy is further validated using tracer test results. Changhai Li et al. [31] utilized the fracture-modeling results to analyze water-flooding mechanisms, and the distribution of the complex fracture network provides a reasonable explanation for such behavior. This supports the reliability of our modeling results (Figure 18).
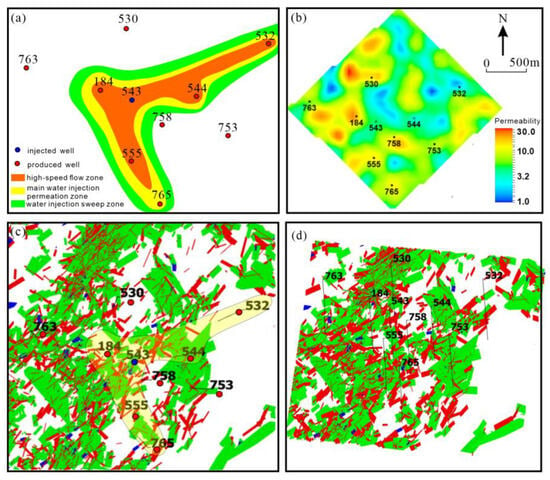
Figure 18.
Comparison of tracer outcomes and complex fracture networks [31]. (a) Tracer outcomes of well group 543. (b) Matrix permeability distribution of well group 543. (c,d) Distribution of complex fracture networks in well group 543.
5.2. Impacts of Fractures with Different Dip Angles on Oilfield Development
5.2.1. Impact of Different Dip-Angle Fractures on Initial Productivity
Cross-plots were used to analyze relationships between high-angle fracture density, low-angle fracture density, total fracture linear density, and single-well initial production. Results show that single-well initial production in the study area increases with rising fracture density, with high-angle fractures providing a greater enhancement to initial production than low-angle fractures.
The observed weak correlation between fracture intensity and oil production per meter stems from the multi-factorial controls on productivity. These include macroscopic elements such as sedimentary facies, diagenetic history, and tectonic setting, alongside microscopic reservoir properties like lithology, pore types, and porosity–permeability relationships [52]. Moreover, fracture density is but one attribute of a fracture network influencing flow; other critical factors, including fracture aperture and length, also exert significant control.
Cross-plot analysis further reveals that the correlation between low-angle fracture intensity and the oil production index per meter is weaker than that for the total fracture population, indicating that its relationship is influenced by the presence of high-angle fractures. Conversely, the correlation for high-angle fracture intensity alone is also comparatively low.
At a high-angle fracture linear density of 1.5 m−1, initial production is 6.2 m3/(d·MPa·m); at a low-angle fracture linear density of 1.5 m−1, initial productivity is 3.5 m3/(d·MPa·m). Thus, the contribution of low-angle fractures to reservoir production in the NT oilfield is approximately 56.45% that of high-angle fractures (Figure 19).
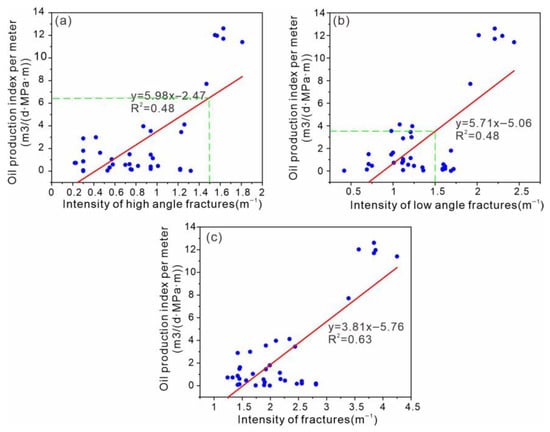
Figure 19.
Relationship between fracture linear density and initial productivity of a single well in the NT oilfield. (a) Relationship between high-angle fracture linear density and initial productivity of a single well in the NT oilfield. (b) Relationship between low-angle fracture linear density and initial productivity of a single well in the NT oilfield. (c) Relationship between fracture linear density and initial productivity of a single well in the NT oilfield.
5.2.2. Influence of Fractures with Different Dip Angles on Production Decline Rate
Fractures also exert a significant impact on single-well production decline rates. Cross-plots analyzing relationships between high-angle fracture density, low-angle fracture density, total fracture linear density, and single-well production decline rates reveal that decline rates increase with rising fracture linear density. Additionally, single-well production decline rates are higher in zones with high-angle fractures than in those with low-angle fractures (Figure 20).
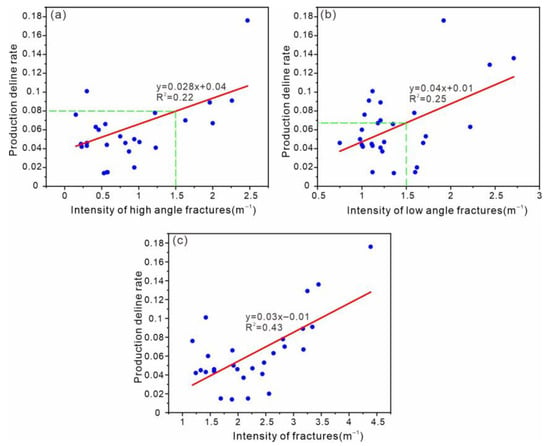
Figure 20.
The relationship between fracture density and production decline rate of a single well. (a) Relationship between low-angle fracture linear density and single-well decline rate. (b) Relationship between high-angle fracture linear density and single-well decline rate. (c) Relationship between total fracture linear density and single-well decline rate.
Similarly to oil production per meter, decline rates are influenced by factors such as reservoir lithology, reservoir space type, and porosity–permeability. However, a positive correlation trend is evident, indicating that fracture intensity affects production decline rates. Fracture development accelerates formation energy depletion in zones with high-angle fractures, resulting in high production decline rates in areas with high fracture density.
At a high-angle fracture linear density of 1.5 m−1, the single-well production decline rate is 0.080; at a low-angle fracture linear density of 1.5 m−1, the decline rate is 0.067. The influence of low-angle fractures on production decline is approximately 83.75% that of high-angle fractures.
6. Conclusions
For the NT oilfield, which develops complex fracture networks, predicting and modeling fractures requires consideration of both high-angle structural fractures and low-angle bedding-parallel fractures. Coring data analysis indicates that high-angle effective fractures in the NT oilfield are primarily structural, while low-angle effective fractures are predominantly bedding-parallel, with the latter being more developed than the former.
High-angle and low-angle fractures were predicted using imaging logging, conventional logging, and seismic data. High-angle fracture distribution was derived from seismic data processed via ant-tracking technology combined with imaging logging data, whereas low-angle fracture distribution was determined using seismic data processed for dip deviation, alongside conventional and imaging logging data. High-angle fractures are mainly distributed along faults, while low-angle fractures are concentrated in anticline limbs.
A fracture modeling scheme accounting for both high-angle and low-angle fractures was proposed, involving grouping fractures by their strike and dip angle. Fractures were categorized into northeast high-angle, southeast high-angle, southwest high-angle, northwest high-angle, and low-angle groups. Modeling results show that fracture porosity in the study area ranges from 0 to 0.27%, with permeability ranging from 0 to 100 mD.
The coexistence of high-angle and low-angle fractures significantly influences single-well initial production and production decline rates. Increasing fracture density correlates with increased single-well initial production and production decline rates, with high-angle fractures exerting a greater impact on both parameters than on low-angle fractures.
Funding
This work was supported by Technology and Application of Economic Development in Liquid-Rich Zones of Canadian Ultra-Tight Condensate Gas Reservoirs (JP25054) and the CNPC Basic and Prospective Key Scientific and Technological Project (2021DJ24).
Data Availability Statement
All the data generated or analyzed during this study are included in this published article.
Acknowledgments
The authors would like to thank the anonymous reviewers for their comments and very helpful suggestions.
Conflicts of Interest
Author Changhai Li was employed by Sinopec International Petroleum Exploration and Development Corporation. The authors declare that the research was conducted in the absence of any commercial or financial relationships that could be construed as a potential conflict of interest.
References
- Nelson, R. Geologic Analysis of Naturally Fractured Reservoirs; Gulf Publishing: Houston, TX, USA, 2001; 320p. [Google Scholar]
- Lavenu, A.P.; Lamarche, J. What controls diffuse fractures in platform carbonates? insights from Provence (France) and Apulia (Italy). J. Struct. Geol. 2018, 108, 94–107. [Google Scholar] [CrossRef]
- Laubach, S.E.; Lamarche, J.; Gauthier, B.D.; Dunne, W.M.; Sanderson, D.J. Spatial arrangement of faults and opening-mode fractures. J. Struct. Geol. 2018, 108, 2–15. [Google Scholar] [CrossRef]
- Wu, G.; Zhao, K.; Qu, H.; Scarselli, N.; Zhang, Y.; Han, J.; Xu, Y. Permeability distribution and scaling in multi-stages carbonate damage zones: Insight from strike-slip fault zones in the Tarim basin, NW China. Mar. Pet. Geol. 2020, 114, 104208. [Google Scholar] [CrossRef]
- Dan, L.; Shi, C.; Wem, J.; Wei, L.; Zhang, X.; Zhang, J. Application of multi-information fusion modeling technology for fractures in du-al-medium carbonate reservoir. Pet. Geol. Recovery Effic. 2022, 29, 46–52. [Google Scholar] [CrossRef]
- Tran, N.H. Characterisation and Modelling of Naturally Fractured Reservoirs; University of New South Wales Australia: Sydney, Australia, 2004; pp. 1–220. [Google Scholar]
- Mendez, J.N.; Jin, Q.; González, M.; Zhang, X.; Lobo, C.; Boateng, C.D.; Zambrano, M. Fracture characterization and modeling in karsted carbonate reservoirs: A case study in Tahe oilfield, Tarim basin (Western China). Mar. Pet. Geol. 2019, 112, 104104. [Google Scholar] [CrossRef]
- Taheri, K.; Alizadeh, H.; Askari, R.; Kadkhodaie, A.; Hosseini, S. Quantifying fracture density within the Asmari reservoir: An integrated analysis of borehole images, cores, and mud loss data to assess fracture-induced effects on oil production in the Southwestern Iranian Region. Carbonates Evaporites 2024, 39, 8. [Google Scholar] [CrossRef]
- Li, H.; You, Y.; Ceng, D.; Liu, G.; Zheng, W.; Zhang, R. 3D geological modeling of strongly heterogeneous dual-medium deep carbonate reservoirs: A case study of Feixianguan-Changxing Formations in Puguang Gas Field. Pet. Geol. Recovery Effic. 2024, 31, 44–53. [Google Scholar] [CrossRef]
- Liu, W.; Ning, Y.; Wang, H.; Cheng, J.; Lu, Y.; Wang, Y. The application of the technique of quantitatively characterizing double -porosity medium in the development of complex reef-limestone oilfields: A case of LH4-1 oilfield, Pearl river mouth basin. China Offshore Oil Gas 2014, 26, 65–71. [Google Scholar]
- Tanaka, A.P.B.; Borges, J.P.G.; de Matos, G.C.; Campos, M.T.R.; Cunha, B.M.; de Souza, R.B.; de Moraes Caldeira, J.N.; de Oliveria, T.A.; Macron, D.R.; Lima, A.P.M. Fault-related fracture modeling in a pre-salt lacustrine carbonate reservoir from Santos Basin, offshore Brazil: Predicting preferential fluid flow paths using 3D geological and flow simulation models. Mar. Pet. Geol. 2022, 135, 105392. [Google Scholar] [CrossRef]
- Di, Z. Research and application of geological modeling technology under the condition of binary medium—A case study of Capella oilfield in Colombia. Sino-Glob. Energy 2015, 20, 41–44. [Google Scholar]
- Yan, W.; Zhu, X.; Zhang, Q.; Gu Li Zhang, Q.; Zhang, Z.; Wang, X. The fissure type and characteristics of Liugouzhuang-Kulongshan reservoir in Qingxi depression. Pet. Explor. Dev. 2002, 29, 80–83. [Google Scholar]
- Liu, H.; Lei, W.U.; Cao, L.; Liu, B. Study of characteristics of sub-salt gypsum carbonate reservoir on the right bank of Amudar′ya basin. J. Oil Gas Technol. 2014, 29, 80–83. [Google Scholar]
- Du, G.; Hui, C.; Zhang, S.; Cao, Q. Development pattern and genesis of fractures in block l of Khorat basin. Spec. Oil Gas Reserv. 2016, 23, 21–25. [Google Scholar]
- Lianbo, Z.; Xiangyang, L. Fractures in sandstone reservoirs with ultra-low permeability: A case study of the upper triassic yanchang formation in the Ordos basin, China. Aapg. Bull. 2009, 93, 461–477. [Google Scholar] [CrossRef]
- Li, C.; Zhao, L.; Liu, B.; Liu, H.; Li, J.; Fan, Z.; Wang, J.; Li, W.; Zhao, W.; Sun, M. Origin, distribution and implications on production of bedding-parallel fractures: A case from the carboniferous KT-I formation in the NT oilfield, Precaspian basin, Kazakhstan. J. Pet. Sci. Eng. 2021, 107655. [Google Scholar] [CrossRef]
- Chen, Y.; Zhao, L.; Hou, J.; Li, Y.; Wang, S.; Li, J. Carboniferous sequence stratigraphy and sedimentary evolution in the North Troyes Oilfield, eastern margin of the Pre-Caspian Basin. J. Paleogeogr. 2024, 26, 58–74. [Google Scholar]
- Guo, K.; Fan, L.; Jin, S.; Cheng, X.; Sheng, S.; Wu, J. Identification of Carboniferous carbonate platform margin and its distribution characteristics in the eastern margin of the Pre-Caspian Basin. Pet. Geol. Eng. 2023, 37, 23–30. [Google Scholar]
- Tang, X.S.; Tan, X.C.; Liu, H. Characteristics and development mechanism of dolomite and dolomitic quartzite reservoirs of the middle permian maokou formation in eastern Sichuan basin. Oil Gas Geol. 2016, 37, 731–743. [Google Scholar]
- Zhao, L.; Wang, S.; Zhao, W.; Luo, M.; Wang, C.; Cao, H.; He, L. Combination and distribution of reservoir space in complex carbonate rocks. Pet. Sci. 2016, 13, 450–462. [Google Scholar] [CrossRef][Green Version]
- Ling, H. Evaluation of fracture-porosity carbonate reservoirs with conventional logging data. J. Oil Gas Technol. 2010, 32, 258–262. [Google Scholar][Green Version]
- Lu, B.; Li, L.; Lu, J.; Wang, S.; Chen, Y.; Tan, X. Eogenetic karst characteristics and diagenetic facies types of Carboniferous KT-I layer in B Oilfield, eastern margin of Pre-Caspian Basin. Nat. Gas Geosci. 2023, 35, 1031–1043. [Google Scholar] [CrossRef]
- Wang, S.; Li, J.; Zhao, W.; Sun, M.; Zhang, D. Study on carbonate reservoir diagenesis of the eastern margin of the caspian basin—A case study on North Truva oilfield. In Proceedings of the 2015 International Conference on Advanced Engineering Materials and Technology, Guangzhou, China, 22–23 August 2015; pp. 615–619. [Google Scholar]
- Shi, X.; Chen, X.; Wang, J.; Li, Z.; Jin, S.; Guo, H.; Zhu, M. Geochemical characteristics of the carboniferours KT-I interval dolostone in eastern margin of coastal caspian sea basin. J. Palaeogeogr. 2012, 14, 777–785. [Google Scholar]
- Wang, S.; Zhao, L.; Cheng, X.; Fan, Z.; He, L. Geochemical characteristics and genetic model of dolomite reservoirs in the eastern margin of the pre-caspian basin. Pet. Sci. 2012, 9, 161–169. [Google Scholar] [CrossRef]
- Liang, S.; Wang, Y.; Jin, S.; Wang, Z.; Zheng, J. Controlling of tectonic evolution on hydrocarbon occurrence in pre-caspian basin. Pet. Geol. Exp. 2013, 35, 174. [Google Scholar]
- Volozh, Y.A.; Antipov, M.P.; Brunet, M.; Garagash, I.A.; Lobkovskii, L.I.; Cadet, J. Pre-mesozoic geodynamics of the precaspian basin (Kazakhstan). Sediment. Geol. 2003, 156, 35–58. [Google Scholar] [CrossRef]
- Li, C.; Zhao, L.; Li, J.; Wang, S.; Li, W. Structural fracture formation stages in the eastern margin of the caspian basin and genesis of low-angle structural fracture. Spec. Oil Gas Reserv. 2019, 26, 56–61. [Google Scholar]
- Ling, H. Petrophysical Evaluation the Microfracture-Typed Complex Carboniferous Carbonate Reservoir in the Eastern Margin of the Caspian Sea Basin; Yangtze University: Wuhan, China, 2015; pp. 1–156. [Google Scholar]
- Li, C.; Zhao, L.; Liu, B.; Zhao, W.; Wang, S.; Li, J.; Zheng, T.; Li, W. Connectivity of fracture networks of Carboniferous carbonate reservoirs in North Truva Oilfield, eastern margin of Precaspian Basin. Lithol. Reserv. 2024, 36, 113–123. [Google Scholar]
- Yang, H.; Bin, X.; Yankun, W. Tectonic evolution and hydrocarbon accumulation model in eastern precaspian basin. Sediment. Geol. Tethyan Geol. 2014, 34, 78. [Google Scholar]
- Liu, D.; Dou, L.; Hao, Y.; Zhang, Y. The origin of hydrocarbon accumulation below the lower permian salt bed and the prospecting in the east part of pre-caspian basin. Mar. Orig. Petoleum Geol. 2004, 9, 53–58. [Google Scholar]
- Chen, Y.; Cai, D.; Fan, Z.; Li, K.; Jun, N.I. 3D geological modeling of dual porosity carbonate reservoirs: A case from the Kenkiyak pre-salt oilfield, Kazakhstan. Pet. Explor. Dev. 2008, 35, 492–497. [Google Scholar] [CrossRef]
- Bourbiaux, B.; Basquet, R.; Daniel, J.M.; Hu, L.Y.; Jenni, S.; Lange, G.; Rasolofosaon, P. Fractured reservoirs modelling: A review of the challenges and some recent solutions. First Break 2005, 23, 33–40. [Google Scholar] [CrossRef]
- Hui, Y. Application of ant tracking technology in fine interpretation of seismic data. China Energy Environ. Prot. 2017, 39, 21–26. [Google Scholar]
- Basir, H.M.; Javaherian, A.; Yaraki, M.T. Multi-attribute ant-tracking and neural network for fault detection: A case study of an iranian oilfield. J. Geophys. Eng. 2013, 10, 015009. [Google Scholar] [CrossRef]
- Liang, Y.; Liu, P.; Feng, G. Modeling of fractured reservoirs based on ant tracking technology. Complex Hydrocarb. Reserv. 2014, 7, 11–15. [Google Scholar]
- Cox, T.; Seitz, K. Ant Tracking Seismic Volumes for Automated Fault Interpretation; CSPG CSEG Convention: Calgary, AB, Canada, 2017. [Google Scholar]
- Wang, Y. Cheng-Bei carbonate reservoir fracture identification and quantitative interpretation. Xinjiang Pet. Sci. Technol. 2012, 22, 35–38. [Google Scholar]
- Li, D. Study on the Methodology of Fracture Identification from Conventional Logging Curve; China University of Petroleum: Beijing, China, 2016; pp. 1–44. [Google Scholar]
- Guichao, D.; Shuangquan, H.; Hui, C. The identification method of low angle fracture by analysis of conventional logging data and its application in carbonate reservoirs. Chin. J. Eng. Geophys. 2016, 13, 590–594. [Google Scholar]
- Saboorian-Jooybari, H.; Dejam, M.; Chen, Z.J.; Pourafshary, P. Fracture identification and comprehensive evaluation of the parameters by dual laterolog data. In Proceedings of the Society of Petroleum Engineers, SPE Middle East Unconventional Resources Conference and Exhibition, Muscat, Oman, 26–28 January 2015; pp. 21–36. [Google Scholar]
- Lang, X.L.; Guo, S.J. Fractured reservoir modeling method based on discrete fracture network model. Acta Sci. Nat. Univ. Pekin. 2013, 49, 964–972. [Google Scholar]
- Lei, H. Reasearch on Fissured Carbonate Reservoir Prediction in the Central Block of Pre-Caspian Basin; China University of Geoiscience: Beijing, China, 2011; pp. 1–63. [Google Scholar]
- Jika, H.T.; Onuoha, M.K.; Okeugo, C.G.; Eze, M.O. Application of sequential indicator simulation, sequential Gaussian simulation and flow zone indicator in reservoir-E modelling Hatch Field Niger Delta Basin, Nigeria. Arab. J. Geosci. 2020, 13, 410. [Google Scholar] [CrossRef]
- Long, J.C.; Billaux, D.M. From field data to fracture network modeling: An example incorporating spatial structure. Water Resour. Res. 1987, 23, 1201–1216. [Google Scholar] [CrossRef]
- Schultz, R.A.; Soliva, R.; Fossen, H.; Okubo, C.H.; Reeves, D.M. Dependence of displacement–length scaling relations for fractures and deformation bands on the volumetric changes across them. J. Struct. Geol. 2008, 30, 1405–1411. [Google Scholar] [CrossRef]
- Oda, M. Permeability tensor for discontinuous rock masses. Geotechnique 1985, 35, 483–495. [Google Scholar] [CrossRef]
- Li, C.; Zhao, L.; Liu, B.; Li, W.; Shi, K.; Zhao, W.; Li, J.; Zhu, Q.; Li, Y.; Ma, C. Formation mechanical mechanism of low-angle fractures in pre-salt carbonate reservoirs: A case study from Carboniferous KT-I formation of the NT oilfield in the eastern margin of the Precaspian Basin, Kazakhstan. J. Pet. Explor. Prod. Technol. 2024, 14, 1707–1731. [Google Scholar] [CrossRef]
- Dan, L.; Chao, M.A.; Shi, C.; Yao, W.; Yin, Y. 3D geological modeling of dual-porosity carbonate reservoir in M oilfield, Iraq. Complex Hydrocarb. Reserv. 2018, 11, 42–46. [Google Scholar]
- Zhang, D.; Wang, S.; Zhao, W.; Fan, Z.F.; Li, Z.P. The main geological control factors of single well productivity for carbonate reservoir: Take the reservoir formation KT-I in North Truva field, Kazakhstan as example. Acta Petrol. Sin. 2016, 32, 903–914. [Google Scholar]
Disclaimer/Publisher’s Note: The statements, opinions and data contained in all publications are solely those of the individual author(s) and contributor(s) and not of MDPI and/or the editor(s). MDPI and/or the editor(s) disclaim responsibility for any injury to people or property resulting from any ideas, methods, instructions or products referred to in the content. |
© 2025 by the author. Licensee MDPI, Basel, Switzerland. This article is an open access article distributed under the terms and conditions of the Creative Commons Attribution (CC BY) license (https://creativecommons.org/licenses/by/4.0/).