Abstract
This study presents a comprehensive methodological framework that encompasses all stages required to evaluate the structural response to potential seismic motions. The proposed approach involves the estimation of seismic hazard at the site of interest, the disaggregation and definition of control earthquakes, the characterization of local site effects, the assessment of possible resonance phenomena, and the comparison between response spectra derived from probable seismic scenarios and the design spectra of the buildings, leading to conclusions regarding structural safety. The methodology integrates instrumental measurements of soil and building vibration periods with analytical procedures to define response spectra consistent with expected seismic scenarios. It was applied to buildings of special importance located in Guatemala City, particularly within the University of San Carlos of Guatemala (USAC) campus, with the aim of evaluating their structural safety and developing retrofitting criteria when necessary. The implementation began with a probabilistic seismic hazard analysis (PSHA) to identify control earthquakes that make the largest contribution to hazard for a 475-year return period, followed by the estimation of rock response spectra. A seismic microzonation study was then conducted to characterize local site conditions. Instrumental vibration measurements of the soil and structures were obtained, and a soil–structure interaction analysis was carried out to evaluate potential resonance effects. The results showed no evidence of resonance. Finally, soil response spectra derived from the control earthquakes were compared with the design spectra defined by the AGIES 2024 structural safety standards. The results confirmed that the design spectra adequately envelope the computed response spectra for all soil–structure combinations. The proposed methodology is replicable and can be used to assess the seismic design adequacy of other buildings, providing a rational basis for retrofitting decisions when design spectra do not fully encompass the expected seismic response.
1. Introduction
The evaluation of building response to potential seismic motions is a multifaceted problem that requires several stages of analysis. The first step is to define the seismic motions that may affect the structures under study, using the probabilities of exceedance established by relevant building codes [1,2]. Typically, these probabilities correspond to exposure periods of 50 years, with exceedance probabilities of 10% for conventional buildings, 5% for important buildings, and 2% or less for critical facilities. These values are equivalent to return periods of 475, 975, and 2475 years, respectively.
Estimating seismic demand requires determining the peak ground acceleration (PGA) and spectral accelerations SA(T) that represent expected ground motions with the required probability [3,4]. This is usually achieved through a probabilistic seismic hazard analysis (PSHA), which involves several steps: (1) compiling an earthquake catalog covering a 300 km radius around the study site, homogenized to moment magnitude (Mw); (2) defining seismogenic zones of homogeneous potential seismicity within that area; (3) calculating seismic parameters in each zone by fitting the Gutenberg–Richter model; (4) selecting ground motion models (GMM) consistent with regional tectonics; and (5) constructing a logic tree to account for model uncertainty. The outcome of this process is a set of hazard curves that describe PGA and SA(T) values for different exceedance probabilities. From these, uniform hazard spectra can be generated for the probability associated with the importance level of the structure. Initially, this analysis is carried out for rock conditions, and local site effects are incorporated in a subsequent stage.
Ground motions initially estimated on rock can be modified and amplified due to local site effects arising from near-surface geology and topography. It is therefore essential to characterize the soil conditions at the study site. This can be accomplished through seismic microzonation studies based on geotechnical data or in situ measurements used to determine the Vs30 velocity profile and the corresponding soil transfer functions, which quantify amplification at different periods [5].
Combining the results of these analyses allows the estimation of the expected response spectra, either uniform hazard spectra (UHS) or site-specific spectra associated with dominant scenarios for the required probability [6]. This information defines the seismic demand likely to affect the structure whose capacity is to be assessed.
It is important to recognize, however, that seismic loading represents only one of several sources of uncertainty influencing structural response. Additional uncertainties may arise from the variability of soil properties, the simplifications inherent to empirical and numerical modeling, and the uncertainty in structural parameters such as stiffness, damping, and material degradation. Several recent studies have addressed the role of these factors in seismic performance assessment [7,8,9].
To evaluate structural safety, the expected response spectra are compared with the design spectra of the building. This comparison indicates whether the design spectra adequately cover the seismic demand and helps identify potential structural deficiencies. This approach, often referred to as the demand–capacity comparison, provides a rational basis for evaluating seismic risk [10]. Additionally, possible resonance effects can be identified when the natural vibration periods of the soil and the building coincide [11]. These assessments require instrumental measurements of both the soil and the building vibration periods.
This study proposes a practical and systematic approach to evaluate structural safety and seismic performance. The proposed methodology enables a preliminary safety assessment by determining whether the design spectrum adequately represents the expected seismic demand and by identifying potential resonance phenomena. This is not intended as a full analytical structural analysis, which would require advanced numerical modeling and substantial computational resources. Rather, it offers a first-level screening tool that can be efficiently implemented. Following the methodological proposal described in the next section, a practical case study is presented for Guatemala City. The procedure can be replicated for other buildings and locations, and the results are discussed to highlight the applicability and robustness of the proposed framework.
2. Methodology
To characterize seismic motion and structural response, we developed a comprehensive analytical framework that integrates three key components:
- (1)
- calculation of seismic hazard and definition of representative seismic scenarios;
- (2)
- analysis of local site effects through a seismic microzonation study; and
- (3)
- characterization of structural response to identify potential resonance effects.
Finally, the adequacy of the earthquake-resistant design is assessed by comparing the design spectra established in current seismic codes with the spectra derived from the proposed analysis. Figure 1 presents the flowchart of the methodology.
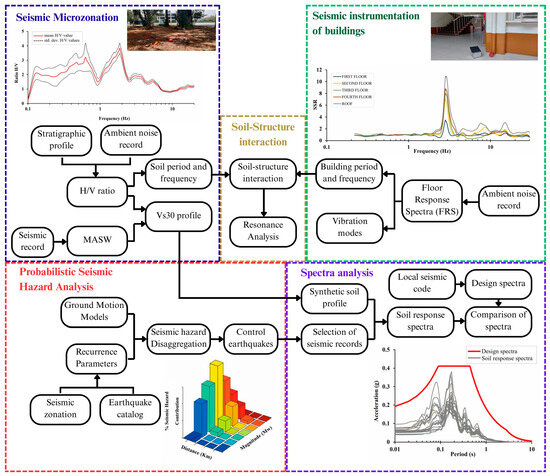
Figure 1.
Flowchart showing the integrated methodology proposed in this study. The central module links local soil properties (seismic microzonation) with structural dynamic parameters (seismic instrumentation) to evaluate soil–structure interaction. Results from the seismic microzonation and PSHA feed into the spectral comparison between design and computed soil response spectra to verify the conservativeness of current seismic codes. The arrows indicate the data flow among the modules, emphasizing the coherent integration of seismic hazard, site effects, and structural response within a unified framework applicable to any scale of work.
Although the procedure was implemented at the municipal scale, it was designed to be scalable and applicable to urban environments. Recent earthquakes have shown that spatial variability in local site conditions significantly influences urban damage patterns, as observed in Mexico City (1985) [12], Kobe (1995) [13], L’Aquila (2009) [14], and Central Italy (2016) [15]. The proposed framework explicitly accounts for site effects at both municipal and urban levels, ensuring that soil frequency and structural response maps are representative of dense built-up areas. This integrated approach provides a consistent basis for correlating local site conditions with expected seismic demand and for verifying the conservativeness of design spectra.
The characterization of seismic actions affecting a structure begins with a seismic hazard study, which determines the probability of exceeding specific ground-motion levels within a given period. Depending on the building’s importance, a target probability is assigned, and the corresponding accelerations, both peak and spectral, are used to develop design spectra [16]. This stage is generally performed for reference rock conditions, while local site effects are incorporated later.
In the first step, a Probabilistic Seismic Hazard Assessment (PSHA) [3,4] is carried out to describe the two main components influencing expected ground motion: the seismic source and the propagation path. The procedure involves identifying seismogenic zones, compiling an earthquake catalog covering a 300 km radius around the site, and characterizing each zone’s seismic potential using recurrence laws based on the Gutenberg–Richter model [17]. Ground-motion propagation is modeled using Ground Motion Models (GMMs). Seismic hazard is defined as the probability that a motion parameter “y” exceeds a threshold “Y” during an exposure time “t”. The annual exceedance probability λ (y > Y) is calculated for t = 1 year, which requires solving the triple integral proposed by Cornell (1968) [3] and Esteva (1968) [4]:
For the chosen motion parameter “y”, the exceedance probability of a given motion level “Y” is then calculated as a function of magnitude (m), distance (r), and epsilon (ε), which represents the number of standard deviations in the ground-motion model. The probability density functions f(m), f(r), and f(ε) correspond respectively to the earthquake recurrence law, the histogram of source distances, and a normal distribution.
Figure 1 illustrates the overall methodological flow. Hazard curves, which describe the exceedance probabilities for both PGA and spectral accelerations, are computed first. From these curves, the uniform hazard spectrum is obtained. However, because the study focuses on specific buildings with known structural periods, we also determine scenario-specific spectra associated with control earthquakes that dominate the target ground motion. The target motions are defined by the PGA and SA(T) values corresponding to the building’s fundamental period and a return period consistent with design standards.
A hazard disaggregation analysis is performed to identify the combinations of (m, r, ε) that most strongly influence these target motions, thus defining the control earthquakes. Based on these parameters, rupture scenarios are constructed, and the corresponding response spectra are computed using the GMMs considered in the analysis. Initially, the spectra are obtained for rock conditions, and subsequently, local site effects are incorporated by applying the soil transfer function at the location of each structure.
To characterize site effects, two complementary methods are used: the Horizontal-to-Vertical Spectral Ratio (HVSR) method and the Multichannel Analysis of Surface Waves (MASW). During the field campaign, ambient noise data are recorded using portable stations. The recorded signals are processed using the Fast Fourier Transform (FFT) to convert time-domain data to the frequency domain. The spectral ratio between the horizontal and vertical components produces the H/V curve, which describes the subsurface impedance contrast and identifies the fundamental soil frequency. A theoretical inversion of the H/V curve is then applied to estimate the shear-wave velocity (Vs) profile and to determine Vs30, the average velocity in the upper 30 m. Soil types are classified according to the local seismic code based on Vs30 values.
For the MASW method, three stations are installed to record shear-wave velocity profiles at their respective sites. Data processing yields dispersion curves representing surface-wave phase velocity as a function of frequency. Theoretical inversion of these curves provides additional Vs profiles, which are again classified according to the local seismic code.
The results from HVSR and MASW are compared to produce a representative S-wave velocity profile (Vs30) for each site. From these, soil transfer functions are derived, representing amplification at different vibration periods. These transfer functions are applied to the rock response spectra obtained previously, generating site-specific spectra that include local effects. The resulting spectra are compared with the design spectra prescribed by the seismic code to determine whether they are conservative across all periods. These comparisons allow estimation of the probability of structural failure and provide a basis for defining retrofitting criteria.
Possible soil–structure resonance effects are also examined. A structure’s dynamic response under cyclic loading depends on the relationship between the soil’s fundamental frequency and the building’s natural frequency. When these frequencies differ substantially, the building moves coherently with the soil, and deformations remain small. However, if the frequencies coincide, resonance occurs, potentially leading to excessive displacements and even collapse.
To investigate these effects, both the soil’s natural frequency (from HVSR) and the building’s vibration frequency must be determined. The Standard Spectral Ration (SSR) method identifies the structure’s natural frequencies based on peaks in the spectral amplitude ratio between roof and base accelerations. The fundamental vibration period, corresponding to the first flexural mode, is of particular interest, as it typically governs maximum displacement. When the soil and structural periods coincide, a resonance warning is issued.
It should be noted that the present study assesses potential soil–structure resonance using observed fundamental frequencies obtained from HVSR and SSR data. A fully coupled soil–structure interaction (SSI) analysis, which would require numerical modeling of the soil–foundation–structure system to capture inertial and kinematic effects, foundation flexibility, and radiation damping [18,19,20], is beyond the scope of this methodological proposal. Consequently, the results should be interpreted as a first-order screening-level assessment of SSI.
In summary, the proposed methodology addresses all key aspects required for an initial assessment of a building’s seismic behavior: probabilistic hazard characterization, evaluation of local soil effects, and identification of potential resonance phenomena. Although the application presented in this study focuses on Guatemala City, the framework is fully replicable in other regions and for different structural typologies.
3. Application in Guatemala City
3.1. Tectonic Framework
Guatemala is a highly seismic country, where the convergence of three tectonic plates (Cocos, Caribbean and North America) generates intense activity with frequent seismic ground motions [21]. The capital, Guatemala City, is one of the country’s population centers at greatest seismic risk, due to the confluence of factor: high hazard, exposure and vulnerability. Four fault systems lie in the city’s environments, dictating the hazard to it: Polochic-Chixoy and Motagua to the north; Jocotan-Chamelecón to the east; and Jalpatagua to the south-east [22,23,24] (Figure 2). Aside from these local faults, the city’s hazardous position is further influenced by the subduction zone to the south of the country, where the highest rate of seismic activity is found.
In addition to the seismic sources cited, the city is situated in a geological graben limited by normal-type step faults, more specifically by the Mixco fault system to the west and the El Trebol fault to the east [25].
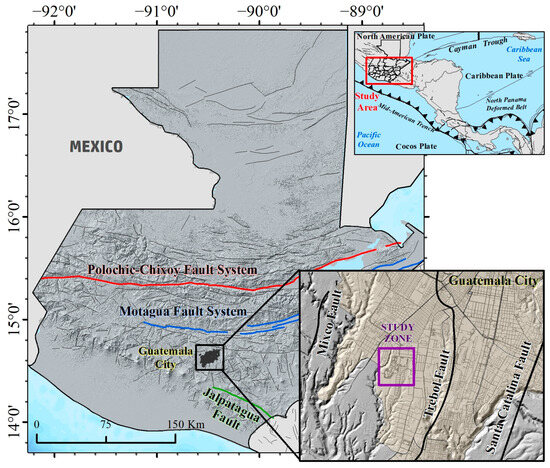
Figure 2.
Tectonic framework of Guatemala. The gray lines show in the map represent the fault database of RIESCA [26] and black lines represent the fault database of CCARA-GEM [27].
Although the country already has a national seismic network, which has led to studies being undertaken to gain better insight into the seismic hazard, knowledge of dynamic soil behavior and structural response to seismic vibrations nonetheless continues to display important gaps, thus highlighting these as some of the issues calling for further research designed to better characterize these important determinants of risk and propose appropriate mitigation measures.
Moreover, the University of San Carlos of Guatemala (USAC) is the country’s only public university. The consequence of this is that the student population continues to grow year after year, thus making it essential to provide new buildings to cover student demand and improve infrastructure services for future professionals. Faced with this situation, the USAC finds itself without a seismic site characterization and structural dynamics study that could serve as the fundamental basis for proper planning of infrastructure works on the university campus. Hence, the main aim of this study was to cover this need.
The USAC main campus is located in Zone 12 of Guatemala City, an area commonly known as Ciudad Universitaria (loosely equivalent to university campus). The campus comprises 25 buildings distributed among nine faculties and ten non-faculty higher education institutions (escuelas no-facultativas). This study focused on the administrative and academic buildings within the campus. In total, 32 buildings were analyzed through an integrated approach that combined seismic hazard assessment, soil characterization (seismic microzonation), and structural dynamics. The objective was to perform a comprehensive evaluation of their expected behavior under potential future seismic excitations.
The methodological workflow presented is designed to be site-independent and scalable (Figure 1). Although the procedure was implemented in the USAC campus, it can be applied to a wide range of urban environments and structural typologies. The integration of HVSR, MASW, and SSR measurements provides a practical framework for identifying the fundamental frequencies of both soils and buildings under operational conditions. This integrated approach allows for an efficient screening of soil–structure resonance potential without requiring complex numerical modeling. Similar methodologies have been successfully adopted in other sites [28,29].
3.2. Seismic Hazard Assessment
The earthquake catalog used in this study corresponds to the regional earthquake catalog for Central America (1520–2020) [30]. In recent decades, an annual average of approximately 3030 seismic events with magnitudes Mw ≥ 3.8 has been recorded, of which about 150 have been perceptible to the population. Most seismic activity occurs in the subduction zone south of the country and along the volcanic chain that traverses its central region. Historical records indicate that, over the past two centuries, Guatemala has experienced 19 destructive earthquakes, three of which caused severe damage to Guatemala City (Table 1).

Table 1.
Most destructive historic earthquakes to have occurred in Guatemala.
The data used for the seismic hazard analysis in Guatemala were derived from the KUKAHPÁN-25 regional model [31]. This model integrates updated local information, including the most recent regional earthquake catalog [30], the latest seismic zonation model [32], scaling relationships specifically developed for Central America [33], and a rigorous evaluation of the input parameters used in the hazard assessment [34]. Figure 3 presents the seismic hazard map of Guatemala, showing peak ground acceleration (PGA) values corresponding to a return period of 475 years.
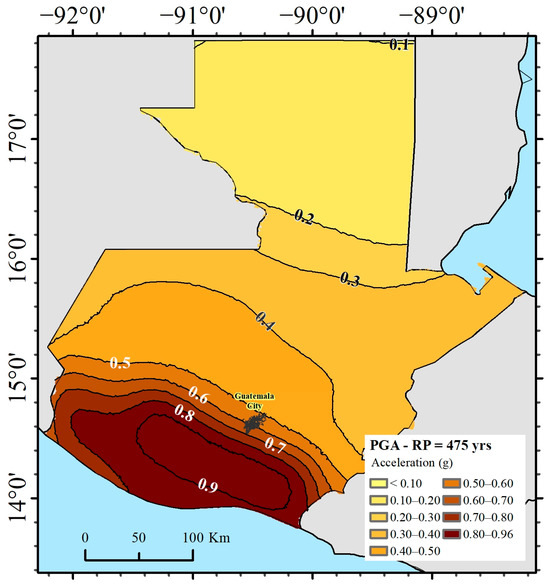
Figure 3.
Seismic hazard map of Guatemala based on the KUKAHPÁN-25 regional model. PGA on rock site conditions for a return period (RP) of 475 years.
The KUKAHPÁN-25 model proposes the control earthquakes most likely to affect the capital cities of the countries involved [31]. In the case of Guatemala, two control earthquakes have been identified through disaggregation, taking as target motions the values derived from PGA and SA (0.5 s) in the previous hazard estimation (Figure 4):
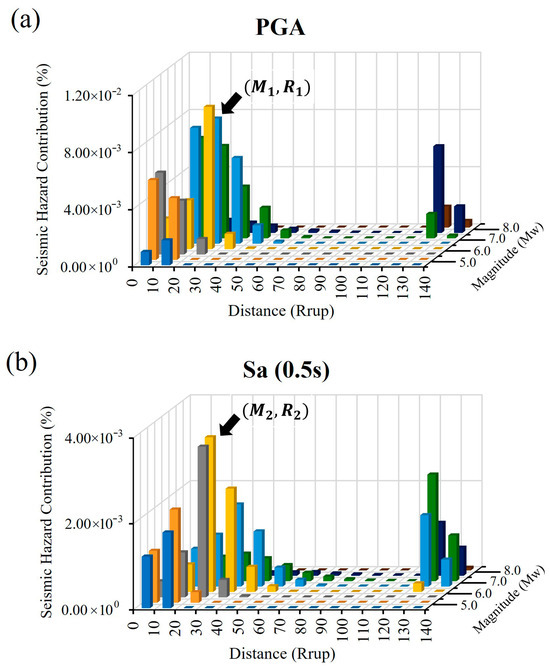
Figure 4.
Control earthquakes for Guatemala City based on the KUKAHPÁN-25 regional model, showing spectral ordinates for (a) PGA and (b) Sa (0.5 s).
According to the regional model, these control earthquakes are associated with seismic sources capable of generating such scenarios. The main potential sources include the Motagua and Polochic–Chixoy fault systems, the Jalpatagua fault, and the subduction zone [31]. The identification of these control earthquakes was subsequently used in the site-effect analysis to select real ground-motion records that best match the characteristics of these representative scenarios.
3.3. Seismic Microzonation
To evaluate potential site effects in the area where the analyzed structures are located, a seismic microzonation study was carried out at the USAC campus. This study was based on in situ measurements, as described below.
Two complementary methods were applied to obtain the necessary data: (1) the Horizontal-to-Vertical Spectral Ratio (HVSR) method [35] and (2) the Multichannel Analysis of Surface Waves (MASW) method [36]. The locations of the stations used for data acquisition with both methods are shown on the map in Figure 5.
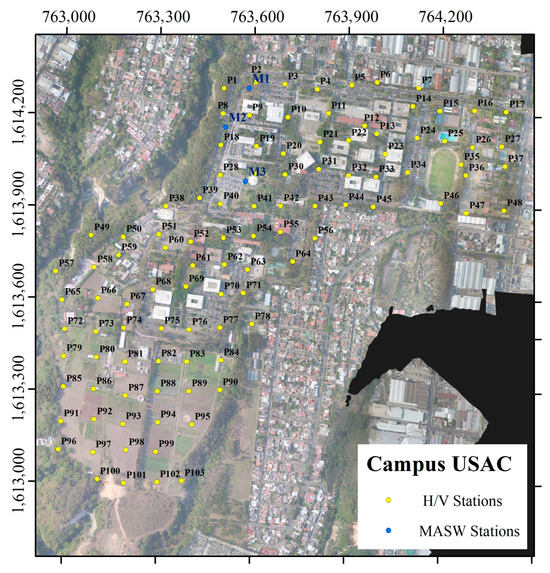
Figure 5.
Location of the record stations around the USAC campus.
A total of 103 data acquisition stations were installed for the HVSR measurements, each recording 20 min of ambient noise (microtremors) generated by human activity, traffic, and wind [37] (Figure 5). The equipment used in the study was a TROMINO® ENGY 3G+ (MOHO Science & Technology, Venice, Italy), a portable seismometer–accelerometer capable of detecting low-amplitude vibrations even at the quietest sites on Earth, within the frequency range of engineering interest (0.1–200 Hz) [38].
The ambient noise signals were processed using GRILLA v.7.5.0 software (MOHO Science & Technology), and the Fast Fourier Transform (FFT) was applied to convert the time-domain signals into the frequency domain [39]. The spectral ratio between the horizontal and vertical components was then computed to obtain the H/V curve [40]. This curve characterizes the impedance contrast of the subsurface layers and identifies the stratigraphic peaks that govern the fundamental frequency or vibration period. A theoretical inversion of the H/V curve was then performed to derive the shear-wave velocity (Vs) profile and determine Vs30, the average velocity down to 30 m depth [41]. Finally, based on the Vs30 values obtained at each station, soil types were classified according to the AGIES 2024 NSE 2.1 seismic code [42].
For the MASW method, three measurement stations were established to record the shear-wave velocity (Vs) at their respective locations using a 12 lb hammer and an aluminum plate (1 ft × 1 ft × 1.5 in) as the seismic source. The acquired data were processed to obtain dispersion curves, which describe the phase velocity of surface waves as a function of frequency [41]. Theoretical inversion of these curves yielded Vs profiles, which were then used to classify soils in accordance with the applicable structural safety standards.
The Vs30 values derived from the MASW method were compared with those from nearby HVSR stations, showing excellent agreement and confirming the complementarity of the two methods [43].
3.4. Building Instrumental Analysis
In this study, we selected 32 buildings belonging to the USAC campus, using as our selection criterion, buildings with the highest level of occupation, essentially by university students and administrative staff. The locations of these buildings are shown in Figure 6.
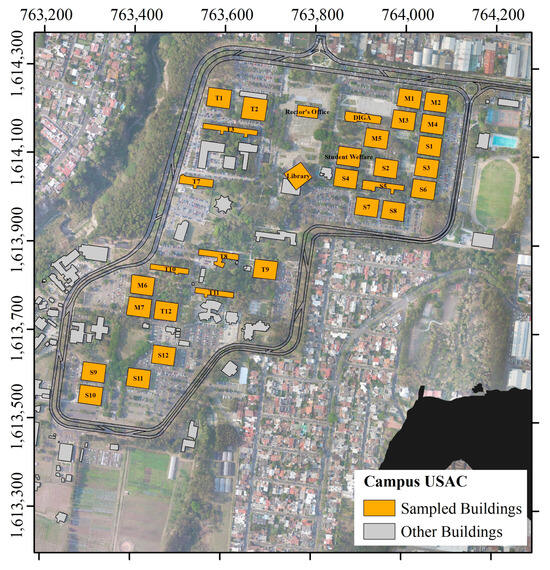
Figure 6.
Map that shows the sampled buildings for this study. A total of 32 buildings were selected in the USAC campus.
The vibration periods were determined using two accelerographs placed at different locations within each building [44]. The first instrument was installed at the base of the structure, while the second was sequentially positioned at each upper floor, following a vertical alignment with respect to the base sensor. Ten-minute recordings of ambient vibrations were taken along one of the building’s barycentric axes to minimize torsional effects and to capture the structure’s pure bending response. Figure 7 shows typical building configurations and the positions of the measurement stations.
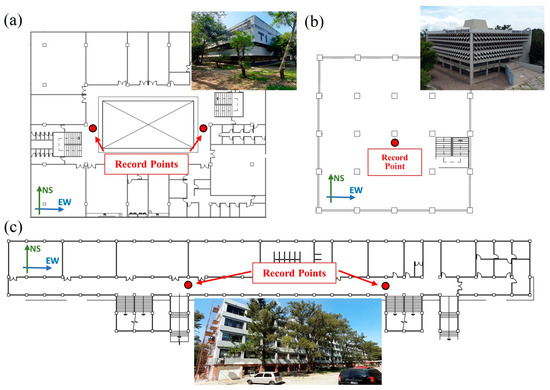
Figure 7.
Typical shape of the sampled buildings for this study. Three general shapes have been identified (a) Courtyard-type building, (b) Square building and (c) rectangle building. The red points correspond to the sites where ambient noise was recorded using seismic equipment.
Although the recording procedure at each level relies on a single TROMINO® sensor, this single-station approach has proven effective and widely used for identifying the fundamental vibration modes of buildings under operational conditions. The instrument was sequentially placed at different levels of each structure, and the resulting spectra were superimposed to compute the standard spectral ratio (SSR) between the roof and the ground floor. This technique has been successfully applied in several studies [45,46,47,48], showing that non-simultaneous recordings can accurately capture the first mode of vibration, provided that ambient conditions remain stable during the campaign.
Possible alternatives include the simultaneous deployment of multiple synchronized sensors to obtain mode shapes and phase differences, or the integration of numerical modeling (e.g., FEM-based SSI simulations) to refine higher-mode identification [49,50]. Nevertheless, for the purpose of fundamental-frequency screening and resonance assessment, the adopted single-station approach is efficient, cost-effective, and sufficiently accurate.
The recorded data were processed using GRILLA v.7.5.0 software. For each recording, the Fast Fourier Transform (FFT) was applied to the orthogonal components of the signal to obtain their amplitude (or power) spectra. The power spectra from each floor were then compared to that of the base floor to identify peaks corresponding to the fundamental vibration mode (first vibration mode). This approach, known as the Standard Spectral Ratio (SSR) method [51,52], enables the identification of a building’s natural frequencies under ambient vibration conditions.
Figure 8 presents an example of the Standard Spectral Ratio (SSR) method, where the first vibration mode is clearly identifiable as the peak with the highest amplitude.
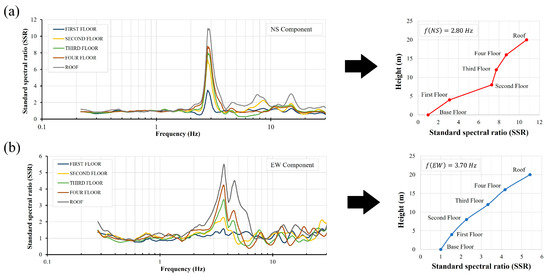
Figure 8.
Example of the standard spectral ratio (SSR) calculated for a sampled building. The location of the first vibration mode of the building (flexural) can be observed in both the (a) NS component and (b) EW component.
3.5. Comparison of Response and Design Spectra
Finally, based on the results of the calculation of seismic hazard and seismic microzonation, we computed the specific response spectra of ground motions associated with the control earthquakes, including the site effect present in the study area. Within each soil type, a calculation was made at each of the stations where measurements were made using HVSR method.
Firstly, accelerograms that would verify the conditions of the control earthquakes were sourced from the national database of the National Institute for Seismology, Vulcanology, Meteorology and Hydrology (INSIVUMEH) of Guatemala [53]. The record found, compatible with the conditions of magnitude and distance associated with the control earthquakes, was as follows:
25 June 2001–Baja Verapaz, Guatemala–6.2 Mw and R = 36.20 km (Motagua Fault System)
The response spectra corresponding to this accelerogram was constructed: this was deemed to be seismic input (on rock) at each of the stations, and the ground response at each station was then calculated. Using the DeepSoil v.7.0 software (University of Illinois, Champaign, IL, USA) [54], we then proceeded to construct the stratigraphic soil profile by means of equivalent linear analysis, in order to calculate each station’s ground response to the respective seismic input (Figure 9).
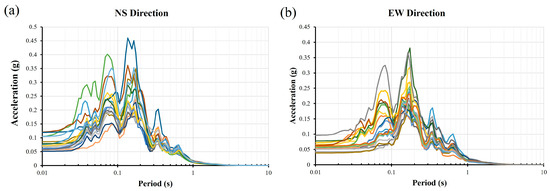
Figure 9.
Response spectra for rock site conditions, according to the seismic record compatible with the control earthquake, in the (a) NS direction and (b) EW direction. The colors indicate the response spectrum generated for each of the record stations shown in Figure 5.
For the construction of the design spectra of the buildings sampled, we used Guatemala’s seismic codes AGIES 2024 NSE 2 and AGIES 2024 NSE 3 [55,56]. Since the 32 buildings analyzed were of the same type (rigid concrete frames), the relevant design spectra, reduced as per the regulations, were generated for soil types. Finally, the response spectra for the earthquake-soil combinations were compared against the relevant design spectra.
4. Discussion
Derived from the KUKAHPÁN-25 regional model [31], the control earthquakes that most likely contribute to the seismic hazard within Guatemala City have been identified. These earthquakes have been associated with the Motagua fault system. Based on this, the seismic record of the 25 June 2001 earthquake has been identified as compatible with the control earthquakes.
As result of the seismic microzonation, maps were plotted showing soil vibration frequencies (Figure 10) and Vs30 at the USAC campus (Figure 11). It is important to note that the generation of these maps, derived from ambient noise (H/V) measurements, involves significant constraints that must be recognized when interpreting their spatial distribution and applying them to seismic microzonation or structural response assessment. The spatial coverage and station density largely determine the resolution of these maps, since interpolation between widely spaced measurement points may mask local variations in resonance frequency, particularly in geologically heterogeneous settings with abrupt changes in sediment thickness or stiffness. Therefore, it is recommended to ensure a dense database of ambient noise recordings to avoid the loss of spatial variations in soil vibration frequencies. In this study, the spacing between stations did not exceed 100 m.
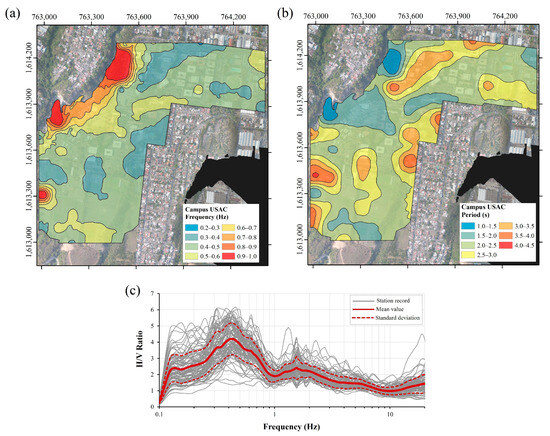
Figure 10.
(a) Frequency map of the soil, (b) Fundamental period of the soil and (c) graph of the H/V ratio, the red line shows de mean value and gray lines show the record of all the station illustrated in Figure 4.
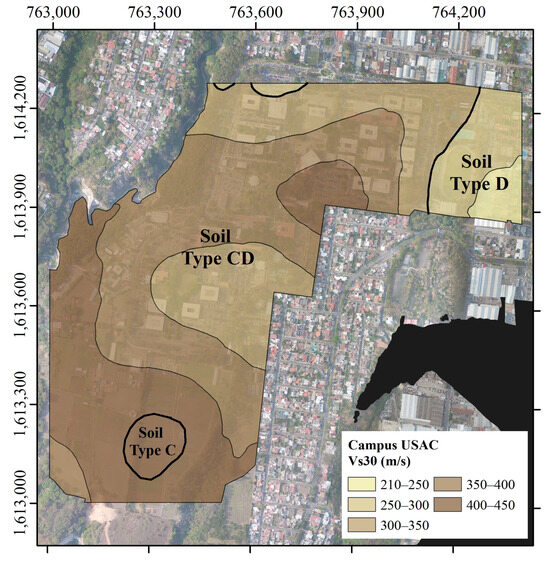
Figure 11.
Distribution of the Vs30 of the soil in the USAC campus. The thick black lines delimited the classification of the soil according to the local seismic code (AGIES NSE 2.1–2024).
The highest frequencies are to be seen in road vehicle lanes on the outskirts of the campus (>0.70 Hz), due to the fact that the soil in this area is a compaction fill (base layer) which has been altered in order to been able to build the road (Figure 10a). That said, however, the frequencies decrease as one move away from the road towards the campus (<0.70 Hz). What this means is that low frequencies dominate on the eastern side of the study area, where the major number of buildings lie. It should be noted that the soils underlying the USAC campus are mostly fluvial-lacustrine sediments (sands and clays), which usually tend to display naturally low frequencies, i.e., motions with large amplitude oscillations [57].
The interpretation of the H/V graph is essential for understanding the dynamic behavior of the soil. When processing ambient noise signals, Fourier transforms and spectral amplitude calculations are applied, producing a function defined in terms of frequency (Hz). Consequently, the H/V ratio is naturally expressed as a function of frequency, and the peak of the curve is directly interpreted as the site’s fundamental resonance frequency (f0), quantitatively related to the shear-wave velocity (Vs) and the thickness of the deposits (H) through theoretical relations such as f0 ≈ Vs/4H in the case of a sedimentary layer overlying a rigid bedrock [38,40].
By superimposing all H/V curves from the sampled stations, it is possible to obtain the average soil vibration frequency, which in this case shows low average frequencies between 0.40 and 0.50 Hz (Figure 10c). This indicates a clear dominance of low-frequency motion in the soil, consistent with the presence of fluvio-lacustrine deposits in the study area.
Furthermore, Figure 11 shows that most of the study area belongs to Type-CD soil (dense sand or very stiff clay), though the eastern part lies on Type-D soil (medium dense sand or stiff clay) and the south part on Type-C soil (very dense sand or hard clay), as per the classification contained in the seismic code AGIES 2024 NSE 2.1 [42], in line with the Vs30 results obtained in the study.
For more information about the results of HVRS and MASW method, consult the Supplementary Materials.
As a result of the buildings instrumentation analysis performed, all the buildings were shown to possess frequencies of 1.25 Hz to 5.65 Hz, something that is to be expected for low-rise buildings (Table 2).

Table 2.
First vibration mode for the sampled buildings on USAC campus for NS direction and EW direction.
Moreover, the rigidity of the structural elements in each analyzed direction (NS and EW) reveals variations in the frequency content. As expressed by Equation (2), an increase in structural stiffness (k) produces a corresponding rise in the natural vibration frequency (f), since the frequency is directly proportional to the square root of stiffness and inversely proportional to the mass (m) of the structure [16]:
Most records obtained in the EW direction exhibit higher stiffness, likely due to the greater number of structural frames or column rows aligned in that orientation. In contrast, the NS direction generally displays lower stiffness, resulting in lower natural frequencies compared with those recorded in the EW direction. This behavior provides valuable insight into the structural vibration modes, in which the rigidity of elements, the mass distribution at each level, the horizontal configuration, and the overall building height collectively govern both displacement and oscillation period.
To analyze the soil–structure interaction (SSI) of the buildings, superimposed graphs of the SSR curves and the average H/V curves of the soil (Figure 10c) were generated to evaluate the potential for resonance during ground motion. Figure 12 shows the soil–structure interaction for the NS direction, and Figure 13 for the EW direction. The buildings were grouped according to their floor-plan shapes to facilitate interpretation.
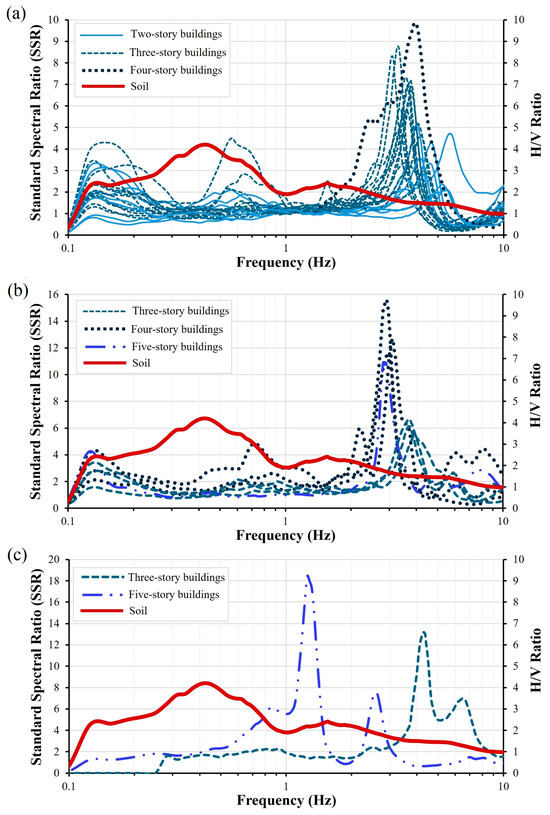
Figure 12.
Interaction soil–structure graphs in the NS direction for (a) Courtyard-type building, (b) rectangle building and (c) Square building.
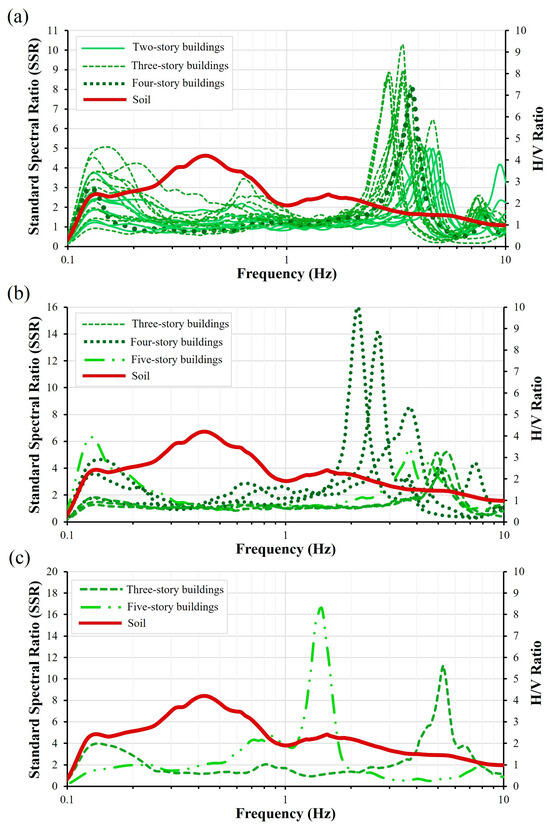
Figure 13.
Interaction soil–structure graphs in the EW direction for (a) Courtyard-type building, (b) rectangle building and (c) Square building.
According to the graphs generated, the dominant soil frequencies beneath the analyzed structures are very low (below 1.0 Hz), whereas the natural frequencies governing the structural response are relatively high (above 1.2 Hz). Because resonance effects occur only when the soil’s fundamental frequency coincides with the structure’s natural vibration frequency [16], the results indicate that such effects are unlikely to develop during seismic events.
From the spectral analysis, the response spectra describing the expected ground motion at each station were obtained for the control earthquakes. Since all the buildings are located on Type-CD soil (Figure 11), the design spectra for these structures were developed for this soil classification, applying the corresponding spectral reduction according to the structural typology (rigid reinforced-concrete frames).
Figure 14 presents the design spectra and allows comparison with the response spectra for the source–soil combinations analyzed in both the NS and EW directions.
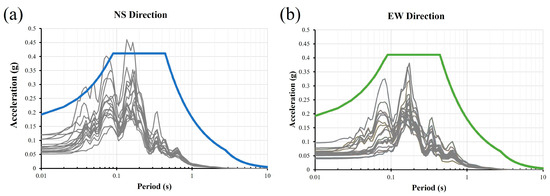
Figure 14.
Spectra analysis for the source-soil combinations analyzed in (a) NS direction and (b) EW direction.
It can be observed that, for the seismic motion record compatible with the control earthquakes—represented by an event within the Motagua Fault Zone—the design spectrum adequately encompasses the resulting response spectra for Type-CD soil conditions. Minor exceedances occur at certain periods in the NS direction, but these do not exceed 20%, remaining within the limits recommended by the current AGIES 2024 NSE 2.1 structural safety standards [42], and are therefore considered acceptable (Figure 14).
It can thus be concluded that, for future seismic events consistent with the analyzed control earthquakes (expected motions with a return period of 475 years), the seismic response of buildings designed in accordance with Guatemala’s current structural safety standards is expected to be satisfactory.
5. Conclusions
This study proposed and implemented an integrated methodology for assessing seismic hazard, local site effects, and structural response. The framework was validated through its application to 32 reinforced-concrete buildings at the USAC campus in Guatemala City, providing valuable insights into soil–structure interaction and design code adequacy. The main findings and implications are summarized below:
- The PSHA study [31] identified the Motagua Fault Zone as the dominant source of seismic hazard for Guatemala City, with control earthquakes (M1,R1) = (6.5–7.0 Mw, 20–30 km) and (M2,R2) = (6.0–6.5 Mw, 20–30 km), for a return period of 475 years in PGA and Sa (0.5 s).
- Seismic microzonation revealed predominantly Type-C, Type-CD and Type-D soils according to the NSE 2.1 AGIES 2024 classification [42]. With Vs30 ranging from 210 to 640 m/s and fundamental frequencies below 1.0 Hz.
- Structural dynamic analysis of 32 high-occupancy buildings indicated fundamental frequencies between 1.25 and 5.65 Hz, confirming the absence of soil–structure resonance due to non-overlapping frequency ranges.
- The comparison between the site-specific response spectra and AGIES 2024 design spectra demonstrated that the latter adequately envelope the computed spectra for all soil–structure combinations, confirming their conservative character for the studied conditions. In light of the results of this study, the design spectrum of Guatemala’s AGIES NSE 2024 seismic code can be regarded as being conservative. Accordingly, they are fit to be used in the design of future buildings on the USAC campus, using the same construction systems as the buildings analyzed.
Based on the results, it is recommended that AGIES NSE 2024 structures under site-dependent modification factors linked to Vs30 and resonance frequency incorporate empirical SSI evaluation methods (H/V and SSR) for existing structures and encourage the use of microzonation and ambient-vibration data to calibrate national design spectra and better capture local site effects.
From the proposed methodology and its application, some strengths and weaknesses should be highlighted:
- The study integrates all key stages of seismic evaluation (PSHA, microzonation, site effects, structural response, and spectral comparison) into a coherent and replicable framework. However, it does not include a fully coupled soil–structure interaction (SSI) analysis, which would require numerical modeling of the soil–foundation–structure system. Therefore, our results should be interpreted as a first-order, screening-level assessment of SSI effects.
- Demonstrates real-world applicability through a comprehensive case study of 32 buildings at the USAC campus in Guatemala City; the methodology is scalable and cost-effective. The study is limited to one municipal site, but the method may be replicable to regions with different geotechnical or structural conditions.
- The spectral comparison between computed and design spectra effectively assesses the conservativeness of current building codes.
- Provides the first integrated seismic and structural response study for the USAC campus, establishing a reference for future retrofitting decisions and urban planning. As a weakness, it does not include nonlinear or time-history structural analyses, which would offer deeper insights into inelastic structural behavior. This would be the subject of a work on another scale and with greater detail.
- The study has a practical impact. Offers a rapid, low-cost, and replicable first-level screening tool suitable for resource-limited contexts
Supplementary Materials
The following supporting information can be downloaded at https://www.mdpi.com/article/10.3390/geosciences15110427/s1: Figure S1: Stratigraphic profile located on the western part of the USAC campus; Table S1: Seismic microzonation results using HVSR method; Table S2: Seismic microzonation results using MASW method.
Author Contributions
Conceptualization, C.G.-C. and M.B.B.; methodology, C.G.-C. and M.B.B.; software, C.G.-C. and C.P.-A.; validation, M.B.B., O.F. and C.P.-A.; formal analysis, C.G.-C. and M.B.B.; data curation, C.G.-C.; writing—original draft preparation, C.G.-C.; writing—review and editing, M.B.B. and O.F.; supervision, M.B.B. and O.F.; funding acquisition, O.F. All authors have read and agreed to the published version of the manuscript.
Funding
This research, titled MICROZONIFICACIÓN SÍSMICA EN EL CAMPUS CENTRAL DE LA UNIVERSIDAD DE SAN CARLOS DE GUATEMALA, CIUDAD DE GUATEMALA, GUATEMALA, was funded by the Research Fund of Dirección General de Investigación DIGI/USAC 2020, under the research project code AP4-2021.
Data Availability Statement
The original contributions presented in the study are included in the article/Supplementary Material; further inquiries can be directed to the corresponding author.
Acknowledgments
The authors acknowledge the support of the Centro de Desarrollo Seguro y Desastres (CEDESYD) of the Universidad de San Carlos de Guatemala (USAC), especially Kevin Nufio and Raúl Vargas, for their assistance in coordinating the acquisition of data from the sampled buildings and the collection of geospatial data for the preparation of the maps. The authors also acknowledge the support of the Dirección General de Administración of USAC, particularly the Departamento de Urbanización y Construcción, for providing the construction plans of the sampled buildings. Finally, we acknowledge the support of Carla Gordillo for her administrative assistance during the execution of this project.
Conflicts of Interest
The authors declare no conflicts of interest.
References
- Bommer, J.J.; Abrahamson, N.A. Why Do Modern Probabilistic Seismic-Hazard Analyses Often Lead to Increased Hazard Estimates? Bull. Seismol. Soc. Am. 2006, 96, 1967–1977. [Google Scholar] [CrossRef]
- Powell, G.H. Displacement-Based Seismic Design of Structures. Earthq. Spectra 2008, 24, 555–557. [Google Scholar] [CrossRef]
- Cornell, A. Engineering Seismic Risk Analysis. Bull. Seismol. Soc. Am. 1968, 58, 1583–1606. [Google Scholar] [CrossRef]
- Esteva, L. Bases Para La Formulación de Decisiones de Diseño Sísmico. Ph.D. Thesis, Universidad Nacional de México, Ciudad de México, México, 1968. [Google Scholar]
- Ansal, A. Seismic Microzonation; Past, Present and Future. Bull. Earthq. Eng. 2025, 23, 3483–3506. [Google Scholar] [CrossRef]
- Loh, C.; Jean, W.; Penzien, J. Uniform-hazard Response Spectra—An Alternative Approach. Earthq. Eng. Struct. Dyn. 1994, 23, 433–445. [Google Scholar] [CrossRef]
- Bracchi, S.; Rota, M.; Penna, A.; Magenes, G. Consideration of Modelling Uncertainties in the Seismic Assessment of Masonry Buildings by Equivalent-Frame Approach. Bull. Earthq. Eng. 2015, 13, 3423–3448. [Google Scholar] [CrossRef]
- Gentile, R.; Galasso, C. Simplicity versus Accuracy Trade-off in Estimating Seismic Fragility of Existing Reinforced Concrete Buildings. Soil Dyn. Earthq. Eng. 2021, 144, 106678. [Google Scholar] [CrossRef]
- Cocco, G.; Spacone, E.; Brando, G. Seismic Vulnerability Assessment of Urban Areas Made of Adobe Buildings through Analytical and Numerical Methods: The Case Study of the Historical Center of Cusco (Peru). Int. J. Disaster Risk Reduct. 2024, 112, 104786. [Google Scholar] [CrossRef]
- Navas-Sánchez, L.; Jiménez-Martínez, M.; González-Rodrigo, B.; Hernández-Rubio, O.; Dávila-Migoya, L.D.; Orta-Rial, B.; Hidalgo-Leiva, D. A Methodology to Assess and Select Seismic Fragility Curves: Application to the Case of Costa Rica. Earthq. Spectra 2023, 39, 1380–1409. [Google Scholar] [CrossRef]
- Güllü, H.; Pala, M. On the Resonance Effect by Dynamic Soil-Structure Interaction: A Revelation Study. Nat. Hazards 2014, 72, 827–847. [Google Scholar] [CrossRef]
- Chávez-García, F.J.; Bard, P.-Y. Site Effects in Mexico City Eight Years after the September 1985 Michoacan Earthquakes. Soil Dyn. Earthq. Eng. 1994, 13, 229–247. [Google Scholar] [CrossRef]
- Kawase, H. The Cause of the Damage Belt in Kobe: “The Basin-Edge Effect” Constructive Interference of the Direct S-Wave with the Basin-Induced Diffracted/Rayleigh Waves. Seismol. Res. Lett. 1996, 67, 25–34. [Google Scholar] [CrossRef]
- Marzorati, S.; Ladina, C.; Falcucci, E.; Gori, S.; Saroli, M.; Ameri, G.; Galadini, F. Site Effects “on the Rock”: The Case of Castelvecchio Subequo (L’Aquila, Central Italy). Bull. Earthq. Eng. 2011, 9, 841–868. [Google Scholar] [CrossRef]
- Caserta, A.; Doumaz, F.; Costanzo, A.; Gervasi, A.; Thorossian, W.; Falcone, S.; La Piana, C.; Minasi, M.; Buongiorno, M.F. Assessing Soil-Structure Interaction during the 2016 Central Italy Seismic Sequence (Italy): Preliminary Results. Ann. Geophys. 2016, 59, 1–7. [Google Scholar] [CrossRef]
- Chopra, A.K. Dinámica de Estructuras; Cuarta Edición; Pearson: Naucalpan de Juárez, México, 2014; ISBN 978-607-32-2239-6. [Google Scholar]
- Gutenberg, B.; Richter, C.F. Frequency of Earthquakes in California. Bull. Seismol. Soc. Am. 1944, 34, 185–188. [Google Scholar] [CrossRef]
- Wolf, J.P. Dynamic Soil-Structure Interaction; Prentice-Hall: Englewood Cliffs, NJ, USA, 1985; ISBN 9780132215657. [Google Scholar]
- Gazetas, G. Formulas and Charts for Impedances of Surface and Embedded Foundations. J. Geotech. Eng. 1991, 117, 1363–1381. [Google Scholar] [CrossRef]
- Mylonakis, G.; Nikolaou, S.; Gazetas, G. Footings under Seismic Loading: Analysis and Design Issues with Emphasis on Bridge Foundations. Soil Dyn. Earthq. Eng. 2006, 26, 824–853. [Google Scholar] [CrossRef]
- Garnier, B.; Tikoff, B.; Flores, O.; Jicha, B.; DeMets, C.; Cosenza-Muralles, B.; Hernandez, W.; Greene, D. Deformation in Western Guatemala Associated with the NAFCA (North America-Central American Forearc-Caribbean) Triple Junction: Neotectonic Strain Localization Into the Guatemala City Graben. Tectonics 2022, 41, e2021TC006739. [Google Scholar] [CrossRef]
- Authemayou, C.; Brocard, G.; Teyssier, C.; Suski, B.; Cosenza, B.; Morán-Ical, S.; González-Véliz, C.W.; Aguilar-Hengstenberg, M.A.; Holliger, K. Quaternary Seismo-Tectonic Activity of the Polochic Fault, Guatemala. J. Geophys. Res. Solid Earth 2012, 117, 1–21. [Google Scholar] [CrossRef]
- Garnier, B.; Tikoff, B.; Flores, O.; Jicha, B.; DeMets, C.; Cosenza-Muralles, B.; Hernandez, D.; Marroquin, G.; Mixco, L.; Hernandez, W. An Integrated Structural and GPS Study of the Jalpatagua Fault, Southeastern Guatemala. Geosphere 2021, 17, 201–225. [Google Scholar] [CrossRef]
- Guzmán-Speziale, M.; Molina, E. Seismicity and Seismically Active Faulting of Guatemala: A Review. J. S. Am. Earth Sci. 2022, 115, 103740. [Google Scholar] [CrossRef]
- Pérez, C.L. Geological Structure of Guatemala City Valley Interpreted as a Pull Apart Basin. Rev. Geológica De América Cent. 2009, 41, 71–78. [Google Scholar] [CrossRef][Green Version]
- Agate, M.; Caldareri, F.; Castillo, L.; Garcia, A.; Giunta, G.; Mixco, L.; Requena, J.; Rubi Tellez, C.; Ruiz, M.; Sulli, A.; et al. The Pattern of Brittle Deformation in Central America for an Assessment of the Seismo-Tectonic Framework. J. Maps 2024, 20, 2285479. [Google Scholar] [CrossRef]
- Styron, R.; García-Pelaez, J.; Pagani, M. CCAF-DB: The Caribbean and Central American Active Fault Database. Nat. Hazards Earth Syst. Sci. 2020, 20, 831–857. [Google Scholar] [CrossRef]
- Pilz, M.; Parolai, S.; Leyton, F.; Campos, J.; Zschau, J. A Comparison of Site Response Techniques Using Earthquake Data and Ambient Seismic Noise Analysis in the Large Urban Areas of Santiago de Chile. Geophys. J. Int. 2009, 178, 713–728. [Google Scholar] [CrossRef]
- Moisidi, M.; Vallianatos, F.; Gallipoli, M.R. Assessing the Main Frequencies of Modern and Historical Buildings Using Ambient Noise Recordings: Case Studies in the Historical Cities of Crete (Greece). Heritage 2018, 1, 171–188. [Google Scholar] [CrossRef]
- Gamboa-Canté, C.; Arroyo-Solórzano, M.; Benito, B.; Aguilar, J.; Arroyo, I.G.; Camacho-Astigarrabia, E.; Castro, D.; Flores, O.; Linkimer, L.; Marroquin, M.G.; et al. Seismicity in Central America (1520–2020) and Earthquake Catalog Compilation for Seismic Hazard Assessments. Bull. Earthq. Eng. 2024, 22, 7201–7234. [Google Scholar] [CrossRef]
- Gamboa-Canté, C.; Arroyo-Solórzano, M.; Rivas-Medina, A.; Benito, M.B. Overview of Seismic Hazard Studies in Central America: A Comparative Analysis of Results. J. S. Am. Earth Sci. 2025, 164, 105630. [Google Scholar] [CrossRef]
- Alvarado, G.E.; Benito, B.; Staller, A.; Climent, Á.; Camacho, E.; Rojas, W.; Marroquín, G.; Molina, E.; Talavera, J.E.; Martínez-Cuevas, S.; et al. The New Central American Seismic Hazard Zonation: Mutual Consensus Based on up to Day Seismotectonic Framework. Tectonophysics 2017, 721, 462–476. [Google Scholar] [CrossRef]
- Arroyo-Solórzano, M.; Belén Benito, M.; Alvarado, G.E.; Climent, A. Empirical Earthquake Source Scaling Relations for Maximum Magnitudes Estimations in Central America. Bull. Seismol. Soc. Am. 2024, 114, 1539–1567. [Google Scholar] [CrossRef]
- Gamboa-Canté, C.; Arroyo-Solórzano, M.; Rivas-Medina, A.; Benito, B. Sensitivity Analysis on the Impact of Input Parameters on Seismic Hazard Results: A Case Study of Central America. Geoscience 2025, 15, 4. [Google Scholar] [CrossRef]
- Xu, R.; Wang, L. The Horizontal-to-Vertical Spectral Ratio and Its Applications. EURASIP J. Adv. Signal Process. 2021, 2021, 75. [Google Scholar] [CrossRef]
- Park, C.B.; Miller, R.D.; Xia, J. Multichannel Analysis of Surface Waves. Geophysics 1999, 64, 800–808. [Google Scholar] [CrossRef]
- Haghshenas, E.; Bard, P.Y.; Theodulidis, N.; Atakan, K.; Cara, F.; Cornou, C.; Cultrera, G.; Di Giulio, G.; Dimitriu, P.; Fäh, D.; et al. Empirical Evaluation of Microtremor H/V Spectral Ratio. Bull. Earthq. Eng. 2008, 6, 75–108. [Google Scholar] [CrossRef]
- Castellaro, S.; Mulargia, F.; Bianconi, L. Passive Seismic Stratigraphy: A New Efficient, Fast and Economic Technique. Geol. Tec. Ambient. 2005, 3, 76–102. [Google Scholar]
- Oberst, U. The Fast Fourier Transform. SIAM J. Control Optim. 2007, 46, 496–540. [Google Scholar] [CrossRef]
- Molnar, S.; Cassidy, J.F.; Castellaro, S.; Cornou, C.; Crow, H.; Hunter, J.A.; Matsushima, S.; Sánchez-Sesma, F.J.; Yong, A. Application of Microtremor Horizontal-to-Vertical Spectral Ratio (MHVSR) Analysis for Site Characterization: State of the Art. Surv. Geophys. 2018, 39, 613–631. [Google Scholar] [CrossRef]
- Castellaro, S.; Mulargia, F. VS30 Estimates Using Constrained H/V Measurements. Bull. Seismol. Soc. Am. 2009, 99, 761–773. [Google Scholar] [CrossRef]
- Paiz, B.; Callejas Benítez, F.; Semrau Lago, R.; Pérez Zarco, A.; Valdéz Arandi, H.; De León, W.; Rubio, Á.; Leiva, L. NSE 2.1—Estudios Geotécnicos; Asociación Guatemalteca de Ingeniería Estructural y Sísmica, AGIES: Ciudad de Guatemala, Guatemala, 2024. [Google Scholar]
- Castellaro, S. The Complementarity of H/V and Dispersion Curves. Geophysics 2016, 81, T323–T338. [Google Scholar] [CrossRef]
- Trifunac, M.D. Comparisons between Ambient and Forced Vibration Experiments. Earthq. Eng. Struct. Dyn. 1972, 1, 133–150. [Google Scholar] [CrossRef]
- Castellaro, S.; Mulargia, F. How Far from a Building Does the Ground-Motion Free-Field Start? The Cases of Three Famous Towers and a Modern Building. Bull. Seismol. Soc. Am. 2010, 100, 2080–2094. [Google Scholar] [CrossRef]
- Castellaro, S.; Padrón, L.A.; Mulgaria, F. The Different Response of Apparently Identical Structures: A Far-Field Lesson from the Mirandola 20 May 2012 Earthquake. Bull. Earthq. Eng. 2013, 12, 2481–2493. [Google Scholar]
- Castellaro, S.; Perricone, L.; Bartolomei, M.; Isani, S. Dynamic Characterization of the Eiffel Tower. Eng. Struct. 2016, 126, 628–640. [Google Scholar] [CrossRef]
- Prati, D.; Badini, L.; Mochi, G.; Castellaro, S.; Ferrante, A. Passive Single-Station Techniques Applied for Dynamic Characterization of Reinforced Concrete Buildings. Riv. Tema 2020, 6, 18–28. [Google Scholar] [CrossRef]
- Pan, Y.; Ventura, C.E.; Xiong, H.; Zhang, F.-L. Model Updating and Seismic Response of a Super Tall Building in Shanghai. Comput. Struct. 2020, 239, 106285. [Google Scholar] [CrossRef]
- Li, J.; Bao, T.; Ventura, C.E. A Robust Methodology for Output-Only Modal Identification of Civil Engineering Structures. Eng. Struct. 2022, 270, 114764. [Google Scholar] [CrossRef]
- Nogoshi, M.; Igarashi, T. On the Amplitude Characteristics of Microtremor (Part 2). J. Seismol. Soc. Jpn. 1971, 24, 26–40. [Google Scholar] [CrossRef]
- Lermo, J.; Chávez-García, F.J. Site Effect Evaluation Using Spectral Ratios with Only One Station. Bull. Seismol. Soc. Am. 1993, 83, 1574–1594. [Google Scholar] [CrossRef]
- Instituto Nacional de Sismologia; Vulcanologia; Meteorologia e Hidrologia (INSIVUMEH) Red Sismologica Nacional [Data Set]. International Federation of Digital Seismograph Networks. 1976. Available online: https://www.fdsn.org/networks/detail/GI/ (accessed on 15 August 2025).
- Hashash, Y.M.A.; Musgrove, M.I.; Harmon, J.A.; Ilhan, O.; Xing, G.; Numanoglu, O.; Groholski, D.R.; Phillips, C.A.; Park, D. DeepSoil 7.0: User Manual; University of Illinois: Champaign, IL, USA, 2020. [Google Scholar]
- Paiz, B.; Cruz, D.; Monzón Despang, H.; Rodas, J.A.; Chang Campang, R.; Flores, O.; Gonzáles, W.; Ligorría, J.P. NSE 2—Demandas Estructurales Y Condiciones De Sitio; Asociación Guatemalteca de Ingeniería Estructural y Sísmica, AGIES: Ciudad de Guatemala, Guatemala, 2024. [Google Scholar]
- Paiz, B.; Cruz, D.; Monzón, H.; Rodas, J.A.; Chang Campang, R.; Flores, O.; Gonzáles, W.; Ligorría, J.P. NSE 3—Diseño Estructural De Edificaciones; Asociación Guatemalteca de Ingeniería Estructural y Sísmica, AGIES: Ciudad de Guatemala, Guatemala, 2024. [Google Scholar]
- Kanai, K. Relation between the Nature of Surface Layer and the Amplitudes of Earthquake Motions. Bull. Earthq. Res. Inst. 1952, 30, 31–37. [Google Scholar]
Disclaimer/Publisher’s Note: The statements, opinions and data contained in all publications are solely those of the individual author(s) and contributor(s) and not of MDPI and/or the editor(s). MDPI and/or the editor(s) disclaim responsibility for any injury to people or property resulting from any ideas, methods, instructions or products referred to in the content. |
© 2025 by the authors. Licensee MDPI, Basel, Switzerland. This article is an open access article distributed under the terms and conditions of the Creative Commons Attribution (CC BY) license (https://creativecommons.org/licenses/by/4.0/).