Abstract
The zircon from the pegmatite of the Adui granitic massif displays the unique the rare earth element (REE) distribution spectrum with the tetrad effect in REE fractionation. The tetrad effect often occurs in granitoid rocks, but it is rarely encountered in minerals, e.g., zircon. Fluid saturated with volatiles, water and trace elements is a factor responsible for the tetrad effect in the zircon. The detailed isotopic-geochemical study of the zircon has revealed several zones differing in internal structure (in the back-scattered electron (BSE) image), composition and REE distribution. The zones indicate changes in the crystallization environment provoked by the evolution of the pegmatite-forming melt. They occur as the gradually growing changes in composition from the unaltered zones that are light-colored in BSE to the altered zones that are dark-colored in BSE. The unaltered zones are consistent in composition and geochemical features with magmatic zircons. The high content of trace (U, Th, REE) and volatile elements (F, Cl) in water suggests its crystallization from the fluid-saturated magmatic melt. The altered zircon zones occur as recrystallized zones with high content of non-formula elements (Y, Ca, Sr, Nb, P), a non-differentiated REE distribution spectrum and an absent Ce anomaly. These features are consistent with those of hydrothermal-metasomatic zircon.
1. Introduction
The rare earth elements (REE) in modern economy are strategic raw materials. As modern technologies develop, the consumption of REE increases and their application range expands. In this regard, REE geochemistry has been actively studied by a wide range of researchers in the recent decades. The geochemical behavior of REE in geological sites was found to be controlled by differences in their ionic radius, atomic masses and valence state variations. In addition, unusual REE behavior in various natural objects was interpreted as the tetrad effect [1]; a detailed report by the first researchers is available in [2].
The tetrad effect (TE) is a type of REE fractionation indicated by the division of the entire REE spectrum into four subgroups (tetrads), each consisting of four elements—La-Ce-Pr-Nd, Pm-Sm-Eu-Gd, Gd-Tb-Dy-Ho and Er-Tm-Yb-Lu—and the formation of a wavy curve. A normalized REE distribution profile in each tetrad shows its own pattern imposed on a total linear REE fractionation profile as evidenced by [3] and others. The tetrad effect is divided in the form of a manifestation into the M-type (TE value >> 1) with a convex REE profile in tetrads and the W-type with an inverse concave REE profile (TE value << 1) [1].
Factors that provoke the tetrad effect in rocks, mainly granitoids and their minerals, are still the subject of active discussion. For example, according to some authors [4,5], the tetrad effect occurs when melts interact with an “aquatic medium” consisting of water, fluids and hydrothermal solutions. Others, e.g., [6], have found that the tetrad effect in the REE spectra of rare metal granitoid rocks occurs due to the redistribution of lanthanides between the immiscible liquid phases of granitoid magma, in particular via a fluoride and silicate melt, resulting in the tetrad effect of the M-type in silicate melts and that of the W-type in fluoride melts. Most commonly, researchers agree that the tetrad effect is provoked by the interaction of highly differentiated melts with fluorine-enriched fluids, such as [7,8,9] and others, liquid immiscibility and REE redistribution between vapor and a co-existing melt [10]. It should be noted that the tetrad effect of the M-type is common in highly evolved granitic systems in rocks and their minerals [3,11,12,13], while the tetrad effect of the W-type is much rarer [6,10]. It is noteworthy that zircon in rocks with the intense tetrad effect in the REE distribution and in its minerals may display no or minor tetrad effect [12]. However, geochemical processes responsible for the tetrad effect are poorly understood. A few examples of the tetrad effect in zircon from rare metal granites and associated ore-bearing pegmatites have been published in the recent years [8,9,14,15].
The aim of this study is to establish a link between the occurrence of the tetrad effect in the distribution of REE in zircon with the peculiarities of its internal structure and composition, as well as the manifestation of rare metal mineralization. Revealing a link between the tetrad effect in zircon and the environment in which it was formed is mineralogically and geochemically essential because zircon is an important mineralogical and geochemical indicator of melt evolution and a fluid regime. It is widely used for reconstructing the evolution of magmatic and hydrothermal systems and for solving other petrogenetic questions.
2. Geological Setting
The Adui massif is a big granitic massif located in the northwestern paleocontinental zone of the Middle Urals. Together with adjacent smaller granitic massifs, it has been studied for a long time (for a detailed review, see [16,17]). The Adui massif was formed 251–245 Ma ago [18]. It occurs mainly among the gneisses, migmatites, amphibolites and crystalline schists of the Murzinka-Adui block. Its composition is dominated by biotite and two-mica granites. According to [18], its formation was provoked by the two-phase intrusion of magmatic melts. Multigrained gneiss-like varieties, occasionally pegmatoid varieties, evolved in phase I. While medium- to coarse-grained, porphyraceous granites were often formed in phase II. The composition and varieties of granitoid rocks from the Adui massif have been studied in detail by many researchers [19]. Trace elements and the REE distribution in the rocks of this massif are discussed in [20]. Fluid phases are often actively involved in the formation of the Adui massif granitoids [21].
The rocks of major intrusive phases host the schlieren and veins of pegmatites, fine-grained granites and aplites [18]. Pegmatite veins host economic rare metal mineralization (Ta-Nb, Be, Mo, etc.) and well-known gemstone deposits. Two major types of the Adui massif pegmatites [16] are (1) chamber pegmatites with gemstone mineralization and (2) cavity-free ceramic pegmatites with quartz-two-feldspar block zones, which often have a small quartz core. Rocks composed of biotite and two-mica occur in the Adui pegmatite field. Rare metal pegmatites at the southern and eastern periphery of the massif display highly differentiated rocks, hosting Be, Ta and Nb mineralization with an age of 245–260 Ma [19].
The zircon studied was found in an albitized pegmatite vein “Telefonka” of the Adui massif. Now, it is a series of trenches and deep wells on pegmatite veins lying parallel to each other. The veins consist of quartz (morion), albite, microcline, orthoclase, beryl and garnet. According to (EPMA) U-Th-Pb dating of the analyzed zircon, its age has been determined as 246 ± 2 million years [22], its consistent with the isotope data for the Adui massif obtained earlier.
3. Materials and Methods
The internal structure of zircon and the controlled presence of mineral phase inclusions of their composition were studied in a back-scattered electron (BSE) regime on a JEOL JSM-6510LA scanning electron microscope with a JED-2200 ED-spectrometer (IPGG RAS) at an accelerating voltage of 20 kV, a current of 1.5 nA, a work distance of 10 mm, and with probe diameter of about 3 µm. To calculate corrections, a ZAF method from a JEOL program was used.
Measurements of zircon trace element composition were performed using a Cameca IMS-4f ion microprobe at the Yaroslavl’ Branch of the Institute of Physics and Technology of the Russian Academy of Sciences. A total of 40 spot analyses of the content of trace and rare earth elements in the studied zircon were performed. We mainly followed the analytical procedure described in [23,24]. The primary O2– ion beam spot size was ~20 µm. Each analysis was averaged from 3 measurement cycles. Contents of trace elements were calculated from the normalized to 30Si+ secondary ion intensities using calibration curves based on a set of reference glasses [25,26]. NIST-610 reference glass [27] was used as a daily monitor for trace element analyses. Accuracy of trace element measurements was 10–15% for values of more than 1 ppm and 10–20% for values of between 0.1 and 1 ppm. To construct REE distribution spectra, the composition of zircons was normalized to that of chondrite CI [28]. The zircon crystallization temperature was estimated with the Ti-in-Zrn thermometer [29]. The volatile impurities (H, F, Cl) in zircon were measured separately from a basic set of trace elements under the special conditions aimed to decrease the water background level [30]. Description of the methodology for measuring volatile components is given in [31].
Oxygen isotope composition of zircon was determined at the Institute of Geology and Geophysics of the Chinese Academy of Sciences (Beijing) on a Cameca IMS-1280 ion microprobe. Analytical procedures are similar to those described in [32,33,34]. The Cs+ primary beam was accelerated at 10 kV with an intensity of ca. 2 nA. Beam size was about 20 µm in diameter (10 µm beam diameter + 10 µm raster). We performed oxygen isotope measurements at spots located directly adjacent to pits after measurements of zircon trace element composition analyses. Before measuring, the samples were repolished to remove the pits from previous analyses. Spots for in situ analyses were selected by using both transmitted and reflected-light images in order to avoid cracks and inclusions. The measured 18O/16O ratios were normalized to the standard VSMOW (18O/16O = 0.0020052). The instrumental mass fractionation (IMF) was corrected using the TEMORA-2 zircon standard (5 analyses).
4. Results
4.1. Zircon Characterization
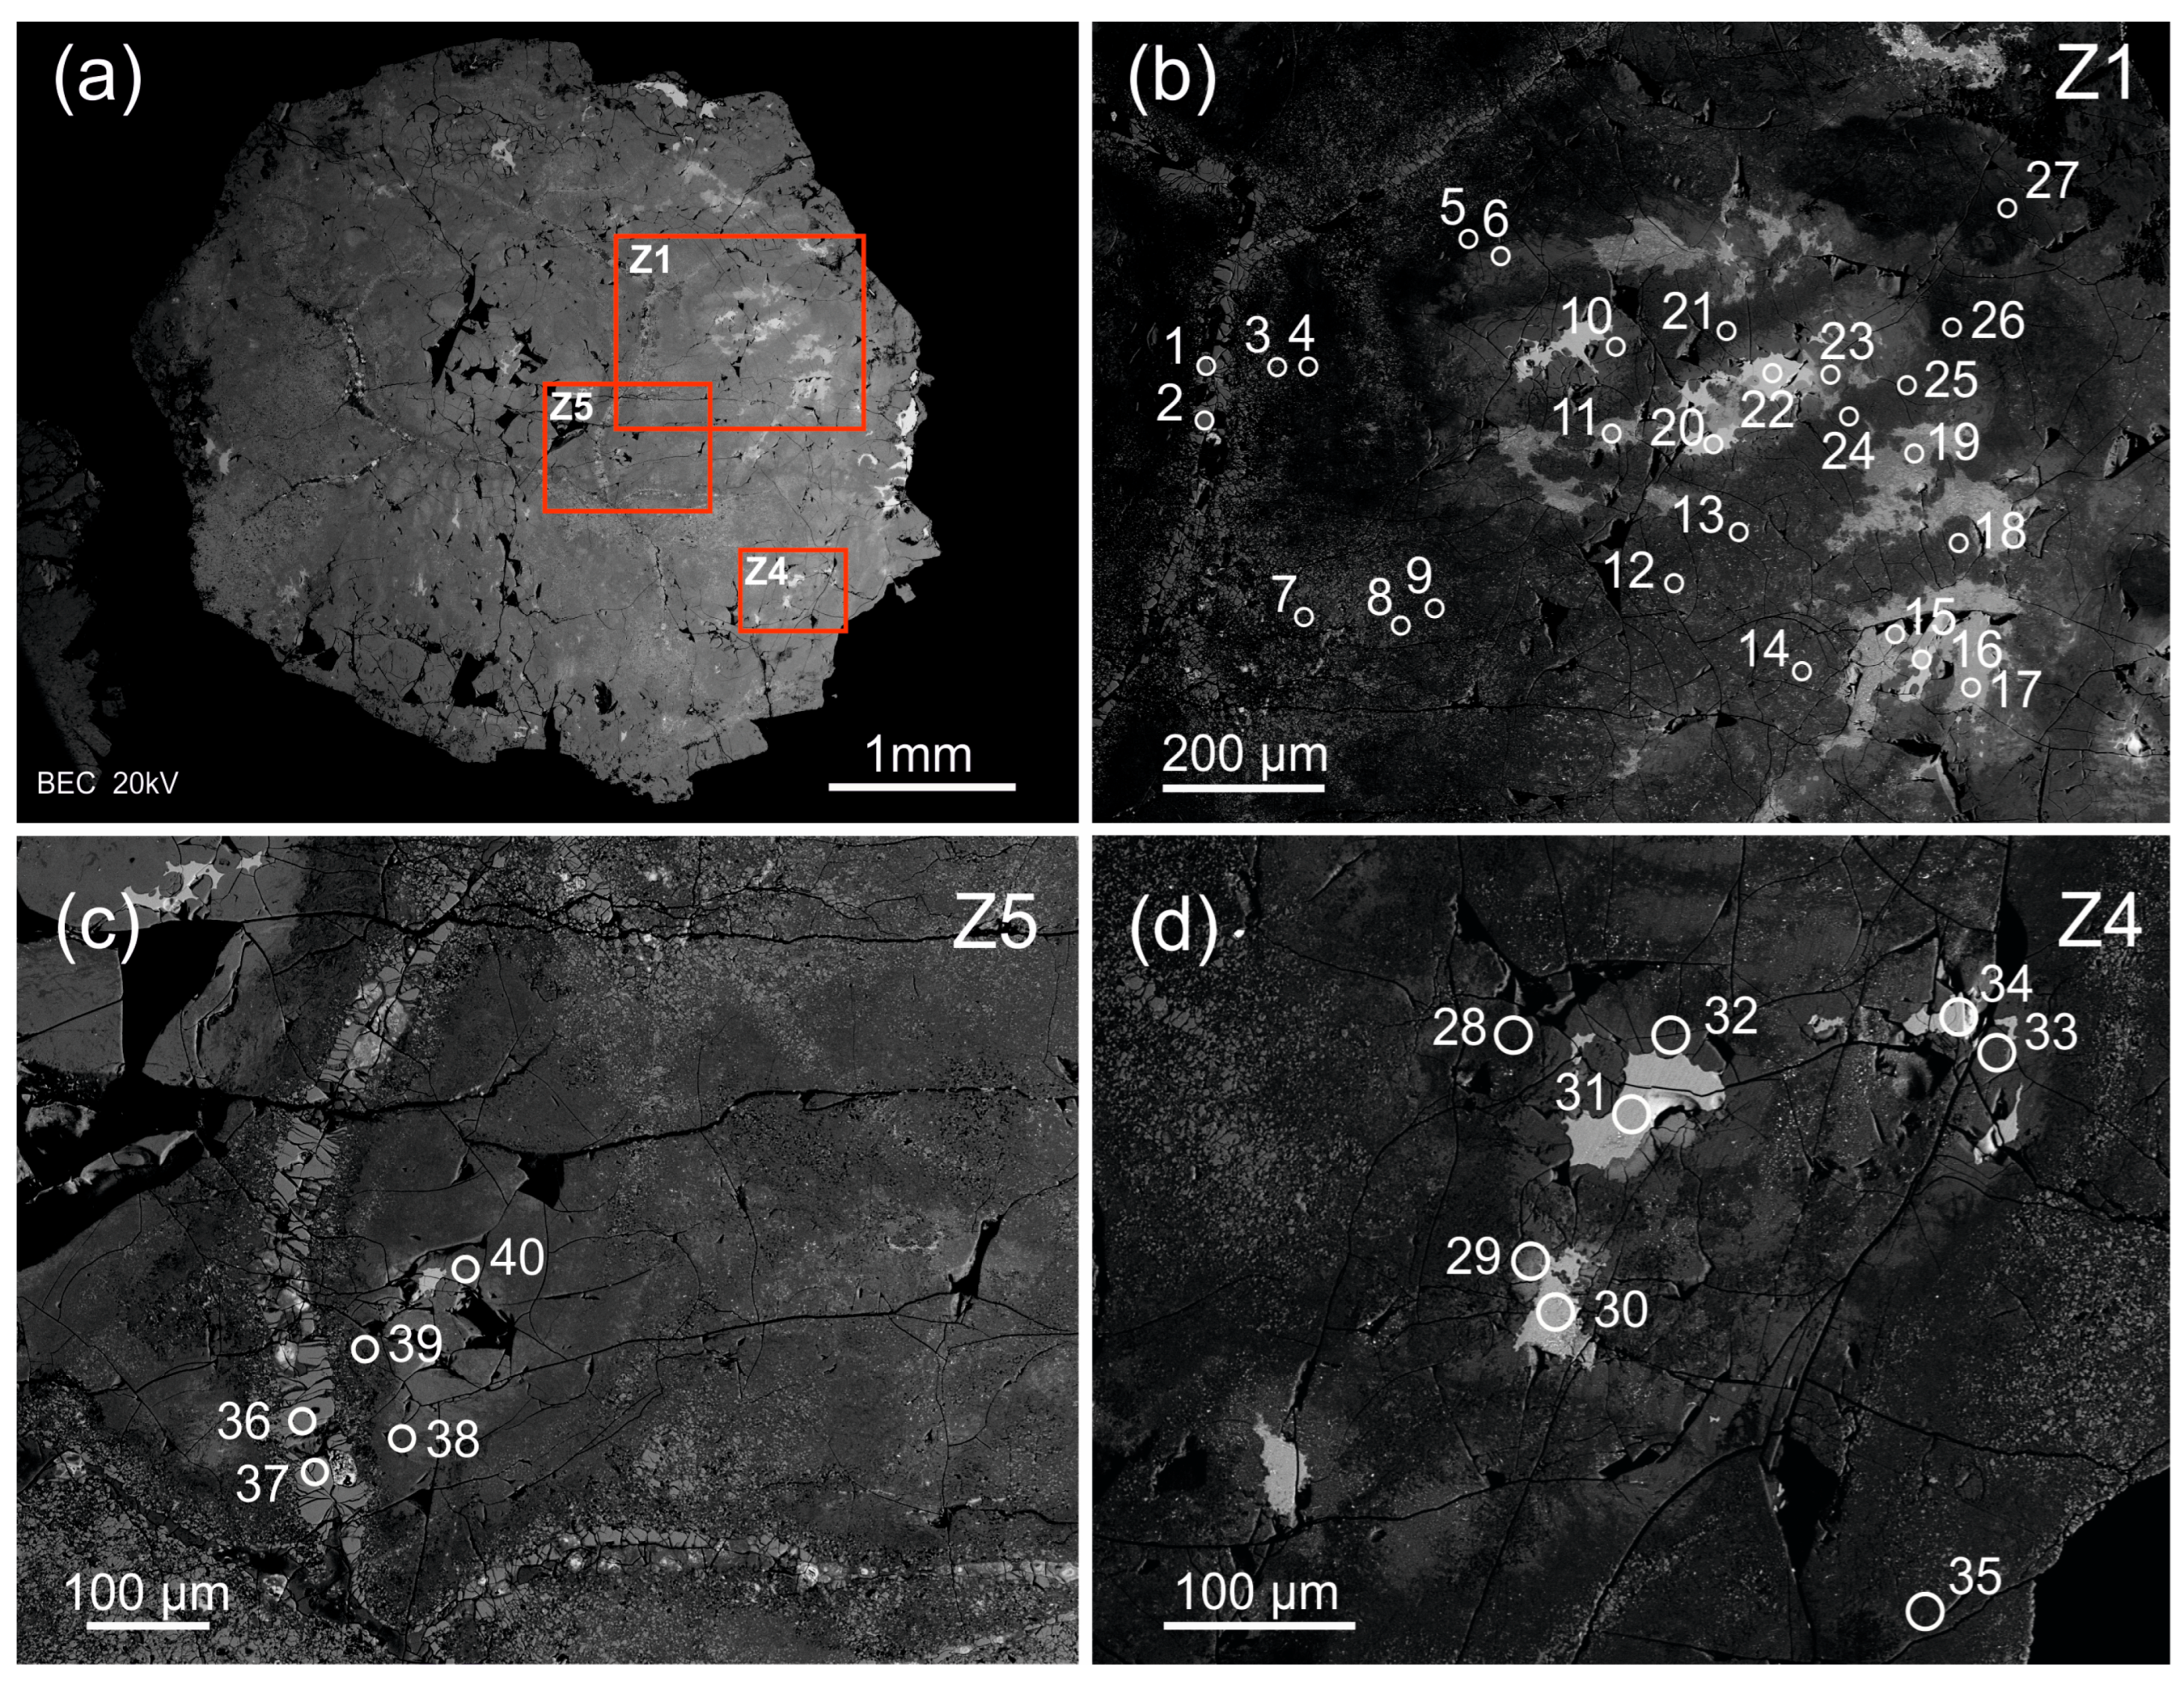
The zircon studied is an elongated coarse crystal, 10 × 4 × 3.5 mm in size (Figure 1). The crystal is mainly semi-transparent, varies in color from light to dark-yellow and dark-brown and contains orange, pink, red and black phenocrysts. Its internal structure is heterogeneous. It has morphologically differing zones and micron-sized inclusions corresponding in composition to uraninite and thorite (by SEM-EDS data). The micron-sized inclusions look like bright white spots on a BSE image, while heterogeneous zircon zones are light-grey-, grey- and dark-grey-colored. The zones are distributed in the following manner: the main zircon zone is dark-grey; it has small light-grey zones; light-grey zones surrounded by grey zones—its intermediate between the first two. The crystal has dark-grey and grey zones in some of major fractures. The zircon is moderately fractured and has micron-sized pores. Uranium- and thorium-bearing mineral inclusions occasionally fill the pores [22]. In the BSE image, porous zircon looks largely heterogeneous (spotted), displaying bright micron- to submicron-sized Th-U mineral spots.
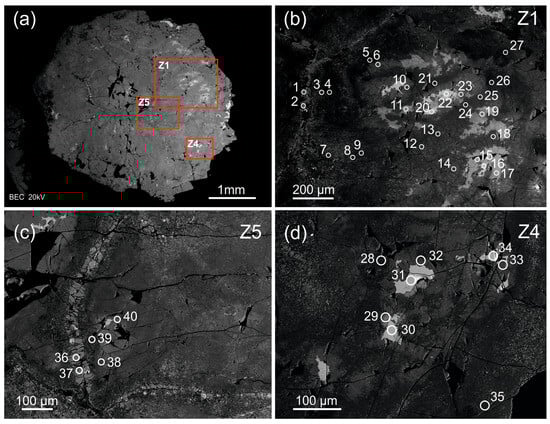
Figure 1.
Back-scattered electron image of the zircon crystal from pegmatite of the Adui massif: (a) the whole crystal; (b–d) its detailed images in enlarged scale with analytical spots. Analytical craters are indicated (diameter is about 20 µm). The light-grey zones (spots 16, 20, 22, 30, 31, 34) correspond to zone Ie; the grey zones (spots 6, 10, 11, 15, 17, 19, 23, 29, 32, 33, 40) correspond to zone IIa; the grey fracture-filling zones (spots 1, 2, 36, 37) correspond to zone IIIc; the dark-grey zones (the rest nineteen analytical spots) correspond to zone IIb in the same zircon crystal [22].
4.2. The Zircon Rare Element Composition
As has been noted earlier, the zircon crystal analyzed shows a complex internal structure and varies in color intensity in the BSE. It is well known ([35,36,37] and others) that the color intensity of zircon in the BSE depends on its structural and chemical features, such as impurities content, crystallographic crystal orientation, degree of metamictization, presence of pores and micron-sized inclusions. This heterogeneity usually affects the composition and geochemistry of the zircon.
The composition of REE and other trace elements, as well as volatiles and water in various crystal zones, was analyzed in detail to better understand the composition, geochemistry and distribution of trace and rare earth elements in zircon.
The zircon analyzed contains elevated impurity element values, except for U and Th (Table 1). Its content of U is as high as 14.7%, and is 64,100 ppm on average. The Th content is less abundant, and is 12,300 ppm on average. Th/U of 0.11–3.29 is consistent with that of magmatic derived zircons [38,39,40]. The Hf content of zircon from granitoids is high, as was expected, varying from 5.2 to 9.1%, on average 6.7%. The total content of REE averages at 4200 ppm, occasionally increasing to 17,900 or 14,200 ppm (REE). The content of heavy REE (HREE) is much higher than intermediate and light REE (LREE) content. Considerable variations of content level are also typical of Y. Its value in zircon is generally low, and its average is about 1100 ppm. However, Y content rises to 23,900 ppm in some zones. The content of P averages at 600 ppm and at about 3400 ppm for Ca. The content of other non-formula elements, such as Sr, Nb and Ba, is 250–460 ppm on average. The zircon analyzed typically contains high water c content of up to 6.9%, 43,300 ppm on average, and an abundance of lightweight and volatile elements. This is most typical of F, the range of its content is defined as 80–3200 ppm, with an average value of 1150 ppm. Cl content is lower by one order of magnitude, at 240 ppm on average. B and Be content is about 100–130 ppm. Ti content is as low as 2 to 67 ppm (on average 16 ppm). The mean crystallization temperature of zircon, measured with a Ti-in zircon thermometer, is 760 °C.

Table 1.
Trace elements concentrations (ppm) in zircon from the pegmatite of the Adui massif (Middle Urals).
In the light-grey zones in the BSE of the zircon (spots 16, 20, 22, 30, 31, 34; Figure 1, Table 1), the highest content of U is observed among all zones of zircon, and is in the range of 70,000–147,000 ppm (on average: 114,700 ppm); Th—12,950–15,500 ppm (on average: 13,960 ppm) and Li—on average: 31 ppm. These zones have increased the content of REE (3200–8000 ppm, on average 4960 ppm), and a high level of volatile elements are noted. Thus, F content varies from 710 to 1830 ppm (on average 1330 ppm) and Cl content in this zone varies by over one order of magnitude from 28 to 770 ppm (on average 280 ppm). Water content in the light-grey zones is also variable (on average: 2.85%). Water content in five out of six spots analyzed is as high as 1.52 to 4.76%. Only one analytical spot of the composition of zircon (spot 16—5090 ppm) is consistent with the typical water values in magmatic zircon unaffected by metamictization [42,43]. Hf content in these zones is as high as 61,500–87,100 ppm, on average: 71,200 ppm. The contents of other elements analyzed are relatively low, on average (ppm): Ca—1600, P—450, Y—280, Ba—285, Nb—175, B—144, Sr—105 and Be—60. Th/U ratio varies from 0.11 to 1.14. It is worth noting that despite the high content of impurity elements, primarily U, light-grey zones comprise zircon according to EPMA, Raman and photoluminescence spectroscopy data [22].
The light-grey zones of the zircon are surrounded by other zones, which look grey in the BSE (spots 6, 10, 11, 15, 17, 19, 23, 29, 32, 33, 40; Figure 1, Table 1). They are similar in composition to the light-grey zones, but differ in other features: lower U (on average: 96,500 ppm), Hf (63,300 ppm), Li (4.75 ppm) and Cl (145 ppm) content; similar Th, REE, P, Nb, Ba, B and F content; and increased (at least two times) Y, Ca, Sr, Ti, Be and water content. Th/U ratio at most analytical spots (Th/U = 0.12–0.14) shows the same value range as the light-grey zones, Th/U is 0.21–0.22 at two out of eleven spots.
All impurity elements in the dark-grey zones are irregularly distributed; their content range varies occasionally by at least one order of magnitude. The dark-grey zones generally differ from the above zones as they have a higher content of almost all elements, except for U (on average: 41,870 ppm), Th (13,200 ppm), B (84 ppm), Hf (64,000 ppm), B (84 ppm) and Li (0.53 ppm). However, even these elements vary markedly. For example, U content in the zircon varies from 7440 to 87,290 ppm, Th at 8675–24,510 ppm and Hf at 58,180–70,340 ppm. The content of total REE in the dark-grey zones is also distributed extremely unevenly, varying from typical values of 1480 ppm to very high values of 17,900 ppm (Table 1), with an average of only 4270 ppm, which approximately coincides with their content in the light-grey and grey zones. Y content is distributed in a similar manner, but it is much higher than in the other zircon zones (109 to 23,900 ppm, on average: 1720). The dark-grey zones show elevated content of Ca (up to 14,000 ppm, average: 3680), P (up to 4750 ppm, on average: 620), Ba (up to 2200 ppm, on average: 730), Sr (up to 909 ppm, on average: 280), as well as higher content of Nb (up to 840, on average: 305), Be (up to 415 ppm, on average: 145), Ti (up to 38 ppm, on average: 21). Water content is relatively stable, varying from 5.0 to 6.9%. Water values are lower only at two out of nineteen analytical spots of the zircon composition in the dark-grey zones. It should be noted that irregular values typical of this zone persist for the content of volatile elements. For instance, the content of F is 560–3200 ppm (on average: 1140 ppm) and of Cl varies from 14 to 935 ppm (on average: 251 ppm). Despite the fact that the highest values for zircon are recorded in the dark-grey zone, the average content of these elements is at the same level as their average content in the light-grey and grey zones. Th/U is markedly different, corresponding to much higher values than those for the light-grey zones (0.13 to 3.29).
It should be noted that two zircon spots (spots 27, 29) differ in anomalous composition from all other spots (Table 1). For instance, they contain high REE values (17,900 and 14,200 ppm, respectively). The content of HREE is three to four times higher than the content of LREE. However, Sm and Gd (4700–6200 ppm—Sm; 4700–5000 ppm—Gd) are major contributors. They contain Y (up to 24,000 ppm), Th (17,000–24,500 ppm), U (at spot 29, U value is 147,000 ppm), F (about 2200 ppm), water (3.9–5.2%) and elevated levels of P, Nb, Ba and Be.
The zircon filling fractures in the crystal (spots 1, 2, 36, 37; Figure 1) contain maximum Hf values (77,380–90,750 ppm, average: 83,680 ppm). On the contrary, all other elements display minimum values. For instance, these zones contain the lowest content of U (3400–6500 ppm, and its average for the entire zircon is 64,100 ppm), Ca (300–830 ppm), water (0.37–1.31%), Sr, Ba, F and other elements. Th content is minimal (650–1800 ppm), and its average is 12,300 ppm. Th/U in this zircon zone is 0.18–1.71.
4.3. Distribution of REEs
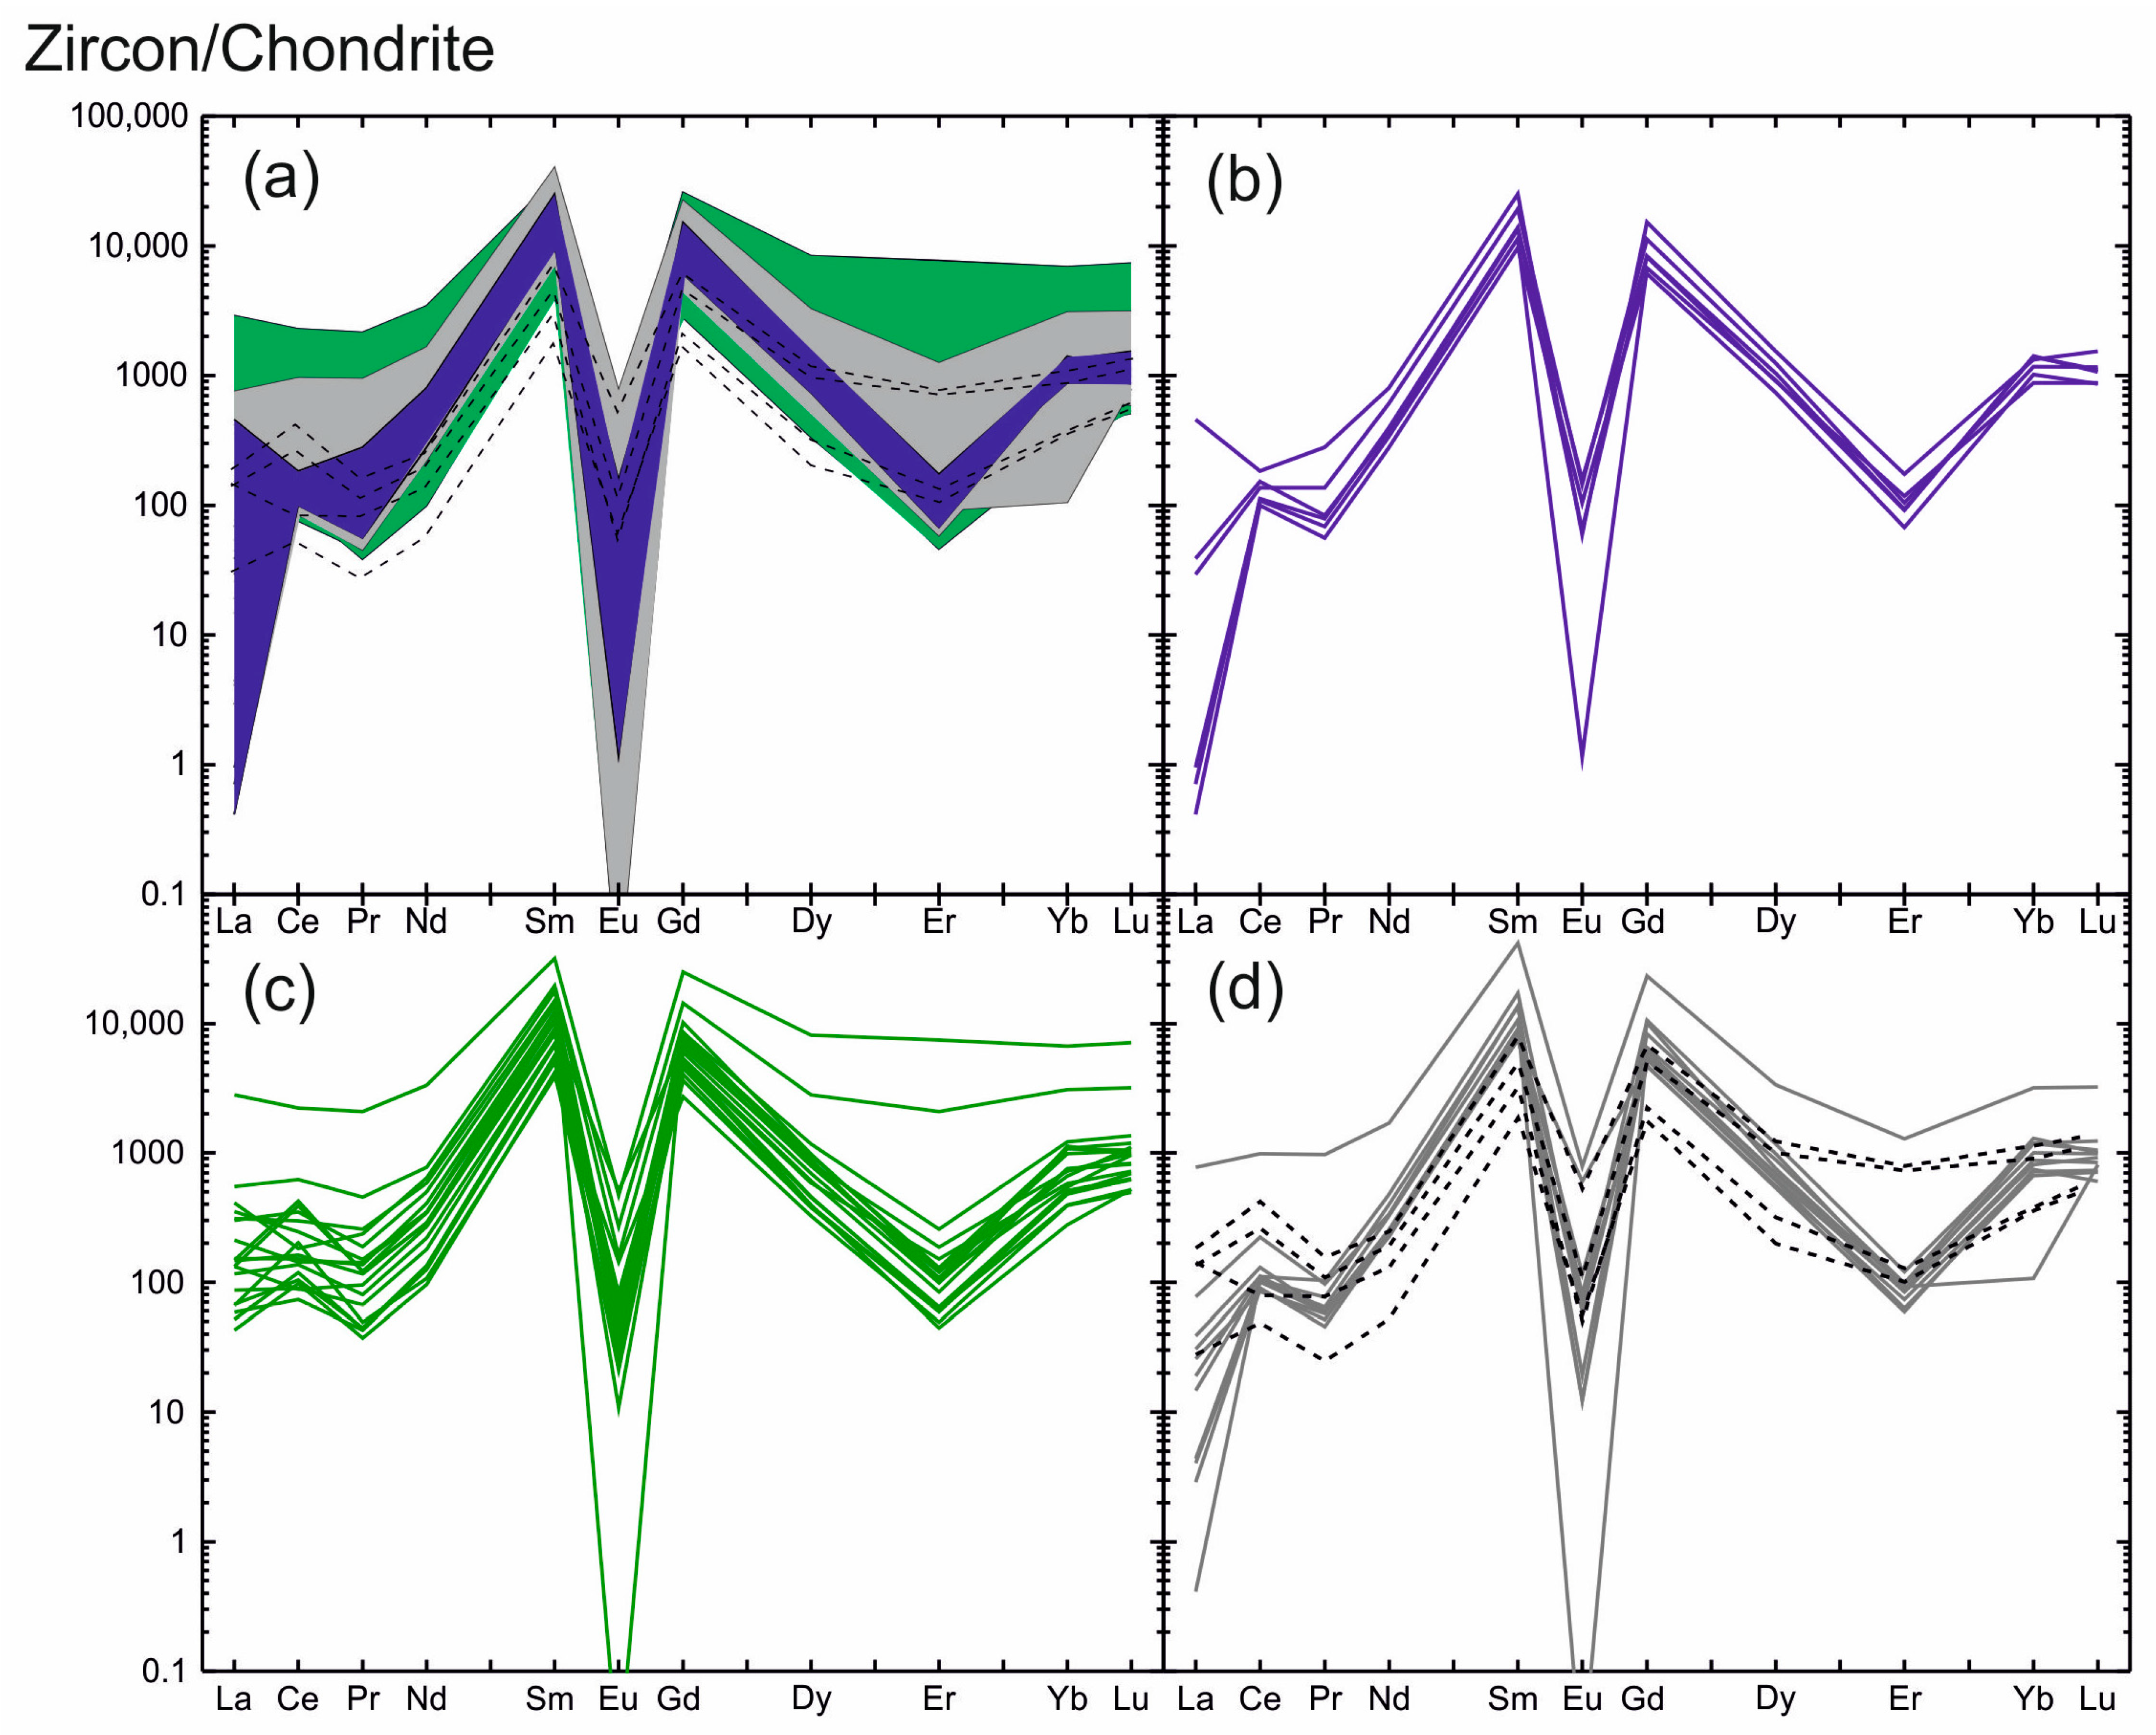
The zircon analyzed displays an unusual REE distribution. The CI chondrite-normalized REE distribution spectra [28] shown in Figure 2 demonstrate the unusual pattern of spectra, which is due to REE fractionation. The index LuN/LaN, showing the degree of REE differentiation, is 209 on average. Its highest value is shown by the light-grey and grey zircon zones (3–2540, 483 on average (Table 1)), indicating high REE differentiation in the zircon. The lowest LuN/LaN value and practically no differentiation are characteristic of the dark-grey zones (LuN/LaN = 2–14) and the fracture-filling zircon (LuN/LaN = 4–20).

Figure 2.
Zircon REE distribution patterns normalized to CI chondrite [28] showing the tetrad effect of W type: (a) blue field—the unaltered light-grey zones; green field—the altered dark-grey zones; grey field—the intermediate grey zones; crosses lines—the fracture-filling grey zones of zircon; (b) spectra of the unaltered light-grey zones; (c) spectra of the altered dark-grey zones; (d) spectra of the intermediate grey zones (grey lines) and the fracture-filling grey zones of zircon (black crossed lines).
The REE distribution spectra for all zircon zones are generally similar, differing only in the pattern and value of the Ce anomaly and minor variations in REE values (Figure 2a). The spectra display a slope from LREE to HREE with well-defined negative Eu anomaly (Eu/Eu* varies from 0.01 to lower values).
The light-grey zircon zones typically display a steeper slant showing a high degree of REE differentiation (Figure 2b). The total LREE content averages 326 ppm, while the total HREE content is higher by almost one order of magnitude (on average: 2350 ppm). The REE spectrum, as a rule, has a well-defined positive Ce anomaly (Ce/Ce*—on average: 10.8). Only one spot in the composition of light-grey zircon (spot 34, Table 1) has a Ce/Ce* of 0.51, indicating a negative Ce anomaly. The REE distribution spectra display a well-defined negative Eu anomaly with extremely low Eu/Eu* values (0.01 and less than that) and a negative depression in Er.
The contents of LREE and of HREE for the dark-grey zircon zones vary by more than one order of magnitude. The average content of LREE is 510 ppm and is 2120 ppm for HREE. The dark-grey zircon zones show a flat REE distribution pattern affected by a well-defined negative Eu anomaly and a negative depression in the Er (Figure 2c). The Eu anomaly throughout the entire zircon shows very low Eu/Eu* values varying from zero (due to Eu content below the detection limit) to 0.06. One distinctive feature of the spectrum for this zone is the absence of the Ce anomaly (Ce/Ce* is about 1). Sometimes it is negative with Ce/Ce* values of 0.51–0.83, but it is less commonly slightly positive (Ce/Ce*: 2.45–3.52).
The distribution spectra for the grey zircon zones surrounding light-grey domains are generally similar to the REE distribution spectra for the dark-grey zones. Their LREE and HREE contents are similar, as are the slope and outlines of the spectrum (Figure 2d). The zircon filling fractures in the crystal displays a highly variable REE distribution spectrum: REE content varies markedly and the Ce anomaly varies from positive to negative (Figure 2d).
4.4. Zircon Tetrad Effect
The REE distribution spectra for the zircon analyzed are affected by the tetrad effect. To quantitatively assess the tetrad effect, the third (TE3: Gd–Ho), fourth (TE4: Er–Lu) or first (TE1: La–Nd) tetrads are commonly used, if it contains no Ce anomaly [4,41]. The quantitative value of the tetrad effect in zircon from the Adui pegmatite was calculated from the first tetrad at spots with no or a minor Ce anomaly (Ce/Ce* = 0.51–1.89). The tetrad effect value was calculated using the formula proposed by [4], as follows:
t1 = √(CeN/Cet × PrN/Prt), where Cet = LaN2/3 × NdN1/3 and Prt = LaN1/3 × NdN2/4,
The tetrad effect is 0.37–0.91, on average: 0.63. The quantitative value of the tetrad effect, calculated with a more accurate formula [41], which takes into account the standard deviation of the normalized values of two central tetrad constituents, is as follows:
T1 = √(1/2 × (CeN/Cet − (PrN/Prt − 1)2
The tetrad effect here is 0.18–0.63, on average: 0.41. These values correspond to the tetrad effect of the W-type (its threshold value is less than 0.9 according to [4] and less than 0.8 considering measurement errors according to [41].
4.5. Zircon Oxygen Isotopic Composition
The oxygen isotope composition of the zircon was determined at the analytical spots, at which trace and rare earth element content values were preliminarily calculated (Figure 1, Table 1). The δ18O values obtained vary from 5.83 to 13.39‰, on average: 9.75‰. Only two spots (spots 14, 20) are consistent with the mantle δ18O value (5.3 ± 0.3‰ [44]). Other analytical spots show δ18O values of 7.61 to 13.39‰. Interestingly, no well-defined correlation between various zircon zones and their δ18O value was revealed.
5. Discussion
5.1. Conditions of Different Zircon Zones Formation
The zircon from the pegmatite of the Adui massif has a complex internal structure. It consists of several zones, which differ in morphology and color (in the BSE) and have no relationship with typical oscillation zoning in zircons of a magmatic origin. The dark-grey, grey and light-grey zones, distributed throughout the crystal, were identified. A separate zircon generation, filling crystal fractures, was recognized. The presence of micron-sized pores filled with U-Th minerals (uraninite and thorite, as indicated by SEM-EDS) throughout the entire crystal is supported by zircon mapping [22]. Only the light-grey zircon zones contain no inclusions of that type.
The zircon analyzed contains anomalously high U (up to 14.7%) and high Th (up to 2.45%) contents, which are part of the zircon’s crystalline lattice, according to the model proposed by [22]. The content of U and Th in zircons is known to be controlled by their distribution in melt, reflecting the characteristics of parent rocks or the local environment in which the zircons were formed. Typical U and Th contents in zircon from granitoid rocks, calculated by [45], vary from a few ppm to 10,800 ppm for U and from a few ppm to 9690 ppm for Th; those calculated by [46] are up to 12,090 ppm for U and up to 9690 ppm for Th. The Li-F granites from Podlesye (Czechia) were found to contain single zircon grains with about 14.75 mas.% UO2 and up to 6.64 mas.% ThO2 [47]. Higher uranium content (15.8 mas.% UO2) were found only in artificial zircon produced by the remelting of zirconium-bearing alloys and silicate rocks upon the explosion of a nuclear reactor at the Chernobyl Power Plant [48,49].
The light-grey zircon zones were shown to contain the highest content of U, reaching anomalous values (up to 147,000 ppm) and a high content of Th (up to 15,500 ppm). The zone also contained elevated contents of REE, F, Cl and water. The light-grey zones hosted the lowest contents of non-formula elements, such as Ca, Ti, Sr, Ba, etc. This feature is typical of magmatic zircon [50]. The REE distribution in these zones is highly differentiated (LuN/LaN is 1000–2000). This feature is also characteristic of magmatic derived zircons [51]. Most analytical spots for these zones displayed a well-defined Ce anomaly (Figure 2b), in which Ce/Ce* is 15–20. This feature is typical of magmatic zircons. The light-grey zircon zones, and all zircon in general, displayed a well-defined negative Eu anomaly (Figure 2a–d). The Eu/Eu* varied from 0.01 to lower values. Th/U ratio is consistent with the values accepted for magmatic zircons [46,51]. Furthermore, Th/U shows stable values (0.12–0.14). With all the above features in view, the light-grey zircon zones are regarded as the unaltered magmatic zones produced from the fluid-saturated melt enriched in U, Th, volatiles (F, Cl), REE and water.
The rugged boundaries of light-grey zircon zones are noteworthy. Such boundaries are formed upon the dissolution of the mineral [35,37]. This fact shows that the unaltered (primary) light-grey zircon was dissolved, and the light-grey zones observed are the relics of the primary zircon.
The dark gray zones of zircon, on the contrary, are characterized by a high content of non-formula elements, particularly Y (up to 23,900 ppm), Ca (up to 14,000 ppm), Sr, Nb, P, Ti, Ba and Be. The average total REE content in these zones remains at the same level as their content in the light-grey zones, but LREE’s contribution is twice as great, and HREE continues to dominate. These zones occasionally display anomalously high REE content at some spots of the dark-grey zircon. The same applies to F and Cl. Their average content in the dark-grey zones remains about the same as those in the light-grey zones, but their content abruptly increases locally (content of F is up to 3200 ppm, of Cl—930 ppm). The dark-grey zircon zones contain high water content (up to 6.88%)—a feature atypical of zircons. It has been shown [42] that the presence of REE and U, which isomorphically replace Zr in the zircon structure, makes it possible for water to become part of the zircon structure. However, water content over 1200 ppm is not typical for zircon and is only possible with the metamictization of its structure [42,43] and affected by fluids or fluid-saturated melts. It has been proved experimentally [52] that water in zircon, crystallized via fluorine-enriched fluid, may occupy over half of silicon’s structural position.
The REE distribution in the above zircon zones (Figure 2c) shows practically no differentiation (LuN/LaN = 2.54–14.5). The Ce anomaly is either absent or slightly negative. A slightly positive Ce anomaly is less common (Ce/Ce* = 0.59–2.50). The negative Eu anomaly is well-defined, Eu/Eu* is 0.01 to less than that. The above characteristics are typical of hydrothermal-metasomatic derived zircons [53]. This composition, together with the heterogeneous structure and the presence of micron-sized pores filled with submicron-sized U-Th mineral inclusions, indicate the effect of a fluid on zircon [37,54]. Thus, it is safe to assume that the above dark-grey zircon is the altered zircon. Alteration occurred at a later stage of the melt evolution as a result of the effect of the zircon fluid, which was highly saturated with water and contained incompatible (Y, LREE, Nb, etc.) and volatile elements dissolved in it, which, in turn, affected the composition of zircon.
The zircon also contains the so-called intermediate zones represented by grey zircon areas in the BSE. These zones surround the unaltered light-grey zircon zones, showing contacts with signs of dissolution (Figure 1). The zones occupy an intermediate position in the REE composition and distribution between the unaltered light-grey and the altered dark-grey zones. They still contain a lot of U, Th and Hf, but there is twice as much water and non-formula elements (Y, LREE, Nb, Ca, P, Sr, Ti) in them, which usually enter the zircon structure in large quantities under the effect of fluids [37,54]. The REE distribution spectra show similar outlines and Ce and Eu anomaly values like those in the altered dark-grey zircon (Figure 2d).
There is one more zone with a different composition. It consists of the fracture-filling zircon. Its content is the lowest of all the elements analyzed, except for Hf. The REE distribution spectra show low LuN/LaN values (4.49–20.3), which are similar to those for the altered dark-grey zones (Figure 2d) but differ in the variable Ce anomaly (Ce/Ce* = 0.75–2.49). These geochemical features of the fracture-filling zircon are indicative of their crystallization at a final stage in zircon alteration, when the magmatic system was already slightly depleted in trace and volatile constituents, but REE differentiation persisted.
5.2. Inter-Element Relationships
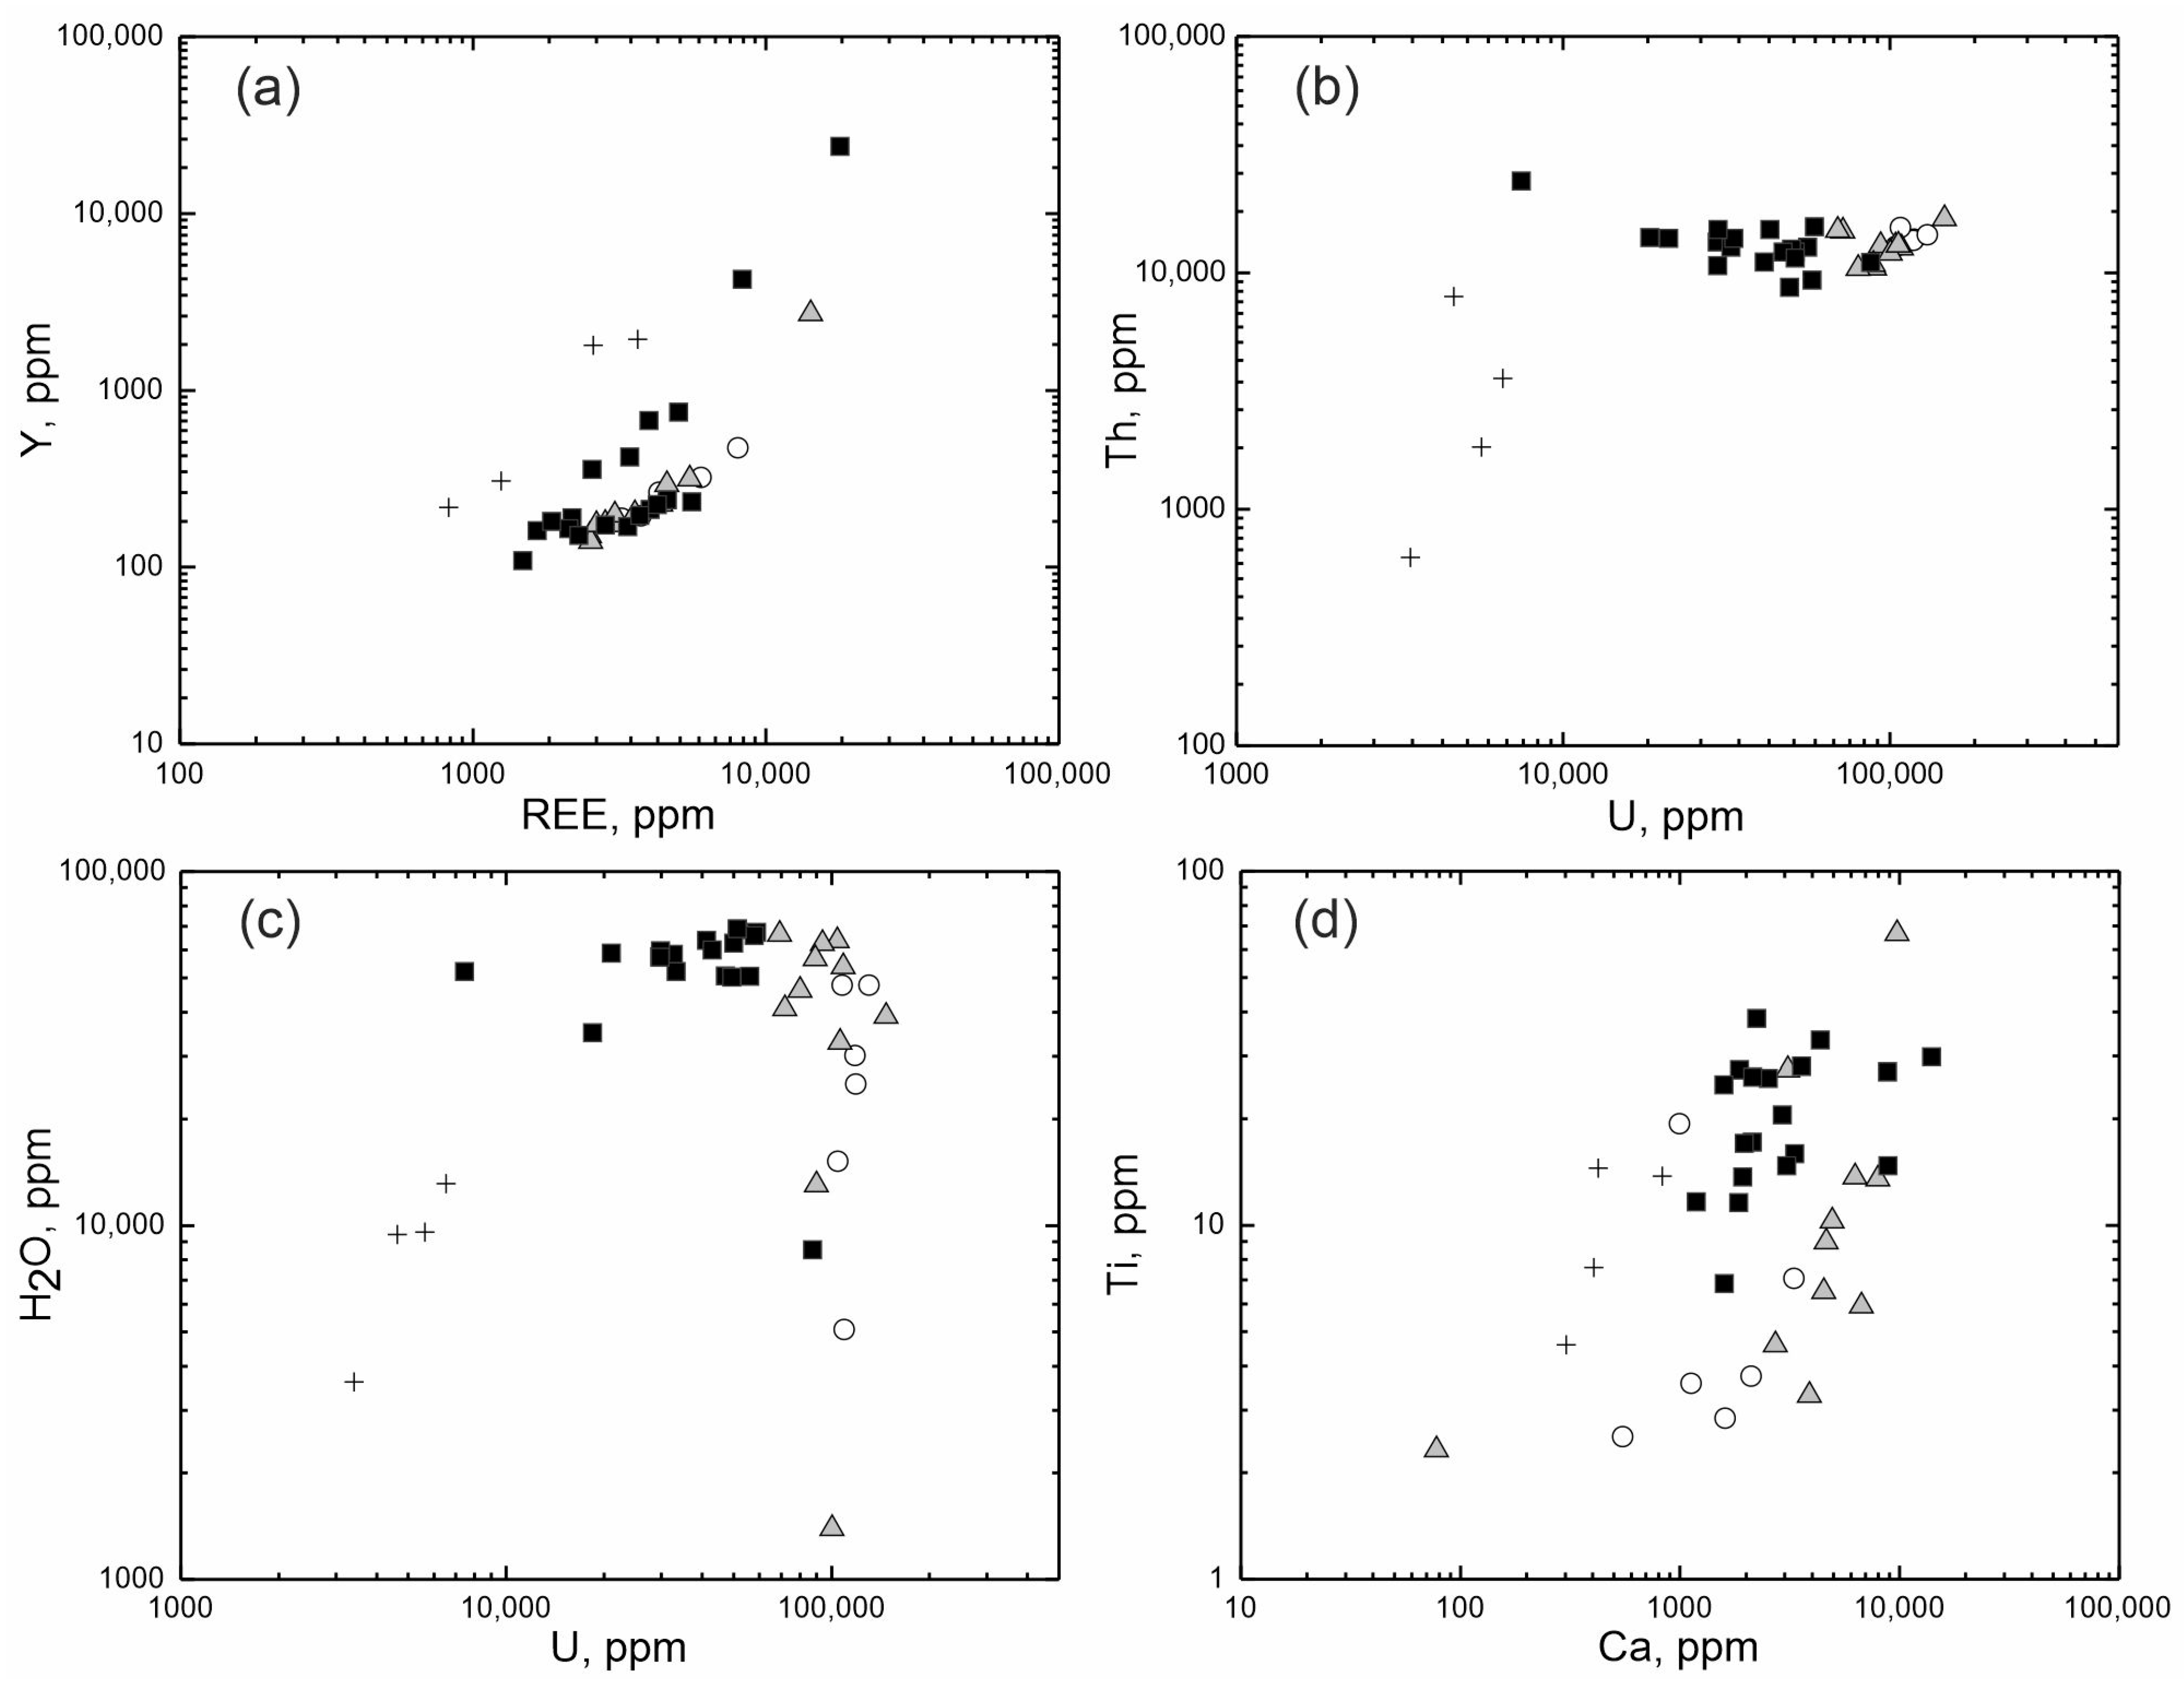
Differences of zircon composition are better demonstrated by the binary diagrams shown in Figure 3. On the diagram of the relationship between the total REE and Y (Figure 3a), different zones of zircon, without exception, form an individual linear trend with a strong positive correlation, demonstrating a regular increase in REE and Y in the composition of zircon. On the diagram, a lower position is occupied by the trend of the unaltered light-grey zircon, above which there is a trend of the intermediate grey zones. The spots of the altered dark-grey zircon are scattered relatively higher. The highest position in the diagram is occupied by fracture-filling zircon spots. Each trend demonstrates different zircon crystallization conditions, such as the REE and Y saturation of zircon proceeding from the primary unaltered zircon to an altered one, followed by a decrease in the content of trace elements for the fracture-filling zircon.

Figure 3.
The ratio of the content of elements in the studied zircon: (a) REE-Y; (b) U-Th; (c) U-H2O; (d) Ca-Ti. Open circles—the unaltered light-grey zones; filled grey triangles—the intermediate grey zones; filled black squares—the altered dark-grey zones; crosses—the fracture-filling grey zones of zircon.
The zones identified form separate groups differing in U and Th values significantly for this zircon (Figure 3b). The presented diagram shows a trend depletion by uranium from the unaltered light-grey zircon to the altered dark-grey zircon and then to the fracture-filling zircon. Th content varies far less markedly. Th content with a strong positive U correlation decreases only in zircon evolving along the fractures in the crystal.
The Ca–Ti diagram (Figure 3c) shows a trend in the increase in Ca and Ti content. It begins with the unaltered light-grey zircon, proceeds to the zircon of intermediate composition and then passes to the altered dark-grey zircon. This process is then followed by a decline in the content of the above elements in the fracture-filling zircon.
Thus, the composition varies in a gradual manner from the unaltered high-U zircon to the altered zircon enriched in incompatible elements and water. It is noteworthy that the water saturation of zircon is not correlated with its uranium enrichment (Figure 3d), indicating that slightly or highly metamict zircon is not the only reason for the water saturation of altered zircon.
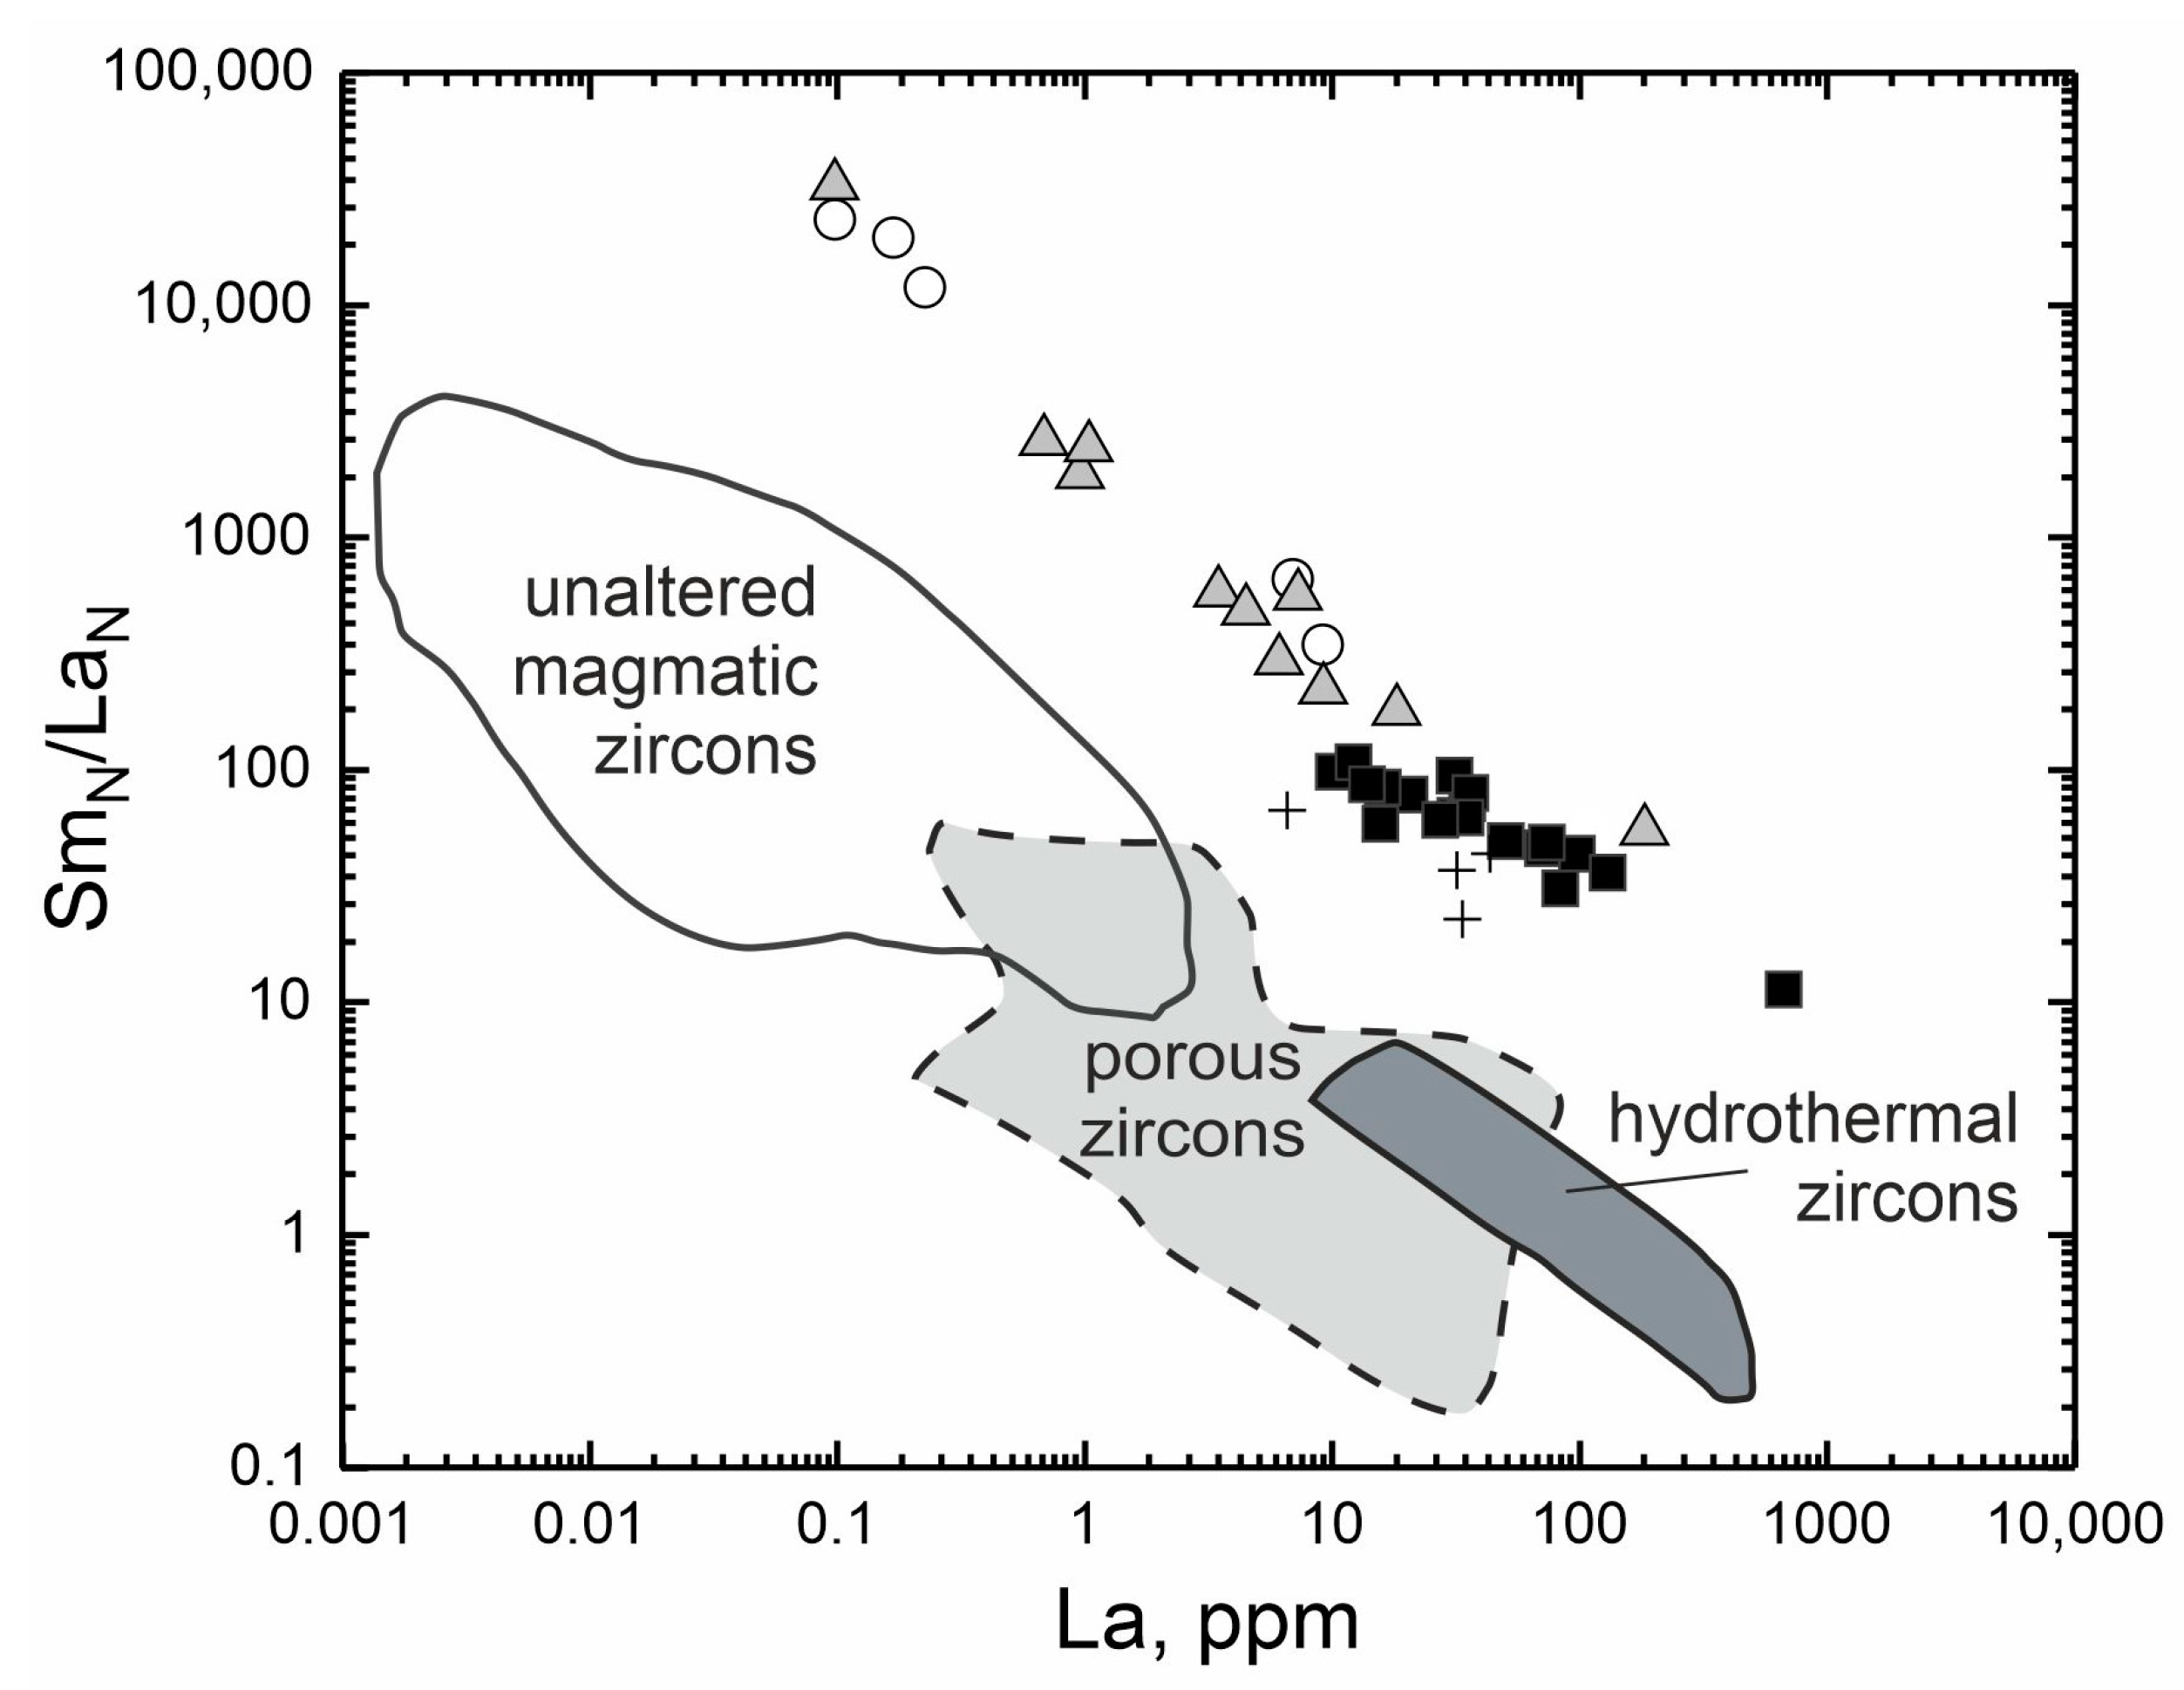
A discrimination diagram in La–SmN/LaN coordinates, demonstrating the degree of LREE differentiation, is used for the reconstruction of the formation conditions of zircon. It is used for separating zircons of a magmatic origin from zircons of hydrothermal-metasomatic origin [54] and for identifying zircons affected by fluids and named “porous” due to their distinctive internal structure [55].
The composition spots of the zircon from its various zones on the La–SmN/LaN diagram shows the gradual transition of the unaltered light-grey zircon spots to the grey zones of the intermediate composition and then to the altered dark-grey zircon (Figure 4). This transition is similar to the one in the binary diagrams. It is noteworthy that the fracture-filling zircon composition spots are grouped together with altered zircon composition spots. The fields proposed [54,55], dividing the zircon composition into a magmatic, hydrothermal-metasomatic composition and altered by fluids (“porous”), do not correspond to the composition of zircon from pegmatite of the Adui massif. The composition spots of the investigated zircon correspond to significantly higher SmN/LaN and La values. The larger range of SmN/LaN–La ratios is often displayed by zircon affected by fluids or zircon which crystallized a fluid-saturated residual melt (for examples of such zircons, see [56]).

Figure 4.
Discrimination diagrams for determining the genesis of the zircon from the pegmatite of the Adui massif. Composition fields are given according to [54,55]. Open circles—the unaltered light-grey zones; filled grey triangles—the intermediate grey zones; filled black squares—the altered dark-grey zones; crosses—the fracture-filling grey zones of zircon.
Thus, the composition spots of zircon from the Adui pegmatite in the La–SmN/LaN diagram lie above the accepted boundaries. However, if we continue along the defined boundaries, the unaltered light-grey zircon and grey zircon with an intermediate composition will fall into the field of magmatic zircons. The altered dark-grey zircon and the fracture-filling zircon will be in the “porous” zircons’ field affected by fluids. Such an assessment of the conditions for the formation of zircon coincides with the conclusions formulated above, which describe that the primary zircon was formed from a fluid-saturated melt. However, as a result of further evolution of the pegmatite-forming melt, zircon was altered. The alterations are due to the interaction of zircon with the fluid, which seems to enter through the fractures.
The gradual transition of the zircon’s composition with respect to trace elements, water, Ca, Ti, etc., allows us to consider that the altered dark-grey zircon formed as a result of the dissolution of primary magmatic zircon followed by its resedimentation with the participation of the fluid. The involved in the alteration of zircon may not only include the process of dissolution–resedimentation but also a diffusion–reaction process [22], which seems to dominate in the intermediate zone of grey zircon, and could have contributed to variations in the composition of the unaltered light-grey zones.
The impact of the fluid on zircon is responsible for an abundance of submicron-sized Th-U mineral inclusions (uraninite and thorite, by SEM-EDS) in altered zircon. During the recrystallization process of the primary high-U zircon (light-grey zones), the U interacted with the fluid, it formed its own mineral phase, which caused micron-sized inclusions in the altered (darker) zircon zones. The redistribution of elements in the zircon composition affected not only U, but also REE, F and Cl. This explains the anomalously high content of REE, F and Cl in the local zones of the altered dark-grey zircon at the same level of their average value as the unaltered zones.
5.3. The Causes of Extraordinary Ce- and Eu Anomalies
It is generally accepted that the Ce anomaly value is primarily controlled by the oxygen fugacity original magma, i.e., it was inherited from a melt [51]. As Ce exists in two valence states, Ce3+ and Ce4+, the positive Ce anomaly is explained by the fact that Ce3+ oxidizes to Ce4+ and behaves similarly to Zr4+; it enters the zircon structure by a scheme of isovalent isomorphism and is more preferable over the other LREE [57]. Moreover, the ion radius of Ce4+ is similar to that of HREE; hence, the estimated zircon/melt distribution coefficient value for Ce4+ is higher by several orders of magnitude than that for Ce3+ [23]. It is believed [58] that the positive Ce anomaly value is affected by the presence and amount of co-crystallizing titanite (or to a lesser extent by the presence of apatite and amphibole) and the presence of the water-saturated melt during zircon crystallization, which provoked a decline in the melt temperature. However, in all cases, researchers agree that the positive Ce anomaly in zircon was inherited from the melt. The negative Ce anomaly in zircon occurs less often, e.g., [15,59]. The reason for the negative Ce anomaly in zircon according to [59], which has not been inherited from the melt, is due to a hydrothermal impact on zircon. As a result, zircon is recrystallized, and Ce transitions into minerals that are potentially more enriched in Ce [59].
The negative Ce anomaly in zircon from the Adui pegmatite was revealed in the altered zircon (recrystallized to different degrees) of dark-grey and grey color in the BSE. This has led us to conclude that the negative Ce anomaly was not inherited from the primary magmatic melt, but was formed due to the influence of the fluid. This is consistent with [21], in which negative Ce anomalies in hydrothermal zircons were also revealed from the Adui granites. As the effect of the fluid on the zircon analyzed continued, a positive Ce anomaly flattened until a negative slope was formed. Zircon recrystallization was accompanied by its LREE (primarily La and Pr) enrichment due to the fluid. As a result, the negative Ce anomaly emerged in them.
The positive Ce anomaly in zircon is usually formed together with the negative Eu anomaly. This is also due to the existence of Eu in two valence states (Eu3+ and Eu2+). As the large ion radius of Eu2+ retards its isomorphism with Zr4+, Eu3+ is usually present in zircon. It is believed that the negative Eu anomaly tends to be the result of the fractional crystallization of feldspar, mainly plagioclase [51,60]. The presence of the Eu anomaly in hydrothermal zircons is considered to be a reflection of the chemical composition of the fluid [61] or due to oxygen fugacity in the zircon crystallization environment [57]. However, feldspar fractionation is only partly responsible for the presence and value of the Eu anomaly. It has been suggested [62,63] that the intense depletion of Eu at the final stage in granite crystallization is due to preferential Eu fractionation into a co-existing Cl-rich liquid aqueous phase.
Extremely low Eu content in the zircon from the Adui pegmatite, specific for both unaltered and altered zones, seems to be due to the fact that solutions variably enriched in volatile and trace elements in water are present in their crystallization environment. It has been proved experimentally [64] that in a silicate system of a felsic composition with fluid enriched with F and Cl, Eu and other REE are accumulated mainly in a fluid phase. In this case, the distribution coefficient of Eu is two to three times higher than that of theother REE, resulting in a gradual depletion of Eu in the melt.
5.4. The Cause of the Tetrad Effect
The REE distribution spectra in zircon from the Adui pegmatite are complex due to the tetrad effect, and the altered zircon spectra show a flat pattern. Such a pattern is due to the absence of REE differentiation. A spectrum with no Ce anomaly is typical of hydrothermally altered and hydrothermal zircons [51,54]. The REE distribution spectra in the unaltered zircon show the outlines of magmatic zircons [51,65]: the steep slant of the spectrum from LREE to HREE, as well as the positive Ce and negative Eu anomalies.
The zircon analyzed, which displays the tetrad effect in the REE distribution, typically shows spectra with curved (concave) tetrads of the W-type. This is defined better for the first tetrad (TE1: La–Nd) at analytical spots with no Ce anomaly (Figure 2). The value of the tetrad effect in REE fractionation at these spots does not exceed the threshold value for the W-type.
The convex character of the tetrad effect (M-type) is common in highly evolved granitoids at late differentiation stages when F-enriched fluids are present, e.g., [7,8,9,66] and others. The tetrad effect is sometimes observed in minerals, such as zircons, which inherit the tetrad effect from their host rocks [8,59]. The tetrad effect of the W-type in minerals (fluorite, cryolite) occurs in singles, e.g., [10,41,67].
The mechanism of the formation of the tetrad effect is most often associated by researchers with the separation of the melt into two immiscible liquids (silicate and fluoride) or the intervention of a fluid saturated with F, Cl, CO2 and H2O, e.g., [6,7,59] and others. The experimental study of fluoride-silicate systems by [7] has shown that REE, together with Y, are mainly accumulated in fluoride or in a fluorine-silicate melt, forming selective compounds with fluorides, while Zr, Hf, Th, U and Ti are generally inclined to stay in a silicate melt. The formation of REE-fluorine compound complexes contributes to REE fractionation, which is not controlled by ionic radius and charge, forming the tetrad effect. The formation of the tetrad effect is associated with the fact that some REE elements (La, Nd, Gd, Ho, Er and Lu) form fluoride compounds more easily [68]. As a result, they are depleted in the silicate melt during the evolution of fluoride–silicate systems, with their transition to F-salt complexes. The other REE (Ce, Pr, Sm, Eu, Tb, Dy, Tm and Yb) form compounds more readily in the silicate melt [68], where they concentrate to form the M-type tetrad effect. The W-type tetrad effect is inverse (“mirror”) to the M-type. Thus, if the tetrad effect of the M-type exists in a closed system, then the tetrad effect of the W-type is expected to exist in the same system. The tetrad effect of the M-type usually occurs in magmatic minerals and rocks, while the tetrad effect of the W-type is expected to occur in minerals derived from fluoride complexes. However, in practice, the W-type tetrad effect is rarely recorded. One of the reasons for its absence in the system was discussed by [8]. The cited authors attribute the absence of detectable tetrad effects of the W-type due to the sorption of REE (La, Nd, Gd, Ho, Er and Lu) by accessory minerals. As result, the REE spectra are flattened, forming no tetrad effect. However, the simultaneous presence of two types of the tetrad effect was revealed by [6] when studying melt inclusions in quartz and quartz-hosting ongonites. It has been found that ongonites and silicate melt inclusions display the tetrad effect of the M-type, while melt inclusions of Ca-F-composition are consistent with the W-type. Another case, in which two types (M and W-types) of the tetrad effect are present in a syenite sample, was reported by [69]. The occurrence of the MW-type tetrad effect in the cited paper is explained by the overlay of fractional crystallization of a syenite melt with a hydrothermal process involving a fluid of moderate to low salinity and elevated volatile (Cl, CO2) content. The above evidence suggests that atypical REE fractionation, leading to the tetrad effect, is due to REE redistribution between various phases (fluid/melt) or between immiscible phases separated from the melt. In both cases, the presence of F- and Cl-bearing magmatic solutions plays the leading role in the formation of the tetrad effect.
The study of melt inclusions and minerals, carried out under natural and experimental conditions, e.g., [70,71,72,73] and others, has shown that the evolution of a pegmatite-forming melts falls into several stages: an early magmatic stage, a magmatic-hydrothermal transition stage and a hydrothermal stage. According to [71], the transition from a magmatic stage to a hydrothermal stage is accompanied by the division of a magmatic system into an alumosilicate melt and a fluid phase. In the latter, elements (REE, trace elements, etc.) are largely transferred by vapors and hydrothermal solutions, while during various magmatic processes of REE are usually stable. Visible mobility of REEs is observed during hydrothermal alterations, with their mobility increasing with increasing fluid/melt ratio ([7,69] and references therein). A primary granitic magma often contains high initial volatile and light (F, Cl, B, Li, etc.) content of elements, especially pegmatite-forming melts. The zircon studied displays all the indications of the presence of fluids in the system, as has been discussed above. Thus, it seems that the controlling factor for the occurrence of the tetrad effect of the W-type in zircon from the Adui pegmatite was the presence of fluid with high water and high content of volatiles and trace elements in the pegmatite-forming melt. At present, there is no definite answer about the source of the fluid: whether it was an external fluid, or a fluid-saturated melt separated during the evolution of the original magma. In addition, the tetrad effect can be caused by the interaction of an external fluid with pegmatite magma before emplacement or with parent materials of the highly evolved granitic rocks before melting, as, for example, suggested by [13]. In this case, the tetrad effect in the zircon may be a feature of the parental fluid-saturated magma of granitic pegmatites.
5.5. Influence of Fluid on Oxygen Isotope Composition
The δ18O values, obtained for both the altered and the unaltered zones of zircon from the Adui pegmatite have a wide range (from 5.83 to 13.39‰). The most analytical spots show values markedly exceeding the mantle value (about 5.3‰) and the average established value of δ18O (6–8‰) for zircons from granitoids of Phanerozoic age [74]. In the cited paper, higher δ18O values (9–12‰) are due to crystallization from melts with a significant contribution of a crustal constituent. The considerable shift in δ18O (over 7‰) within the zircon studied should be noted. A shift of δ18O under high-temperature magma conditions in a melt/fluid system is not expected to be over 2‰ [75]. A high δ18O shift value within a single crystal indicates isotopic disequilibrium and the openness of a magmatic system to fluid [74]. The high δ18O values in the altered zones of zircon studied indicate its crystallization under disequilibrium conditions in the presence of the fluid with high δ18O values, possibly interacting with sedimentary rocks.
A zircon is typical of low oxygen diffusion rate during recrystallization in the solid phase [76]. As a result, zircon may retain primary δ18O values. In this case, oxygen diffusion upon zircon recrystallization under both aqueous and anhydrous conditions is much higher than the diffusion of trivalent and tetravalent cations (REE, U, Th and Hf) [76]. The zircon of the Adui pegmatite displays signs of the alteration and redistribution of its trace (U, REE) and volatile (F, Cl) elements as a result of the dissolution–reprecipitation process (for dark-grey and grey zones). For the intermediate grey zones, there is a diffusion–reaction process of composition alteration. In this case, the unaltered (as indicated by composition and geochemistry) light-grey zones may be affected. In addition, metamictization of the highly enriched U regions of zircon promotes volumetric expansion of crystal domains, reducing the stability of zircon towards fluids and forming abundant fractures that allow fluids to penetrate its structure. The most probable cause of the oxygen isotope composition disturbance in the light-grey zones, which display a wide range of shift and variable δ18O values (5.83 to 13.39‰), is the difference degrees of influence of the fluid which interacted with sedimentary rocks, or the fluid from an “external” source. It is assumed that the fluid with a high δ18O value caused the alteration in the oxygen isotopic composition through the diffusion–reaction process.
6. Conclusions
The zircon studied from the pegmatite vein of the Adui massif is a unique crystal with atypical isotopic-geochemical features, indicating the succession of a crystallization environment caused by the evolution of a magmatic melt.
The discussed zircon is a coarse crystal with a heterogeneous internal structure. Its composition and BSE mapping have revealed several distinctive zones: the unaltered light-grey zones, the intermediate grey zones, the altered dark-grey zones and the fracture-filling zircon.
The unaltered light-grey zones occur as the preserved portions of primary zircon. They are predominantly characterized by geochemical characteristics of typical magmatic zircons, but their high content of REE, Th, volatiles and water, as well as anomalous U content (up to 14.7%), indicate the crystallization of these zones from the fluid-saturated melt enriched with U, Th, REE, volatile elements (F, Cl) and water.
The dark-grey zones that form most of the crystal represent recrystallized zircon zones re-formed due to the interaction with the fluid. Their geochemical characteristics, namely the high content of non-formula (Y, Ca, Sr, Nb, P, Ti, Ba, Be) and volatile (F, Cl) elements, the highest water content, the porous crystal structure, abundant submicron-sized U-Th mineral inclusions, the non-differentiated REE distribution spectrum, negative or no Ce anomaly, indicate that these zones correspond to the geochemical parameters of hydrothermal-metasomatic zircons. The so-called intermediate zones are grey-colored in the BSE with the characteristics of a recrystallization transition from the unaltered to the altered zones, having the greatest similarity to the altered dark-grey zones. Thus, the zircon studied shows gradation changes in composition provoked by the disequilibrium conditions of zircon crystallization and the evolution of a pegmatite-forming melt. At the final stage, the zircon was affected by fluid highly saturated with water with dissolved incompatible (Y, LREE, Nb, etc.) and volatile elements.
The uniqueness of the zircon is based on the presence of the tetrad effect in the rare element distribution. The revealed tetrad effect in zones with no Ce anomaly via a configuration corresponds to the tetrad effect of the W-type, which rarely occurs in geological objects. The fluid with high water and high volatile and trace element contents is a factor responsible for the tetrad effect in the zircon. However, at the present stage of research studies, the origin of the fluid is poorly understood. It could occur as a fluid separated at a later stage of magmatic melt fractionation or a fluid derived from an external source at a post magmatic stage. The authors tend to believe that the tetrad effect in the zircon is a feature of the parental fluid-saturated magma of granitic pegmatites.
Author Contributions
Conceptualization, E.V.L. and S.G.S.; methodology, X.L. and Q.L.; project administration, E.V.L., S.G.S. and D.A.Z.; resources, D.A.Z., X.L. and Q.L.; visualization, D.S.L.; original draft preparation, E.V.L.; review and editing, E.V.L., S.G.S., D.A.Z. and D.S.L. All authors have read and agreed to the published version of the manuscript.
Funding
This research was funded by the framework of the Russian Science Foundation, Grant No. 23-77-01014.
Data Availability Statement
Data are contained within this article.
Acknowledgments
The authors are grateful to the analysts S.G. Simakin, E.V. Potapov (Valiev IPT RAS, Yaroslavl Branch) and O.L. Galankina (IPGG RAS) for their assistance in measuring zircon element compositions.
Conflicts of Interest
The authors declare no conflicts of interest.
References
- Masuda, A.; Ikeuchi, Y. Lanthanide tetrad effect observed in marine environment. Geochem. J. 1979, 13, 19–22. [Google Scholar] [CrossRef]
- Kawabe, I.; Masuda, A. The original examples of lanthanide tetrad effect in solvent extraction: A new interpretation compatible with recent progress in REE geochemistry. Geochem. J. 2001, 35, 215–224. [Google Scholar] [CrossRef]
- Bau, M. Controls on the fractionation of isovalent trace elements in magmatic and aqueous systems: Evidence from Y/Ho, Zr/Hf, and lanthanide tetrad effect. Contrib. Mineral. Petrol. 1996, 123, 323–333. [Google Scholar] [CrossRef]
- Irber, W. The lanthanide tetrad effect and its correlation with K/Rb, Eu/Eu*, Sr/Eu, Y/Ho, and Zr/Hf of evolving peraluminous granite suites. Geochim. Cosmochim. Acta 1999, 63, 489–508. [Google Scholar] [CrossRef]
- Tang, H.F.; Liu, C.Q. Trace element geochemistry during metamorphic dehydration: A case study from the Xingzi Group of Lushan, southeast China. Geochem. J. 2002, 36, 545–561. [Google Scholar] [CrossRef]
- Peretyazhko, I.S.; Savina, E.A. Tetrad effects in the rare earth element patterns of granitoid rocks as an indicator of fluoride-silicate liquid immiscibility in magmatic systems. Petrology 2010, 18, 514–543. [Google Scholar] [CrossRef]
- Veksler, I.V.; Dorfman, A.M.; Kamenetsky, M.; Dulski, P.; Dingwell, D.B. Partitioning of lanthanides and Y between immiscible silicate and fluoride melts, fluorite and cryolite and the origin of the lanthanide tetrad effect in igneous rocks. Geochim. Cosmochim. Acta 2005, 69, 2847–2860. [Google Scholar] [CrossRef]
- Nardi, L.V.; Formoso, M.L.; Jarvis, K.; Oliveira, L.; Neto, A.C.B.; Fontana, E. REE, Y, Nb, U, and Th contents and tetrad effect in zircon from a magmatic-hydrothermal F-rich system of Sn-rare metal-cryolite mineralized granites from the Pitinga Mine, Amazonia, Brazil. J. S. Am. Earth Sci. 2012, 33, 34–42. [Google Scholar] [CrossRef]
- Gusev, A.I. Composition of magmatic and hydrothermal zircon in the Elinovskii massif, Gorny Altai. Geol. Ore Depos. 2018, 60, 708–716. [Google Scholar] [CrossRef]
- Monecke, T.; Kempe, U.; Trinkler, M.; Thomas, R.; Dulski, P.; Wagner, T. Unusual rare earth element fractionation in a tin-bearing magmatic-hydrothermal system. Geology 2011, 39, 295–298. [Google Scholar] [CrossRef]
- Bau, M. The lanthanide tetrad effect in highly evolved felsic igneous rocks—A reply to the comment by Y. Pan. Contrib. Mineral. Petrol. 1997, 128, 409–412. [Google Scholar] [CrossRef]
- Wu, C.Z.; Liu, S.H.; Gu, L.X.; Zhang, Z.Z.; Lei, R.X. Formation mechanism of the lanthanide tetrad effect for a topaz-and amazonite-bearing leucogranite pluton in eastern Xinjiang, NW China. J. Asian Earth Sci. 2011, 42, 903–916. [Google Scholar] [CrossRef]
- Liu, C.Q.; Zhang, H. The lanthanide tetrad effect in apatite from the Altay No. 3 pegmatite, Xingjiang, China: An intrinsic feature of the pegmatite magma. Chem. Geol. 2005, 214, 61–77. [Google Scholar] [CrossRef]
- Tang, Y.; Zhang, H. Lanthanide tetrads in normalized rare element patterns of zircon from the Koktokay No. 3 granitic pegmatite, Altay, NW China. Am. Mineral. 2015, 100, 2630–2636. [Google Scholar] [CrossRef]
- Lv, Z.H.; Zhang, H.; Tang, Y. Lanthanide tetrads with implications for liquid immiscibility in an evolving magmatic-hydrothermal system: Evidence from rare earth elements in zircon from the No. 112 pegmatite, Kelumute, Chinese Altai. J. Asian Earth Sci. 2018, 164, 9–22. [Google Scholar] [CrossRef]
- Popova, V.I.; Gubin, V.A. Mineralogy of the granitic ceramic pegmatites in the Aduy, Sokolovsky, and Senkovsky massifs from Middle Ural. Ural. Mineral. Collect. 2008, 15, 61–74. (In Russian) [Google Scholar]
- Popov, M.P. Geological and Mineralogical Features of Rare-Metal Mineralization in the Eastern Exocontact of the Adui Massif within the Ural Emerald-Bearing Band; UGGU: Ekaterinburg, Russia, 2014; p. 136. (In Russian) [Google Scholar]
- Smirnov, V.N.; Ivanov, K.S.; Krasnobaev, A.A.; Bushlyakov, I.N.; Kaleganov, B.A. Results of K-Ar dating of the Adui granite massif (eastern slope of the Middle Urals). Lithosphere 2006, 2, 148–156. (In Russian) [Google Scholar]
- Popov, V.S.; Bogatov, V.I.; Petrova, A.Y.; Belyatsky, B.V. Age and possible sources of granites of the Murzinka-Adui block, Middle Urals: Rb-Sr and Sm-Nd isotope data. Lithosphere 2003, 4, 3–18. (In Russian) [Google Scholar]
- Borodina, N.S.; Zamyatina, M.D.; Fershtater, G.B. New data on petrology and geochemistry of granitoids of the root zone of the Adui massif. Tr. Zavaritsky Inst. Geol. Geochem. 2016, 163, 80–85. (In Russian) [Google Scholar]
- Fershtater, G.B.; Krasnobaev, A.A.; Bea, F.; Montero, P. Geochemistry of zircon from igneous and metamorphic rocks of the Urals. Lithosphere 2012, 4, 13–29. (In Russian) [Google Scholar]
- Zamyatin, D.A.; Shchapova, Y.V.; Votyakov, S.L.; Nasdala, L.; Lenz, C. Alteration and chemical U-Th-total Pb dating of heterogeneous high-uranium zircon from a pegmatite from the Aduiskii massif, middle Urals, Russia. Mineral. Petrol. 2017, 111, 475–497. [Google Scholar] [CrossRef]
- Hinton, R.W.; Upton, B.G.J. The chemistry of zircon: Variations within and between large crystals from syenite and alkali basalt xenoliths. Geochim. Cosmochim. Acta 1991, 55, 3287–3302. [Google Scholar] [CrossRef]
- Fedotova, A.A.; Bibikova, E.V.; Simakin, S.G. Ion-microprobe zircon geochemistry as an indicator of mineral genesis during geochronological studies. Geochem. Int. 2008, 46, 912–927. [Google Scholar] [CrossRef]
- Jochum, K.P.; Dingwell, D.B.; Rocholl, A.; Stoll, B.; Hofmann, A.W.; Becker, S.; Besmehn, A.; Bessette, D.; Dietze, H.-J.; Dulski, P.; et al. The preparation and preliminary characterisation of eight geological MPI-DING reference glasses for in-situ microanalysis. Geost. Newslett. 2000, 24, 87–133. [Google Scholar] [CrossRef]
- Jochum, K.P.; Stoll, B.; Herwig, K.; Willbold, M.; Hofmiann, A.W.; Amini, M.; Aarburg, S.; Abouchami, W.; Hellebrand, E.; Mocek, B.; et al. ; Stoll, B.; Herwig, K.; Willbold, M.; Hofmiann, A.W.; Amini, M.; Aarburg, S.; Abouchami, W.; Hellebrand, E.; Mocek, B.; et al. MPI-DING reference glasses for in situ microanalysis: New reference values for element concentrations and isotope ratios. Geochem. Geophys. Geosyst. 2006, 7, 44. [Google Scholar] [CrossRef]
- Rocholl, A.B.E.; Simon, K.; Jochum, K.P.; Bruhn, F.; Gehann, R.; Kramar, U.; Luecke, W.; Molzahn, M.; Pernicka, E.; Seufert, M.; et al. Chemical characterisation of NIST silicate glass certified reference material SRM 610 by ICP-MS, TIMS, LIMS, SSMS, INAA, AAS and PIXE. Geostand. Newsl. 1997, 21, 101–114. [Google Scholar] [CrossRef]
- McDonough, W.F.; Sun, S.-s. The composition of the Earth. Chem. Geol. 1995, 120, 223–253. [Google Scholar] [CrossRef]
- Watson, E.B.; Wark, D.A.; Thomas, J.B. Crystallization thermometers for zircon and rutile. Contrib. Mineral. Petrol. 2006, 151, 413–433. [Google Scholar] [CrossRef]
- Portnyagin, M.V.; Simakin, S.G.; Sobolev, A.V. Fluorine in primitive magmas of the Troodos Ophiolite complex, Cyprus: Analytical methods and main results. Geochem. Int. 2002, 40, 625–632. [Google Scholar]
- Kudryashov, N.M.; Skublov, S.G.; Galankina, O.L.; Udoratina, O.V.; Voloshin, A.V. Abnormally high-hafnium zircon from rare-metal pegmatites of the Vasin-Mylk deposit (the northeastern part of the Kola Peninsula). Geochemistry 2020, 80, 125489. [Google Scholar] [CrossRef]
- Li, X.H.; Long, W.G.; Li, Q.L.; Liu, Y.; Zheng, Y.F.; Yang, Y.H.; Chamberlain, K.R.; Wan, D.F.; Guo, C.H.; Wang, X.C.; et al. Penglai zircon megacrysts: A potential new working reference material for microbeam determination of Hf–O isotopes and U–Pb age. Geostand. Geoanalytical Res. 2010, 34, 117–134. [Google Scholar] [CrossRef]
- Tang, G.Q.; Li, X.H.; Li, Q.L.; Liu, Y.; Ling, X.X.; Yin, Q.Z. Deciphering the physical mechanism of the topography effect for oxygen isotope measurements using a Cameca IMS-1280 SIMS. J. Anal. At. Spectrom. 2015, 30, 950–956. [Google Scholar] [CrossRef]
- Tang, G.Q.; Liu, Y.; Li, Q.L.; Feng, L.J.; Wei, G.J.; Su, W.; Li, Y.; Ren, G.H.; Li, X.H. New natural and fused quartz reference materials for oxygen isotope microanalysis. At. Spectrosc. 2020, 41, 188–193. [Google Scholar] [CrossRef]
- Corfu, F.; Hanchar, J.M.; Hoskin, P.W.; Kinny, P. Atlas of zircon textures. Rev. Mineral. Geochem. 2003, 53, 469–500. [Google Scholar] [CrossRef]
- Nasdala, L.; Kronz, A.; Hanchar, J.M.; Tichomirowa, M.; Davis, D.W.; Hofmeister, W. Effects of natural radiation damage on backscattered electron images of single crystals of minerals. Am. Mineral. 2006, 91, 1739–1746. [Google Scholar] [CrossRef]
- Geisler, T.; Schaltegger, U.; Tomaschek, F. Re-equilibration of zircon in aqueous fluids and melts. Elements 2007, 3, 43–50. [Google Scholar] [CrossRef]
- Möller, A.; O’Brien, P.J.; Kennedy, A.; Kröner, A. The use and abuse of Th-U ratios in the interpretation of zircon; abstract id. 12113. In Proceedings of the EGS-AGU-EUG Joint Assembly, Nice, France, 6–11 April 2003. [Google Scholar]
- Kirkland, L.; Smithies, R.H.; Taylor, R.J.M.; Evans, N.; McDonald, B. Zircon Th/U ratios in magmatic environs. Lithos 2015, 212, 397–414. [Google Scholar] [CrossRef]
- Yakymchuk, A.; Kirkland, C.L.; Clark, C. Th/U ratios in metamorphic zircon. J. Metamorph. Geol. 2018, 36, 715–737. [Google Scholar] [CrossRef]
- Monecke, T.; Kempe, U.; Monecke, J.; Sala, M.; Wolf, D. Tetrad effect in rare earth element distribution patterns: A method of quantification with application to rock and mineral samples from granite-related rare metal deposits. Geochim. Cosmochim. Acta 2002, 66, 1185–1196. [Google Scholar] [CrossRef]
- Nasdala, L.; Wenzel, M.; Vavra, G.; Irmer, G.; Wenzel, T.; Kober, B. Metamictization of natural zircon: Accumulation versus thermal annealing of radioactivity-induced damage. Contrib. Mineral. Petrol. 2001, 141, 125–144. [Google Scholar] [CrossRef]
- De Hoog, J.C.M.; Lissenberg, C.J.; Brooker, R.A.; Hinton, R.; Trail, D.; Hellebrand, E. Hydrogen incorporation and charge balance in natural zircon. Geochim. Cosmochim. Acta 2014, 141, 472–486. [Google Scholar] [CrossRef]
- Valley, J.W.; Kinney, P.D.; Schulze, D.J.; Spicuzza, M.J. Zircon megacrysts from kimberlite: Oxygen isotope variability among mantle melts. Contrib. Mineral. Petrol. 1998, 133, 1–11. [Google Scholar] [CrossRef]
- Xiang, W.; Griffin, W.L.; Jie, C.; Pinyun, H.; Xiang, L.I. U and Th contents and Th/U ratios of zircon in felsic and mafic magmatic rocks: Improved zircon-melt distribution coefficients. Acta Geol. Sinica 2011, 85, 164–174. [Google Scholar] [CrossRef]
- Belousova, E.A.; Griffin, W.L.; O’Reilly, S.Y.; Fisher, N.L. Igneous zircon: Trace element composition as an indicator of source rock type. Contrib. Mineral. Petrol. 2002, 143, 602–622. [Google Scholar] [CrossRef]
- Breiter, K.; Förster, H.J.; Škoda, R. Extreme P-, Bi-, Nb-, Sc-, U- and F-rich zircon from fractionated perphosphorous granites: The peraluminous Podlesí granite system, Czech Republic. Lithos 2006, 88, 15–34. [Google Scholar] [CrossRef]
- Anderson, Ε.B.; Burakov, Β.E.; Pazukhin, Ε.M. High-Uranium zircon from “Chernobyl Lavas”. Radiochim. Acta 1993, 60, 149–152. [Google Scholar] [CrossRef]
- Geisler, T.; Burakov, B.E.; Zirlin, V.; Nikolaeva, L.; Pöml, P.A. Raman spectroscopic study of high-uranium zircon from the Chernobyl. Eur. J. Miner. 2005, 17, 883–894. [Google Scholar] [CrossRef]
- Harley, S.L.; Kelly, N.M. Zircon tiny but timely. Elements 2007, 3, 13–18. [Google Scholar] [CrossRef]
- Hoskin, P.W.O.; Schaltegger, U. The composition of zircon and igneous and metamorphic petrogenesis. Rev. Min. Geochem. 2003, 53, 27–62. [Google Scholar] [CrossRef]
- Caruba, R.; Baumer, A.; Ganteaume, M.; Iacconi, P. An experimental study of hydroxyl groups and water in synthetic and natural zircons: A model of metamict state. Am. Mineral. 1985, 70, 1224–1231. [Google Scholar]
- Hoskin, P.W.O.; Kinny, P.D.; Wyborn, D. Chemistry of hydrothermal zircon: Investigating timing and nature of water-rock interaction. In Water Rock Interaction, WRI-9; Arehart, G.B., Hulston, J.R., Eds.; A.A. Balkema: Rotterdam, The Netherlands, 1998; pp. 545–548. [Google Scholar]
- Hoskin, P.W. Trace-element composition of hydrothermal zircon and the alteration of Hadean zircon from the Jack Hills, Australia. Geochim. Cosmochim. Acta 2005, 69, 637–648. [Google Scholar] [CrossRef]
- Bouvier, A.S.; Ushikubo, T.; Kita, N.T.; Cavosie, A.J.; Kozdon, R.; Valley, J.W. Li isotopes and trace elements as a petrogenetic tracer in zircon: Insights from Archean TTGs and sanukitoids. Contrib. Mineral. Petrol. 2012, 163, 745–768. [Google Scholar] [CrossRef]
- Levashova, E.V.; Mamykina, M.E.; Skublov, S.G.; Galankina, O.L.; Li, Q.L.; Li, X.H. Geochemistry (TE, REE, Oxygen) of zircon from leucogranites of the Belokurikhinsky Massif, Gorny Altai, as indicator of formation conditions. Geochem. Int. 2023, 1–17. [Google Scholar] [CrossRef]
- Schulz, B.; Klemd, R.; Brätz, H. Host rock compositional controls on zircon trace element signatures in metabasites from the Austroalpine basement. Geochim. Cosmochim. Acta 2006, 70, 697–710. [Google Scholar] [CrossRef]
- Loader, M.A.; Nathwani, C.L.; Wilkinson, J.J.; Armstrong, R.N. Controls on the magnitude of Ce anomalies in zircon. Geochim. Cosmochim. Acta 2022, 328, 242–257. [Google Scholar] [CrossRef]
- Zhao, Y.; Yang, W.; Leng, C.; Shan, Q.; Niu, H.; Li, N. Exotic REE behaviors of zircon in the Koktokay No. 3 granitic pegmatite, Xinjiang, northwest China. Ore Geol. Rev. 2023, 154, 105329. [Google Scholar] [CrossRef]
- Rubatto, D. Zircon trace element geochemistry: Partitioning with garnet and the link between U-Pb ages and metamorphism. Chem. Geol. 2002, 184, 123–138. [Google Scholar] [CrossRef]
- Pelleter, E.; Cheilletz, A.; Gasquet, D.; Mouttaqi, A.; Annich, M.; El Hakour, A.; Deloule, E.; Féraud, G. Hydrothermal zircons: A tool for ion microprobe U-Pb dating of gold mineralization (Tamlalt–Menhouhou gold deposit—Morocco). Chem. Geol. 2007, 245, 135–161. [Google Scholar] [CrossRef]
- Muecke, G.K.; Clarke, D.B. Geochemical evolution of the South Mountain batholith Nova Scotia: Rare-earth element evidence. Can. Mineral. 1981, 19, 133–145. [Google Scholar]
- Candela, P.A. Theoretical constraints on the chemistry of the magmatic aqueous phase. In Ore-bearing Granite Systems: Petrogenesis and Mineralizing Processes; The Geological Society of American, Inc.: Boulder, CO, USA, 1990; pp. 11–20. [Google Scholar]
- Flynn, R.T.; Burnham, W. An experimental determination of rare earth partition coefficients between a chloride containing vapour phase and silicate melts. Geochim. Cosmochim. Acta 1978, 42, 685–701. [Google Scholar] [CrossRef]
- Hanchar, J.M.; Van Westrenen, W. Rare earth element behavior in zircon-melt systems. Elements 2007, 3, 37–42. [Google Scholar] [CrossRef]
- Zhao, Z.; Xiong, X.; Han, X.; Wang, Y.; Wang, Q.; Bao, Z.; Borming, J. Controls on the REE tetrad effect in granites: Evidence from the Qianlishan and Baerzhe Granites, China. Geochem. J. 2002, 36, 527–543. [Google Scholar] [CrossRef]
- Minuzzi, O.R.; Bastos Neto, A.C.; Formoso, M.L.; Andrade, S.; Janasi, V.A.; Flores, J.A. Rare earth element and yttrium geochemistry applied to the genetic study of cryolite ore at the Pitinga Mine (Amazon, Brazil). An. Da Acad. Bras. De Ciências 2008, 80, 719–733. [Google Scholar] [CrossRef]
- Sastri, V.S.; Bünzli, J.C.; Perumareddi, J.R.; Rao, V.R.; Rayudu, G.V.S. Modern Aspects of Rare Earths and Their Complexes; Elsevier: Amsterdam, The Netherlands, 2003. [Google Scholar] [CrossRef]
- Zhao, Z.H.; Bao, Z.W.; Qiao, Y.L. A peculiar composite M-and W-type REE tetrad effect: Evidence from the Shuiquangou alkaline syenite complex, Hebei Province, China. Chi. Sci. Bull. 2010, 55, 2684–2696. [Google Scholar] [CrossRef]
- London, D. The application of experimental petrology to the genesis and crystallization of granitic pegmatites. Can. Mineral. 1992, 30, 499–540. [Google Scholar]
- Veksler, I.V. Liquid immiscibility and its role at the magmatic–hydrothermal transition: A summary of experimental studies. Chem. Geol. 2004, 210, 7–31. [Google Scholar] [CrossRef]
- Touret, J.L.R.; Smirnov, S.Z.; Peretyazhko, I.S.; Zagorsky, V.Y.; Thomas, V.G. Magmatic-hydrothermal transition in tourmaline-bearing miarolitic pegmatites: Hydrosaline Fluids or Silica Gels? In Proceedings of the Granitic Pegmatites: The State of the Art—International Symposium, Porto, Portugal, 6–12 May 2007; pp. 92–93. [Google Scholar]
- London, D. A petrologic assessment of internal zonation in granitic pegmatites. Lithos 2014, 184, 74–104. [Google Scholar] [CrossRef]
- Valley, J.W.; Lackey, J.S.; Cavosie, A.J.; Clechenko, C.C.; Spicuzza, M.J.; Basei, M.A.S.; Bindeman, I.N.; Ferreira, V.P.; Sial, A.N.; King, E.M.; et al. 4.4 billion years of crustal maturation: Oxygen isotope ratios of magmatic zircon. Contrib. Mineral. Petrol. 2005, 150, 561–580. [Google Scholar] [CrossRef]
- Hoefs, J. Stable Isotope Geochemistry, 6th ed.; Springer: Berlin, Germany, 2009; p. 437. [Google Scholar]
- Watson, E.B.; Cherniak, D.J. Oxygen diffusion in zircon. Earth Planet. Sci. Lett. 1997, 148, 527–544. [Google Scholar] [CrossRef]
Disclaimer/Publisher’s Note: The statements, opinions and data contained in all publications are solely those of the individual author(s) and contributor(s) and not of MDPI and/or the editor(s). MDPI and/or the editor(s) disclaim responsibility for any injury to people or property resulting from any ideas, methods, instructions or products referred to in the content. |
© 2023 by the authors. Licensee MDPI, Basel, Switzerland. This article is an open access article distributed under the terms and conditions of the Creative Commons Attribution (CC BY) license (https://creativecommons.org/licenses/by/4.0/).