Abstract
A destructive Mw = 6.2 earthquake struck NW Croatia on 29 December 2020, ranking among the most hazardous events in the country in the last century. This study assesses the impact of the earthquake on the permanent geodetic stations of the Croatian national positioning system. Using a novel approach, we combined positioning station data with satellite radar data for the first time in a geodynamic study across Croatia. The analysis involved collecting daily solutions data from 11 nearby network stations as well as multi-temporal satellite images before and after the earthquake. The results reveal a significant co-seismic shift, with the Sisak reference station experiencing the largest displacement of 5 cm to the southeast. Stations up to 100 km from the epicenter exhibited horizontal shifts between 1 and 2.5 cm and vertical shifts between 2 and 4 cm. Satellite images confirmed the co-seismic effects on the permanent stations. The study establishes a strong correlation between geodetic and geological findings, suggesting that vertical displacements result from superficial deposit consolidation in the river plains due to the earthquake shaking, while positional displacement reflects tectonic block movements along the activated strike-slip fault system. The late 2020 earthquake may have further relaxed the accumulated strain on the Mt. Medvednica thrust fault system, which had ruptured in early 2020 with a lower magnitude than expected.
1. Introduction
The role of geodesy in assessing the extent and consequences of earthquakes on surface deformation has proven to be a crucial and valuable asset, enriching our understanding of seismic events in conjunction with other scientific disciplines like seismology, geophysics, and geology [1,2,3,4].
Historically, geodetic measurements have been integral to surface measurement, yielding positional or combined positional and height determinations for observed points, respectively. However, until a few decades ago, geodetic processes were labor-intensive and time-consuming.
The advent of technology and the evolution of space-borne geodesy in recent decades have transformed these measurements into rapid, reliable, and precise real-time solutions, introducing time as a fourth dimension in the resultant measurements. This temporal component has become pivotal in utilizing remote sensing technologies for monitoring crustal deformation, allowing for the observation and identification of Earth’s surface movements during specific periods and the detection of ground surface displacements.
In the realm of satellite geodesy, Global Navigation Satellite Systems (GNSS) have revolutionized geodetic measurements throughout history. GNSS technology now facilitates the real-time determination of horizontal and vertical locations worldwide within seconds, achieving unprecedented accuracy at the scale of a few centimeters or less [5,6,7,8]. The current high level of GNSS measurement precision forms the cornerstone of geodetic and geophysical research, applied in monitoring short-term crustal movements, regular inter-seismic deformations associated with plate movements [9,10], and crustal deformation monitoring [11]. Recent studies have extensively relied on GNSS observations to investigate the impact of earthquakes and subsequent ground deformations [12,13,14,15,16,17,18].
Conversely, the Satellite Aperture Radar (SAR) interferometric technique has facilitated near-real-time data acquisition over earthquake-affected regions with a short time span of just six days between repeated footage. Leveraging radar remote sensing, this technique operates independently of weather conditions or cloud cover. Its heightened sensitivity to the C-band phase enables the identification of seismic waves captured within the radar’s line of sight. Recent studies have increasingly concentrated on earthquake analysis using SAR input data, yielding multi-temporal surface deformation assessments over an extended time scale [19,20,21].
On 29 December 2020, a formidable earthquake with a magnitude of Mw = 6.2 struck NW Croatia, causing substantial damage to buildings, posing a threat to human lives, and impacting the Croatian Positioning Reference System (CROPOS). The reliability of geodetic measurements hinges on the stability of the reference framework. In the realm of GNSS measurements, the reference and accuracy are defined by a national reference frame anchored by corresponding stations ensuring geodynamic stability. CROPOS, established through a network of GNSS Continuously Operating Reference Stations (CORS), achieves high accuracy and long-term stability on a subcentimeter level [22,23].
To furnish such precision to end-users, the reference frame must exhibit exceptional stability. This stability is not only pivotal for practical applications but also serves as a crucial reference point for geodynamic and geophysical studies, where even minute-scale values play a significant role. The aftermath of the earthquake in Sisak and Glina prompted the displacement of the Cadastral Departments, while a national GNSS CORS station in the Sisak region was rendered inoperative due to substantial displacement. Motivated by these circumstances, our study delves into the analysis of surrounding national reference GNSS stations of CROPOS in a broader area around the earthquake’s epicenter. The objective is to scrutinize the earthquake’s impact on their accuracy, considering their positions serve as references for various geophysical studies, rendering their accuracy crucial to a diverse scientific and civilian audience.
Given the inadequacy of relying on a singular method for identifying surface crustal deformation, we employed two distinct remote sensing techniques: Satellite Aperture Radar (SAR) interferometric and GNSS positioning procedures. By using these concurrent yet independent methods, we aimed to provide a comprehensive and reliable assessment of surface crustal deformation. This approach aligns with recent studies emphasizing the value of multi-sensor analyses in comprehensively addressing co-seismic deformations [24].
Since the occurrence of the Mw = 6.2 Petrinja earthquake at the end of 2020, numerous studies have been conducted and published on the subject. Geomatic and geological investigations primarily focused on displacement in the narrower area surrounding the epicenter [25]. Some studies exclusively adopted an SAR analysis approach [26], while others concentrated solely on GNSS analysis, albeit with only a few GNSS stations being considered [27]. However, until now, there has been no published research specifically addressing the multi-sensor analysis of co-seismic displacement within the CROPOS network.
Our study utilized interferometric SAR processing to examine SAR phase data over the observed area, enabling the detection of centimeter-scale surface movement through a multi-temporal series of SAR data. By creating interferograms based on the time series of SAR images, we identified and tracked surface deformation events over time spans preceding and following the earthquake. This SAR analysis complements GNSS sensors, which continuously measure positioning deformations on GNSS CORS stations. The adoption of a multi-method approach allowed for an independent assessment of the obtained results and the surface deformation.
The outcomes of this multi-method analysis, presented in this paper, align with and confirm the hypotheses stated in [25], are consistent with the partial analysis in [27], and independently corroborate the analyses in [26,28]. The primary novelty of our research lies in introducing a pioneering approach by combining CROPOS GNSS stations with SAR data for the first time in a geodynamic study across Croatia. This innovative methodology provides a comprehensive analysis of the impact of the Mw = 6.2 Petrinja earthquake, offering unprecedented insights into the spatial heterogeneity of displacements and revealing potential geological structures and fault zones. Additionally, the study establishes a correlation between geodetic and geological findings, enhancing our understanding of the earthquake’s effects on both horizontal and vertical station displacements.
2. Geotectonic Setting of Study Area
Croatia lies on a seismically active area spreading over five geotectonic units, four of which are on the coastal area from the Eastern Alps and Dinarides to the Adriatic micro plate, and one in the continent: a Pannonian Basin. Most seismic events mainly occur on the coastal extent of Croatia, keeping the continental part rather still. However, recently, the Pannonian Basin activated and some of the most hazardous earthquakes in Croatian history occurred there. The Pannonian Basin, also known as the Carpathian Basin, is a significant geological and geotectonic feature located in Central Europe. It encompasses parts of several countries, including Hungary, Slovakia, Austria, Croatia, Serbia, and Romania, as shown in Figure 1a.
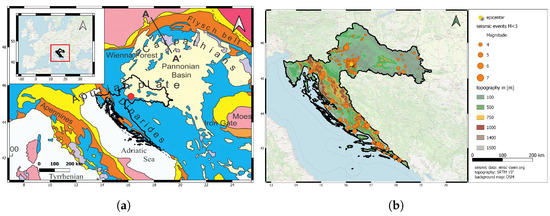
Figure 1.
Geodynamic setting of study area (a) and seismicity across Croatia (b). (a) The geodynamic setting of the surrounding area related to the earthquake location and Pannonian Basin (geotectonic background is modified from [12]); the inset figure shows the geolocation of Croatia within the European continent. (b) Seismicity map showing seismic events with magnitude M > 3 that happened over period of 2010–2023 in the Croatian territory.
The Pannonian Basin’s geotectonic setting is the result of complex interactions between multiple tectonic plates, including compressional and extensional forces, which have led to the formation of a large, subsiding sedimentary basin with a rich geological history. The Pannonian Basin is a large sedimentary basin that formed during the late stages of the Alpine orogeny, a period of mountain-building that shaped the European continent. It is considered to be a foreland basin, which means it formed on the front side of the rising Carpathian Mountains as a result of compressional tectonic forces. It is primarily a pull-apart basin formed by the extensional tectonics associated with the convergence of the European and African plates. The basin is a result of the complex interplay of various tectonic processes, including extension, compression, and strike-slip faulting.
The Pannonian Basin is characterized by ongoing tectonic activity. The extensional tectonics have led to the formation of numerous faults, grabens, and horsts within the basin. The region experiences seismic activity, and earthquakes are associated with the tectonic processes. In recent years, the European Database of Seismogenic Faults (EDSF) has been systematically assembled, encompassing fault sources deemed capable of instigating earthquakes with a magnitude equal to or exceeding 5.5. The faults delineated in the EDSF model [29] have been incorporated across the study area, as depicted in Figure 2, wherein the conspicuous alignment of the epicenter is observed to coincide with the delineated fault area.
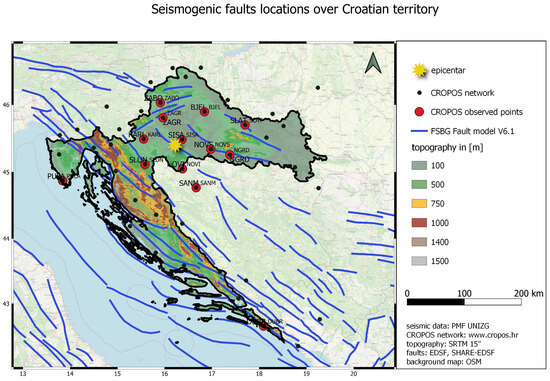
Figure 2.
CROPOS stations used in the analysis: black dots are CROPOS network stations, red dots are the CROPOS stations used in this analysis, and yellow star is the epicenter of the mainshock on 29 December 2020.
Over the past decade, Croatia has been marked by a noteworthy frequency of seismic events, with more than 250 occurrences registering magnitudes greater than 3 on the Richter scale, as shown in Figure 1b. This heightened seismic activity in Croatia is intricately linked to its complex tectonic setting, where the Adriatic microplate interacts with the Eurasian plate. The collision and convergence of these tectonic plates create a dynamic geological environment.
The earthquake occurred at a Pannonian fault, a historically famous seismological area on which Mohrovičić [30] discovered discontinuity between the crust and the mantle. However, with the first foreshock of M = 5.0 at the 28 December 2020 in the NW of Croatia, the day after, Croatia was hit with one of the most damaging earthquakes in her recent history, located in the small place known as Strašnik, near Petrinja (45.4002 N 16.2187 E) in NW Croatia. The mainshock was followed by hundreds of smaller earthquakes in the weeks after. The earthquake was declared to be VIII–IX on the Mercalli scale, leaving behind collapsed houses, damaged buildings, and a severely abandoned wider inhabitant area. Overall, the earthquake was felt even within a radius of 400 km.
3. CROPOS
CROPOS, the Croatian Positioning System, is a national geodetic infrastructure in Croatia designed for precise positioning and navigation purposes. It comprises a network of 33 Continuously Operating Reference Stations (CORS) strategically distributed across the country at a mutual distance of 70 km. CORS stations are equipped with Global Navigation Satellite System (GNSS) receivers that collect satellite signals to determine accurate three-dimensional coordinates (latitude, longitude, and elevation) for various applications. The CROPOS system became fully operational in 2008. It is available 24/7, and until this hazardous earthquake, major system crashes had not been detected since its establishment. The CROPOS system consists of a control center and reference stations.
CROPOS serves as the foundation for geodetic and cartographic activities, providing essential data for surveying, mapping, navigation, and scientific research. The system contributes to the development of geospatial information and supports applications in diverse fields, including civil engineering, land management, environmental monitoring, and disaster management.
The accuracy and stability of CROPOS are crucial for ensuring reliable geodetic measurements. This infrastructure allows for real-time or post-processed positioning solutions with high precision, enabling users to obtain accurate geospatial information for a range of applications.
The stations provide continuous GNSS measurements while CROPOS’s control center handles the transfer of these measurements and the remote control of the stations. The correction parameters are being computed based on the measured data. Differentiating the needs of the users, the CROPOS system has three different levels of accuracy (Table 1). Positioning is provided as real-time and post-processing. The real-time positioning is enabled through the differential (DPS) and highly precise positioning system (VPPS) acquiring measurements with an accuracy of 0.3–0.5 m in DPS and 0.02 m and 0.04 m for horizontal and vertical accuracy in VPPS, respectively. A post-processing positioning system (GPPS) provides original measurement data for post-processing at the highest accuracy requirements, yielding the subcentimeter accuracy.

Table 1.
CROPOS’s services.
The reference frame of the CROPOS system is defined in ETRF2000, epoch 2008.83, with a standard deviation of the reference stations’ coordinates of 1.2 mm in the N–S direction, 1.1 mm in the E–W direction, and 3.4 mm along the ellipsoidal height (reference Marjanović). The values declare the exceptional stability of the CROPOS reference frame.
For the realization of the long-term solution of the reference frame and the definition of its stability through the velocities of the stations based on the GNSS measurements, the minimal period of the continuous measurements taken over 2.5 years (Bleweet Lavalle) is needed. In several studies regarding CROPOS’s stability, displacement no greater than 1 cm was found at any off the stations, nor in the N–S, E–W, and height direction. Therefore, the CROPOS reference frame was declared to be an eminently stable GNSS reference frame. In this study, a GNSS time series has been analyzed to determine the scale of the displacement of the CROPOS CORS GNSS reference stations due to the earthquake. CROPOS is used in this study because it can contribute significantly to post-earthquake assessment by providing accurate geospatial data for monitoring surface deformations and understanding geological changes. However, we find it essential to consider the potential impact of earthquakes on the infrastructure and data quality of CROPOS, requiring careful analysis and, if necessary, adjustments to maintain its precision and reliability.
Overall, 13 stations were included in this study. Eleven stations covered the wider area around the mainshock epicenter (Figure 2) and, additionally, the two most remote stations in Croatia regarding the mainshock epicenter were included in the analysis to roughly identify whether the earthquake affected the larger area of Croatia or not. Two stations (Novi Grad-NOVI and Sanski Most-SANM) belong to the neighboring country of Bosnia and Herzegovina but, due to a bilateral agreement on the exchange of stations on the wider border area, they are also officially included in the CROPOS network and, hence, analyzed in this study.
4. Data and Methods
4.1. GNSS Data
In this study, original continuous multi-GNSS measurements of high rate (1 s) were downloaded and processed. The original measurements were downloaded in RINEX (eng. Receiver Independent Exchange) 3.03 format from the CORS CROPOS stations for the purpose of post-processing. The CORS stations provide continuous measurements in one-second intervals. However, due to substantial amount of data, authors found it appropriate to use the 30-min interval of the measurements and, therefore, origin data were resampled. For each selected CORS, daily multi-GNSS data files were generated (e.g., 1 January, 00:00:00–23:59:30) with sampling rate of 30 s (one observation per 30 s).
For each station, data of 10 days before and 10 days after the earthquake were processed. Median value of 10 days prior to earthquake for each of three coordinates (E, N, h) was used as a reference coordinate value for further analysis. Regarding the reference value, the shift in northing, easting, and height direction was computed.
Displacements (shift) of stations were calculated as the differences between values after and before the earthquake:
with horizontal shift
Each daily GNSS Rinex file consisted of 2880 epochs (24 h files with 30 s interval) and had double-frequency (L1, L2) multi-constellation data collected with Trimble NETR9 and TRM115000.00 Trimble Zephyr 3 Geodetic antennas. Antenna parameters were APC to ARP L1 = 0.064 m, L2 = 0.057 m, whereas ARP to Marker was E = N = h = 0.000 m. The results of processing were X, Y, Z coordinates for each day for each CORS in ITRF2014 (e. 2021.0). The data were processed in Precise Point Positioning (PPP) static mode using both phase and code observations. Only GPS and GLONASS data were used. IGS final orbits and clocks were used. Elevation mask was set to 10. Ionospheric free linear combination was used to eliminated ionospheric errors. The troposphere correction was modeled using the Zenithal Wet Delay (ZWD) component as a random walk process. Other corrections were applied as well, such as: Ocean Tide Loading (OTL), Earth Body Tide (EBT), Phase Center Variation (PCV) of receiver and satellites, and phase windup. Due to the high quality of measurements, ambiguity was usually fixed after 1 or 1.5 h, with a posteriori accuracy estimation ranging from 2 mm to 5 mm for E and N, and from 5 mm to 1 cm for height component.
The result of multi-GNSS data processing was three-dimensional position of the CORS, or, more precisely, geocentric Cartesian X, Y, Z coordinates. Resulting coordinates were converted to Easting (E), Northing (N), and height (h) for the purpose of all analyses. For Easting and Northing coordinates, UTM North (zone 33) projection was used. These values were then used as the basis for determination of the space–time sequences of horizontal shift of the Earth’s surface on the affected area.
All observed CROPOS GNSS reference stations were computed with the displacement shift using the adjusted daily GNSS values. To compute the displacement of the station’s position for each day before and after the earthquake, computed daily solutions were subtracted from the median value of the time series before and after earthquake values, respectively.
4.2. SAR Dataset and InSAR Analysis
In this study, Sentinel 1A interferometric wide (IW) single-look complex (SLC) C-band data are used, which cover 250 km swath with 5 m × 20 m spatial resolution. The Sentinel mission, launched in April 2014 by European Space Agency (ESA) under Copernicus program, is distributed free of charge. Detailed information about the Sentinel data is given in Table 2, and the technical information about the dataset obtained from Sentinel Scientific Hub before and after the earthquake that was used in SAR analysis is given in Table 3.
Table 2.
Properties of Sentinel 1 interferometric wide (IW) single-look complex (SLC) products.
Table 3.
Technical information on the SAR images used in the analysis.
Open-source GMTSAR academic analysis software on Ubuntu (22.10 version) platform was used to process Level 1 single-look complex (SLC) data [31]. The InSAR analysis relies on estimating the phase difference given by the complex conjugate product operation between master and slave images. Analyses were carried out in two basic steps. First, the pre-process step is the co-registration between master and slave images using precise orbit file and Digital Elevation Model (DEM) data. Next is the processing step, in which co-registered data are processed with DEM for the removal of the topographic phase to develop wrapped phase fringes. After that, wrapped phase information is unwrapped to obtain displacement by using SNAPHU and, thus, results are geo-coded to obtain the LOS displacement caused by the earthquake [32]. Deformation maps created separately for ascending and descending pass directions from the SAR analysis can be found in [26].
5. Results and Discussion
Displacements for each station are visualized in subfigures in Figure 3. The data scales on the ordinate axis of subfigures are not mutually identical since the scale of the shift differs greatly between the stations. Blue and red dots represent the behavior of the CORS GNSS station before and after the earthquake, respectively. The values displayed on the subfigures are the differences between the daily adjusted GNSS solution and the median value of the daily adjusted solution before and after the earthquake.
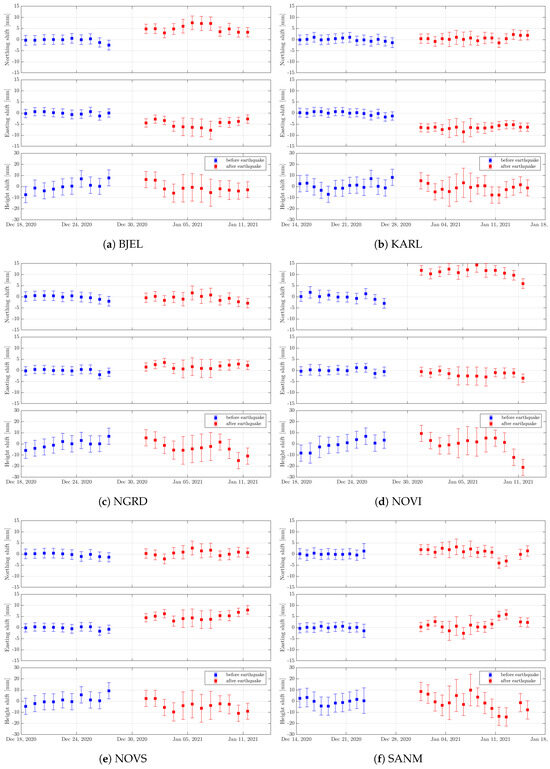
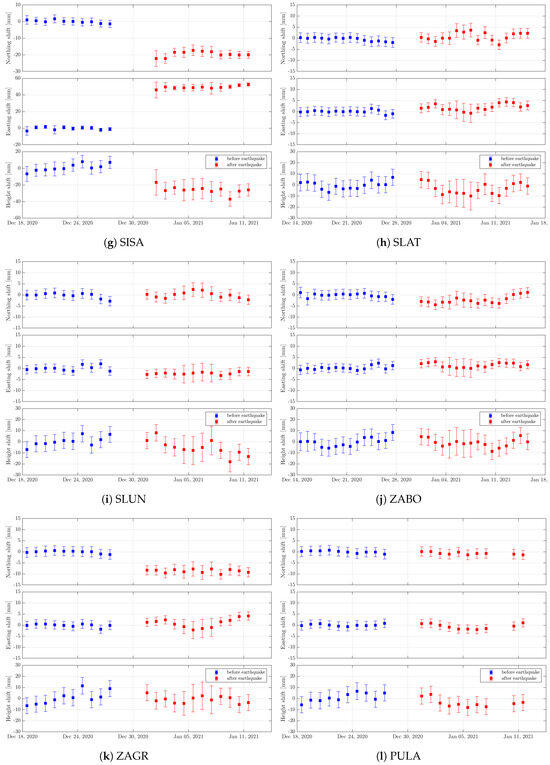
Figure 3.
The distortions in each component are computed and visualized, providing insights into how the earthquake has affected the positioning of the CORS stations. The components shown for each station are the horizontal position in the east-west direction Easting (E), horizontal position in the north-south direction Northing (N), and vertical position, i.e., height (h) components of CORS stations. The distortions are computed for period of 10 days prior (in blue color) and ten days after the earthquake (in red color) which allows for analysis of immediate impact and subsequent changes in the CORS station positions post-earthquake. By comparing the blue and red components, the subfigures facilitate a visual and numerical assessment of the extent and direction of distortions caused by the earthquake at each of the CORS stations.
As expected, Sisak (SISA) station had the biggest displacement by far. However, the magnitude of the displacement is more severe than expected: the station displaced 5 cm to the east and 1.8 cm to the south. The daily solutions after the earthquake show the stability of its behavior after the mainshock, retaining the displaced position in the following days. Regarding the height displacement, it slipped by cm with a slight trend toward depreciating even more.
Regarding the remaining observed stations, the most substantial positional and vertical displacements are evident in four specific locations: Novi Grad (NOVI), Zagreb (ZAGR), Novska (NOVS), and Bjelovar (BJEL). A comparison of these stations, their notable displacements, and their geographical positioning (as illustrated in Figure 3) indicates that stations located to the east of the epicenter are more significantly impacted than those situated on the western side. Novi Grad station has a clear shift of 1.3 cm to the north, with Zagreb shifting 1 cm to the south, Novska 1 cm to the east, and Bjelovar 0.8 cm to the north. The displacement of other components cannot be attached to the earthquake consequence due to the small values of the shift that can be considered to be the regular dynamics of daily values.
Furthermore, at some of the other stations, the displacement in one direction, although smaller, is clearly visible from the processed results: Karlovac (KARL) has visible displacement to the west, Slatina (SLAT) and Nova Gradiška have displacement to the northeast, and Zabok (ZABO) has a slight displacement to the east.
All the observed stations, regardless of the value’s magnitude, show visible earthquake-triggered behavior on the vertical component, as seen on Figure 4. The occurrence of the mainshock and the significant foreshock the day before are seen in the daily solutions of the time-series. The height behavior is rather uniform prior to the shocks, where the recovery in the initial state is visible as time goes by; the earthquake caused a vertical displacement of 1 cm, and the station returned to its original height 10 days after the occurrence of the mainshock.
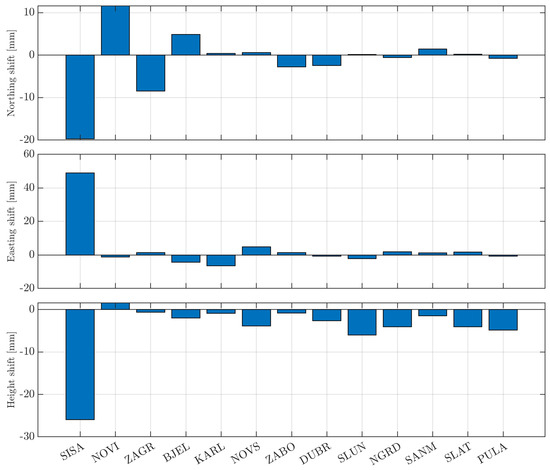
Figure 4.
Distortion of the CROPOS’s CORS stations after the earthquake.
However, the positional displacements are rather permanent; although not of a uniform trend, the shifted values have slight irregularities regarding the new position, displaying the significant impact of the hazardous earthquake: the distortion of the national reference frame.
The outlines of inhomogeneous deformation in horizontal displacements of a smaller scale are similar to the corresponding patterns of aftershocks occurring days after the mainshock. Related co-seismic deformations in the wider area of around a 100 km radius are still appearing and making their impact on land deformation. The distortion values are determined within the frame of the observed sequences. As seen from the triggered vertical displacement, the co-seismic deformation seems to gradually disappear, slowly reaching the original state. For long-term displacement determination, the analysis should be conducted after a longer time span.
Surprisingly, the strong correlation between the positional distortion and the distance from the epicenter has not been identified, as seen from the distortion shown in Figure 5. Despite the fact that the Sisak (SISA) station situated nearby the epicenter suffered the greatest shift, followed by the closely dispersed stations of NOVI and ZAGR, the stations of NOVS and BJEL, distanced 60 and 75 km away, respectively, were affected significantly more than the stations of SLUN and KARL, which are closer to the epicenter by about 20 km. The irregular impact of the earthquake noticed on the irregular positional displacement of the CROPOS stations implies the existence of several faults over the observed area. The most remote stations of the CROPOS network, PULA and DUBR, recorded the mainshock in the vertical component but didn’t record the related positional displacements.
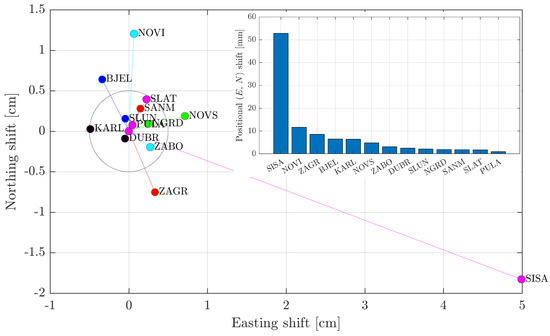
Figure 5.
Horizontal shifts of the CORS stations after the earthquake.
The conducted analysis resulted in the map of the distortion of the CROPOS reference stations affected by the earthquake, seen in Figure 6. The blue and red dots are the positions of the reference stations before and after the earthquake, respectively. The distortion scale was chosen based on the most suitable values for the visible interpretation of the displacement.
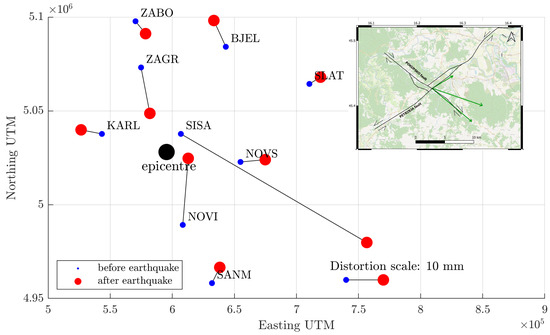
Figure 6.
Distortion of the CROPOS’s CORS stations after the earthquake.
The direction of the positional distortion is not following any seismological pattern. However, from the inset in the Figure 6, it can be seen that the stations’ positional co-seismic displacement can be the resultant vector of the tectonic blocks’ movements along the activated strike-slip fault system (details of the fault system are described in [33]). The resultant vector shown on an inset of the figure coincides with the direction of the positional shift of the SISA CROPOS station. Other observed CROPOS stations situated along the Pannonian fault have biased movement; the stations south of the epicenter, NOVI and SANM, have displacement toward the north, while the two stations situated on the northern part of the Pannonian fault regarding the epicenter, ZAGR and ZABO, shifted to the southeast, toward the epicenter. The vice versa movement of these stations implies the existence of the suspected Jastrebarsko fault, which would explain the aftershocks occuring in the vicinity of Zagreb after the Petrinja earthquake. Considering the positional shift of the remote GSNN stations as far as the Zagreb area, it is possible that the late 2020 Petrinja event additionally relaxed a strain accumulated on the thrust fault system of Mt. Medvednica which ruptured in early 2020, but with a lower magnitude than expected [33]. However, the vertical displacements could be the result of the consolidation of the superficial deposits in the Sava, Kupa, and Glina river plains [34] due to the earthquake shaking [33]. In comparison with prior research, our study addressed a critical gap by elucidating the spatial heterogeneity of displacements resulting from the earthquake. The identification of the specific stations experiencing the most substantial displacements, such as Novi Grad (NOVI), Zagreb (ZAGR), Novska (NOVS), and Bjelovar (BJEL), contributes to a more nuanced understanding of the seismic effects. Furthermore, the recognition that eastern stations exhibit a greater impact than those in the west adds a novel layer to the seismic response characterization. The significance of our work lies in its potential to refine geodetic and geophysical applications, offering insights that were not apparent in previous literature. By identifying not only the magnitude but also the spatial intricacies of station displacements, our study overcomes limitations in the existing body of knowledge, providing a more comprehensive and nuanced perspective on the aftermath of the Petrinja earthquake while also filling a gap in the understanding of the heterogeneity of seismic impacts on geodetic stations and introducing a methodological innovation that contributes significantly to the overall state of knowledge in seismogeodesy.
6. Conclusions
The devastating Petrinja earthquake, with a magnitude of Mw = 6.2, occurring on 29 December 2020 in the northwest region of Croatia, prompted a comprehensive investigation into its impact on the Croatian positioning reference system, CROPOS, specifically focusing on its 13 GNSS CORS stations. This article details the resulting major findings:
Spatial Heterogeneity of Displacement: The analysis revealed a notable 5 cm horizontal co-seismic displacement to the southeast at the earthquake’s epicenter. Also, the stations within a 100 km radius exhibited spatially heterogeneous displacement, with positional shifts ranging between 1 and 2.5 cm and vertical shifts between 2 and 4 cm. This heterogeneity, not linearly correlated with the distance from the epicenter, suggests the influence of varied geological structures and fault zones. For such a strong earthquake in an area with not-so-indented topography, the deformation is expected to impact radially.
Within the geological and tectonic domain, vertical displacements, particularly those observed in the Sava, Kupa, and Glina river plains, are attributed to the consolidation of superficial deposits induced by earthquake shaking. The positional co-seismic displacement of the stations is likely a result of tectonic block movements along the activated strike-slip fault system.
Furthermore, regional implications and thrust fault activation were noticed on the remote GNSS stations, including those in the Zagreb area, which indicated the potential relaxation of accumulated strain on the Mt. Medvednica thrust fault system, which had ruptured in early 2020 with a lower-than-expected magnitude.
Moreover, regarding the co-seismic subsidence patterns, interestingly, not all of the observed stations experienced co-seismic subsidence. Figure 4 illustrates the vertical subsidence and uplift variations, challenging a direct correlation with the distance from the epicenter. Soil composition and infrastructure intricacies contribute to these variations.
Undoubtedly, the Petrinja earthquake significantly impacted the GNSS CORS stations of the CROPOS reference system; this is especially evident at stations like SISA. This bears implications for geodetic and geophysical applications, potentially affecting the ground displacement, geodetic field measurements, and cadastral surveys in the affected area. To mitigate future disruptions and prevent the introduction of errors into positioning data, meticulous post-processing, correction efforts, careful assessment, maintenance, and redundancy planning are strongly recommended. These measures are vital for ensuring the resilience and accuracy of future geodetic operations in the affected region.
Author Contributions
Conceptualization, O.B.O.; methodology, M.V. and O.B.O.; computation, M.V., S.Y. and O.B.O.; validation, S.Y.; formal analysis, O.B.O., M.V., and S.Y.; writing—original draft preparation, O.B.O.; writing—review and editing, M.V. and S.Y.; visualization, M.V. and O.B.O. All authors have read and agreed to the published version of the manuscript.
Funding
This research was funded within the scientific project “Application of modern technologies and smart sensors in geomatics”, in 2023, from the University North, Croatia.
Data Availability Statement
Data used in this research is open and free satellite data obtained from Copernicus portal and GNSS data obtained from State Geodetic Administration for research only.
Acknowledgments
We acknowledge Tvrtko Korbar from the Croatian Geological Institute for fruitful discussion and geological insight into the matter.
Conflicts of Interest
The authors declare no conflicts of interest.
References
- McClusky, S.; Balassanian, S.; Barka, A.; Demir, C.; Ergintav, S.; Georgiev, I.; Gurkan, O.; Hamburger, M.; Hurst, K.; Kahle, H.; et al. Global Positioning System constraints on plate kinematics and dynamics in the eastern Mediterranean and Caucasus. J. Geophys. Res. 2000, 105, 5695. [Google Scholar] [CrossRef]
- Müller, M.D.; Geiger, A.; Kahle, H.G.; Veis, G.; Billiris, H.; Paradissis, D.; Felekis, S. Velocity and deformation fields in the North Aegean domain, Greece, and implications for fault kinematics, derived from GPS data 1993–2009. Tectonophysics 2013, 597–598, 34–49. [Google Scholar] [CrossRef]
- Sboras, S.; Lazos, I.; Bitharis, S.; Pikridas, C.; Galanakis, D.; Fotiou, A.; Chatzipetros, A.; Pavlides, S. Source modelling and stress transfer scenarios of the 30 October 2020 Samos earthquake: Seismotectonic implications. Turk. J. Earth Sci. 2021, 30, 699–717. [Google Scholar] [CrossRef]
- Nyst, M.; Thatcher, W. New constraints on the active tectonic deformation of the Aegean. J. Geophys. Res. B Solid Earth 2004, 109, 1–23. [Google Scholar] [CrossRef]
- Dziewicki, M.; Specht, C. Position Accuracy Evaluation of the Modernized Polish DGPS. Pol. Marit. Res. 2009, 16, 57–61. [Google Scholar] [CrossRef]
- Kim, J.; Song, J.; No, H.; Han, D.; Kim, D.; Park, B.; Kee, C. Accuracy Improvement of DGPS for Low-cost Single-frequency Receiver Using Modified Flachen Korrektur Parameter Correction. ISPRS Int. J. Geo-Inf. 2017, 6, 222. [Google Scholar] [CrossRef]
- Luo, X.; Schaufler, S.; Branzanti, M.; Chen, J. Assessing the benefits of Galileo to high-precision GNSS positioning—RTK, PPP and post-processing. Adv. Space Res. 2021, 68, 4916–4931. [Google Scholar] [CrossRef]
- Dabove, P.; Di Pietra, V. Towards high accuracy GNSS real-time positioning with smartphones. Adv. Space Res. 2019, 62, 94–102. [Google Scholar] [CrossRef]
- Kastelic, V.; Basilli, B. European Database of Seismogenic Faults, Eastern Europe Region. Available online: http://diss.rm.ingv.it/share-edsf/index.html (accessed on 8 January 2021).
- Kaftan, V.; Melnikov, A. Local Deformation Precursors of Large Earthquakes Derived from GNSS Observation Data. IOP Conf. Ser. Earth Environ. Sci. 2017, 95, 032030. [Google Scholar] [CrossRef]
- Murray-Moraleda, J. GPS: Applications in Crustal Deformation Monitoring. In Encyclopedia of Complexity and Systems Science; Springer: New York, NY, USA, 2009; pp. 4249–4283. [Google Scholar]
- Golonka, J.; Ślączka, A.; Picha, F. The Western Carpathians and Ouachitas: A comparative study of geodynamic evolution. In The Carpathians and Their Foreland: Geology and Hydrocarbon Resources; Golonka, J., Picha, F., Eds.; American Association of Petroleum Geologists: Tulsa, OK, USA, 2006. [Google Scholar]
- Caporali, A.; Floris, M.; Chen, X.; Nurce, B.; Bertocco, M.; Zurutuza, J. The November 2019 Seismic Sequence in Albania: Geodetic Constraints and Fault Interaction. Remote Sens. 2020, 12, 846. [Google Scholar] [CrossRef]
- Brooks, B.A.; Minson, S.E.; Glennie, C.L.; Nevitt, J.M.; Dawson, T.; Rubin, R.; Ericksen, T.L.; Lockner, D.; Hudnut, K.; Langenheim, V.; et al. Buried shallow fault slip from the South Napa earthquake revealed by near-field geodesy. Sci. Adv. 2017, 3, e1700525. [Google Scholar] [CrossRef] [PubMed]
- Melgar, D.; Melbourne, T.I.; Crowell, B.W.; Geng, J.; Szeliga, W.; Scrivner, C.; Santillan, M.; Goldberg, D.E. Real-Time High-Rate GNSS Displacements: Performance Demonstration during the 2019 Ridgecrest, California, Earthquakes. Seismol. Res. Lett. 2020, 91, 1943–1951. [Google Scholar] [CrossRef]
- Floyd, M.; Funning, G.; Fialko, Y.; Terry, R.; Herring, T. Survey and Continuous GNSS in the Vicinity of the July 2019 Ridgecrest Earthquakes. Seismol. Res. Lett. 2020, 91, 2047–2054. [Google Scholar] [CrossRef]
- Métivier, L.; Collilieux, X.; Lercier, D.; Altamimi, Z.; Beauducel, F. Global coseismic deformations, GNSS time series analysis, and earthquake scaling laws. J. Geophys. Res. Solid Earth 2014, 119, 9095–9109. [Google Scholar] [CrossRef]
- Xu, P.; Shu, Y.; Niu, X.; Liu, J.; Yao, W.; Chen, Q. High-rate multi-GNSS attitude determination: Experiments, comparisons with inertial measurement units and applications of GNSS rotational seismology to the 2011 Tohoku Mw9.0 earthquake. Meas. Sci. Technol. 2019, 30, 024003. [Google Scholar] [CrossRef]
- Valkaniotis, S.; Briole, P.; Ganas, A.; Elias, P.; Kapetanidis, V.; Tsironi, V.; Fokaefs, A.; Partheniou, H.; Paschos, P. The Mw = 5.6 Kanallaki Earthquake of 21 March 2020 in West Epirus, Greece: Reverse Fault Model from InSAR Data and Seismotectonic Implications for Apulia-Eurasia Collision. Geosciences 2020, 10, 454. [Google Scholar] [CrossRef]
- Melgar, D.; Ganas, A.; Taymaz, T.; Valkaniotis, S.; Crowell, B.W.; Kapetanidis, V.; Tsironi, V.; Yolsal-Çevikbilen, S.; Öcalan, T. Rupture kinematics of 2020 January 24 Mw 6.7 Doğanyol-Sivrice, Turkey earthquake on the East Anatolian Fault Zone imaged by space geodesy. Geophys. J. Int. 2020, 223, 862–874. [Google Scholar] [CrossRef]
- Dai, K.; Liu, G.; Li, Z.; Li, T.; Yu, B.; Wang, X.; Singleton, A. Extracting Vertical Displacement Rates in Shanghai (China) with Multi-Platform SAR Images. Remote Sens. 2015, 7, 9542–9562. [Google Scholar] [CrossRef]
- Grgić, I.; Bjelotomić, O.; Repanić, M.; Lučić, M.; Bašić, T. CROPOS in the function of large geodetic projects. In Proceedings of the 1st CROPOS Conference, Zagreb, Croatia, 8–9 June 2009; pp. 75–86. [Google Scholar]
- Marjanović, M. CROPOS-Croatian positioning system. Ekscentar-Stud. J. 2010, 12, 28–34. (In Croatian) [Google Scholar]
- Jian, H.; Wang, L.; Gan, W.; Zhang, K.; Li, Y.; Liang, S.; Liu, Y.; Gong, W.; Yin, X. Geodetic Model of the 2017 Mw 6.5 Mainling Earthquake Inferred from GPS and InSAR Data. Remote Sens. 2019, 11, 2940. [Google Scholar] [CrossRef]
- Markušić, S.; Stanko, D.; Penava, D.; Ivančić, I.; Bjelotomić Oršulić, O.; Korbar, T.; Sarhosis, V. Destructive Mw = 6.2 Petrinja Earthquake (Croatia) in 2020—Preliminary Multidisciplinary Research. Remote Sens. 2021, 13, 1095. [Google Scholar] [CrossRef]
- Bjelotomić Oršulić, O.; Markovinović, D.; Varga, M.; Bašić, T. Coseismic Ground Displacement after the Mw = 6.2 Earthquake in NW Croatia Determined from Sentinel-1 and GNSS CORS Data. Geosciences 2021, 11, 170. [Google Scholar] [CrossRef]
- Šugar, D.; Blagus, I. Stability and Kinematic Behaviour of CROPOS GNSS stations during the Petrinja 2020–2021 earthquake series. In Proceedings of the Book of Abstracts 16th Baška GNSS Conference, Baška, Croatia, 14–18 May 2023; pp. 67–73. [Google Scholar]
- Zhu, S.; Wen, Y.; Gong, X.; Liu, J. Coseismic and Early Postseismic Deformation of the 2020 Mw 6.4 Petrinja Earthquake (Croatia) Revealed by InSAR. Remote Sens. 2023, 15, 2617. [Google Scholar] [CrossRef]
- The European Database of Seismogenic Faults (EDSF) Compiled in the Framework of the Project SHARE. Available online: http://diss.rm.ingv.it/share-edsf/ (accessed on 18 October 2023).
- Carbonell, R.; Levander, A.; Kind, R. The Mohorovičić discontinuity beneath the continental crust: An Overview of Seismic constraints. Tectonophysics 2013, 609, 353–376. [Google Scholar] [CrossRef]
- Xu, X.; Sandwell, D.T.; Ward, L.A.; Milliner, C.W.D.; Smith-Konter, B.R.; Fang, P.; Bock, Y. Surface deformation associated with fractures near the 2019 Ridgecrest earthquake sequence. Science 2020, 370, 605–608. [Google Scholar] [CrossRef]
- Chen, C.-H.; Yeh, T.-K.; Wen, S.; Meng, G.; Han, P.; Tang, C.-C.; Liu, J.-Y.; Wang, C.-H. Unique Pre-Earthquake Deformation Patterns in the Spatial Domains from GPS in Taiwan. Remote Sens. 2020, 12, 366. [Google Scholar] [CrossRef]
- Markušić, S.; Stanko, D.; Korbar, T.; Belicć, N.; Penava, D.; Kordić, B. The Zagreb (Croatia) M5.5 Earthquake on 22 March 2020. Geosciences 2020, 7, 252. [Google Scholar]
- Pikija, M. List Sisak. In Osnovna Geološka Karta SFRJ 1:100,000; Pikija; SRFJ; Savezni Geološki Zavod: Beograd, Serbia, 1987. (In Croatian) [Google Scholar]
Disclaimer/Publisher’s Note: The statements, opinions and data contained in all publications are solely those of the individual author(s) and contributor(s) and not of MDPI and/or the editor(s). MDPI and/or the editor(s) disclaim responsibility for any injury to people or property resulting from any ideas, methods, instructions or products referred to in the content. |
© 2023 by the authors. Licensee MDPI, Basel, Switzerland. This article is an open access article distributed under the terms and conditions of the Creative Commons Attribution (CC BY) license (https://creativecommons.org/licenses/by/4.0/).