


Numerical Modelling of Double-Twisted Wire Mesh for Low-Energy Rockfall Catch Fences

Abstract
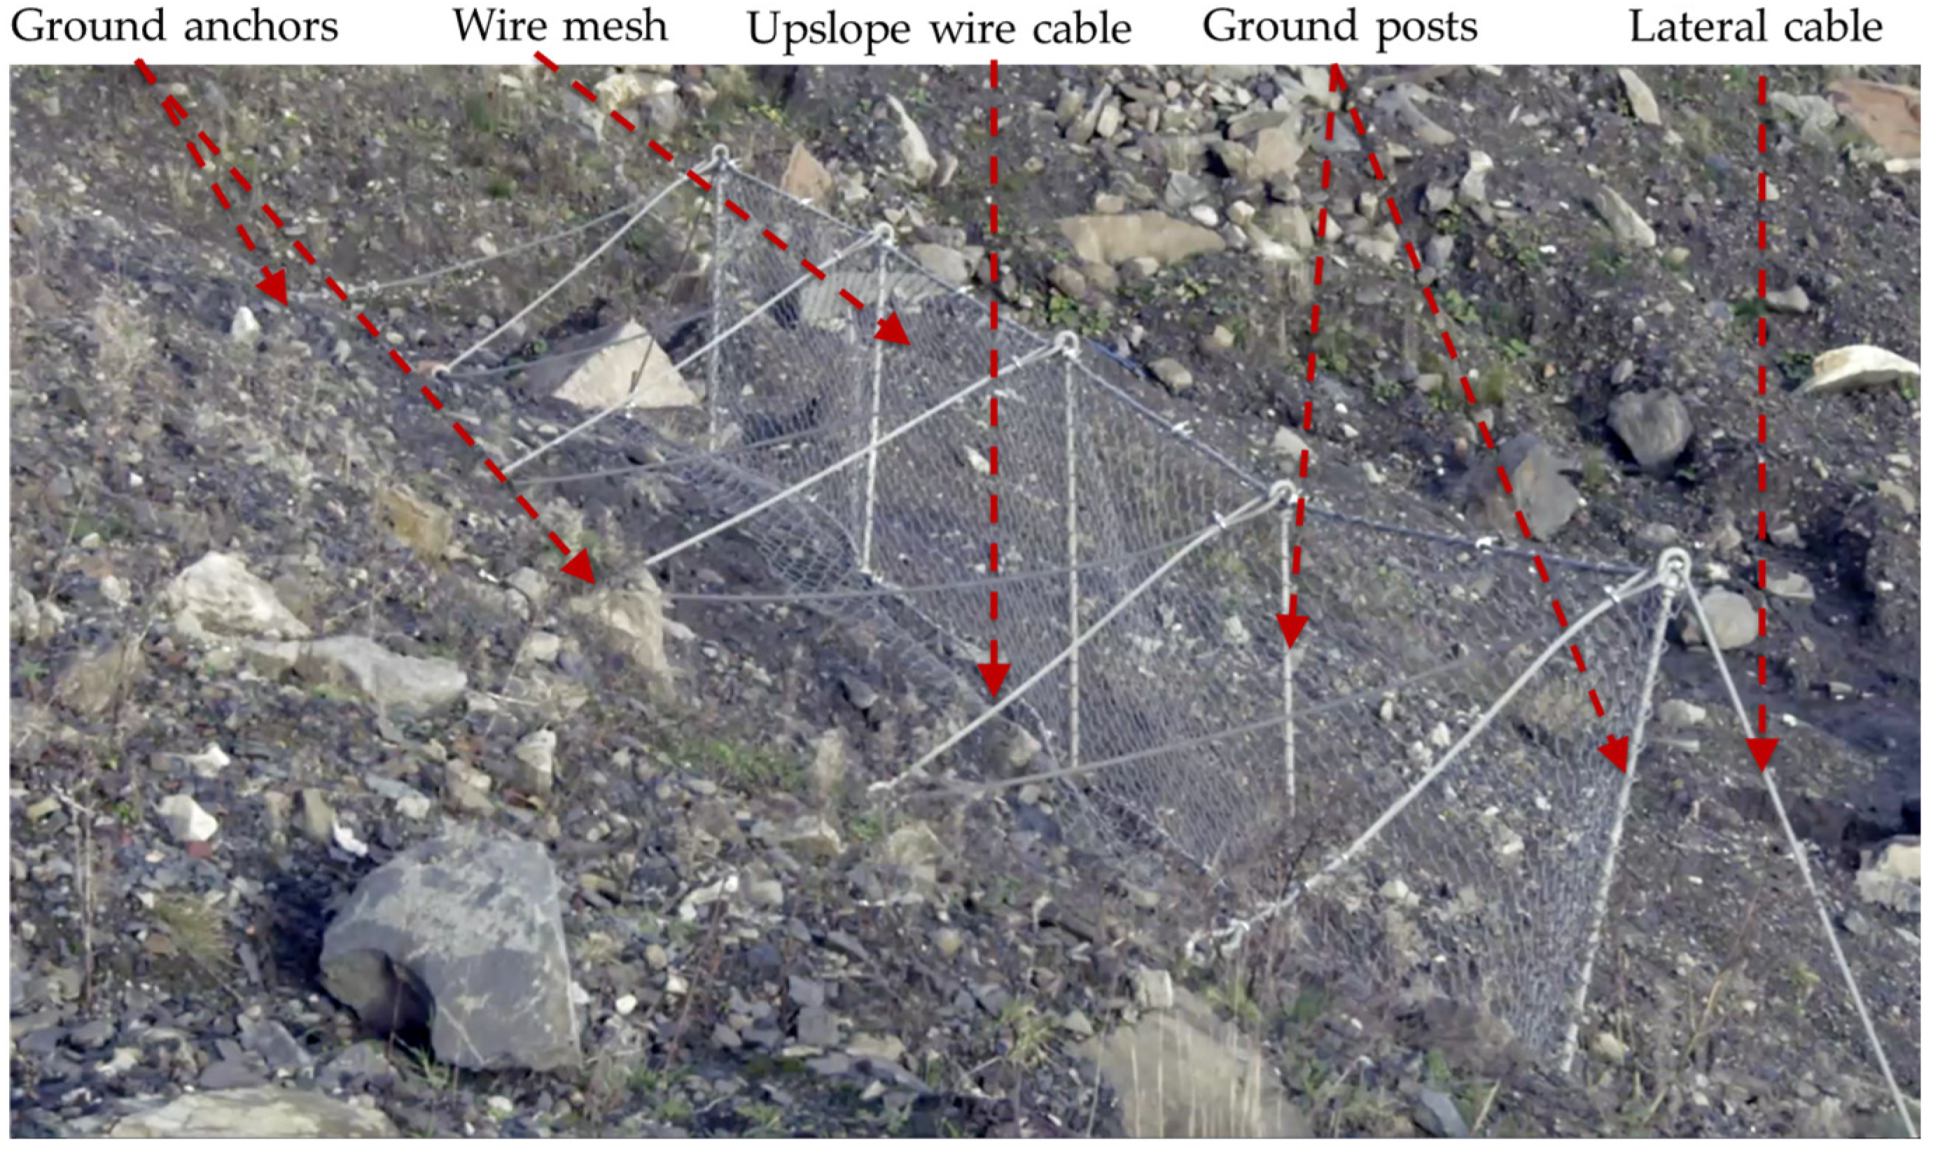
1. Introduction
2. Numerical Modelling of the Double-Twisted Wire Mesh
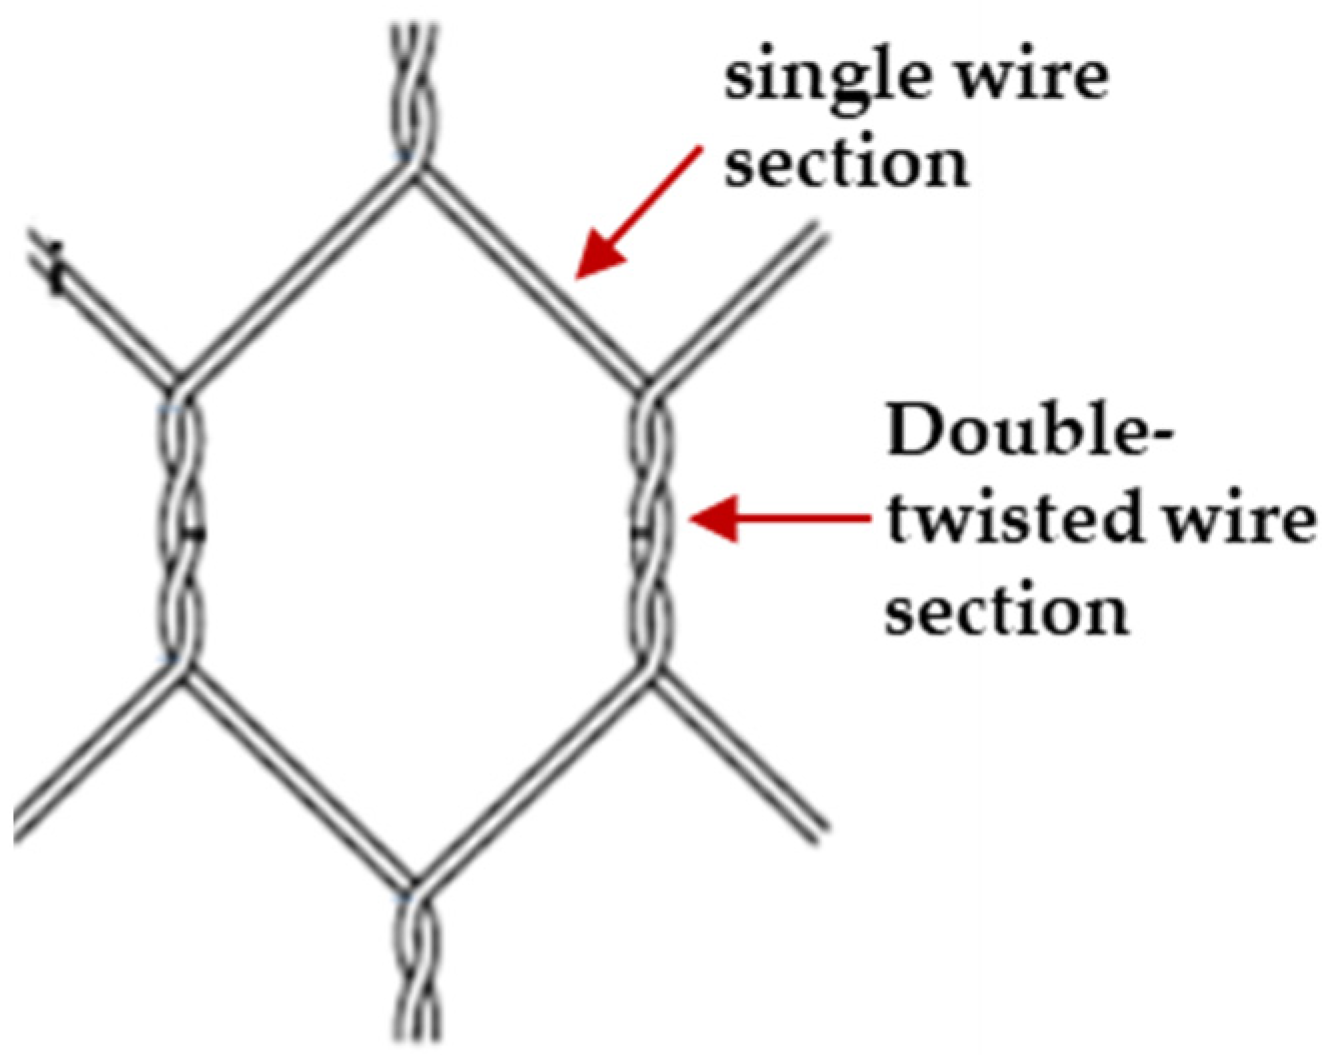
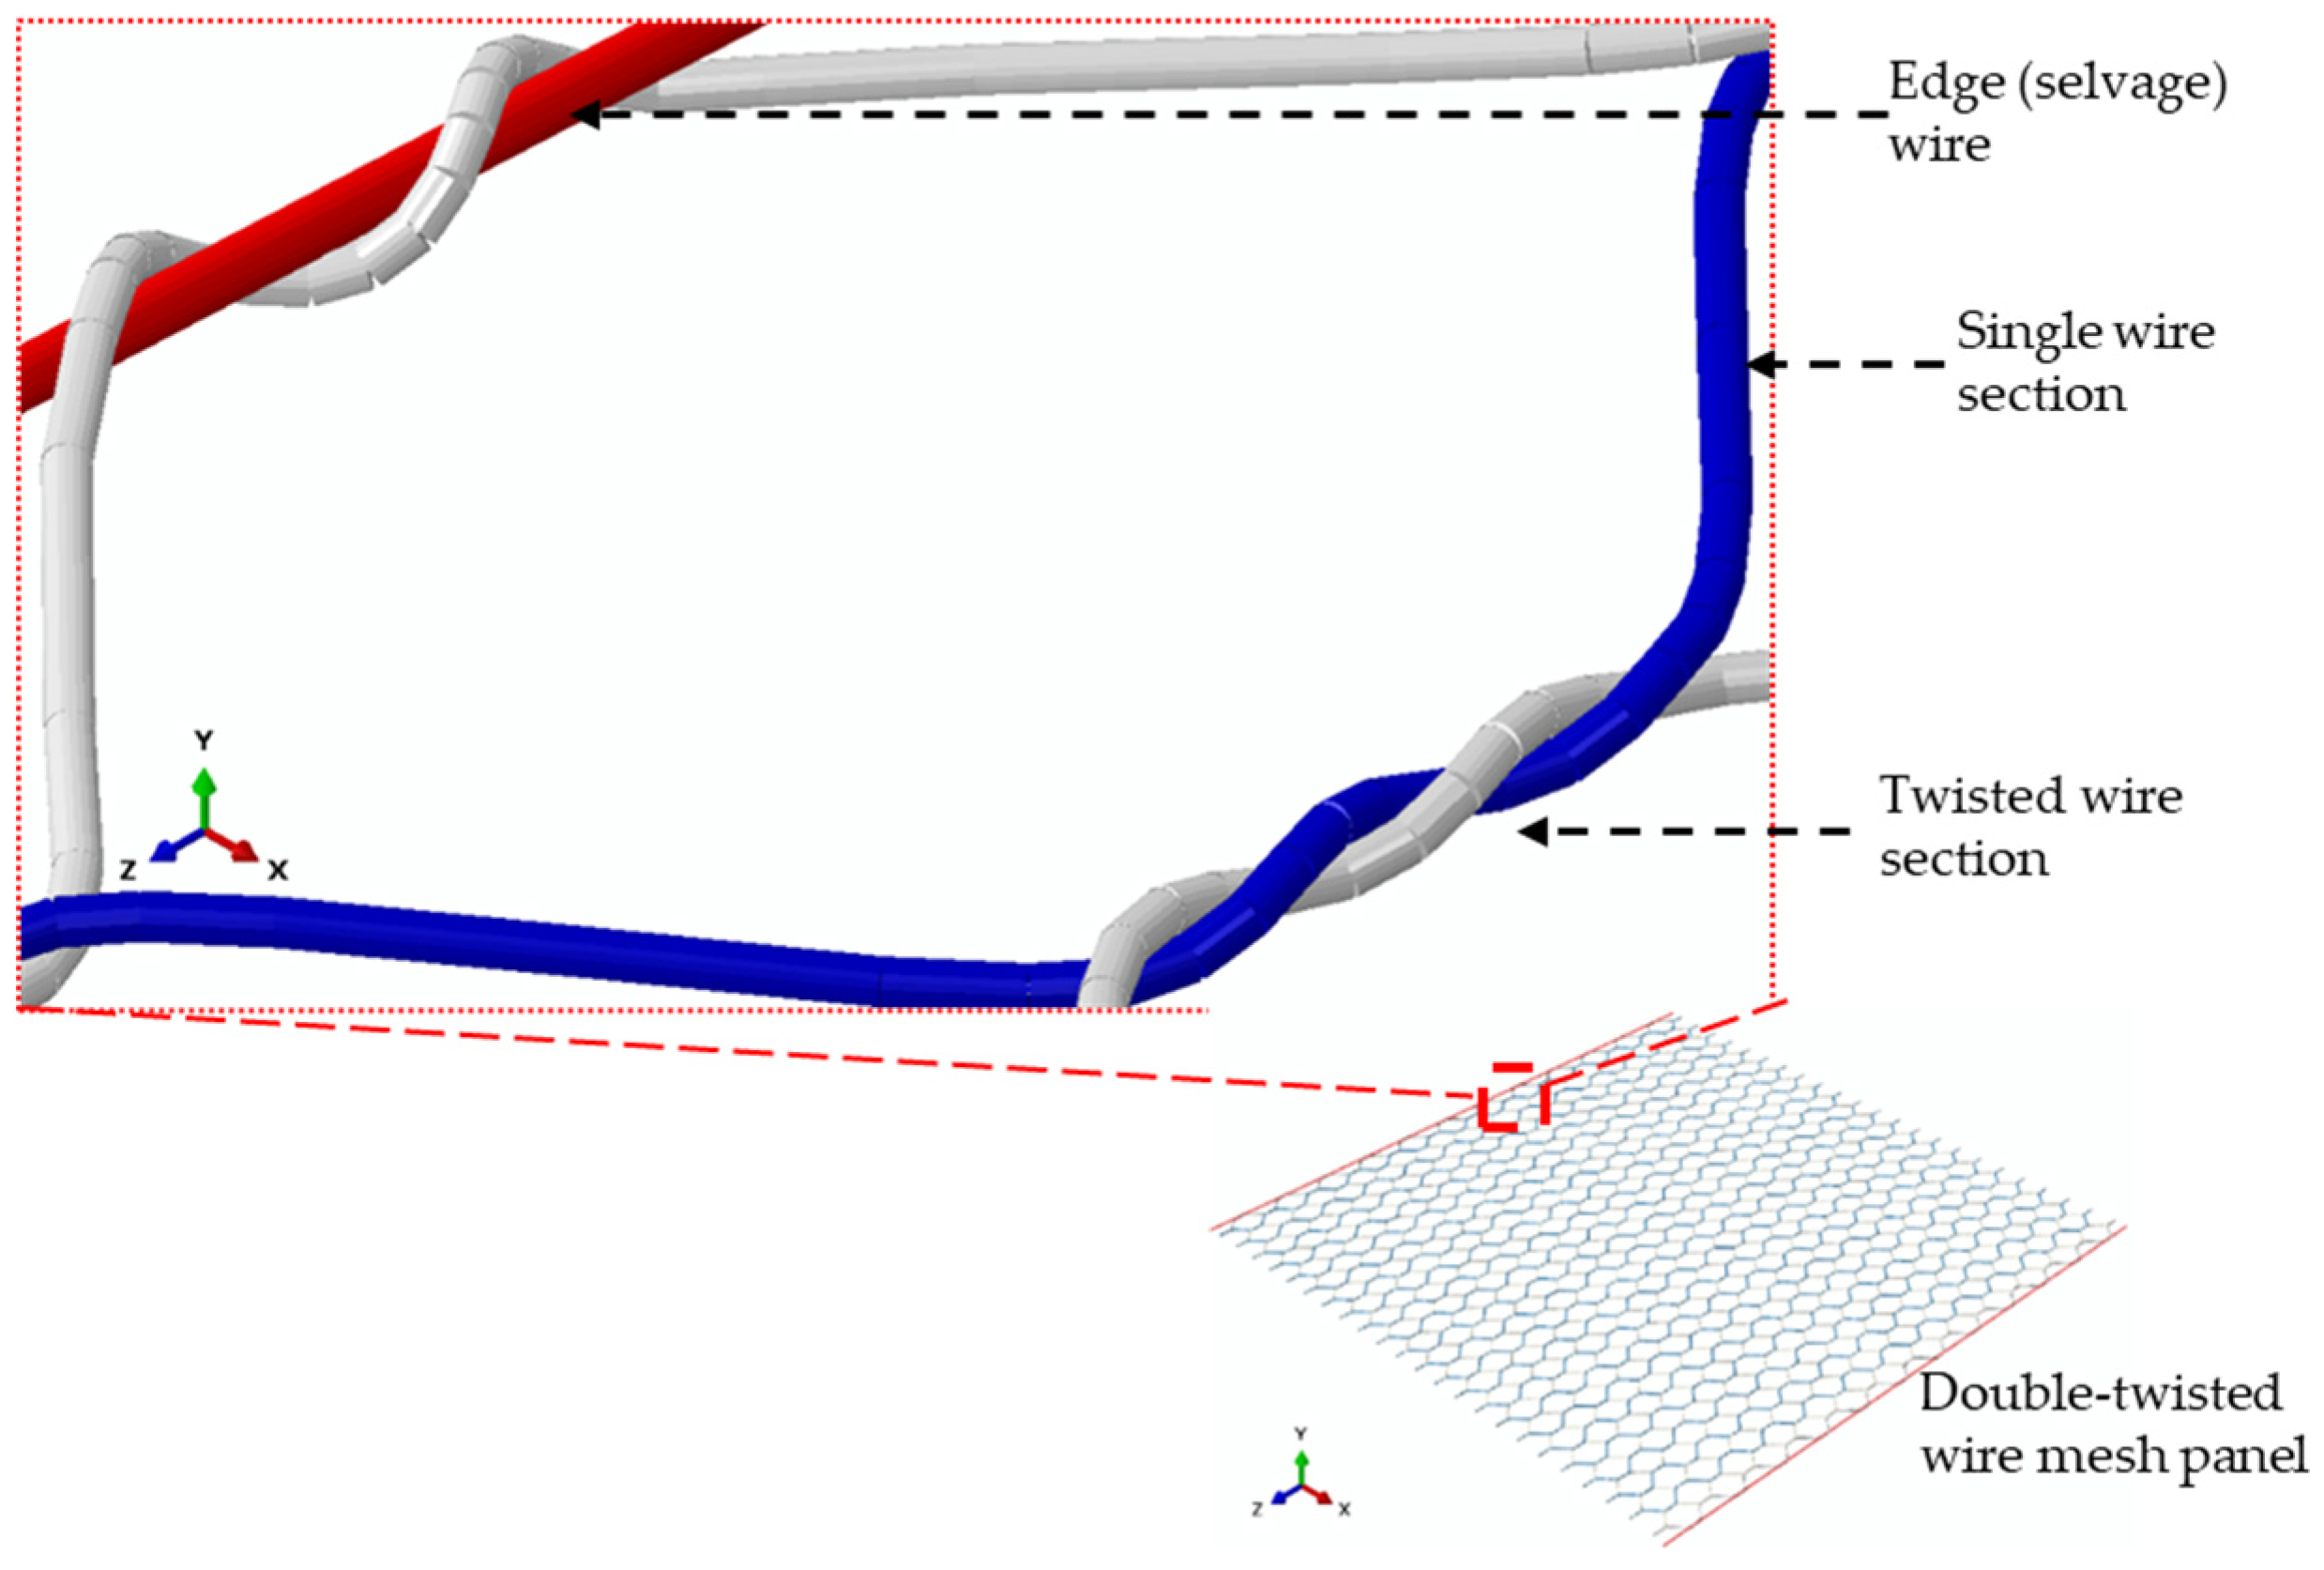
2.1. Geometrical Representation
2.2. Constitutive Model for Single Steel Wires
- 1
- The effective (undamaged) material response (a-b-c-d’). This can be extracted from the uniaxial tensile test data of single wires.
- 2
- The damage initiation criterion (Point c in Figure 7). Abaqus provides a phenomenological ductile damage criterion to predict the onset of damage due to nucleation, growth, and the coalescence of voids. The model assumes that the equivalent plastic strain at the onset of damage , is a function of stress triaxiality, , and the equivalent plastic strain rate, . The stress triaxiality is the ratio of hydrostatic stress, to the equivalent tensile (von Mises) stress.
- 3
- The damage evolution law (c–d in Figure 7). To reproduce the material response after damage initiation, it is assumed that the damage is characterized by the progressive degradation of the material stiffness and yield stress. Abaqus uses a damage variable, D, to capture the combined effect of all damage mechanisms, as shown in Figure 7. The damage variable has a range of values from zero (no damage) to unity (material failure). The softening of the material stress tensor, , is given by
3. Model Calibration and Validation Results
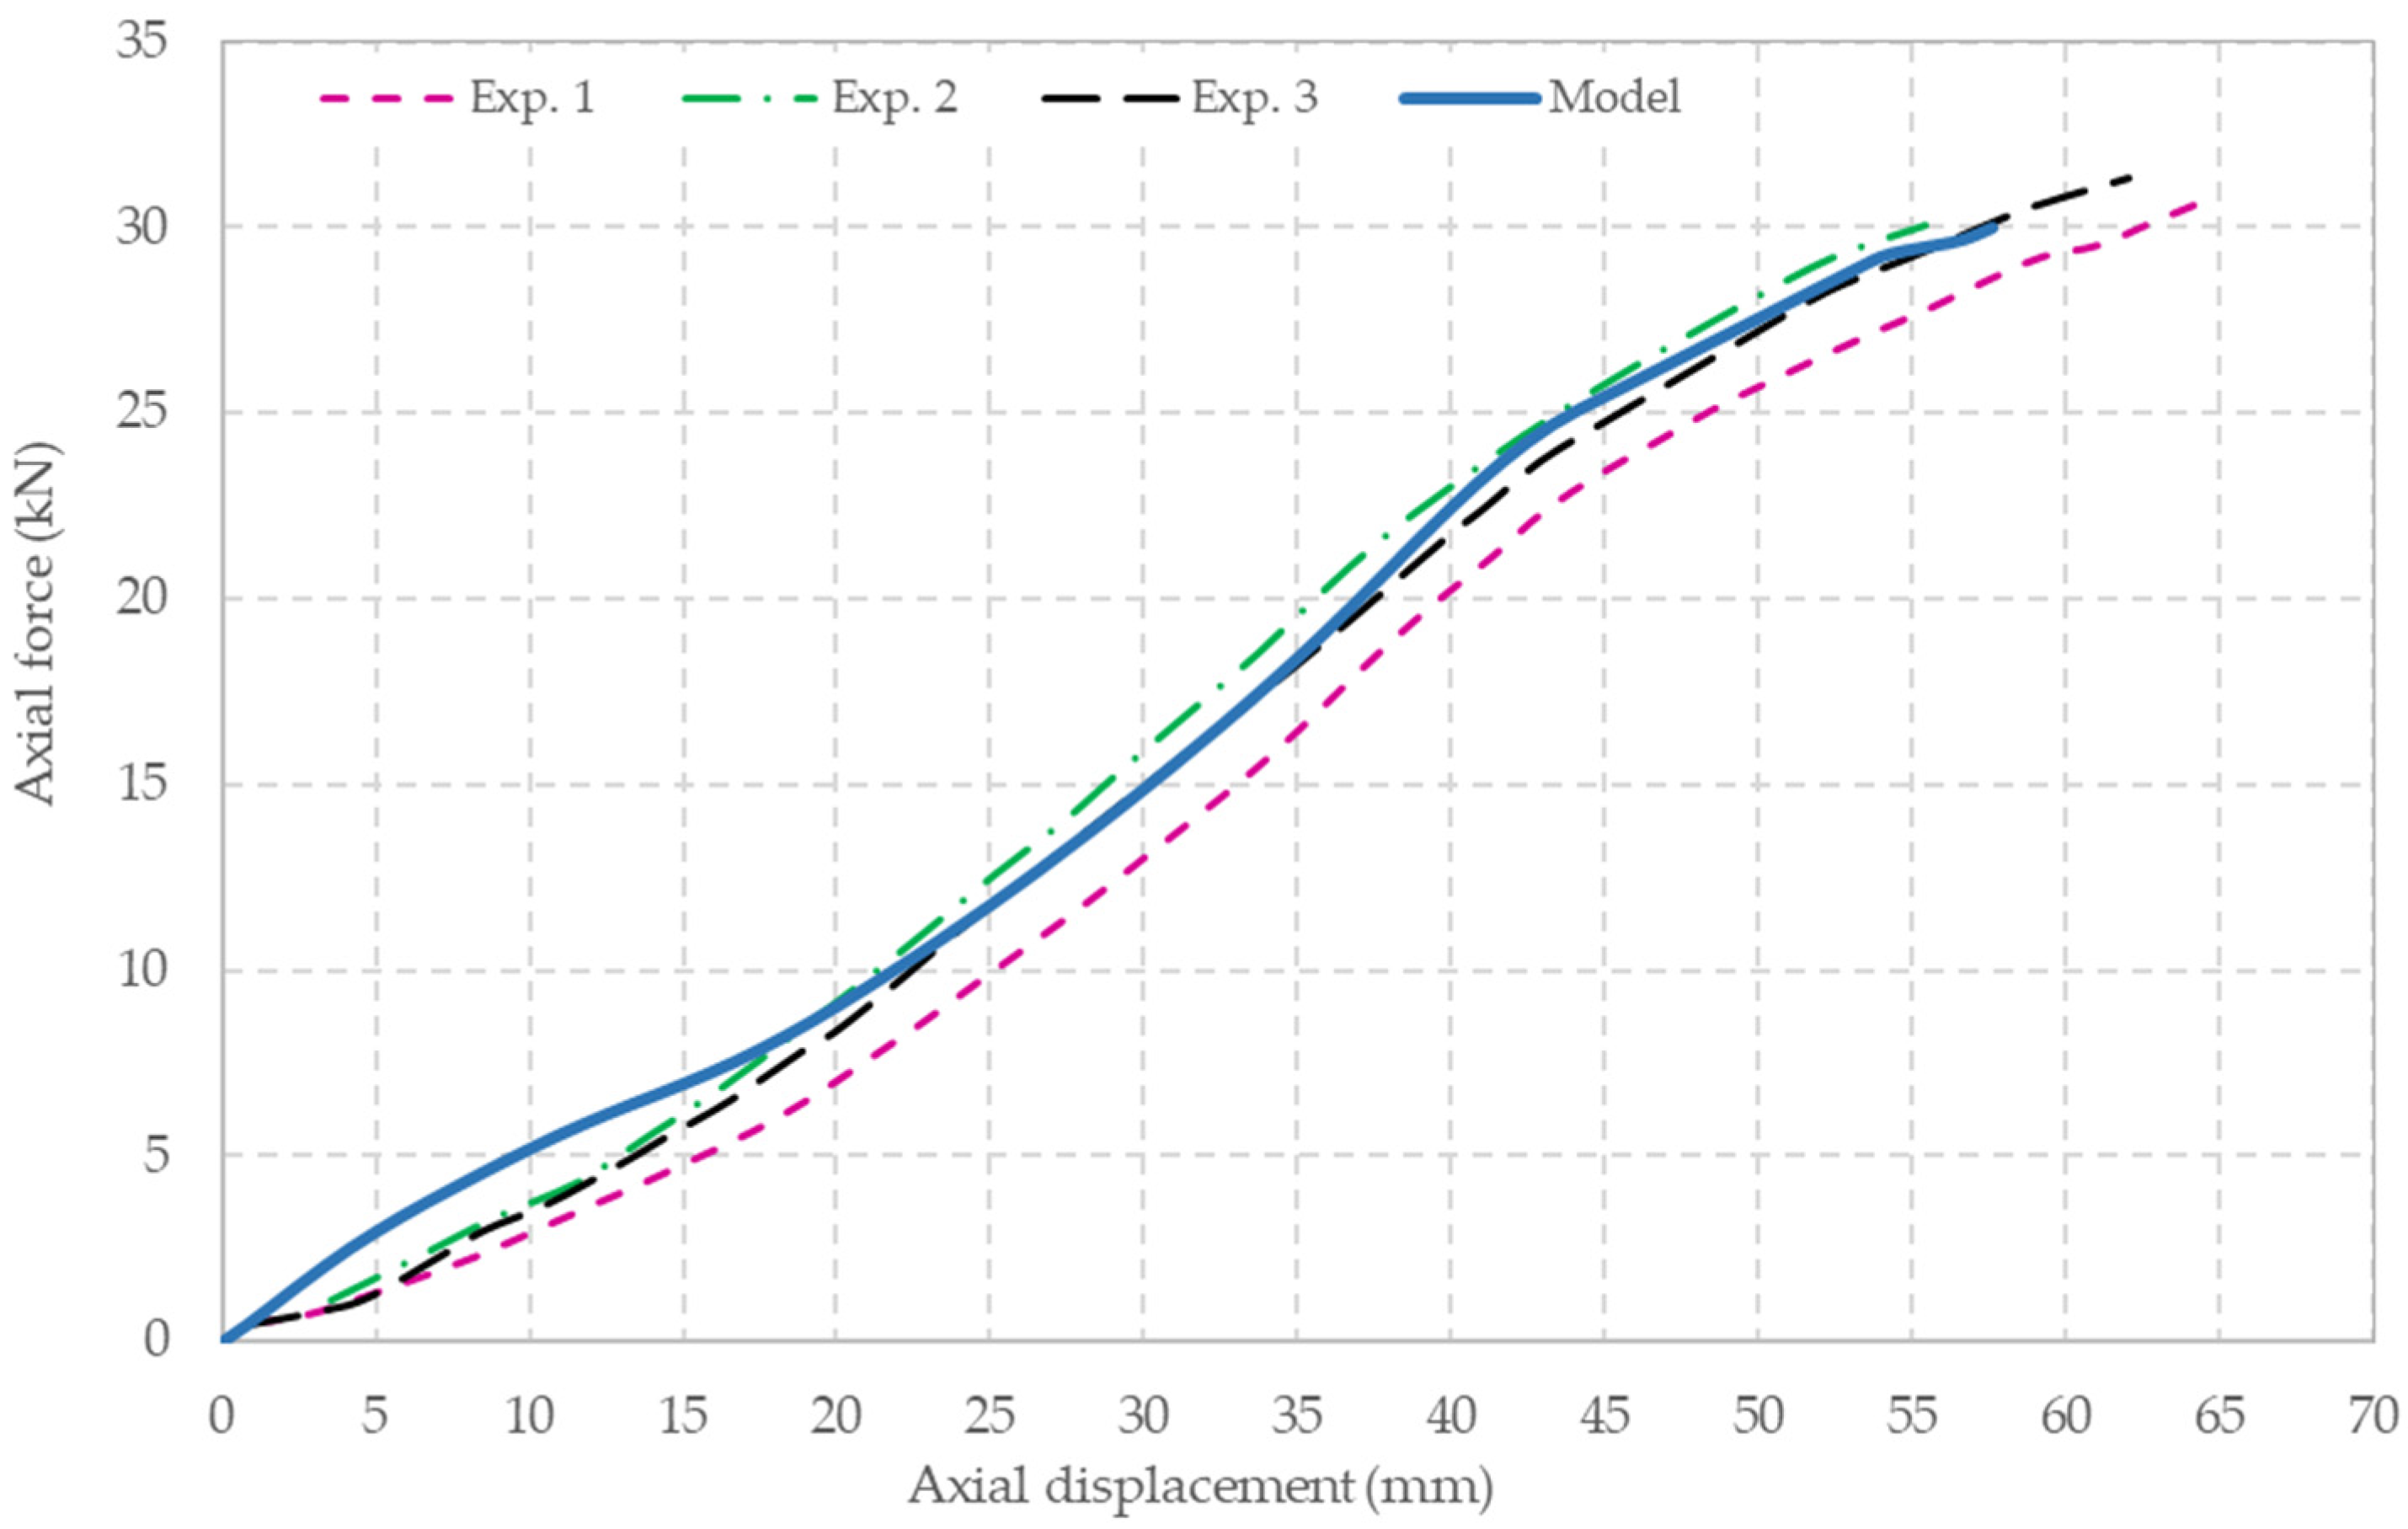
3.1. Finite Element Modelling of the Wire Response
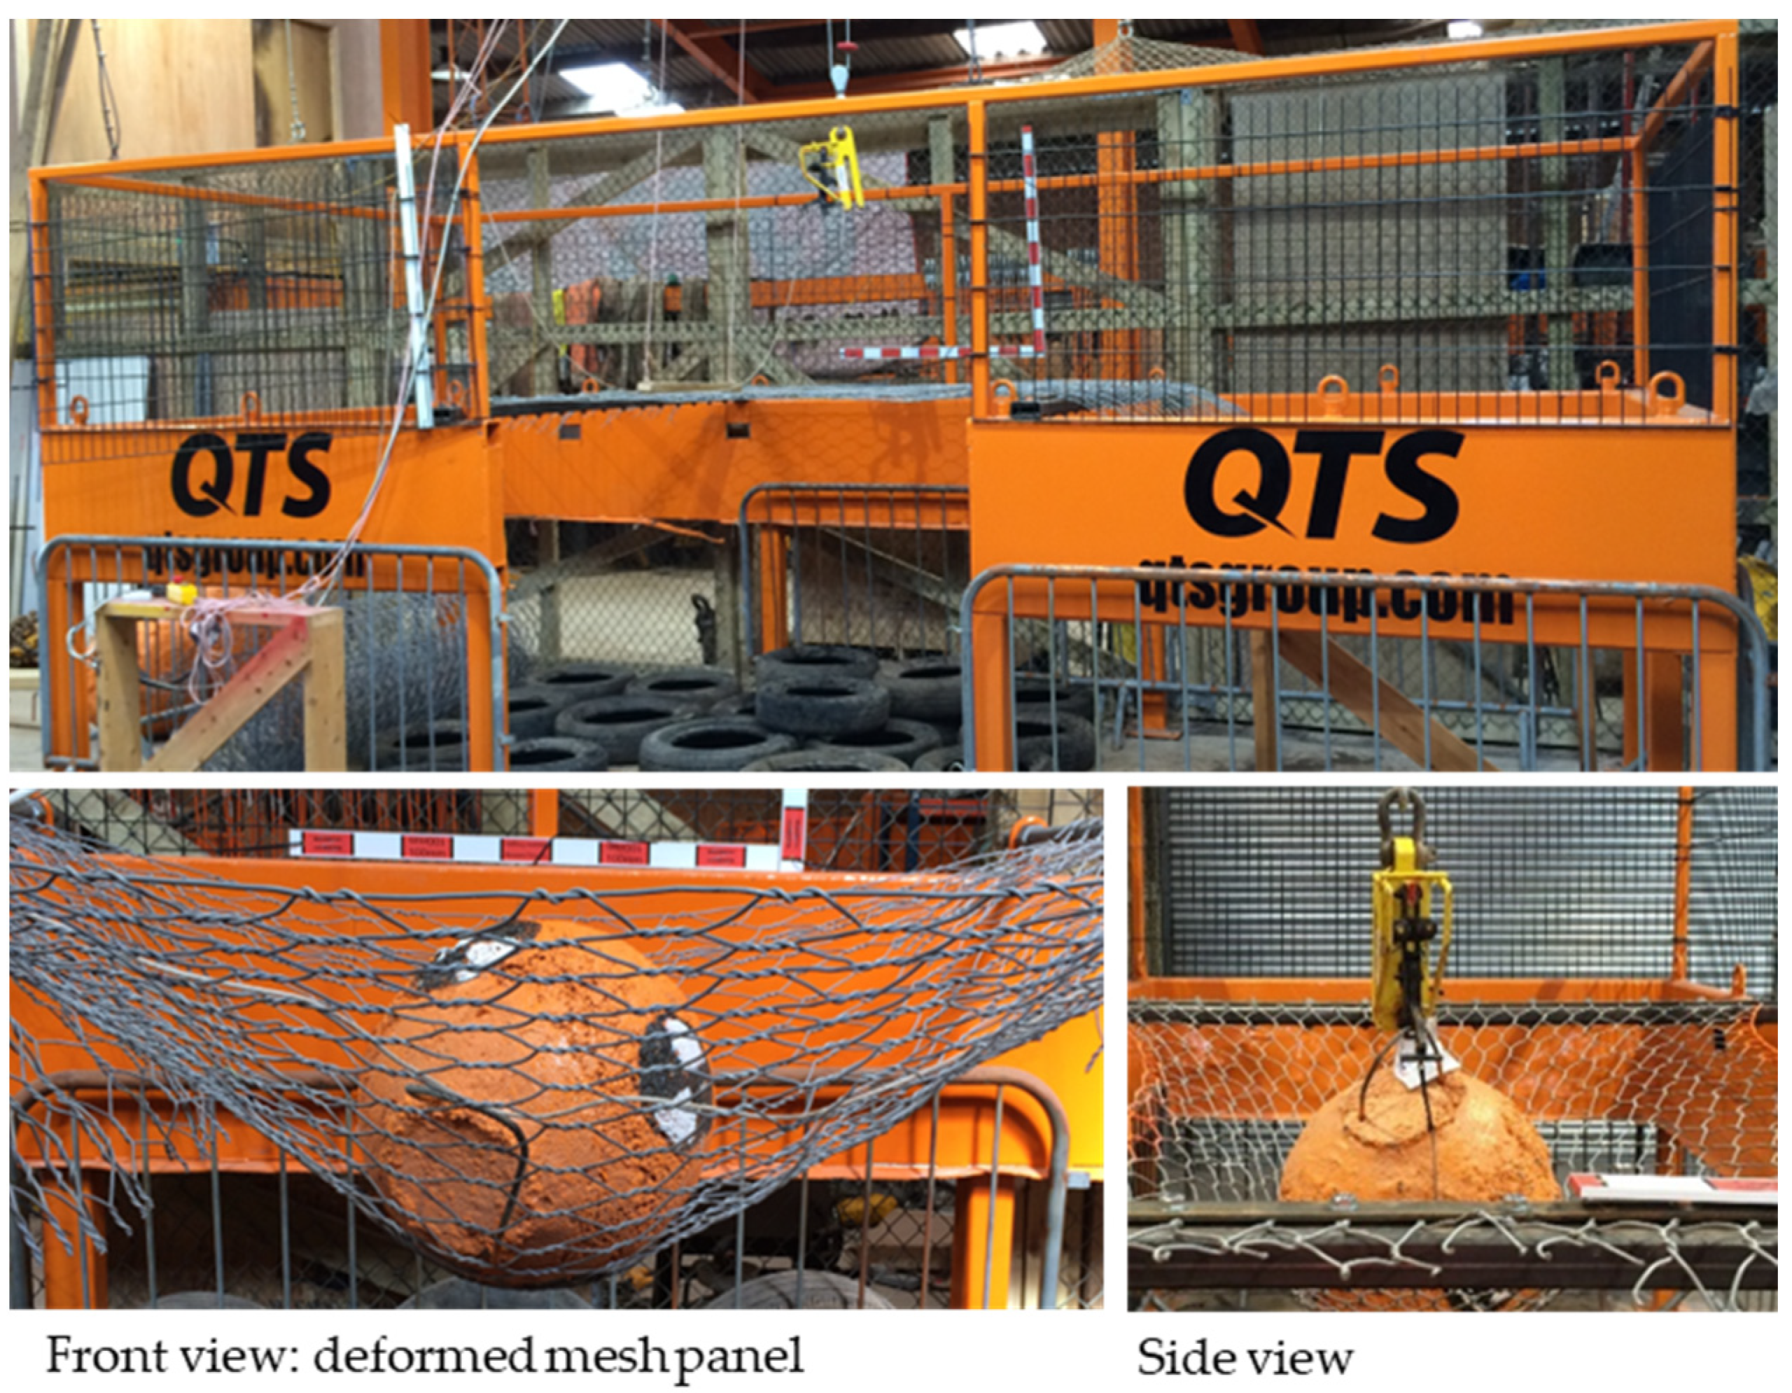
3.2. Dynamic Impact Loading Tests
4. Conclusions
Author Contributions
Funding
Data Availability Statement
Acknowledgments
Conflicts of Interest
References
- Foster, C.; Pennington, C.; Culshaw, M.G.; Lawrie, K. The national landslide database of Great Britain: Development, evolution and applications. Environ. Earth Sci. 2011, 66, 941–953. [Google Scholar] [CrossRef]
- Network Rail UK. West of Exeter Route Resilience Study. 2014. Available online: https://www.networkrail.co.uk/wp-content/uploads/2016/11/West-of-Exeter-Route-Resilience-Study.pdf (accessed on 3 February 2023).
- Etag, E.O.T.A. Guideline for European technical approval of falling rock protection kits. Eur. Organisat. Techn. Appr. 2008, 27. [Google Scholar]
- Gerber, W. Guideline for the Approval of Rockfall Protection Kits; Swiss Agency for the Environment, Forests and Landscape (SAEFL); Swiss Federal Research Institute WSL: Birmensdorf, Switzerland, 2001. [Google Scholar]
- Buzzi, O.; Spadari, M.; Giacomini, A.; Fityus, S.; Sloan, S.W. Experimental Testing of Rockfall Barriers Designed for the Low Range of Impact Energy. Rock Mech. Rock Eng. 2013, 46, 701–712. [Google Scholar] [CrossRef]
- Muraishi, H.; Samizo, M.; Sugiyama, T. Development of a Flexible Low-Energy Rockfall Protection Fence. Q. Rep. Railw. Tech. Res. Inst. 2005, 46, 161–166. [Google Scholar] [CrossRef]
- Al-Budairi, H.; Gao, Z.; Steel, A.; Wheeler, S.; Davies, T. Modelling and optimising of a light-weight rockfall catch fence system. In Proceedings of the NAFEMS UK Conference, Telford, UK, 15–16 June 2016; pp. 129–132. [Google Scholar]
- Gentilini, C.; Gottardi, G.; Govoni, L.; Mentani, A.; Ubertini, F. Design of falling rock protection barriers using numerical models. Eng. Struct. 2013, 50, 96–106. [Google Scholar] [CrossRef]
- Thoeni, K.; Lambert, C.; Giacomini, A.; Sloan, S.W. Discrete modelling of hexagonal wire meshes with a stochastically distorted contact model. Comput. Geotech. 2013, 49, 158–169. [Google Scholar] [CrossRef]
- Bertrand, D.; Nicot, F.; Gotteland, P.; Lambert, S. Discrete element method (DEM) numerical modeling of double-twisted hexagonal mesh. Can. Geotech. J. 2008, 45, 1104–1117. [Google Scholar] [CrossRef]
- Escallón, J.; Wendeler, C.; Chatzi, E.; Bartelt, P. Parameter identification of rockfall protection barrier components through an inverse formulation. Eng. Struct. 2014, 77, 1–16. [Google Scholar] [CrossRef]
- Van Tran, P.; Maegawa, K.; Fukada, S. Experiments and Dynamic Finite Element Analysis of a Wire-Rope Rockfall Protective Fence. Rock Mech. Rock Eng. 2013, 46, 1183–1198. [Google Scholar] [CrossRef]
- Bertrand, D.; Trad, A.; Limam, A.; Silvani, C. Full-Scale Dynamic Analysis of an Innovative Rockfall Fence Under Impact Using the Discrete Element Method: From the Local Scale to the Structure Scale. Rock Mech. Rock Eng. 2012, 45, 885–900. [Google Scholar] [CrossRef]
- Nicot, F.; Cambou, B.; Mazzoleni, G. From a constitutive modelling of metallic rings to the design of rockfall restraining nets. Int. J. Numer. Anal. Methods Géoméch. 2001, 25, 49–70. [Google Scholar] [CrossRef]
- Mentani, A.; Giacomini, A.; Buzzi, O.; Govoni, L.; Gottardi, G.; Fityus, S. Numerical Modelling of a Low-Energy Rockfall Barrier: New Insight into the Bullet Effect. Rock Mech. Rock Eng. 2016, 49, 1247–1262. [Google Scholar] [CrossRef]
- Lambert, S.; Bertrand, D.; Berger, F.; Bigot, C. Low energy rockfall protection fences in forested areas: Experiments and numerical modelling. In Proceedings of the International Conference on Structures under Shock and Impact (SUSI Congress), Kyoto, Japan, 25 May 2009; pp. 133–138. [Google Scholar]
- Abaqus Analysis User’s Manual; Version 6.14; Dassault Systems Simulia Corp.: Providence, RI, USA, 2014.
- Maccaferri Technical Data Sheet for Rockfall Netting. 2015. Available online: https://www.geofabrics.co/sites/default/files/technicaldata/tds-dtnet-pvc-gl-may-2015.pdf (accessed on 3 February 2023).
- SolidWorks; Version 2016; Dassault Systèmes SolidWorks Corp.: Waltham, MA, USA.
- UNI 11437:2012; Rockfall Protective Measures: Tests on Meshes for Slope Coverage. UNI Nazionale Italiano di Unificazione: Milano, Italy, 2012.
- Tracker Video Analysis and Modelling Tool. Version 4.96. Available online: http://physlets.org/tracker/ (accessed on 3 February 2023).


Disclaimer/Publisher’s Note: The statements, opinions and data contained in all publications are solely those of the individual author(s) and contributor(s) and not of MDPI and/or the editor(s). MDPI and/or the editor(s) disclaim responsibility for any injury to people or property resulting from any ideas, methods, instructions or products referred to in the content. |
© 2023 by the authors. Licensee MDPI, Basel, Switzerland. This article is an open access article distributed under the terms and conditions of the Creative Commons Attribution (CC BY) license (https://creativecommons.org/licenses/by/4.0/).
Share and Cite
Al-Budairi, H.; Gao, Z.; Steel, A. Numerical Modelling of Double-Twisted Wire Mesh for Low-Energy Rockfall Catch Fences. Geosciences 2023, 13, 180. https://doi.org/10.3390/geosciences13060180
Al-Budairi H, Gao Z, Steel A. Numerical Modelling of Double-Twisted Wire Mesh for Low-Energy Rockfall Catch Fences. Geosciences. 2023; 13(6):180. https://doi.org/10.3390/geosciences13060180
Chicago/Turabian StyleAl-Budairi, Hassan, Zhiwei Gao, and Andrew Steel. 2023. "Numerical Modelling of Double-Twisted Wire Mesh for Low-Energy Rockfall Catch Fences" Geosciences 13, no. 6: 180. https://doi.org/10.3390/geosciences13060180
APA StyleAl-Budairi, H., Gao, Z., & Steel, A. (2023). Numerical Modelling of Double-Twisted Wire Mesh for Low-Energy Rockfall Catch Fences. Geosciences, 13(6), 180. https://doi.org/10.3390/geosciences13060180