Abstract
Porphyry deposits are the dominant sources of copper and major sources of several base and precious metals. They are commonly formed via the repeated emplacement of hydrous magmas and associated fluid exsolution. As a result, mineralized hydrothermal veins may undergo multiple deposition and reopening processes that are not fully accounted for by existing fluid models. The Tongchang porphyry Cu deposit is a rare example of being related to a single intrusion. The simplicity in intrusive history provides an ideal starting point for studying fluid processes in more complex multi-intrusion porphyry systems. Detailed scanning electron microscope (SEM) cathodoluminescence imaging (CL) revealed rich microtextures in quartz and anhydrite that point to a fluid timeline encompassing early quartz deposition followed by fluid-aided dynamic recrystallization, which was succeeded by an intermediate stage of quartz dissolution and subsequent deposition, and ended with a late stage of continuous quartz deposition, brecciation, and fracturing. Vein reopening is more common than expected. Fifteen out of seventeen examined vein samples contained quartz and/or anhydrite that was older or younger than the vein age defined by vein sequences. Thermobarometry and solubility analysis suggests that the fluid events occurred in a general cooling path (from 650 °C to 250 °C), interspersed with two episodes of fluid pressurization. The first episode occurred at high-T (>500 °C), under lithostatic conditions alongside dynamic recrystallization, whereas the second one took place at a lower temperature (~400 °C), under lithostatic to hydrostatic transition conditions. The main episode of chalcopyrite veining took place subsequent to the second overpressure episode at temperatures of 380–300 °C. The results of this study reaffirm that thermal and hydraulic conditions are the main causative factors for vein reopening and growth in porphyry deposits.
1. Introduction
Porphyry deposits are the world’s dominant sources of copper and molybdenum as well as important reservoirs of other base and precious metals [1]. They are one of the areas of focus of critical raw material studies [2]. The deposits are normally found along the convergent plate tectonic margins, formed via optimally-integrated magmatic and hydrothermal processes rooted in the subduction lithospheric mantle [3,4,5,6,7]. Despite several decades of studies, many details still await to be revealed, particularly regarding the mechanism of vein growth, reopening, and sulfide deposition [8,9,10,11].
The most widely-used porphyry fluid model classifies hydrothermal veins as early A-type quartz vein (700–550 °C), transitional B-type molybdenite quartz vein (500–400 °C), and late D-type pyrite veins (350–250 °C) based on vein morphology, mineralogy, and chronology. However, this model assumes that the veins are formed in a single event that precipitates one generation of vein mineral. This assumption rarely holds for most porphyry deposits due to vein reopening, as revealed by several SEM-CL studies [12,13,14,15,16,17,18]. Erroneous interpretations on fluid source and conditions may result if they are based on bulk analyses of fluid inclusions, mineral chemistry, and isotopes of reopened veins.
Studies have shown that vein reopening in magmatic hydrothermal deposits may be linked to the number of igneous intrusions, which dictates the thermal and hydraulic properties of the system [8,19]. Ore deposits with a single intrusion may experience less reopening compared to multi-intrusion ones due to monotonic cooling, and thus less complicated hydraulic fracturing. The Tongchang Cu deposit is genetically associated with a single granodiorite intrusion [20]. This study presents a novel fluid model for the Tongchang Cu deposit by using integrated techniques of SEM-CL imaging [13,21,22], TitaniQ geothermobarometry [23,24,25,26,27], fluid inclusion microthermometry [13,28,29,30], and mineral solubility analysis [31,32].
2. Regional Geology
Most porphyry deposits form in terrains overriding subduction zones, where crustal magma chambers are fed by arc magmas [4]. Repetitive magma replenishment causes magma chambers to evolve chemically and mechanically, and drives the intrusion of multiple intrusive stocks [33]. In contrast, porphyry deposits with a single intrusion are rarely reported. Their scarcity is likely linked to the unique tectonic histories of the host terrain. The Tongchang porphyry deposit is a mono-intrusion system located in the inland of the South China Block (SCB), over 500 km from contemporaneous subduction belts [34] (Figure 1a). Interestingly, the deposit is situated within a much older subduction zone that sutured the SCB in the Neoproterozoic [35,36,37]. Despite the multiple reworking events in the Paleozoic and Mesozoic eras, geochemical and isotopic studies of the porphyry magmas have established connections with the Proterozoic subduction event [20,25,38,39]. For the sake of relevance and clarity, we describe Neoproterozoic and Mesozoic geology below.
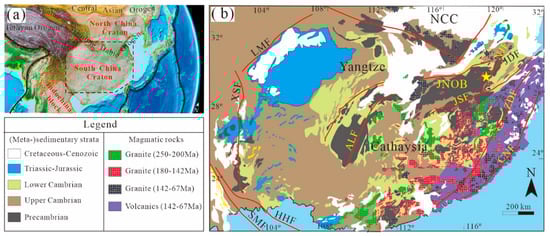
Figure 1.
(a) A satellite map showing the location of the South China Craton (SCC) and surrounding geologic terrains; (b) A geological map showing major lithologies and structures in the Phanerozoic era of SCC (adapted from [34]). AHF: Ailaoshan-Honghe Fault; CNF: Changle-Nanao Fault; JDF: Jingdezhen Fault; JNOB: Jiangnan Orogenic Belt; JSF: Jiangshan-Shaoxing Fault; LMF: Longmenshan Fault; HHF: Honghe Fault; NCC: North China Craton; NJF: Northeast Jiangxi Fault; QDOB: Qingling-Dabie Orogenic Belt; SMF: Song-Ma Fault; XMF: Xiangtan-Miluo Fault; XSF: Xianshuihe Fault: ZDF: Zhenghe-Dapu Fault. The yellow stars mark the location of the Dexing (including Tongchang) porphyry district.
2.1. Neoproterozoic Geology
The eastern SCB comprises the Jiangnan Orogen and Cathaysia block [40] (Figure 1b), separated by the Jiangshan—Shaoxing Fault [37]. The orogen consists of three tectonic domains separated by the Northeast Jiangxi [41] (Figure 1b) and Xiangtan-Miluo faults [42]. The northeast domain is a volcanic arc terrain of arc-derived granite and volcanic rocks (970–880Ma [43]), with minor turbidite, ophiolitic mélange, and blueschists [44]. The central and southwest domains expose low-grade metamorphosed volcano-sediments and intruding S-type granites [41] (860–800 Ma). The volcano-sedimentary sequences are deposited in two periods, separated by an angular unconformity [45]. The underlying sequences are dominated by flysch-like successions of sandstone, siltstone, slate, and phyllite deposited at 860–825Ma, including the Shuangqiaoshan Group in the northern Jiangxi and equivalents in other provinces [41,46]). The overlying sequence consists of slightly metamorphosed supracrustal rocks deposited in the Nanhua rift (e.g., the Banxi Group and equivalents [47]). The Cathaysia block comprises the Paleoproterozoic Badu Complex and Wuyishan granites as the basement, overlain by early Neoproterozoic volcanic successions (1000–900 Ma [48,49]. These rock associations have been interpreted as products of slab subduction [34,41,42,47,50,51].
2.2. Mesozoic Geology
The SCB is unconformably overlain by upper Neoproterozoic to lower Paleozoic, mid-Devonian to mid-Triassic, upper Triassic to lower Jurassic, and Cretaceous strata [34] (mainly clastic, volcanic and carbonate rocks, Figure 1b). The angular unconformities formed in three orogenic events in the Silurian, Triassic, and Jurassic eras [34]. Contemporaneous igneous activity was developed in large volumes. The Early Paleozoic (460–400 Ma) and Triassic (250–200 Ma) magmatic rocks are mainly S-type granites [52,53]. The Jurassic and Cretaceous igneous rocks are mainly A-type granite, syenite, and volcanic rocks, formed in two stages: i.e., 180–142 Ma and 142–67 Ma [53]. The early to middle Jurassic (190–170 Ma) is considered a period of magmatic quiescence with rock exposures only in the Dexing, Nanling and Qin-Hang regions [54]. Numerous tectonic models have been put forward for Mesozoic tectonics [34,53,55,56,57,58,59,60,61,62] (Figure 1d), all suggesting that the Dexing region had undergone an intraplate extension during this time period [20,38,63].
3. Deposit Geology
The Tongchang deposit is one of three mineralizing centers in the Dexing Cu district (Figure 2). Along with Zhushahong and Fujiawu, the three deposits appear in the intersections of regional and local faults that delineate a NW-SE alignment. The three granodiorite porphyries are identical in mineralogy and rock chemistry [20,38], and emanated from a common batholith at depths confirmed by borehole drillings. Alteration patterns are clearly separated despite the fact that the intrusions are close to one another (Figure 2). The ore types are similar except for different Au and Mo contents.
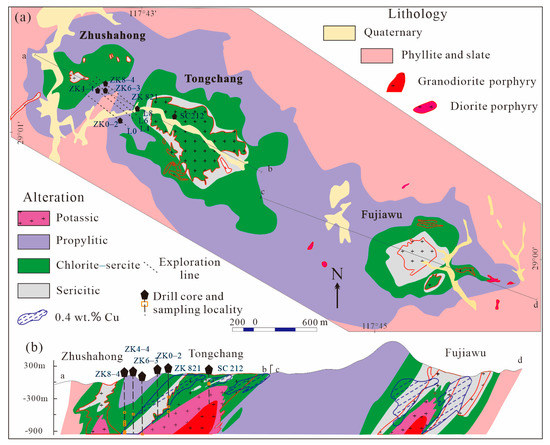
Figure 2.
(a) A geological map of the Dexing porphyry Cu district; (b) Two cross sections (a–b, and c–d) of the Cu district (adapted from [19,38]). Dash lines denoted with L0-8 represents exploration lines; black pentagons represent the locations of drill hole, and the sampling localities are marked with small rectangles.
3.1. Wall Rock and Intruding Porphyries
Wall rocks of the Dexing district are phyllite and tuffaceous slate of the Shuangqiaoshan Group (Figure 3a,b). Biotite and actinolite hornfels are developed in the wall rocks surrounding the granodiorites (Figure 3c). The granodiorites are obliquely emplaced, and account for over 95 vol.% of igneous intrusions in this district. They show porphyritic texture in the peripheral and upper part of the intrusions (Figure 3d), and the center and lower portions grade into an equigranular texture (Figure 3e). Phenocrysts and groundmass have similar mineral composition to andesine, K-feldspar, quartz, hornblende, and biotite. Both the granodiorite and wall rocks are hydrothermally altered and mineralized (Figure 3f). LA-ICP-MS zircon U-Pb dating suggested that the granodiorite formed at 171 ± 3 Ma [20,38,63], contemporaneous with Cu-Mo mineralization (molybdenite Re-Os age of ~170 Ma [64]). The porphyry magmas are interpreted as a partial melt of Neoproterozoic subduction-modified lithosphere [20,38]. There is minor (<5 vol.%) post-ore diorite porphyry and aplite (Figure 3g–i). The diorite truncates mineralized veins (Figure 3h,i), and has been dated at ca. 154 Ma by the zircon U-Pb method [65].
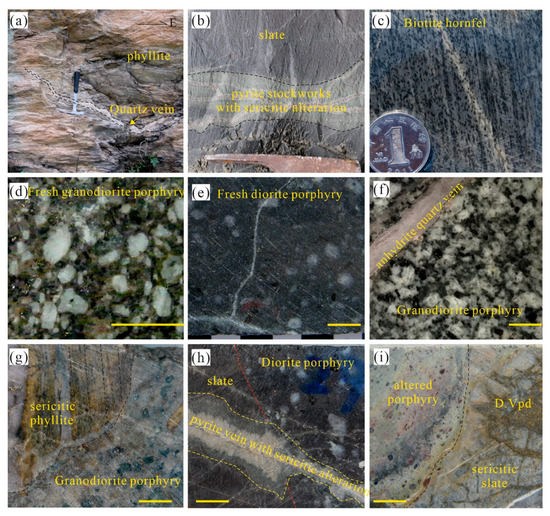
Figure 3.
Major lithologies (phyllite, slate, hornfel, and porphyries) and their spatial relation at the Tongchang porphyry Cu deposit. (a) an outcrop of phyllite; (b) a slate with pyrite stockworks and sericitic alteration halo; (c) a biotite hornfel; (d) a fresh granodiorite porphyry; (e) a fresh diorite porphyry; (f) a granodiorite porphyry crosscut by an anhydrite quartz vein; (g) a granodiorite porphyry truncating phyllite, both of which are altered by sericitic alteration; (h) a dioritic porphyry truncating slate, both of which are crosscut by a pyrite vein; (i) an altered porphyry truncating D-type pyrite vein (D.Vpd) hosted in the slate. The scale in (c) is a Chinese one-dime coin.
3.2. Hydrothermal Alteration
Typical hydrothermal alteration types are developed in the Tongchang deposit including potassic, propylitic, chlorite-sericite, and sericitic assemblages [66].
The potassic alteration is preserved only in the deep parts of the porphyry stock. At shallow levels, potassic alteration is largely obscured by chlorite-sericite overprints (Figure 4a). In the potassic altered granodiorite, porphyritic textures are preserved, but primary minerals are widely replaced by secondary K-feldspar, biotite, and iron oxides. Propylitic alteration is pervasive in the peripheral rocks. Rock textures are largely unaffected with carbonation and hydration reactions.
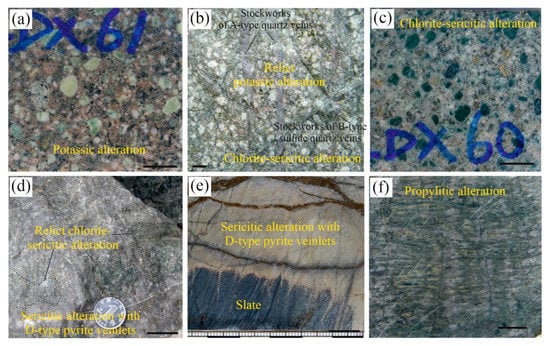
Figure 4.
Major types of hydrothermal alteration at the Tongchang porphyry Cu deposit. (a) Potassic alteration in the granodiorite porphyry; (b) Chlorite-sericite overprinting on potassic alteration in the granodiorite porphyry; (c) Chlorite-sericitic alteration in the granodiorite porphyry; (d) Sericitic overprinting on chlorite-sericitic alteration in the granodiorite porphyry; (e) Sericitic alteration with pyrite-dominated veins in the slate; (f) Propylitic alteration in the phyllite. Scale bars are 1 cm. The scale in (d) is a Chinese one-dime coin.
Moving away laterally from the granodiorite-wall rock contact, chlorite–sericite alterations overprint on potassic and propylitic alterations (Figure 4b,f). While rock textures are largely preserved, most previous minerals were converted to chlorite, sericite, chalcopyrite, rutile, quartz, and anhydrite (Figure 4d).
The spatial distribution of sericitic alterations is structurally controlled. It is mainly developed in the granodiorite-wall rock contacts and surrounding faults and fractures. It obliterated earlier rock textures and converted all mafic minerals and feldspars into muscovite, rutile, pyrite, and quartz (Figure 4c,e).
3.3. Hydrothermal Veinlets and Mineralization
Stockworks of veins and veinlets are widely developed alongside the hydrothermal alterations. A previous work recognized three vein types conformable to the typical A-B-D classification, as mentioned previously. [67] further distinguished four subtypes of A-type veins, seven subtypes of B-type veins, and three subtypes of D-type veins. The early A veins are mostly wavy quartz dominant veins with variable amounts of K-feldspar, biotite, and magnetite. The transitional B veins are mainly straight-walled chlorite and quartz veins with pyrite, chalcopyrite, molybdenite, and bornite, along the vein centerline and edges. The late D pyrite-dominant veins have variable amounts of chalcopyrite and quartz. A detailed vein petrography is provided in Section 4.1.
The district has a total resource of 1870 Mt ore at an average grade of 0.46% Cu. Individually, Tongchang has 5.2 Mt Cu at 0.45%, 0.128 Mt Mo at 0.01%, 215 t Au at 0.19 g/t and 1279 t Ag; Fujiawu has 2.57 Mt Cu at 0.5% and 0.168 Mt Mo at 0.03%; and Zhushahong has 0.6 Mt Cu at 0.42% [20]. Over 85% of the ore is localized in the chlorite–sericite and sericitic alteration zones, displaying a hollow cylinder shape (Figure 1d). Copper minerals are predominantly chalcopyrite (>90%), with lesser bornite, tennantite, and chalcocite. The molybdenum is mainly in molybdenite. Gold is recovered as native gold and electrum [68]. Sulfide occurrences are different in the chlorite-sericite and sericitic zones. In the former, copper sulfides and molybdenite are primarily contained in the B-type chalcopyrite veins and altered mafic minerals with high chalcopyrite to pyrite ratios (2–0.5). In the sericitic zones, copper sulfides occur primarily as inclusions in pyrite and occasionally as tennantite aggregates [64] with low chalcopyrite to pyrite ratios (<0.1). Molybdenite is contained in D-type pyrite veins and altered wall rocks. Native Au, electrum and Au-rich pyrite are primarily hosted in the sericitic zone.
4. Samples and Methods
Sixteen representative rock samples were selected to represent different alteration and vein types. The sampling localities are marked in Figure 2 and Table 1, which include mining platforms (20 and 230 m) and drill cores of the Tongchang open pit (SC212), as well as drill cores (ZK0-2, ZK4-4, ZK6-3, ZK8-4, ZK821). Detailed descriptions of sample petrography are given in the Appendix A.

Table 1.
A summary of sampling locality and petrography of the analyzed rock samples of the Tongchang porphyry Cu deposit.
4.1. Vein Petrography
Three subtypes of A-type veins have been selected: hematite-quartz (A.Vhq), K-feldspar-quartz (A.Vkq), and anhydrite-quartz (A.Vaq). In the abbreviation, A denotes A-type, and the subscripts denote vein minerals in increasing mounts from left to right. The same abbreviation rule is used for all vein types.
A.Vhq veins have irregular vein boundaries without discernible alteration halos. They consist of about 95% quartz and 5% hematite (Figure 5a). They are commonly crosscut and reopened by chlorite-sericite-chalcopyrite-magnetite veins. A.Vkq veins consist of about 80–90% quartz and 10–20% K-feldspar, and are commonly enveloped by potassic halos (Figure 5b). Similarly, they are commonly crosscut and reopened by veinlets of chalcopyrite, muscovite, pyrite, and carbonate. A.Vaq veins consist of about 70% quartz, 20–30% anhydrite and variable amounts of pyrite, chalcopyrite, chlorite, carbonate, rutile, molybdenite, apatite and epidote (Figure 5c,d). They are commonly sandwiched by weak potassic halos. No crosscutting relationships have been observed between these three vein types.
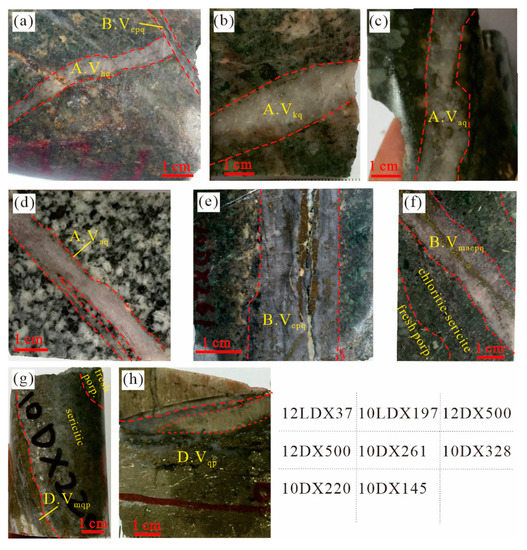
Figure 5.
Hydrothermal vein types recognized in the Tongchang porphyry Cu deposit. (a) An A-type hematite quartz vein in the granodiorite porphyry (A.Vhq), crosscut by a B-type chalcopyrite pyrite quartz vein (B.Vcpq); (b) An A-type K-feldspar quartz vein in the granodiorite porphyry (A.Vkq); (c,d) A-type anhydrite quartz veins in the granodiorite porphyry (A.Vaq); (e) A B-type chalcopyrite pyrite quartz vein in the granodiorite porphyry (B.Vcpq); (f) A B-type molybdenite anhydrite chalcopyrite pyrite quartz vein in the granodiorite porphyry (B.Vmacpq) with chlorite-sericite halos; (g) A D-type quartz pyrite vein in the granodiorite porphyry with sericitic halo (D.Vqp); (h) A D-type pyrite-dominated veins (D.Vpd) in phyllite.
Two B subtype veins have been selected, including chalcopyrite-pyrite-quartz (B.Vcpq) and molybdenite-anhydrite-chalcopyrite-pyrite quartz vein (B.Vmacpq). They are characterized by centerlines of sulfides and straight vein boundaries without alteration halos. B.Vcpq veins consist of about 70–90% quartz and 10–30% sulfides, with variable pyrite to chalcopyrite ratios (Figure 5e). B.Vmacpq veins differ from B.Vcpq veins with additional molybdenite and anhydrite in the vein and chloritic alteration halos. They commonly consist of about 70% quartz, 10% pyrite, 5–10% chalcopyrite, 5% anhydrite and minor amounts of molybdenite (Figure 5f). B.Vcpq and B.Vmacpq crosscut B.Vhq veins but no other crosscutting relations have been observed between B subtypes.
Two D subtype veins have been selected including molybdenite-quartz-pyrite (D.Vmqp) and pyrite-dominant (D.Vpd). D.Vmqp veins containing about 70–80% pyrite and 15–20% quartz and 5% molybdenite, bordered by centimeter-wide sericitic alteration halos (Figure 5g). D.Vmqp veins are crosscut by D.Vpd veins, but their relationships with other vein types is unclear. D.Vpd veins are dominated by pyrite (>95%) with minor amounts of quartz (<5%), and are commonly bordered by sericitic alteration halos (Figure 5h). D.Vpd veins usually crosscut A.Vhq, B.Vcpq, and D.Vmqp veins.
4.2. Analytical Methods
300 µm-thick sections were made by conventional cutting, grinding, and polishing. Mineral textures and parageneses were studied with petrographic microscopes and scanning electron microscopes (SEM) equipped with secondary electron (SE), backscattered electron (BSE), cathodoluminescence (CL), and energy dispersive spectroscopy (EDS) detectors. A total of 774 grey-scale CL, 579 color CL, 782 BSE high-resolution images, and 42 X-ray maps were taken. Trace element concentrations in different generations of quartz were measured in situ by LA-ICP-MS. Overall, 656 analyses for quartz from 16 samples were made. After all analyses, the actual ablation spots were confirmed by new CL imagery.
4.2.1. SEM-CL Microscopy
Greyscale CL imagery for anhydrite and quartz were firstly obtained on a Tescan Vega3 SEM equipped with a Centaurus CL detector and a photomultiplier at the Western Washington University. The accelerating voltage was 15 kV, and the probe current was about 10 nA for both quartz and anhydrite. The photomultiplier had a spectral range from ~300 nm to ~600 nm. A later CL study was carried out at the Institute of Geology and Geophysics, Chinese Academy of Sciences (IGGCAS), with a Nova NanoSEM 450 SEM equipped with a Gatan MonoCL4 panchromatic detector. An acceleration voltage of 15 kV and beam current of 9–12 nA were used.
Color CL images of quartz and anhydrite were collected using a Tescan Vega3 SEM equipped with a Gatan ChromaCL2 multichromatic detector at the GeoRessources Lab, CNRS (UMR7359), Université de Lorraine. An acceleration voltage of 15 kV and beam current of ~10 nA was used. The CL detector records spectra in ranges of red, green, and blue, and produces an RGB image. A dwell time of 300 μs was set for each pixel. During a separate session aiming to test the lifespan of luminescence, images were taken after the samples were exposed to electron beams for a certain amount of time.
4.2.2. In-Situ LA-ICP-MS Trace Elements
Trace elements in quartz were first measured with an Agilent 7500 ce ICP-MS coupled with a NewWave 213 nm Nd:YAG solid state laser ablation system at WWU. A laser fluence of 15 to 20 J/cm2, a repetition rate of 10 Hz, and a spot size of 65 μm were used. Helium was used as a carrier gas and mixed with make-up argon gas before entering the ICP torch. The Octupole Reaction System (ORS) was operated in hydrogen reaction mode (H2 flow rate of 2 mL/min) to increase sensitivity. Oxide production was monitored with 132Th16O/132Th ratios, which were always less than 0.2%. Twenty-two masses were monitored: 7Li, 9Be, 11B, 23Na, 27Al, 29Si, 30Si, 31P, 39K, 43Ca, 49Ti, 55Mn, 56Fe, 63Cu, 71Ga, 74Ge, 75As, 88Sr, 118Sn, 121Sb, 137Ba, and 208Pb. The dwelling time for 49Ti was 0.1 s, and it was 0.01–0.03 s for the other masses. About 30 s of gas blank was collected as the baseline, which was followed by 60 s of data acquisition with laser ablation. Instrument performance was checked by a rough on-the-fly data reduction with the GLITTER program. Data were reduced with care later on using GLITTER. 30Si was used as the internal standard using stoichiometric values. NIST 610 glass was used as an external standard, with reference values from [69]. A natural quartz standard (QZ7 [70]) and a synthetic quartz with a known chemical composition was used as quality controls. Results for QZ7 were within the range of recommended values for all elements except lower Al values. A correction factor was obtained by dividing the recommended value by measured values of Qz7 (ranging from 0.51 to 0.76, Table 4), which was applied to unknowns of the same analytical session. Additional analyses were made with an Agilent 7900 ICP-MS equipped with a MICRO/Las Pro 193 nm ArF excimer laser ablation system at the Institute of Geochemistry of the Chinese Academy of Sciences (IGCAS). A repetition rate of 10 Hz and an energy density of 10 J/cm2 were used. Spot size of the laser beam was 44 μm. NIST 610 glass was used as an external standard and analyzed twice every 10 analyses. An internal standard-independent calibration strategy, implemented in the ICPMSDataCal program, was used for quantification [71]. NIST 612, GSE-1G, and Qz7 were analyzed as quality controls. Analytical uncertainties of most elements for both setups were around 5–10% (1σ).
Although every effort was taken to avoid mineral and fluid inclusions, the influence of sub-microscopic inclusions was inevitable. During data reduction, abnormal spikes and bumps were filtered and excluded from integration. Even so, values of Na, K, Ca, Al, Mn, Fe, Cu, Zn, Sr, As, and Pb were too high to be real. Co-variations in Na-K-Al, Ca-Sr, Fe-Cu, Ca-Pb, K-Ca-Al, Cu-As, and Fe-Mn was interpreted to be the result of feldspar, carbonate, chalcopyrite/pyrite, tennantite, mica, and fluid inclusions, and were used as the basis to discard those values.
4.2.3. Fluid Inclusion Microthermometry
Fluid inclusions were classified as primary, secondary and pseudosecondary, following the principles of [72]. Phase transition temperatures were measured on a Linkam THMS 600 cooling/heating stage at the GeoRessources Lab of the Université de Lorraine. The stage was calibrated against the melting point of solid CO2 (−56.6 °C) and ice (0 °C), and a homogenization temperature (165 °C) of well-characterized natural fluid inclusions. The heating rate varied between 0.2 and 10 °C/min. When fluid inclusions approached the phase transition, the rate was lowered to 0.2–0.5 °C/min. Fluid salinity, density and isochores were calculated using the HokieFlincs_H2O-NaCl program [73].
5. Results
5.1. SEM-CL Imaging
Quartz growth sequencing was based on CL microtextures and vein crosscutting relations. The earliest quartz generation (Qz1, Figure 6a), most common in the A.Vhq, B.Vcpq, and B.Vmacpq veins, was characterized by variable grain sizes and straight grain boundaries. The grains commonly show undulose extinction under polarized light. They exhibit mottled CL with faint zoning, and abundant microfractures that are filled with CL-dark “splatters” and “cobwebs” (Figure 6a).
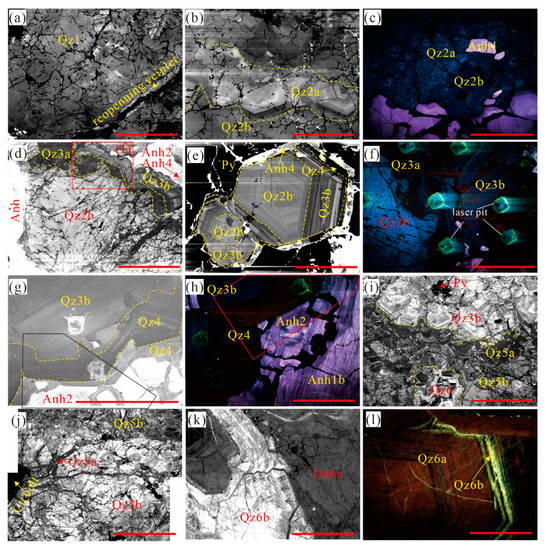
Figure 6.
CL microtextures of quartz at the Tongchang porphyry Cu deposit. (a) The earliest CL-homogeneous quartz (Qz1) reopened by later veinlet; (b,c) The second generation (Qz2a and Qz2b) that shows dark blue CL with faint zoning. Also shown are three generations of anhydrite (purple); (d) The third generation of quartz (Qz3a and Qz3b) resorbing and overgrowing on early Qz2b. Note that the Qz3a has lower CL intensity than Qz3b does; (e) Qz3b directly overgrown on Qz2b, showing conformable contact with the surrounding pyrite; (f) Qz2 and Qz3 displayed blue CL with different intensities; (g,h) Coprecipitation of CL-dark Qz4 (overgrown blue-CL Qz3b) and Anh4 (cementing purple-CL Anh2 breccia); (i) Qz5a and Qz5b overgrew on Qz3b. (j) Qz5a fill in fractures in Qz3a. Note that Qz5a has lower CL than Qz5b; (k) CL-homogeneous Qz6a and CL-oscillatory Qz6b. Note that Qz6b has bright CL. (l) Qz6a shows red CL, whereas Qz6b shows bright blue C. Scale bars are 300 μm.
The second quartz generation of (Qz2), common in A.Vkq, A.Vaq, B.Vcpq, B.Vmacpq, D.Vpq, and D.Vpd comprises anhedral grains with contrast sizes and irregular boundaries filled with CL-dark quartz. Qz2 grains are further divided into larger Qz2a grains that have concentric CL zoning and smaller Qz2b grains that show mottled CL (Figure 6b). The contacts between Qz2a and Qz2b can be both transitional and crosscutting. They form discrete layers in most samples. They also contain “splatters” and “cobwebs”. Under color CL, both grains show long-lived blue, with lower intensity for Qz2b (Figure 6c). Qz2 grains truncate Q1 locally, suggesting a later deposition.
The third generation of quartz (Qz3), common in the A.Vkq, B.Vmacpq, D.Vmpq, D.Vpq, and D.Vpd veins, comprises a CL-dark core (Qz3a) and an overgrowth with oscillatory zoning (Qz3b) (Figure 6d). Some Qz3 grains contain a relict Qz1/Qz2 core overgrown either by Qz3a or Qz3b (Figure 6e). They also show long-lived blue CL (Figure 6f).
The fourth generation of quartz (Qz4), mainly observed in the A.Vaq, B.Vcpq, and B.Vmacpq veins, is low in abundance. The Qz4 grains show dark, red CL and occur as thin rims or aggregates coating earlier quartz (Figure 6e,g,h). Qz4 crosscuts Qz3b grains locally.
The fifth generation of quartz (Qz5) commonly consists of a CL-dark core (Qz5a) and oscillatory overgrowth (Qz5b) (Figure 6i). They are observed in the D.Vmpq, D.Vpq, and D.Vpd veins, and are intimately associated with pyrite. Locally, they occur as dark bands crosscutting or filling the interstitial space of earlier quartz (Figure 6j).
The latest generation of quartz (Qz6) comprises a CL-dark to grey interior (Qz6a) and a very bright-CL exterior (Qz6b) (Figure 6k). They were observed in the A.Vaq, D.Vpq, and D.Vpd. Qz6a exhibited an oscillation of red and blue CL, whereas Qz6b displayed a bright yellowish blue (Figure 6l).
Four generations of anhydrite have been identified. The first generation of anhydrite (Anh1) exhibited bright, homogeneous to patchy CL (Figure 7a). They are subdivided to Anh1a and Anh1b according to CL intensity. Anh1a grains have higher CL intensity and irregular boundaries (Figure 7a) relative to Anh1b grains that are commonly overgrown, recrystallized, or crosscut by later anhydrites.
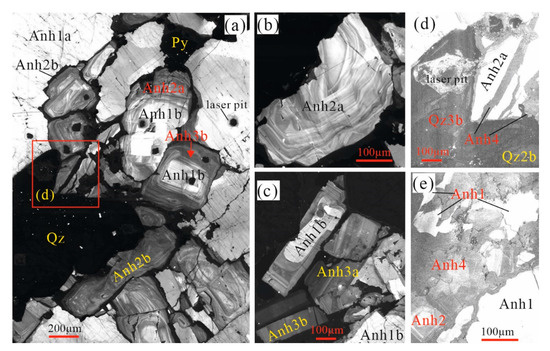
Figure 7.
Cathodoluminescence (CL) microtextures of vein anhydrite at the Tongchang porphyry Cu deposit. (a) The first generation of anhydrite (Anh1), rimed and surrounded by CL-oscillatory Anh2, coexisting with pyrite and quartz; (b) Anh2a showing “wavy” oscillatory zoning; (c) A cluster of euhedral Anh3a and Anh3b grains, with Anh3a showing oscillatory zoning, whereas Anh3b showed homogeneous CL; (d,e) CL-dark Anh4 cemented fragments of earlier anhydrite grains including Anh1 and Anh2.
The second generation (Anh2) shows bright to grey CL with “wavy” oscillatory boundaries (Figure 7a,b), with Anh2a being brighter and Anh2b darker.
The third generation of anhydrite (Anh3) occurred as euhedral crystals overgrowing Anh1 or infilled interstitial spaces of Anh1 and Anh2 (Figure 7a,c). They are subdivided to Anh3a and Anh3b according to CL intensity and zoning patterns (Figure 7c). Anh3a is brighter in CL and shows evident oscillatory zoning in contrast to Anh3b.
The last generation of anhydrite (Anh4) is anhedral and CL-dark (Figure 7d). Anh4 may cement Anh1 and Anh2 fragments (Figure 7e). All anhydrite generations except Anh3 have been found in both A.Vaq and B.Vmacpq.
Mineralogical and textural interpretations suggest a sequential co-precipitation of Qz1 and hematite, Qz2a and Anh1a, Qz2b and Anh1b, Qz3 and Anh2, along with pyrite and rutile, Qz4, and Anh4 along with chalcopyrite, pyrite, rutile, molybdenite, and Qz5 along with pyrite, apatite, rutile, and gypsum (Table 2).
Table 2.
A summary of generations, CL textures, mineral assemblages and Ti contents of quartz and anhydrite of the Tongchang porphyry Cu deposit.
5.2. Fluid Inclusions
Fluid inclusions at Tongchang were named using the nomenclature of [74] based on the relative volume fraction of bubbles and solid species (e.g., B15HS denotes 15% vapor phase, a halite daughter, and an opaque solid). Fluid inclusion assemblages (FIA) and their origin were determined with the aid of CL microtextures. Microthermometric temperatures and estimated salinity, density, and pressure are listed in Table 3.
Table 3.
Fluid inclusion microthermometry of the Tongchang porphyry Cu deposit.
Due to intense recrystallization, Qz1 grains are devoid of primary FIAs, but flooded with secondary FIAs in healed fractures. Qz2a and Qz2b quartz host primary FIAs of B15HS and B80 inclusions (Figure 8a,b). B15HS inclusions in Qz2a and Qz2b showed different temperatures of halite dissolution and vapor disappearance. In Qz2a grains, B15HS showed halite dissolution at 458–512 °C and vapor disappearance at 370–415 °C, whereas those in Qz2b grains showed lower halite-dissolution temperatures (388–396 °C) and vapor disappearance temperatures (270–280 °C). One B80 inclusion in Qz2b was homogenized at 404 °C via critical mode.
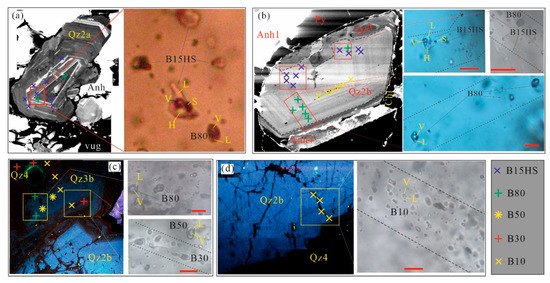
Figure 8.
Petrography of fluid inclusions hosted in different generations of quartz in the Tongchang porphyry Cu deposit. The coexistence of brine (B15HS) and vapor-rich (B80) inclusions in Qz2a (a) and Qz2b (b), which distributed along CL growth zones indicative of primary origin; primary B50 inclusions in Qz3b with secondary trails of B80 and B30 inclusions (c); secondary trail of B10 inclusion in Qz2b (d). “B10” denotes the vapor phase and its volume proportion relative to the total inclusion volume; “L” denotes aqueous liquid, “V” denotes vapor, “H” denotes a halite daughter phase, and “S” denotes unidentified solids. CL growth zones are marked with dashed curves in the inclusion images. Scale bars are 10 μm.
Qz3b contains primary B50 inclusions (Figure 8c). They had ice melting temperatures of −2.7–−4.2 °C and were homogenized at 300–350 °C via critical mode or vapor expansion.
Qz4 commonly contains only B30 inclusions, which are considered primary. They exhibited ice melting at −3.2–−5.6 °C and were homogenized at 250–300 °C. They also occurred as secondary inclusions in Qz2 and Qz3 (Figure 8c). B10 occurred mainly as secondary inclusions in Qz2 and Qz3. It had ice melting temperatures at −2.6–−3.4 °C and was homogenized at 187–208 °C.
5.3. Trace Elements
Results are shown and depicted in Figure 9, Table 4, and the Appendix A. In all quartz generations, only Ti, Li, Na, Al, K, and Ge occurred in appreciable concentrations. Arsenic and Sb becomes significant in Qz5 and Qz6.
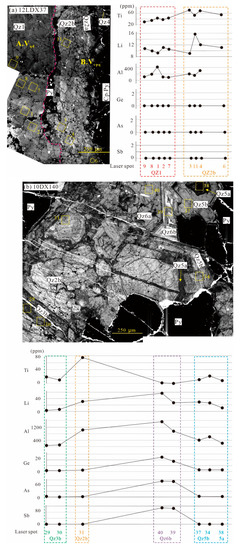
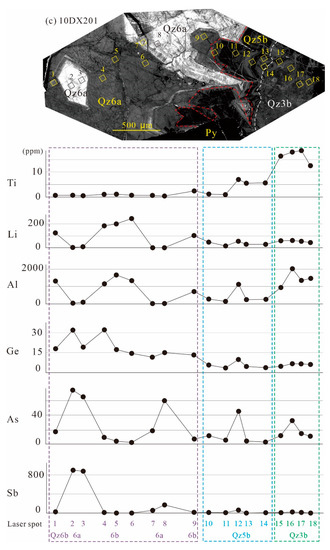
Figure 9.
Sketches showing quartz CL textures and ablation spots for trace elements. (a) B.Vcpq vein crosscutting the A.Vqd vein (12LDX37). Qz1 had intermediate Ti contents (20–30 ppm); Qz2 had higher Ti contents (50–70 ppm). Note that Cu-Fe sulfides coprecipitated with Qz4, which reopened Qz2 grains. Qz2 grains, in turn, crosscut Qz1 grains; (b) In D.Vpd pyrite veins (10DX140), Qz3 had lower Ti contents (10–20 ppm) compared to earlier quartz; (c) A profile of trace element analyses encompassing Qz3, Qz5, and Qz6 (10DX201). Qz5 had variable yet lower Ti contents (1–15 ppm). Qz6a and Qz6b had elevated contents of Ge, As and Sb.
Table 4.
LA-ICP-MS trace elements in quartz of the Tongchang porphyry Cu deposit.
Titanium contents show characteristic patterns among quartz generations. It increases from 26.8 ± 10.3 ppm (1σ, N = 59) in Qz1 to 127 ± 37 ppm (1σ, N = 42) in Qz2a and then decreases to 53.9 ± 16.1 ppm (1σ, N = 163) in Qz2b, 10.7 ± 4.0 ppm (1σ, N = 21) in Qz3a, 15 ± 7.9 ppm (1σ, N = 131) in Qz3b, 6.74 ± 4.22 ppm (1σ, N = 24) in Qz4, 8.40 ± 0.88 ppm (1σ, N = 4) in Qz5a, 7.66 ± 4.06 ppm (1σ, N = 66) in Qz5b, 2.67 ± 2.19 ppm (1σ, N = 19) in Qz6a, and 0.699 ± 0.454 ppm in Qz6b.
Lithium increases slightly from 11 ppm in Qz1 to av. 19 ppm in Qz3b, then decreases to 8 ppm in Qz4, and increases to 70 ppm in Qz6a which decreases to 29 ppm in Qz6b. Al increases from 172 ppm in Qz1 to 578 ppm in Qz3b, and then decreases to 300 ppm in Qz4, and then increases to 923 ppm in Qz6a which decreases to 718 ppm in Qz6b. Ge increases from 1 ppm in Qz1 to 14 ppm in Qz6b. As increases from 1 ppm in early quartz to 31 ppm in Qz6b, and Sb increases from 0 ppm (below detection limits) in early quartz to 20 ppm in Qz6a and 207 ppm in Qz6b.
5.4. Temperature Estimation
At a chemical equilibrium, the incorporation of Ti in quartz is dependent on pressure and temperature. The dependency has been devised as a geothermometer known as TitaniQ by various experiments [23,26,27,75,76]. Different calibration equations have been derived [77], but one developed by [26], as shown below, was selected in this study based on the arguments presented in [76]. An overview of the arguments is out of the scope of this study; interested readers are referred to the publications mentioned above.
At a given Ti activity (), the mole fraction of Ti in quartz () increases with T but decreases with P. In a P-T space, equal (isopleth) defines vertical lines that have increasing slopes (Figure 10). For the Tongchang deposit, = 1 can be assumed for Qz2-, Qz3- and Qz4- and Qz5-depositing fluids since the rutile was coprecipitated. For Qz1 and Qz6, = 0.5 and 1, are used to calculate two isopleths for each .
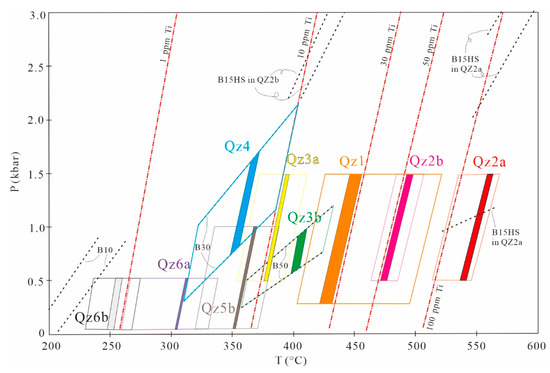
Figure 10.
Pressure and temperature estimates by combining TitaniQ isopleths (dash-dotted lines in red) and fluid inclusion isochores (dash lines in black). Ti isopleths of 1 ppm, 10 ppm, 30 ppm, 50 ppm, and 100 ppm are shown; isochores of B15HS inclusions in both Qz2a and Qz2b, B50 inclusions in Qz3b, B30 inclusions in Qz4, and B10 inclusions are shown. The minimum and maximum range (solid open diamonds in colors) as well as an averaged range (solid color-filled) of Ti contents for all quartz generations are shown. Orange indicates Qz1, red indicates Qz2a, pink indicates Qz2b, yellow indicates Qz3a, green indicates Qz3b, blue indicates Qz4, dark brown indicates Qz5b, purple indicates Qz6a, and grey indicates Qz6b. Note that only Qz3a and Qz4 had reliable fluid inclusion isochore data that allowed for the use of the interception method. For other quartz generations, a pressure range was assumed to produce a reliable temperature estimate.
Exact pressures and temperatures can be obtained by combining TitaniQ and other geothermobarometers. Fluid inclusion isochores are an option but, unfortunately, they are only available for Qz3 and Qz4. B15HS inclusions in Qz1 and Qz2 are not used since their origin remains unclear [19] and their isochores intersect with TitaniQ isopleths at unreasonably high pressures (Figure 10). For the remaining quartz generations, a range of geologically reasonable pressures are assumed, i.e., 1500–500 bars for Qz1, Qz2, and Qz3a, 500–100 bars for Qz5, and 500–10 bars for Qz6. The assumption of decreasing pressures is supported by the increasing Al and Li contents consistent with a recent study by [78]. At a constant pressure, temperature is negatively related to . The minimum temperatures for Qz1 and Qz6 are calculated with = 1 and minimum pressure, and maximum temperatures are calculated with = 0.5 and maximum pressure. Accordingly, the following averaged temperature ranges are obtained for different quartz generations (Figure 10; Table 4): Qz1 425–495 °C; Qz2a 529–618 °C; Qz2b 473–551 °C; Qz3a 374–420; Qz3b 350–450 °C; Qz4 310–390 °C; Qz5a 356–385 °C; Qz5b 344–351 °C; Qz6a 287–327 °C; Qz6b 242–276 °C.
6. Discussion
6.1. An Improved Timeline Based on Quartz CL Sequencing
Vein crosscut relations are often used to sort fluid events in the porphyry deposits [8]. However, this technique could be imparted by the existence of reopened veins. In those cases, a detailed look into mineral microtextures could help construct a reliable timeline of superimposed fluid events.
CL microtextures in hydrothermal quartz falls in two general categories: primary crystallization textures and secondary modification textures attributable to quartz deposition, dissolution, and deformation processes [79,80]. Concentric and euhedral oscillatory zoning in the Qz2a, Qz3, Qz5, and Qz6 grains belong to the primary crystallization textures, indicating a direct deposition from hydrothermal fluids. Mottled CL in the Qz1 and Qz2b grains is indicative of fluid-aided dynamic recrystallization. Similar Ti contents in both quartz generations might indicate a common event of recrystallization. The seemingly contradictory coexistence of un-recrystallized Qz2a and recrystallized Qz2b is likely linked to a difference in crystal sizes and shapes and resultant preferential deformation, as proposed for the Butte porphyry Cu-Mo deposit [22]. Qz2b resorbing Qz2a, “splatter” and “cobweb” in the Qz1 and Qz2 grains as well as overgrowth of Qz3 on earlier quartz gains indicate quartz dissolution. Qz3 and Qz4 fragments and fracture-filling Qz5 grains are indicative of brittle fracturing.
Based on these pieces of textural evidence, a refined timeline of fluid evolution is proposed for the Tongchang deposit. The early stage involved the deposition of the Qz1 precursor, Qz2a, and the Qz2b precursor followed by dynamic recrystallization and a first-time dissolution. The subsequent intermediate stage started with dissolution of earlier quartz grains followed by progressive deposition of Qz3a, Qz3b, and Qz4. The late stage commenced with the fracturing and brecciation of earlier quartz grains followed by the progressive deposition of Qz5 and Qz6.
Petrographic observations suggest that the early Qz1- and Qz2-depositing stage also precipitated hematite and anhydrite (Anh1) in the veins, and bornite, chalcopyrite, and potassic silicates in the alteration halos. The early intermediate stage precipitated pyrite, chalcopyrite, anhydrite (Anh3), chlorite, and sericite, along with Qz3 quartz, as well as chlorite-sericite alteration halos. The late intermediate stage precipitated abundant chalcopyrite, pyrite, anhydrite (Anh4), chlorite, sericite, and calcite in the veins. The late stages generated pyrite and sericite with Qz5 and Qz6 grains.
6.2. Fluid Cooling and Compression during Quartz Deposition, Recrystallization, and Dissolution
6.2.1. Quartz Deposition
TitaniQ thermobarometry has been widely utilized to estimate the P-T conditions of quartz deposition in magmatic [81,82] and hydrothermal environments [22,74,83]. Quartz solubility in various fluid compositions at varied P-T conditions can be used to investigate the fluid processes responsible for quartz deposition and dissolution, and, by inference, vein formation processes [31,32,84].
According to TitaniQ temperatures, early quartz deposition (Qz2a) occurred at around 529–618 °C; early intermediate quartz deposition (Qz3a and Qz3b) occurred at around 350–450 °C; late intermediate quartz deposition (Qz4) occurred at around 310–400 °C; and late quartz deposition (Qz5 and Qz6) occurred at around 240–400 °C. On a P-T phase diagram for H2O-NaCl overlapped with quartz solubility curves (Figure 11), the quartz deposition temperature ranges are located in the single liquid phase region where quartz solubility decreases dramatically with temperature, and much less with pressure. It is inferred that the quartz deposition is mainly the result of fluid cooling. Anhydrite has a similar prograde solubility behavior at temperatures above 350 °C in H2O-10wt.%NaCl solutions, but shows retrograde solubility below that temperature (the grey region in the Figure 11). Increasing salinity tends to decrease the deflection point of the temperature, thus shifting the retrograde region to lower temperatures. H2O-NaCl fluids containing silica and calcium sulfate would precipitate quartz and anhydrite upon cooling to 350 °C. Below 350 °C, quartz would continue to precipitate, whereas anhydrite deposition would cease. This inference is consistent with the coprecipitation of quartz and anhydrite in the early to intermediate stage and the disappearance of anhydrite in the late stage in the Tongchang deposit.
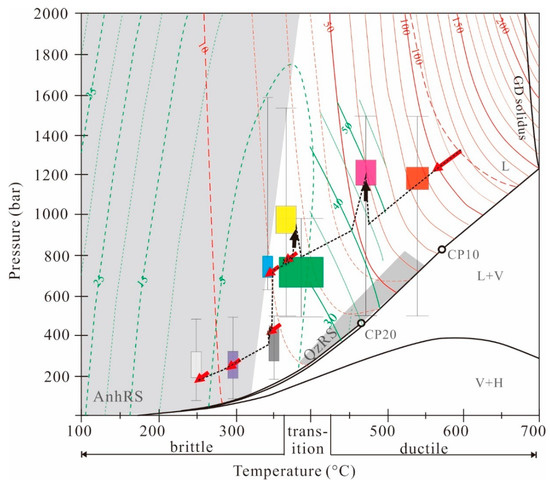
Figure 11.
P-T phase diagrams for H2O-10 wt.% NaCl and H2O-20 wt.% NaCl aqueous systems, contoured with quartz and anhydrite solubilities (red: quartz; green: anhydrite; solid curve: H2O-20 wt.% NaCl; dashed curve: H2O-10 wt.% NaCl. Anhydrite data are from [85]; and quartz data are from [31]. The two areas in grey color are the retrograde solubility regions of anhydrite (AnhRS) and quartz (QzRS). The color-filled rectangles accompanied with error bars represent the deposition conditions of quartz and anhydrite (colors are the same as the in the Figure 10). The thick arrows (decompression cooling in red; quasi-isothermal compression in black) and connecting dash lines represent the possible P-T paths of the hydrothermal ore fluids. Note that the quasi-isothermal fluid overpressure occurred prior to precipitation of Qz3/Anh2, which was followed by pressure fluctuations. Pressure fluctuations also happened during the formation of Qz5. Solubility values (in mm/kgH2O) are marked on the curves. GD solidus: H2O-saturated granodioritic melt solidus; CP10/20: critical point for H2O-10 wt.% NaCl or H2O-20 wt.% NaCl. L: liquid; V: vapor; H: halite.
6.2.2. Quartz Recrystallization
Like many other minerals, quartz undergoes dynamic recrystallization during deformation to minimize free strain energy [86]. Three distinctive recrystallization mechanisms have been recognized [87], i.e., bulging recrystallization (BLG), subgrain rotation (SGR), and grain boundary migration (GBM). These mechanisms occur at different temperature regimes and result in characteristic microstructures [22]. BLG occurs at temperatures between 250 °C and 400 °C, resulting in small, recrystallized grains surrounding large, un-recrystallized grains. SGR occurs at temperatures between 400 °C and 500 °C, generating straight and commonly polygonal grain boundaries. GBM occurs at temperatures between 500 °C and 600 °C, producing lobate grain boundaries. TitaniQ applied in a metamorphic environment [88] and experiments [76,89,90] suggests that SGR and GBM could re-equilibrate Ti in quartz, and thus that TitaniQ would record the temperature of recrystallization.
The grain boundaries shown in Qz1 and Qz2b grains are similar to those of SGR (Figure 6a,b). TitaniQ temperatures of 400–550 °C suggest SGR/GBM recrystallization consistent with the microstructures. A noteworthy feature is that less-recrystallized Qz2a grains are commonly rimmed by CL-dark edges. A similar feature in B-type veins of the Butte porphyry deposit was proposed to be a result of mismatch in lattice alignment of adjacent crystals during competitive grain growth [22]. However, we noted that the CL-dark rims in the Qz2a grains are comparable to those quartz experimentally deformed with the presence of fluid [76]. We infer that the CL-dark rims in Qz2 (Figure 6b) may have been a product of fluid-mediated dissolution-reprecipitation during dynamic recrystallization. If this inference is correct, the quartz dissolution event requires an increase in silica solubility, which cannot be explained by a drop in fluid pressure in a deflating magma chamber as proposed by [22]. Conversely, we consider it more likely to reflect an increase in fluid pressure and/or temperature based on a solubility analysis (Figure 11). Fluid compression is a plausible process in that overpressure in the overlying carapace that could be caused by fluid exsolution and accumulation, which is common for the deposition of early quartz veins [91]. In addition, silica solubility can be enhanced by new pulses of mafic recharge, which may introduce hotter fluids. A possible magmatic recharge was suggested by a geochemical study of the mafic enclaves of the Tongchang deposit [20].
6.2.3. Quartz Dissolution and Fracturing
Immediately after the deposition of Qz2b, a quartz- and anhydrite-dissolution took place prior to the deposition of Qz3 and Anh2 at lower temperatures (350–450 °C) and fluctuating pressures. The temperature constraints indicate a transition from lithostatic to hydrostatic regimes (Figure 11). The quartz dissolution was previously attributed to quasi-isobaric cooling through the retrograde quartz solubility region [17,31,92]. However, this explanation is not likely for Tongchang because quasi-isobaric cooling would cause lower Ti contents in later deposited Qz3b, which is inconsistent with higher Ti contents in Qz3b (around 15 ppm) than in Qz3a (around 10 ppm). Another observation not in favor of quasi-isobaric cooling is that anhydrite displays prograde solubility in the quartz retrograde solubility field, which cannot account for the coeval dissolution of anhydrite and quartz (Figure 11). Therefore, it is inferred that fluid pressurization is seemingly the only viable way to elevate the solubility for both minerals.
Quartz and anhydrite show a similar solubility behavior at temperatures between 350 °C and 400 °C and pressures below 2000 bars, corresponding to a hydrostatic regime [92]. Under hydrostatic conditions, quartz and anhydrite deforms in a brittle fashion, which is consistent with early anhydrite breccia cemented by Anh4 (Figure 7h). The quartz micro-breccia enclosed in Qz5 suggests the occurrence of another episode of fluid overpressure. With the space created by brecciation, pressure fluctuated in response to fluid exsolution and mineral precipitation, resulting in the zoning patterns in Qz5b (Figure 11).
Preexisting veins can be reopened during a later fluid event by dissolution, mechanical breaking, brecciation, and recrystallization [17]. At Tongchang, these phenomena are abundant and occurred at different stages. Dissolution and recrystallization occurred in the early to transitional stage when host rock behaved in ductile fashion, whereas breaking and brecciation occurred in the late stage when host rocks behaved in a brittle fashion.
6.3. Vein Growth Via Reopening
Hydrothermal veins in porphyry Cu deposits are commonly grouped into early quartz (A-type), transitional molybdenite quartz (B-type), and late pyrite (D-type) veins [93]. This model was later modified with the addition of several subordinate vein types, including early magnetite (M-type) [94], early biotitic (EB-type) [95], late chalcopyrite-sericite (C-type) [95,96](Dilles et al., 1992, and epithermal (E-type) veins [97]. Although widely used, the model faces challenges with regard to vein overprints [12].
The Tongchang porphyry deposit presents a good example of such challenges. According to their deposition temperatures, Qz1-2, Qz3 and Qz5 can be considered as indigenous quartz of A-, B-, and D-type veins [31]. Three fourths of the examined veins contain quartz that precipitated earlier or later than the vein formation defined by vein classification (Figure 12). Visual estimates suggested that the early A veins, except the A.Vkq vein in 10DX197, contain younger quartz (Qz3 and Qz4) in volumes <50%. The B veins particularly involve the addition of younger Qz4 quartz to older quartz. For instance, the B.Vmacpq vein in 12DX328 comprises a central lining of pyrite, chalcopyrite, Qz4, Anh4 and carbonates, which is sandwiched by Qz1 and Qz2 quartz. Overprints in late veins are dramatic, and are characterized by the presence of earlier relict quartz (Qz1-3) and minor younger Qz6 quartz. Qz4 quartz are typically absent. D.Vmqp is only different from D.Vpd veins in that it has a larger amount of relict quartz.
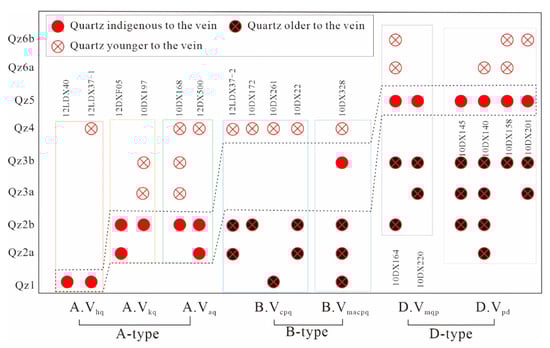
Figure 12.
A qualitative estimation diagram of quartz types contained in A-type, B-type, and D-type veins examined in this study. All examined veins (17 in total) contained quartz younger or older than the vein formation, except two A-type veins. All vein contained early quartz (Qz1, Qz2a, and Qz2b), regardless of vein types. The presence of younger quartz in A-type veins indicates low-degree vein reopening, whereas the presence of older quartz in B-type and D-type veins indicates high-degree vein reopening. Note that there were two veins in the sample 12LDX37. The A.Vhq vein is named as 12LDX37-1, and the B.Vcpq vein is named 12LDX37-2.
A striking feature of the studied veins is that they all contain early quartz (Qz1-2), regardless of vein types. If these samples are representative of veining processes at Tongchang, it is plausible to infer that all the vein types are reopening early quartz-dominated veins. The present early veins are the product of slight overprints. The chalcopyrite veins (B.Vcpq and B.Vmacpq) may be produced by the reopening of the earlier quartz veins by Qz4-depositing fluids, which is consistent with the conclusion of [31]. The late pyritic veins (D.Vmqp and D.Vpd) are products of overprints by Qz5-depositing fluids on earlier quartz veins.
6.4. Implications for Cu Sulfide Deposition
In the early fluid stage, hematite and anhydrite with little sulfide were deposited in the A.Vhq veins (Figure 13), attesting to oxidized sulfur species (, ) at high temperatures [98,99]. In the potassic altered rocks, however, the low-sulfidation assemblage of chalcopyrite, bornite, magnetite and hematite developed [100]. These Fe-Cu sulfides were formed coevally with Qz1 and Qz2 at high temperatures (650 °C to 450 °C) (Figure 13), and the required was probably produced through the chemical reduction of sulfate in the fluids by mafic minerals such as biotite and hornblende [101]. It is worth mentioning that potassic ores of Tongchang are much less significant than in usual porphyry deposits [74], likely due to sulfide remobilization [1].
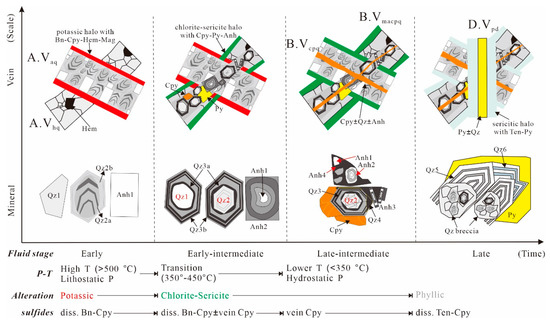
Figure 13.
A mineral to vein scale model illustrating hydrothermal alterations, veins, and vein reopening over four fluid stages encompassed in the Tongchang porphyry Cu deposit. It also summarizes the temporal evolution of P-T conditions and sulfide assemblages. Hem: hematite; Bn: bornite; Cpy: chalcopyrite; Mag: magnetite; Qz: quartz; Anh: anhydrite; Py: pyrite; Ten: tennantite; diss: disseminated.
The first overprint is characterized by the deposition of pyrite ± chalcopyrite in the Qz3–Anh2 veins and chlorite–sericite alterations (Figure 13). The disappearance of ferric iron oxides and the appearance of pyrite indicate an increase in the sulfidation state with continuous cooling [100]. The required for sulfide deposition is likely derived from the disproportionation favored by fluid cooling (350 °C to 450 °C) [98]. The remobilization of early-stage sulfides might not be a significant source of because chalcopyrite solubility is significantly impeded during this process [102]. In the alteration halos, the precipitation of anhydrite (Anh2) occurred coevally with sulfide deposition and the hydrolysis of feldspars, indicating a potential chemisorption reaction between -bearing fluids and andesine [10].
Cu sulfides of the Tongchang deposit were mainly deposited in the vein assemblage of pyrite—chalcopyrite—Qz4—Anh4 at 300 °C–380 °C (Figure 13). The increased availability of Cu may be a result of the dissociation of complexes caused by fluid dilution in response to the entrainment of groundwaters and metamorphic fluids [103]. Another contributing factor might be the remobilization of existing sulfides associated with potassic alteration. Inflow of air saturated groundwater may significantly elevate the oxidation state and acidity of the magmatic fluids, which are favorable for chalcopyrite dissolution [102].
Although a large proportion of Cu sulfides are hosted in sericitic alteration zones, petrographic evidence of chalcopyrite inclusions and high-sulfidation assemblage of pyrite and tennantite indicates that they are remobilized from earlier ores (Figure 13). The mineral assemblage in the phyllic altered rocks reflects the stability of muscovite, quartz and pyrite, and the instability of chlorite, feldspars, mafic minerals, and chalcopyrite. This is similar to the Butte porphyry deposit, where the early ores (chalcopyrite-pyrite-magnetite) with potassic–chloritic alterations were remobilized by circulating oxidized groundwaters and re-deposited as chalcocite and covellite [104].
7. Conclusions
The Tongchang porphyry deposit represents a rare case of a porphyry copper deposit resulting from a single magmatic intrusion. It was expected that it would have undergone less fluid overprint compared to multi-intrusion counterparts. However, CL imaging of vein quartz and anhydrite revealed vein overprints as complicated (if not more complicated) as those in multi-intrusion deposits. This observation suggests that vein overprinting is likely an intrinsic property of porphyry deposits, regardless of intrusive history and other geological factors. The failure to recognize such vein overprints may result in erroneous fluid chronology and the incorrect interpretation of geochemical data (e.g., fluid inclusion and isotopes). Therefore, one should be careful when conducting geochemical analysis based on macroscopic features and a conventional vein model. Whenever possible, detailed CL imaging is an imperative.
As expected, the P–T history of Tongchang is characterized by an overall cooling and decompression trajectory. However, in contrast to monotonic cooling model, the P–T analysis of Tongchang porphyry deposit uncovered two significant episodes of fluid compression, likely corresponding to two periods of magmatic fluid accumulation under lithostatic and lithostatic to hydrostatic regimes. There might have been an increase in temperature during the second episode of compression. These irregularities in pressure should be considered for fluid models of porphyry deposits.
The Cu deposition process is better elucidated with the aid of CL petrography and integrated geothermometry. It was clearly shown that the high oxidation state of early high temperature fluids precludes Cu sulfide deposition in veins. However, Cu sulfide could be deposited via a chemical reaction with mafic minerals. The Cu sulfide deposition commences at temperatures lower than 450 °C when disproportionation starts. Most chalcopyrite was precipitated at lower temperatures of 350 °C to 300 °C.
Author Contributions
X.L. and B.G.R. initiated the idea and work plan; X.L. performed the experiments; X.L., A.R., J.P. and B.G.R. interpreted the data; X.L. prepared the manuscript; A.R., J.P. and B.G.R. edited the manuscript. X.L. and J.P. acquired research funds. All authors have read and agreed to the published version of the manuscript.
Funding
This study was supported collectively by the National Natural Science Foundation of China (project N.O. 41402083), the China Scholarship Council (a visiting scholar fellowship granted to X.L.), and the Extra & Co project (Valorisation-Instituts Carnot n°ANR-15-CNRT-003).
Informed Consent Statement
Not applicable.
Data Availability Statement
All data generated or analyzed during this study are included in this published article and Appendix A.
Acknowledgments
Hongrui Fan, Fangfang Hu, Kuifeng Yang and Bojie Wen are acknowledged for their assistance with the fieldwork and sample preparation. Charles Wandler and Andreï Lecomte are thanked for their help during the SEM analyses. Kyle Mikkelsen and Tingguang Lan are acknowledged for their assistance during the LA-ICP-MS analyses. van Hoan Le assisted with the solubility curves construction. Two anonymous reviewers are sincerely thanked for their detailed reviews and comments.
Conflicts of Interest
The authors declare no conflict of interest.
Appendix A

Figure A1.
Petrography of studied samples. Selected vein samples and photos of the thick sections. (a) 1- hematite quartz vein; 2- muscovite chlorite chalcopyrite pyrite quartz vein; 3- chunk of chlorite, hematite, sericite and muscovite; 4- large chunk of hematite; 5- feldspar replaced by sericite; 6- residue quartz; 7- groundmass containing disseminated chalcopyrite; 8- groundmass containing abundant hematite and chalcopyrite; 9- green aggregation consisting of chlorite and sericite; (b) 1- K-feldspar partly altered by muscovite and chlorite; 2- sericite - chlorite pseudomorph after plagioclase; 3- chunk of sericite, chlorite, muscovite, chalcopyrite and rutile; 4- chunk of chlorite, chalcopyrite and rutile; 5- chalcopyrite with pyrite inclusions; 6- chunk of rutile, chalcopyrite and muscovite; 7- muscovite - chlorite - rutile - quartz after biotite; 8- chunk of muscovite, chalcopyrite, pyrite and rutile; 9- chlorite (center) - sericite (rim) after feldspar; 10- chunk of chlorite and rutile; 11- chunk of pyrite, chlorite, rutile and epidote; 12- chunk of chlorite, rutile and calcite; (c) 1- altered porphyry by chlorite, sericite, rutile and pyrite; 2- anhydrite, epidote and chlorite; 3- carbonate vein; 4- anhydrite epidote veinlet; 5- chunk of molybdenite; 6- K-feldspar partly altered by sericite, chlorite and epidote; 7- sericite pseudomorph after K-feldspar; 8- pyrite crosscut by chalcopyrite veinlets; 9- dirty quartz with abundant fluid inclusions; 10- clear quartz; 11- anhydrite; (d) 1-fresh biotite; 2- biotite slightly altered by chlorite; 3- biotite slightly altered by quartz, sericite, chlorite, hematite and magnetite; 4- chunks of secondary biotite; 5- plagioclase slightly altered by sericite; 6- residue quartz with overgrowth; 7- sericite pseudomorph after feldspar; 8- groundmass of small quartz, sericite and chlorite; 9- vein quartz and anhydrite; (e) 1- quartz vein; 2- altered porphyry; 3- chlorite hematite calcite vein; 4- chlorite muscovite chalcopyrite pyrite vein; 5- chalcopyrite pyrite chlorite quartz veinlets; 6- biotite replaced by chlorite sericite chalcopyrite and rutile; 7- feldspar completely replaced by sericite and muscovite; (f) 1- slightly altered porphyry; 2- illitic chlorite - sericite altered porphyry; 3- sericite (rim)-chlorite (center) pseudomorph after feldspar; 4- chlorite-chalcopyrite pseudomorph after biotite; 5- sericite-rutile pseudomorph after biotite; 6- chunk of chalcopyrite, muscovite and anhydrite; 7- residue anhydrite; 8- anhydrite chalcopyrite veinlet; 9- anhydrite chalcopyrite pyrite vein; 10- chalcopyrite veinlet; (g) 1- slightly altered porphyry; 2- sericitic altered porphyry; 3- residue quartz; 4- chunk of muscovite and pyrite; 5- pyrite, muscovite and rutile pseudomorph after biotite; 6- muscovite, rutile, quartz and pyrite pseudomorph after biotite; 7- vein pyrite crosscut by carbonate veinlets; 8- quartz, muscovite, molybdenite, rutile layer; 9- fine-grained quartz and large muscovite in equal amount; (h) 1- silicified phyllite with oriented sericite, quartz and rutile; 2- pyrite quartz vein; 3- pyrite dominated vein; 4- aggregation of chlorite; 5- aggregation of quartz. Areas mapped with SEM-CL are also shown.


Figure A2.
Tukey Boxplot of trace elements in vein quartz of the Tongchang porphyry Cu deposit.
Figure A2.
Tukey Boxplot of trace elements in vein quartz of the Tongchang porphyry Cu deposit.

References
- Sillitoe, R.H. Porphyry copper systems. Econ. Geol. 2010, 105, 3–41. [Google Scholar] [CrossRef]
- Michaux, S.P. Assessment of the Extra Capacity Required of Alternative Energy Electrical Power Systems to Completely Replace Fossil Fuels. Geological Survey of Finland (GTK) Open Report 42. 2021. Available online: https://tupa.gtk.fi/raportti/arkisto/42_2021.pdf (accessed on 29 March 2022).
- Hedenquist, J.W.; Lowenstern, J.B. The role of magmas in the formation of hydrothermal ore deposits. Nature 1994, 370, 519. [Google Scholar] [CrossRef]
- Richards, J.P. Magmatic to hydrothermal metal fluxes in convergent and collided margins. Ore Geol. Rev. 2011, 40, 1–26. [Google Scholar] [CrossRef]
- Richards, J.P. Giant ore deposits formed by optimal alignments and combinations of geological processes. Nat. Geosci. 2013, 6, 911–916. [Google Scholar] [CrossRef]
- Vigneresse, J.-L.; Ballouard, C.; Liu, X.; Richard, A. Toward a global conceptual model for metal enrichment in felsic, mafic-ultramafic, and alkaline-carbonatitic magmas. Ore Geol. Rev. 2020, 129, 103925. [Google Scholar] [CrossRef]
- Vigneresse, J.-L.; Truche, L.; Richard, A. How do metals escape from magmas to form porphyry-type ore deposits? Ore Geol. Rev. 2018, 105, 310–336. [Google Scholar] [CrossRef]
- Seedorff, E.; Dilles, J.H.; Proffett, J.M.; Einaudi, M.T. Porphyry deposits: Characteristics and origin of hypogene features. In Economic Geology: One Hundredth Anniversary Volume; Society of Economic Geologists: Littleton, CO, USA, 2005; pp. 251–298. [Google Scholar]
- Blundy, J.; Mavrogenes, J.; Tattitch, B.; Sparks, S.; Gilmer, A. Generation of porphyry copper deposits by gas–brine reaction in volcanic arcs. Nat. Geosci. 2015, 8, ngeo2351. [Google Scholar] [CrossRef]
- Henley, R.W.; King, P.L.; Wykes, J.L.; Renggli, C.J.; Brink, F.J.; Clark, D.A.; Troitzsch, U. Porphyry copper deposit formation by sub-volcanic sulphur dioxide flux and chemisorption. Nat. Geosci. 2015, 8, 210–215. [Google Scholar] [CrossRef]
- Wilkinson, J.J. Triggers for the formation of porphyry ore deposits in magmatic arcs. Nat. Geosci. 2013, 6, 917–925. [Google Scholar] [CrossRef]
- Bennett, M.M. Cathodoluminescence and Fluid Inclusion Characteristics of Hydrothermal Quartz from Porphyry Deposits. Doctoral Dissertation, Colorado School of Mines, Arthur Lakes Library, Golden, CO, USA, 2014. [Google Scholar]
- Landtwing, M.R.; Pettke, T.; Halter, W.E.; Heinrich, C.A.; Redmond, P.B.; Einaudi, M.T.; Kunze, K. Copper deposition during quartz dissolution by cooling magmatic–hydrothermal fluids: The Bingham porphyry. Earth Planet. Sci. Lett. 2005, 235, 229–243. [Google Scholar] [CrossRef]
- Landtwing, M.R.; Furrer, C.; Redmond, P.B.; Pettke, T.; Guillong, M.; Heinrich, C.A. The Bingham Canyon Porphyry Cu-Mo-Au Deposit. III. Zoned Copper-Gold Ore Deposition by Magmatic Vapor Expansion. Econ. Geol. 2010, 105, 91–118. [Google Scholar] [CrossRef]
- Qiu, K.F.; Deng, J.; Yu, H.C.; Wu, M.Q.; Wang, Y.; Zhang, L.; Goldfarb, R. Identifying hydrothermal quartz vein generations in the Taiyangshan porphyry Cu-Mo deposit (West Qinling, China) using cathodoluminescence, trace element geochemistry, and fluid inclusions. Ore Geol. Rev. 2021, 128, 103882. [Google Scholar] [CrossRef]
- Redmond, P.B.; Einaudi, M.T.; Inan, E.E.; Landtwing, M.R.; Heinrich, C.A. Copper deposition by fluid cooling in intrusion-centered systems: New insights from the Bingham porphyry ore deposit, Utah. Geology 2004, 32, 217–220. [Google Scholar] [CrossRef]
- Rusk, B.; Reed, M. Scanning electron microscope—Cathodoluminescence analysis of quartz reveals complex growth histories in veins from the Butte porphyry copper deposit, Montana. Geology 2002, 30, 727–730. [Google Scholar] [CrossRef]
- Frelinger, S.N.; Ledvina, M.D.; Kyle, J.R.; Zhao, D. Scanning electron microscopy cathodoluminescence of quartz: Principles, techniques and applications in ore geology. Ore Geol. Rev. 2015, 65, 840–852. [Google Scholar] [CrossRef]
- Liu, X.; Fan, H.R.; Hu, F.F.; Yang, K.F.; Wen, B.J. Nature and evolution of the ore-forming fluids in the giant Dexing porphyry Cu-Mo-Au deposit, Southeastern China. J. Geochem. Explor. 2016, 171, 83–95. [Google Scholar] [CrossRef]
- Hou, Z.; Pan, X.; Li, Q.; Yang, Z.; Song, Y. The giant Dexing porphyry Cu–Mo–Au deposit in east China: Product of melting of juvenile lower crust in an intracontinental setting. Miner. Deposita 2013, 48, 1019–1045. [Google Scholar] [CrossRef]
- Götze, J.; Pan, Y.; Müller, A. Mineralogy and mineral chemistry of quartz: A review. Miner. Mag. 2021, 85, 639–664. [Google Scholar] [CrossRef]
- Acosta, M.D.; Reed, M.H.; Watkins, J.M. Quartz Vein Formation and Deformation during Porphyry Cu Deposit Formation: A Microstructural and Geochemical Analysis of the Butte, Montana, Ore Deposit. Lithosphere 2022, 2022, 3196601. [Google Scholar] [CrossRef]
- Huang, R.; Audétat, A. The titanium-in-quartz (TitaniQ) thermobarometer: A critical examination and re-calibration. Geochim. Cosmochim. Acta 2012, 84, 75–89. [Google Scholar] [CrossRef]
- Maydagán, L.; Franchini, M.; Rusk, B.; Lentz, D.R.; McFarlane, C.; Impiccini, A.; Ríos, F.J.; Rey, R. Porphyry to epithermal transition in the altar Cu-(Au-Mo) deposit, Argentina, studied by cathodoluminescence, LA-ICP-MS, and fluid inclusion analysis. Econ. Geol. 2015, 110, 889–923. [Google Scholar] [CrossRef]
- Mao, W.; Rusk, B.; Yang, F.; Zhang, M. Physical and Chemical Evolution of the Dabaoshan Porphyry Mo Deposit, South China: Insights from Fluid Inclusions, Cathodoluminescence, and Trace Elements in Quartz. Econ. Geol. 2017, 112, 889–918. [Google Scholar] [CrossRef]
- Thomas, J.B.; Watson, E.B.; Spear, F.S.; Shemella, P.T.; Nayak, S.K.; Lanzirotti, A. TitaniQ under pressure: The effect of pressure and temperature on the solubility of Ti in quartz. Contrib. Mineral. Petrol. 2010, 160, 743–759. [Google Scholar] [CrossRef]
- Wark, D.A.; Watson, E.B. TitaniQ: A titanium-in-quartz geothermometer. Contrib. Mineral. Petrol. 2006, 152, 743–754. [Google Scholar] [CrossRef]
- Boiron, M.C.; Essarraj, S.; Cathelineau, L.P. Identification of fluid inclusions in relation to their host microstructural domains in quartz by cathodoluminescence. Geochim. Cosmochim. Acta 1992, 56, 175–185. [Google Scholar] [CrossRef]
- Ni, P.; Pan, J.Y.; Wang, G.G.; Chi, Z.; Qin, H.; Ding, J.Y.; Chen, H. A CO2-rich porphyry ore-forming fluid system constrained from a combined cathodoluminescence imaging and fluid inclusion studies of quartz veins from the Tongcun Mo deposit, South China. Ore Geol. Rev. 2017, 81, 856–870. [Google Scholar] [CrossRef]
- Van den Kerkhof, A.M.; Hein, U.F. Fluid inclusion petrography. Lithos 2001, 55, 27–47. [Google Scholar] [CrossRef]
- Monecke, T.; Monecke, J.; Reynolds, T.J.; Tsuruoka, S.; Bennett, M.M.; Skewes, W.B.; Palin, R.M. Quartz solubility in the H2O-NaCl system: A framework for understanding vein formation in porphyry copper deposits. Econ. Geol. 2018, 113, 1007–1046. [Google Scholar] [CrossRef]
- Wei, Q.; Fan, H.; Pironon, J.; Liu, X. Auriferous Quartz Veining Due to CO2 Content Variations and Decompressional Cooling, Revealed by Quartz Solubility, SEM-CL and Fluid Inclusion Analyses (The Linglong Goldfield, Jiaodong). Minerals 2020, 10, 417. [Google Scholar] [CrossRef]
- Cloos, M. Bubbling magma chambers, cupolas, and porphyry copper deposits. Int. Geol. Rev. 2001, 43, 285–311. [Google Scholar] [CrossRef]
- Wang, Y.; Fan, W.; Zhang, G.; Zhang, Y. Phanerozoic tectonics of the South China Block: Key observations and controversies. Gondwana Res. 2013, 23, 1273–1305. [Google Scholar] [CrossRef]
- Cawood, P.A.; Zhao, G.; Yao, J.; Wang, W.; Xu, Y.; Wang, Y. Reconstructing South China in phanerozoic and precambrian supercontinents. Earth-Sci. Rev. 2018, 186, 173–194. [Google Scholar] [CrossRef]
- Gilder, S.A.; Gill, J.; Coe, R.S.; Zhao, X.; Liu, Z.; Wang, G.; Yuan, K.; Liu, W.; Kuang, G.; Wu, H. Isotopic and paleomagnetic constraints on the Mesozoic tectonic evolution of south China. Journal of Geophysical Research. Solid Earth 1996, 101, 16137–16154. [Google Scholar]
- Zhao, G.; Cawood, P.A. Precambrian geology of China. Precambrian Res. 2012, 222–223, 13–54. [Google Scholar] [CrossRef]
- Liu, X.; Fan, H.R.; Santosh, M.; Hu, F.F.; Yang, K.F.; Li, Q.L.; Yang, Y.H.; Liu, Y. Remelting of Neoproterozoic relict volcanic arcs in the Middle Jurassic: Implication for the formation of the Dexing porphyry copper deposit, Southeastern China. Lithos 2012, 150, 85–100. [Google Scholar] [CrossRef]
- Liu, X.; Fan, H.R.; Santosh, M.; Hu, F.F.; Yang, K.F.; Wen, B.J.; Yang, Y.H.; Liu, Y. Origin of the Yinshan epithermal-porphyry Cu–Au–Pb–Zn–Ag deposit, southeastern China: Insights from geochemistry, Sr–Nd and zircon U–Pb–Hf–O isotopes. Int. Geol. Rev. 2013, 55, 1835–1864. [Google Scholar] [CrossRef]
- Charvet, J. The neoproterozoic–early paleozoic tectonic evolution of the South China Block: An overview. J. Asian Earth Sci. 2013, 74, 198–209. [Google Scholar] [CrossRef]
- Wang, X.-L.; Zhou, J.-C.; Griffin, W.; Zhao, G.; Yu, J.-H.; Qiu, J.-S.; Zhang, Y.-J.; Xing, G.-F. Geochemical zonation across a Neoproterozoic orogenic belt: Isotopic evidence from granitoids and metasedimentary rocks of the Jiangnan orogen, China. Precambrian Res. 2014, 242, 154–171. [Google Scholar] [CrossRef]
- Yao, J.; Shu, L.; Cawood, P.A.; Zhao, G. Differentiating continental and oceanic arc systems and retro-arc basins in the Jiangnan orogenic belt, South China. Geol. Mag. 2019, 156, 2001–2016. [Google Scholar] [CrossRef]
- Li, X.H.; Li, W.X.; Li, Z.X.; Lo, C.H.; Wang, J.; Ye, M.F.; Yang, Y.H. Amalgamation between the Yangtze and Cathaysia Blocks in South China: Constraints from SHRIMP U–Pb zircon ages, geochemistry and Nd–Hf isotopes of the Shuangxiwu volcanic rocks. Precambrian Res. 2009, 174, 117–128. [Google Scholar] [CrossRef]
- Charvet, J.; Shu, L.; Shi, Y.; Guo, L.; Faure, M. The building of south China: Collision of Yangzi and Cathaysia blocks, problems and tentative answers. J. Southeast Asian Earth Sci. 1996, 13, 223–235. [Google Scholar] [CrossRef]
- Yang, C.; Li, X.H.; Wang, X.C.; Lan, Z. Mid-Neoproterozoic angular unconformity in the Yangtze Block revisited: Insights from detrital zircon U–Pb age and Hf–O isotopes. Precambrian Res. 2015, 266, 165–178. [Google Scholar] [CrossRef]
- Wang, X.-L.; Zhao, G.; Zhou, J.-C.; Liu, Y.; Hu, J. Geochronology and Hf isotopes of zircon from volcanic rocks of the Shuangqiaoshan Group, South China: Implications for the Neoproterozoic tectonic evolution of the eastern Jiangnan orogen. Gondwana Res. 2008, 14, 355–367. [Google Scholar] [CrossRef]
- Xia, Y.; Xu, X. A Fragment of Columbia Supercontinent: Insight for Cathaysia Block Basement from Tectono-Magmatic Evolution and Mantle Heterogeneity. Geophys. Res. Lett. 2019, 46, 2012–2024. [Google Scholar] [CrossRef]
- Wang, Y.; Zhang, A.; Cawood, P.A.; Fan, W.; Xu, J.; Zhang, G.; Zhang, Y. Geochronological, geochemical and Nd–Hf–Os isotopic fingerprinting of an early Neoproterozoic arc–back-arc system in South China and its accretionary assembly along the margin of Rodinia. Precambrian Res. 2013, 231, 343–371. [Google Scholar] [CrossRef]
- Zheng, J.; Griffin, W.; Li, L.; O’Reilly, S.Y.; Pearson, N.; Tang, H.; Liu, G.; Zhao, J.; Yu, C.; Su, Y. Highly evolved Archean basement beneath the western Cathaysia Block, South China. Geochim. Cosmochim. Acta 2010, 75, 242–255. [Google Scholar] [CrossRef]
- Li, Z.; Li, X.; Kinny, P.; Wang, J.; Zhang, S.; Zhou, H. Geochronology of Neoproterozoic syn-rift magmatism in the Yangtze Craton, South China and correlations with other continents: Evidence for a mantle superplume that broke up Rodinia. Precambrian Res. 2003, 122, 85–109. [Google Scholar] [CrossRef]
- Zhao, G. Jiangnan Orogen in South China: Developing from divergent double subduction. Gondwana Res. 2015, 27, 1173–1180. [Google Scholar] [CrossRef]
- Shu, L.; Faure, M.; Wang, B.; Zhou, X.; Song, B. Late Palaeozoic–Early Mesozoic geological features of South China: Response to the Indosinian collision events in Southeast Asia. Comptes Rendus Geosci. 2008, 340, 151–165. [Google Scholar] [CrossRef]
- Zhou, X.; Sun, T.; Shen, W.; Shu, L.; Niu, Y. Petrogenesis of Mesozoic granitoids and volcanic rocks in South China: A response to tectonic evolution. Episodes 2006, 29, 26–33. [Google Scholar] [CrossRef]
- Mao, J.W.; Chen, Y.B.; Chen, M.H.; Pirajno, F. Major types and time–space distribution of Mesozoic ore deposits in South China and their geodynamic settings. Miner. Depos. 2013, 48, 267–294. [Google Scholar]
- Chu, Y.; Faure, M.; Lin, W.; Wang, Q. Early Mesozoic tectonics of the South China block: Insights from the Xuefengshan intracontinental orogen. J. Asian Earth Sci. 2012, 61, 199–220. [Google Scholar] [CrossRef]
- Dong, S.; Zhang, Y.; Zhang, F.; Cui, J.; Chen, X.; Zhang, S.; Miao, L.; Li, J.; Shi, W.; Li, Z.; et al. Late Jurassic–Early Cretaceous continental convergence and intracontinental orogenesis in East Asia: A synthesis of the Yanshan Revolution. J. Asian Earth Sci. 2015, 114, 750–770. [Google Scholar] [CrossRef]
- Faure, M.; Lin, W.; Chu, Y.; Lepvrier, C. Triassic tectonics of the southern margin of the South China Block. Comptes Rendus Geosci. 2016, 348, 5–14. [Google Scholar] [CrossRef]
- Ji, W.; Faure, M.; Lin, W.; Chen, Y.; Chu, Y.; Xue, Z. Multiple Emplacement and Exhumation History of the Late Mesozoic Dayunshan-Mufushan Batholith in Southeast China and Its Tectonic Significance: 1. Structural Analysis and Geochronological Constraints. J. Geophys. Res. Solid Earth 2018, 123, 689–710. [Google Scholar] [CrossRef]
- Li, Z.X.; Li, X.H.; Chung, S.L.; Lo, C.H.; Xu, X.; Li, W.X. Magmatic switch-on and switch-off along the South China continental margin since the Permian: Transition from an Andean-type to a Western Pacific-type plate boundary. Tectonophysics 2012, 532, 271–290. [Google Scholar] [CrossRef]
- Li, J.; Dong, S.; Cawood, P.A.; Zhao, G.; Johnston, S.T.; Zhang, Y.; Xin, Y. An Andean-type retro-arc foreland system beneath northwest South China revealed by SINOPROBE profiling. Earth Planet. Sci. Lett. 2018, 490, 170–179. [Google Scholar] [CrossRef]
- Xu, C.; Zhang, L.; Shi, H.; Brix, M.R.; Huhma, H.; Chen, L.; Zhang, M.; Zhou, Z. Tracing an Early Jurassic magmatic arc from South to East China Seas. Tectonics 2017, 36, 466–492. [Google Scholar] [CrossRef]
- Yui, T.F.; Chu, H.T.; Suga, K.; Lan, C.Y.; Chung, S.H.; Wang, K.L.; Grove, M. Subduction-related 200 Ma Talun metagranite, SE Taiwan: An age constraint for palaeo-Pacific plate subduction beneath South China Block during the Mesozoic. Int. Geol. Rev. 2016, 59, 333–334. [Google Scholar] [CrossRef]
- Wang, Q.; Xu, J.-F.; Jian, P.; Bao, Z.-W.; Zhao, Z.-H.; Li, C.-F.; Xiong, X.-L.; Ma, J.-L. Petrogenesis of Adakitic Porphyries in an Extensional Tectonic Setting, Dexing, South China: Implications for the Genesis of Porphyry Copper Mineralization. J. Pet. 2006, 47, 119–144. [Google Scholar] [CrossRef]
- Liu, X.; Fan, H.-R.; Evans, N.J.; Batt, G.E.; McInnes, B.I.A.; Yang, K.-F.; Qin, K.-Z. Cooling and exhumation of the mid-Jurassic porphyry copper systems in Dexing City, SE China: Insights from geo- and thermochronology. Miner. Deposita 2014, 49, 809–819. [Google Scholar] [CrossRef]
- Zhou, Q.; Jiang, Y.H.; Liao, S.Y.; Zhao, P.; Jin, G.D.; Jia, R.Y.; Liu, Z.; Xu, S.M. SHRIMP zircon U-Pb dating and Hf isotope studies of the diorite porphyrite from the Dexing copper deposit. Acta Geol. Sin. 2012, 86, 1726–1734, (In Chinese with English Abstract). [Google Scholar]
- Gao, F.Z. Alteration of Dexing porphyry copper (molybdenum). Shanghai Geol. 1992, 2, 24–35, (In Chinese with English Abstract). [Google Scholar]
- Pan, X.F.; Song, Y.C.; Wang, S.X.; Li, Z.Q.; Yang, Z.M.; Hou, Z.Q. Evolution of hydrothermal fluid of Dexing Tongchang copper-gold porphyry deposit. Acta Geol. Sin. 2009, 12, 1929–1950, (In Chinese with English Abstract). [Google Scholar]
- Rui, Z.Y.; Huang, C.K.; Qi, G.M.; Xu, Y.; Zhang, H.T. Porphyry Copper (Molybdenite) Deposits of China; Geological Publishing House: Beijing, China, 1984; pp. 242–252, (In Chinese with English Abstract). [Google Scholar]
- Jochum, K.P.; Weis, U.; Stoll, B.; Kuzmin, D.; Yang, Q.; Raczek, I.; Jacob, D.E.; Stracke, A.; Birbaum, K.; Frick, D.A.; et al. Determination of Reference Values for NIST SRM 610-617 Glasses Following ISO Guidelines. Geostand. Geoanalytical Res. 2011, 35, 397–429. [Google Scholar] [CrossRef]
- Audétat, A.; Garbe-Schönberg, D.; Kronz, A.; Pettke, T.; Rusk, B.; Donovan, J.J.; Lowers, H.A. Characterisation of a natural quartz crystal as a reference material for microanalytical determination of Ti, Al, Li, Fe, Mn, Ga and Ge. Geostand. Geoanalytical Res. 2015, 39, 171–184. [Google Scholar] [CrossRef]
- Liu, Y.; Hu, Z.; Gao, S.; Günther, D.; Xu, J.; Gao, C.; Chen, H. In situ analysis of major and trace elements of anhydrous minerals by LA-ICP-MS without applying an internal standard. Chem. Geol. 2008, 257, 34–43. [Google Scholar] [CrossRef]
- Roedder, E. Fluid inclusions. Rev. Mineral. 1984, 12, 11–16. [Google Scholar]
- Steele-MacInnis, M.; Lecumberri-Sanchez, P.; Bodnar, R.J. HokieFlincs_H2O-NaCl: A Microsoft Excel spreadsheet for interpreting microthermometric data from fluid inclusions based on the PVTX properties of H2O–NaCl. Comput. Geosci. 2012, 49, 334–337. [Google Scholar] [CrossRef]
- Rusk, B.G.; Reed, M.H.; Dilles, J.H. Fluid Inclusion Evidence for Magmatic-Hydrothermal Fluid Evolution in the Porphyry Copper-Molybdenum Deposit at Butte, Montana. Econ. Geol. 2008, 103, 307–334. [Google Scholar] [CrossRef]
- Ostapenko, G.T.; Tarashchan, A.N.; Mitsyuk, B.M. Rutile-quartz geothermobarometer. Geochem. Int. 2007, 45, 506–508. [Google Scholar] [CrossRef]
- Thomas, J.B.; Watson, E.B.; Spear, F.S.; Wark, D.A. TitaniQ recrystallized: Experimental confirmation of the original Ti-in-quartz calibrations. Contrib. Mineral. Petrol. 2015, 169, 27. [Google Scholar] [CrossRef]
- Acosta, M.D. Titanium in Quartz during Growth and Deformation under Hydrothermal-Magmatic Conditions. Doctoral Dissertation, University of Oregon, Eugene, OR, USA, 2020. [Google Scholar]
- Raimbourg, H.; Famin, V.; Canizarès, A.; Le Trong, E. Fluid pressure changes recorded by trace elements in quartz. Geochem. Geophys. Geosystems 2022, 23, e2022GC010346. [Google Scholar] [CrossRef]
- Rusk, B.; Reed, M.; Bignall, G.; Tsuchiya, N. Natural and synthetic quartz growth and dissolution revealed by scanning electron microscope cathodoluminescence. In Proceedings of the 14th International Conference on the Properties of Water and Steam, Kyoto, Japan, 29 August–3 September 2004. [Google Scholar]
- Rusk, B. Cathodoluminescent Textures and Trace Elements in Hydrothermal Quartz. In Quartz: Deposits, Mineralogy and An-alytics; Springer Geology: Berlin/Heidelberg, Germany, 2012; pp. 307–329. [Google Scholar]
- Vasyukova, O.V.; Kamenetsky, V.S.; Goemann, K.; Davidson, P. Diversity of primary CL textures in quartz from porphyry environments: Implication for origin of quartz eyes. Contrib. Miner. Pet. 2013, 166, 1253–1268. [Google Scholar] [CrossRef]
- Monnier, L.; Lach, P.; Salvi, S.; Melleton, J.; Bailly, L.; Béziat, D.; Monnier, Y.; Gouy, S. Quartz trace-element composition by LA-ICP-MS as proxy for granite differentiation, hydrothermal episodes, and related mineralization: The Beauvoir Granite (Echassières district), France. Lithos 2018, 320, 355–377. [Google Scholar] [CrossRef]
- Tanner, D.; Henley, R.W.; Mavrogenes, J.A.; Holden, P. Combining in situ isotopic, trace element and textural analyses of quartz from four magmatic-hydrothermal ore deposits. Contrib. Mineral. Petrol. 2013, 166, 1119–1142. [Google Scholar] [CrossRef]
- Li, X.-H.; Klyukin, Y.; Steele-MacInnis, M.; Fan, H.-R.; Yang, K.-F.; Zoheir, B. Phase equilibria, thermodynamic properties, and solubility of quartz in saline-aqueous-carbonic fluids: Application to orogenic and intrusion-related gold deposits. Geochim. Cosmochim. Acta 2020, 283, 201–221. [Google Scholar] [CrossRef]
- Blount, C.W.; Dickson, F.W. The solubility of anhydrite (CaSO4) in NaCl-H2O from 100 to 450 °C and 1 to 1000 bars. Geochim. Cosmochim. Acta 1969, 33, 227–245. [Google Scholar] [CrossRef]
- Lloyd, G.E.; Freeman, B. Dynamic recrystallization of quartz under greenschist conditions. J. Struct. Geol. 1994, 16, 867–881. [Google Scholar] [CrossRef]
- Stipp, M.; Stünitz, H.; Heilbronner, R.; Schmid, S.M. Dynamic recrystallization of quartz: Correlation between natural and experimental conditions. Geol. Soc. Lond. Spéc. Publ. 2002, 200, 171–190. [Google Scholar] [CrossRef]
- Ashley, K.T.; Carlson, W.D.; Law, R.D.; Tracy, R.J. Ti resetting in quartz during dynamic recrystallization: Mechanisms and significance. Am. Mineral. 2014, 99, 2025–2030. [Google Scholar] [CrossRef]
- Nachlas, W.O.; Hirth, G. Experimental constraints on the role of dynamic recrystallization on resetting the Ti-in-quartz thermobarometer. J. Geophys. Res. Solid Earth 2015, 120, 8120–8137. [Google Scholar] [CrossRef]
- Nachlas, W.O.; Thomas, J.B.; Hirth, G. TitaniQ deformed: Experimental deformation of out-of-equilibrium quartz porphyroclasts. J. Struct. Geol. 2018, 116, 207–222. [Google Scholar] [CrossRef]
- Burnham, C.W. Magmas and hydrothermal fluids. In Geochemistry of Hydrothermal Ore Deposits; Barnes, H.L., Ed.; John Wiley & Sons: Hoboken, NJ, USA, 1997; pp. 63–118. [Google Scholar]
- Fournier, R.O. Hydrothermal processes related to movement of fluid from plastic into brittle rock in the magmatic-epithermal environment. Econ. Geol. 1999, 94, 1193–1211. [Google Scholar] [CrossRef]
- Gustafson, L.B.; Hunt, J.P. The porphyry copper deposit at El Salvador, Chile. Econ. Geol. 1975, 70, 857–912. [Google Scholar] [CrossRef]
- Arancibia, O.N.; Clark, A.H. Early magnetite-amphibole-plagioclase alteration-mineralization in the Island copper porphyry copper-gold-molybdenum deposit, British Columbia. Econ. Geol. 1996, 91, 402–438. [Google Scholar] [CrossRef]
- Gustafson, L.B.; Quiroga, G. Patterns of mineralization and alteration below the porphyry copper orebody at El Salvador, Chile. Econ. Geol. 1995, 90, 2–16. [Google Scholar] [CrossRef]
- Dilles, J.H.; Solomon, G.C.; Taylor, H.P.; Einaudi, M.T. Oxygen and hydrogen isotope characteristics of hydrothermal alteration at the Ann-Mason porphyry copper deposit, Yerington, Nevada. Econ. Geol. 1992, 87, 44–63. [Google Scholar] [CrossRef]
- Masterman, G.J.; Cooke, D.R.; Berry, R.F.; Walshe, J.L.; Lee, A.W.; Clark, A.H. Fluid Chemistry, Structural Setting, and Emplacement History of the Rosario Cu-Mo Porphyry and Cu-Ag-Au Epithermal Veins, Collahuasi District, Northern Chile. Econ. Geol. 2005, 100, 835–862. [Google Scholar] [CrossRef]
- Richards, J.P. The oxidation state, and sulfur and Cu contents of arc magmas: Implications for metallogeny. Lithos 2015, 233, 27–45. [Google Scholar] [CrossRef]
- Seedorff, E.; Barton, M.D.; Stavast, W.J.; Maher, D.J. Root zones of porphyry systems: Extending the porphyry model to depth. Econ. Geol. 2008, 103, 939–956. [Google Scholar] [CrossRef]
- Einaudi, M.T.; Hedenquist, J.W.; Inan, E.E. Sulfidation state of fluids in active and extinct hydrothermal systems: Transitions from porphyry to epithermal environments. Spec. Publ.-Soc. Econ. Geol. 2003, 10, 285–314. [Google Scholar]
- Liang, H.Y.; Sun, W.C.; Zartman, R.E. Porphyry copper-gold mineralization at Yulong, China, promoted by decreasing redox potential during magnetite alteration. Econ. Geol. 2009, 104, 587–596. [Google Scholar] [CrossRef]
- Kouzmanov, K.; Pokrovski, G.S. Hydrothermal controls on metal distribution in porphyry Cu (-Mo-Au) systems. Spec. Publ. Soc. Econ. Geol. 2012, 16, 573–618. [Google Scholar]
- Schmidt, C.; Watenphul, A.; Jahn, S.; Schäpan, I.; Scholten, L.; Newville, M.G.; Lanzirotti, A. Copper complexation and solubility in high-temperature hydrothermal fluids: A combined study by Raman, X-ray fluorescence, and X-ray absorption spectroscopies and ab initio molecular dynamics simulations. Chem. Geol. 2018, 494, 69–79. [Google Scholar] [CrossRef]
- Brimhall, G. Deep hypogene oxidation of porphyry copper potassium-silicate protore at Butte, Montana; a theoretical evaluation of the copper remobilization hypothesis. Econ. Geol. 1980, 75, 384–409. [Google Scholar] [CrossRef]


Disclaimer/Publisher’s Note: The statements, opinions and data contained in all publications are solely those of the individual author(s) and contributor(s) and not of MDPI and/or the editor(s). MDPI and/or the editor(s) disclaim responsibility for any injury to people or property resulting from any ideas, methods, instructions or products referred to in the content. |
© 2023 by the authors. Licensee MDPI, Basel, Switzerland. This article is an open access article distributed under the terms and conditions of the Creative Commons Attribution (CC BY) license (https://creativecommons.org/licenses/by/4.0/).