Article

Subduction and Hydrogen Release: The Case of Bolivian Altiplano

by
Isabelle Moretti
1,*,
Patrice Baby
2,
Paola Alvarez Zapata
3 and
Rosmar Villegas Mendoza
3
1
LFCR, UPPA, Avenue de l’Université, 64012 Pau, France
2
GET-UMR CNRS/IRD, University Paul Sabatier, Lima 15048, Miraflores, Peru
3
YPFB, Carretera Cochabamba, Santa Cruz, Bolivia
*
Author to whom correspondence should be addressed.
Geosciences 2023, 13(4), 109; https://doi.org/10.3390/geosciences13040109
Submission received: 21 February 2023 / Revised: 26 March 2023 / Accepted: 29 March 2023 / Published: 4 April 2023

Abstract

:
Natural hydrogen is known to be generated in the crust by water/rock interactions, especially the oxidation of iron-rich rock or radiolysis. However, other sources, especially deeper ones, exist. In the context of subduction, the dehydration of the slab, the destabilization of the NH4, and the hydration of the mantle wedge above the subducting lithosphere may generate H2. We present here a compilation of the known gases in the central part of the Pacific subduction and the results of a first field acquisition dedicated to H2 measurements in Bolivia between La Paz and South Lipez. Various zones have been studied: the emerging thrust faults of the western borders of the Eastern Cordillera, the Sajama area that corresponds to the western volcanic zone near the Chile border northward from the Uyuni Salar, and finally, the Altiplano-Puna Volcanic Complex in South Lipez. Soil gas measurement within and around the Salar itself was not fully conclusive. North of the Uyuni Salar, the gases are very rich in CO2, enriched in N2 and poor in H2. On the opposite, southward, all the samples contain some H2; the major gas is nitrogen, which may overpass 90% after air correction, and the CO2 content is very limited. On the western border of the Cordillera, the δC13 isotope varies between −5 and −13‰, and it is not surprisingly compatible with volcanic gas, as well as with asthenospheric CO2. The methane content is close to 0, and only a few points reach 1%. The isotopes (−1‰) indicate an abiotic origin, and it is thus related to deep H2 presence. The high steam flow in the geothermal area of South Lipez combined with the H2 content in the water results in at least 1 ton of H2 currently released per day from each well and may deserve an evaluation of its economic value. The nitrogen content, as in other subduction or paleo-subduction areas, questions the slab alteration.

1. Introduction

1.1. Natural H2 Role and Presence

In order to decrease greenhouse gas emissions, especially CO2, many countries are aiming for a new energy mix that includes dihydrogen (H2) as a fuel. Hydrogen could be manufactured, but natural hydrogen is potentially a cheaper and cleaner alternative [1,2,3]. After the discovery of H2 in Mali [4], exploration is now active in various countries such as Australia [5,6,7] or the USA [8]. The geological contexts favorable to H2 generation are numerous, but the accumulation conditions remain poorly constrained. Mantle wedge hydration above the subducting plates is one of the contexts where H2 generation is expected [9], and in fact, H2 has been reported above subduction, or paleo-subduction, zones in Oman, New Caledonia, and the Philippines, among other locations. However, many authors working on the evolution of the mantle wedge during subduction focused on methane (CH4) generation and C and H2O cycles. Surprisingly, H2 is often only mentioned as an intermediary to generate abiotic CH4 [10]. Since, as a fuel, H2 now looks more desirable than CH4, we will focus on this gas.
Various research groups are working on defining a proxy to speed up the H2 exploration, but data are still missing in numerous areas since H2 is not systematically measured in gases, whether in emanations or in subsurface. Revisiting existing data is the mandatory first step, and large syntheses have been published [11,12]. For the Andes, there are some data acquired by various teams that were not especially interested in H2 as resources but confirmed that some H2 is leaking in the Andes (Figure 1a). Helium has also been studied (Figure 1b), and the 3He/4He ratio shows that the 3He content, i.e., the He uprising from the mantle, is very large in Bolivia. This attests that deep gases are migrating toward the overriding plate surface above the subduction. The 3He content remains up to 18% in Peru above the flat slab segment of the subduction [13]. When it comes to resources and not just presence, acquiring new data is the next key step to know if an area is prospective.
Through this paper, we will share the data of the first fieldwork dedicated to H2 detection in the Bolivian Altiplano. After a resume of the geological context where H2 is generated and a presentation of the Altiplano geological setting, the data will be presented, as well as the journey to a more exhaustive understanding of the H2 system in the described area. Other authors [14,15] worked in western South Lipez to understand, for instance, the lake carbonate deposits (Laguna Pastos Grandes) or, more generally, the hot springs that are numerous on the Altiplano [16]. Their data will be incorporated in the final discussion as well as the results of the wells drilled by YPFB. Our new dataset contains analyses of gases from the bubbling springs but also in situ analyses of the soil gas using data that were not previously available.
Figure 1. (a) Compilation of known H2 leakages at the scale of the Andes. The highest values reach 5% in Chile. Co—Chanco, F—fumaroles, B—bubbling pool. (b) Helium isotopy along the Andes showing the importance of the mantellic gases and the difference between the flat slab area and the dipping slab area (modified from [17]). The highest values are between 20 and 25° S.
Geosciences 13 00109 g001

1.2. Prospective Geological Settings for H2 Production

The various reactions that lead to the generation of free H2 have now been largely published and commented on. Syntheses and complete bibliographies can be found in [6,18,19]. There are different ways to present the reactions: depending on the H2 origin (water, hydrocarbon, H2S, NH4, mantellic gas.) or depending on the way to liberate the H2 as a free gas phase (oxidation, radiolysis, pyrolysis, degassing). Some authors have a longer list of origins, but it seems to us that it is mainly due to the lack of a synthetic view in these early years of the understanding of H2 systems. H2 could be generated by
(1)
Water reduction, which is usually linked to iron-rich rock oxidation. Olivine serpentinization is the most studied reaction of this type but not the only one.
(2)
Late maturation of OM, especially coal.
(3)
Water radiolysis in the presence of radiogenic rock.
(4)
Others: NH3, H2S destabilization, mechanoradical, degassing of the primordial mantle.
In terms of geological contexts, H2 emanations, or accumulations, have already been found in:
(1)
The Mid-Oceanic Ridge (basalt alteration and serpentinization);
(2)
Ophiolitic nappes;
(3)
Archean and Neoproterozoique cratons (iron-rich rock, such as BIF, oxidation and radiolysis);
(4)
Volcanic areas.
In addition, the surroundings of granite intrusions, uranium mines, or other radiogenic rocks are also potentially prospective. Usually, when the data allow for a careful study, the conclusions indicate more than one source. In Tuscany, for example, which is both a back-arc system affected by granitic intrusion and a stack of ophiolitic nappes, all these elements play a role in the presence of H2 at the surface [20].
All along the Andes, the Pacific Plate has been continuously subducting below the Nazca Plate since the Mesozoic. Non-HC gases have been reported (CO2, N2, H2, He… see Figure 1 for He and H2), so one may wonder if the H2 quantity is large enough to allow exploitation. As for any natural resources, volumes and/or flows are key data to collect in order to classify a deposit as exploitable or not. Concerning H2, it is still unclear if the reservoirs that will allow major production are working as within the HC system, i.e., with a seal able to prevent leakage, or major leakage, for millions of years [21]. Alternatively, the reservoirs will be just a buffer where a temporary accumulation is present. This hypothesis has been proposed for the Mali case since the reservoir is small but apparently continuously refilled by an H2 flow coming from deeper levels [22]. Today, we do not know if this shallow reservoir is recharged by a deeper and larger one and/or if it is directly connected to an H2-producing zone. Similarly, in Kansas, the H2 content in some of the wells that found it happened to be highly variable and, after an initial rapid decrease (from the initial 91%), increased again a couple of years later [23,24]. This suggests a recharge of the reservoir at the human timescale, and so the classical characteristics of reservoir size, porosity, net to gross, etc., may not be crucial points for H2 production design.
Experience in managing H2 reservoirs is obviously still missing, but the analogues should perhaps rather be sought in the field of geothermal energy. In that context, hot steam is continuously generated by the water–rock interactions, and the limiting factor is the volume/day that could be produced, not the final volume. Continuous water infiltration allows recharge. Hydrogen content has been found in various hydrothermal areas: in Iceland, where the Mid Atlantic Ridge outcrops due to the presence of a hot spot [25], in the northern part of the East African Rift, where the Gulf of Aden ridge extends onshore [26], and in the Larderello area [20]. In those cases, hydrogen could be a coproduct of the geothermal activity. In Bolivia, high-temperature geothermal zones are present in the southern part of the Altiplano, so our focus will be on this region.

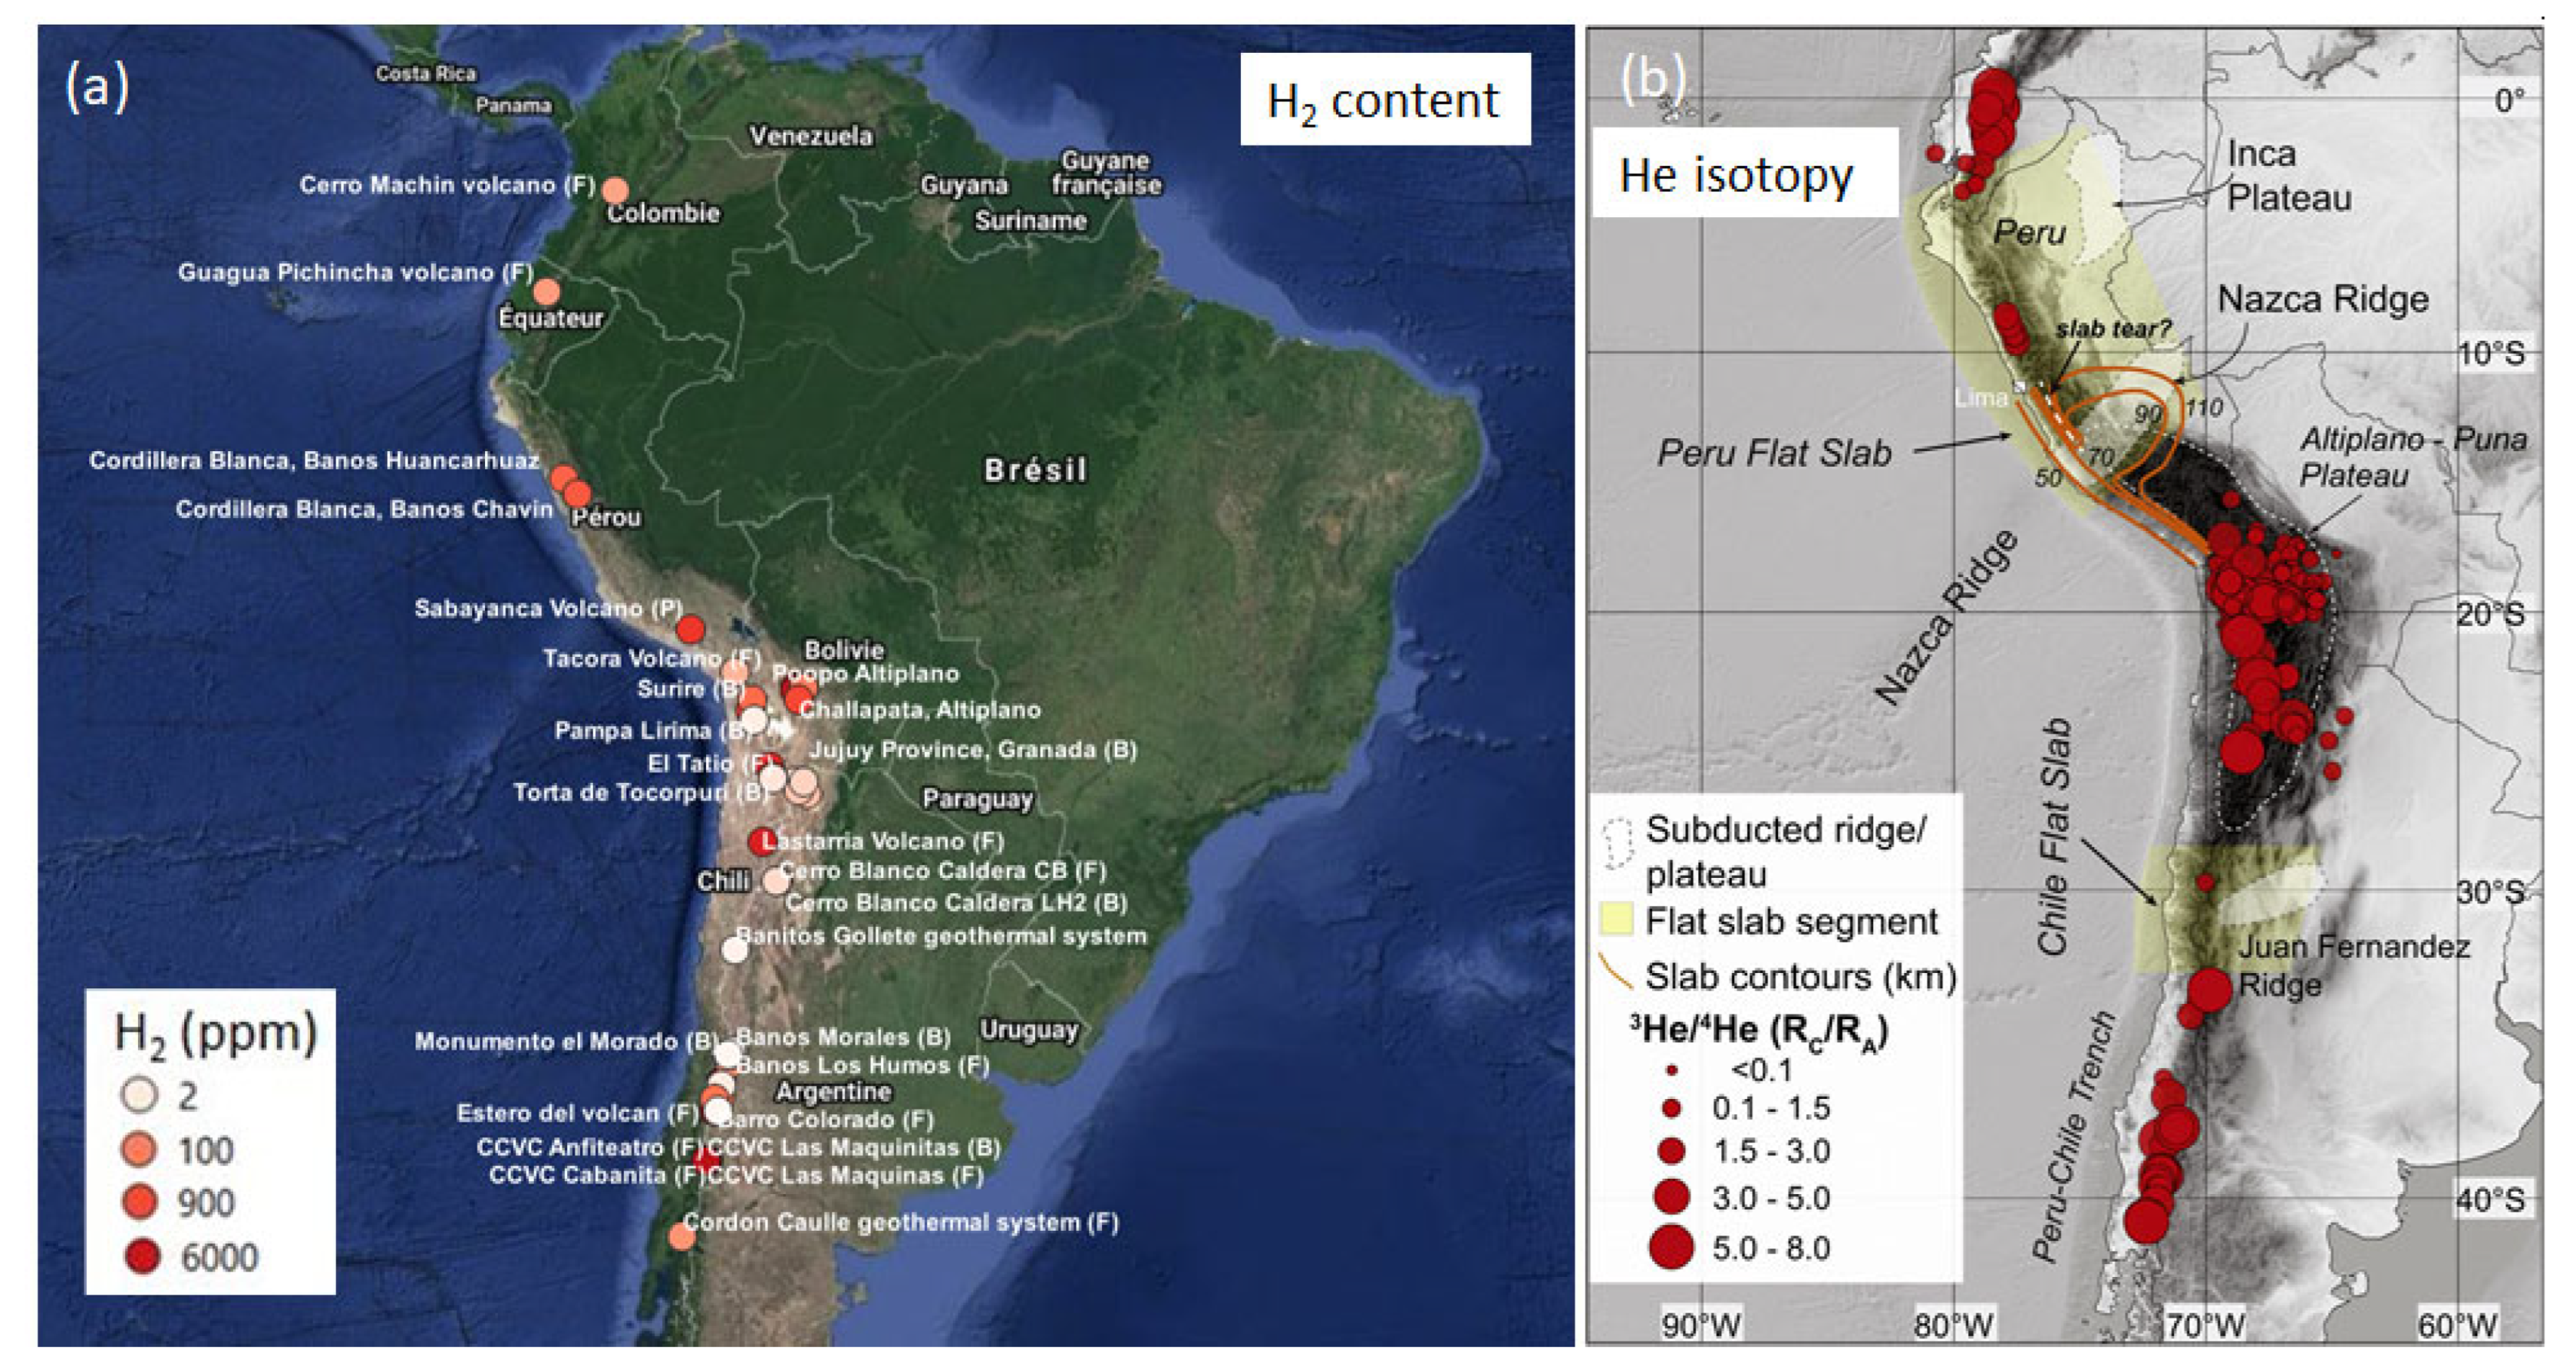
1.3. H2 in Subduction Context

Hydration of the oceanic lithosphere, especially the mantellic part, generates hydrogen in the Mid-Oceanic Ridge [27,28] but also later when the oceanic lithosphere is involved in obduction and thrusting [9,29]. As already stated, H2 has been reported in subduction zones such as New Caledonia, Oman, and the Philippines [9] when other authors also noted the presence of abiotic methane whose formation also first required hydrogen generation [10]. In all these cases, the H2 may be generated in the overriding plate, where sometimes peridotites are present, as well as in the subducting plate or paleo-subducting plate. Another potential origin is the mantellic wedge between the two lithospheres, which could be hydrated by the water expelled from the subducting plate [30]. In the overriding plate, the water required to generate the H2 may come from precipitation (or seawater). In the subducting plate, the water is the connate water present initially in the upper crust (Figure 2); this water is rapidly consumed and integrated into altered material. At a deeper level, within a context of higher temperatures and higher pressures, the hydrated rocks suffer a new process of dehydration, and the upward water flow induces the hydration of the mantle wedge [31].
This water incorporation in the mantle wedge between the slab and the overriding plate in the subduction zone has been largely studied in order to understand the weakening of the mantle, its melting, and the back-arc opening [31,34]. Globally, the serpentinization takes place at 3 levels (Figure 2): a shallow one within the slab when its temperature increases due to the increasing depth, then at an intermediary depth, around 50 km, at the contact between the slab and the overriding lithospheric mantle in the fore-arc. At the deepest level, and so at higher temperatures, the hydrated elements of the subducting oceanic crust will interact with the overriding asthenosphere in the back-arc position. A melting front develops where percolating hydrous fluid encounters mantle material hot enough to melt [34]. As illustrated in Figure 2, the mantle wedge is indeed much warmer than the subducting lithosphere, and the hydrated facies are unstable when the temperature surpass about 1000 °C or even around 700 °C if we refer to the antigorite stability [35].
There are a large number of publications and thermomechanical modeling dealing with the roles of CO2 and H2O within slab evolution. However, the possibility for the deep processes to result in economic resources has been poorly, if at all, studied. The best-studied areas related to hydrogen in the subduction context, Oman and New Caledonia, show the presence of H2, but in those cases, obduction is taking place, and the late serpentinization of the ophiolites is proposed as the main process, with the water being rain water. The full system is, however, more complex. The presence of N2 and the gas seepage content variations (N2/CH4/H2) across a cross-section in New Caledonia suggest that more than one source is active and that the main one varies across the area. The role of the mantellic wedge within H2 generation was proposed by [30] and in part confirmed in the Pyrenean case [36]. In this double vergence chain, H2 has been found in the two forelands and along the thrust faults that border the reliefs [37]. The existence of a mantle wedge rather near the surface is proven by the seismic data, and the presence of a seismic swarm on the upper part of this wedge suggests ongoing serpentinization. The hydration process of the olivine, which allows the serpentinization, results in a decrease in density and an increase in volume [38] and so likely causes the recorded microseismicity.
Active subductions usually involve a rather old oceanic lithosphere plunging below a continental one, as along the Andes; however, other settings may exist: oceanic/oceanic, and even as in Oman and New Caledonia, a continental lithosphere plunging below an oceanic one [30,39]. In that case, the subduction ends quickly and is blocked, and obduction takes place. The serpentinization, and so the H2 generation, may, however, continue within the crust as within the hydrated mantle wedge.
As already stated, in this paper, we focus on the central Andes, where an oceanic lithosphere is plunging below a continent, and we study the gas emanations in Bolivia that correspond to the back-arc position in the section of Figure 2. The initial data compilation has already confirmed that H2 is present in the fore-arc zone (Figure 1), even though the data are still scarce.

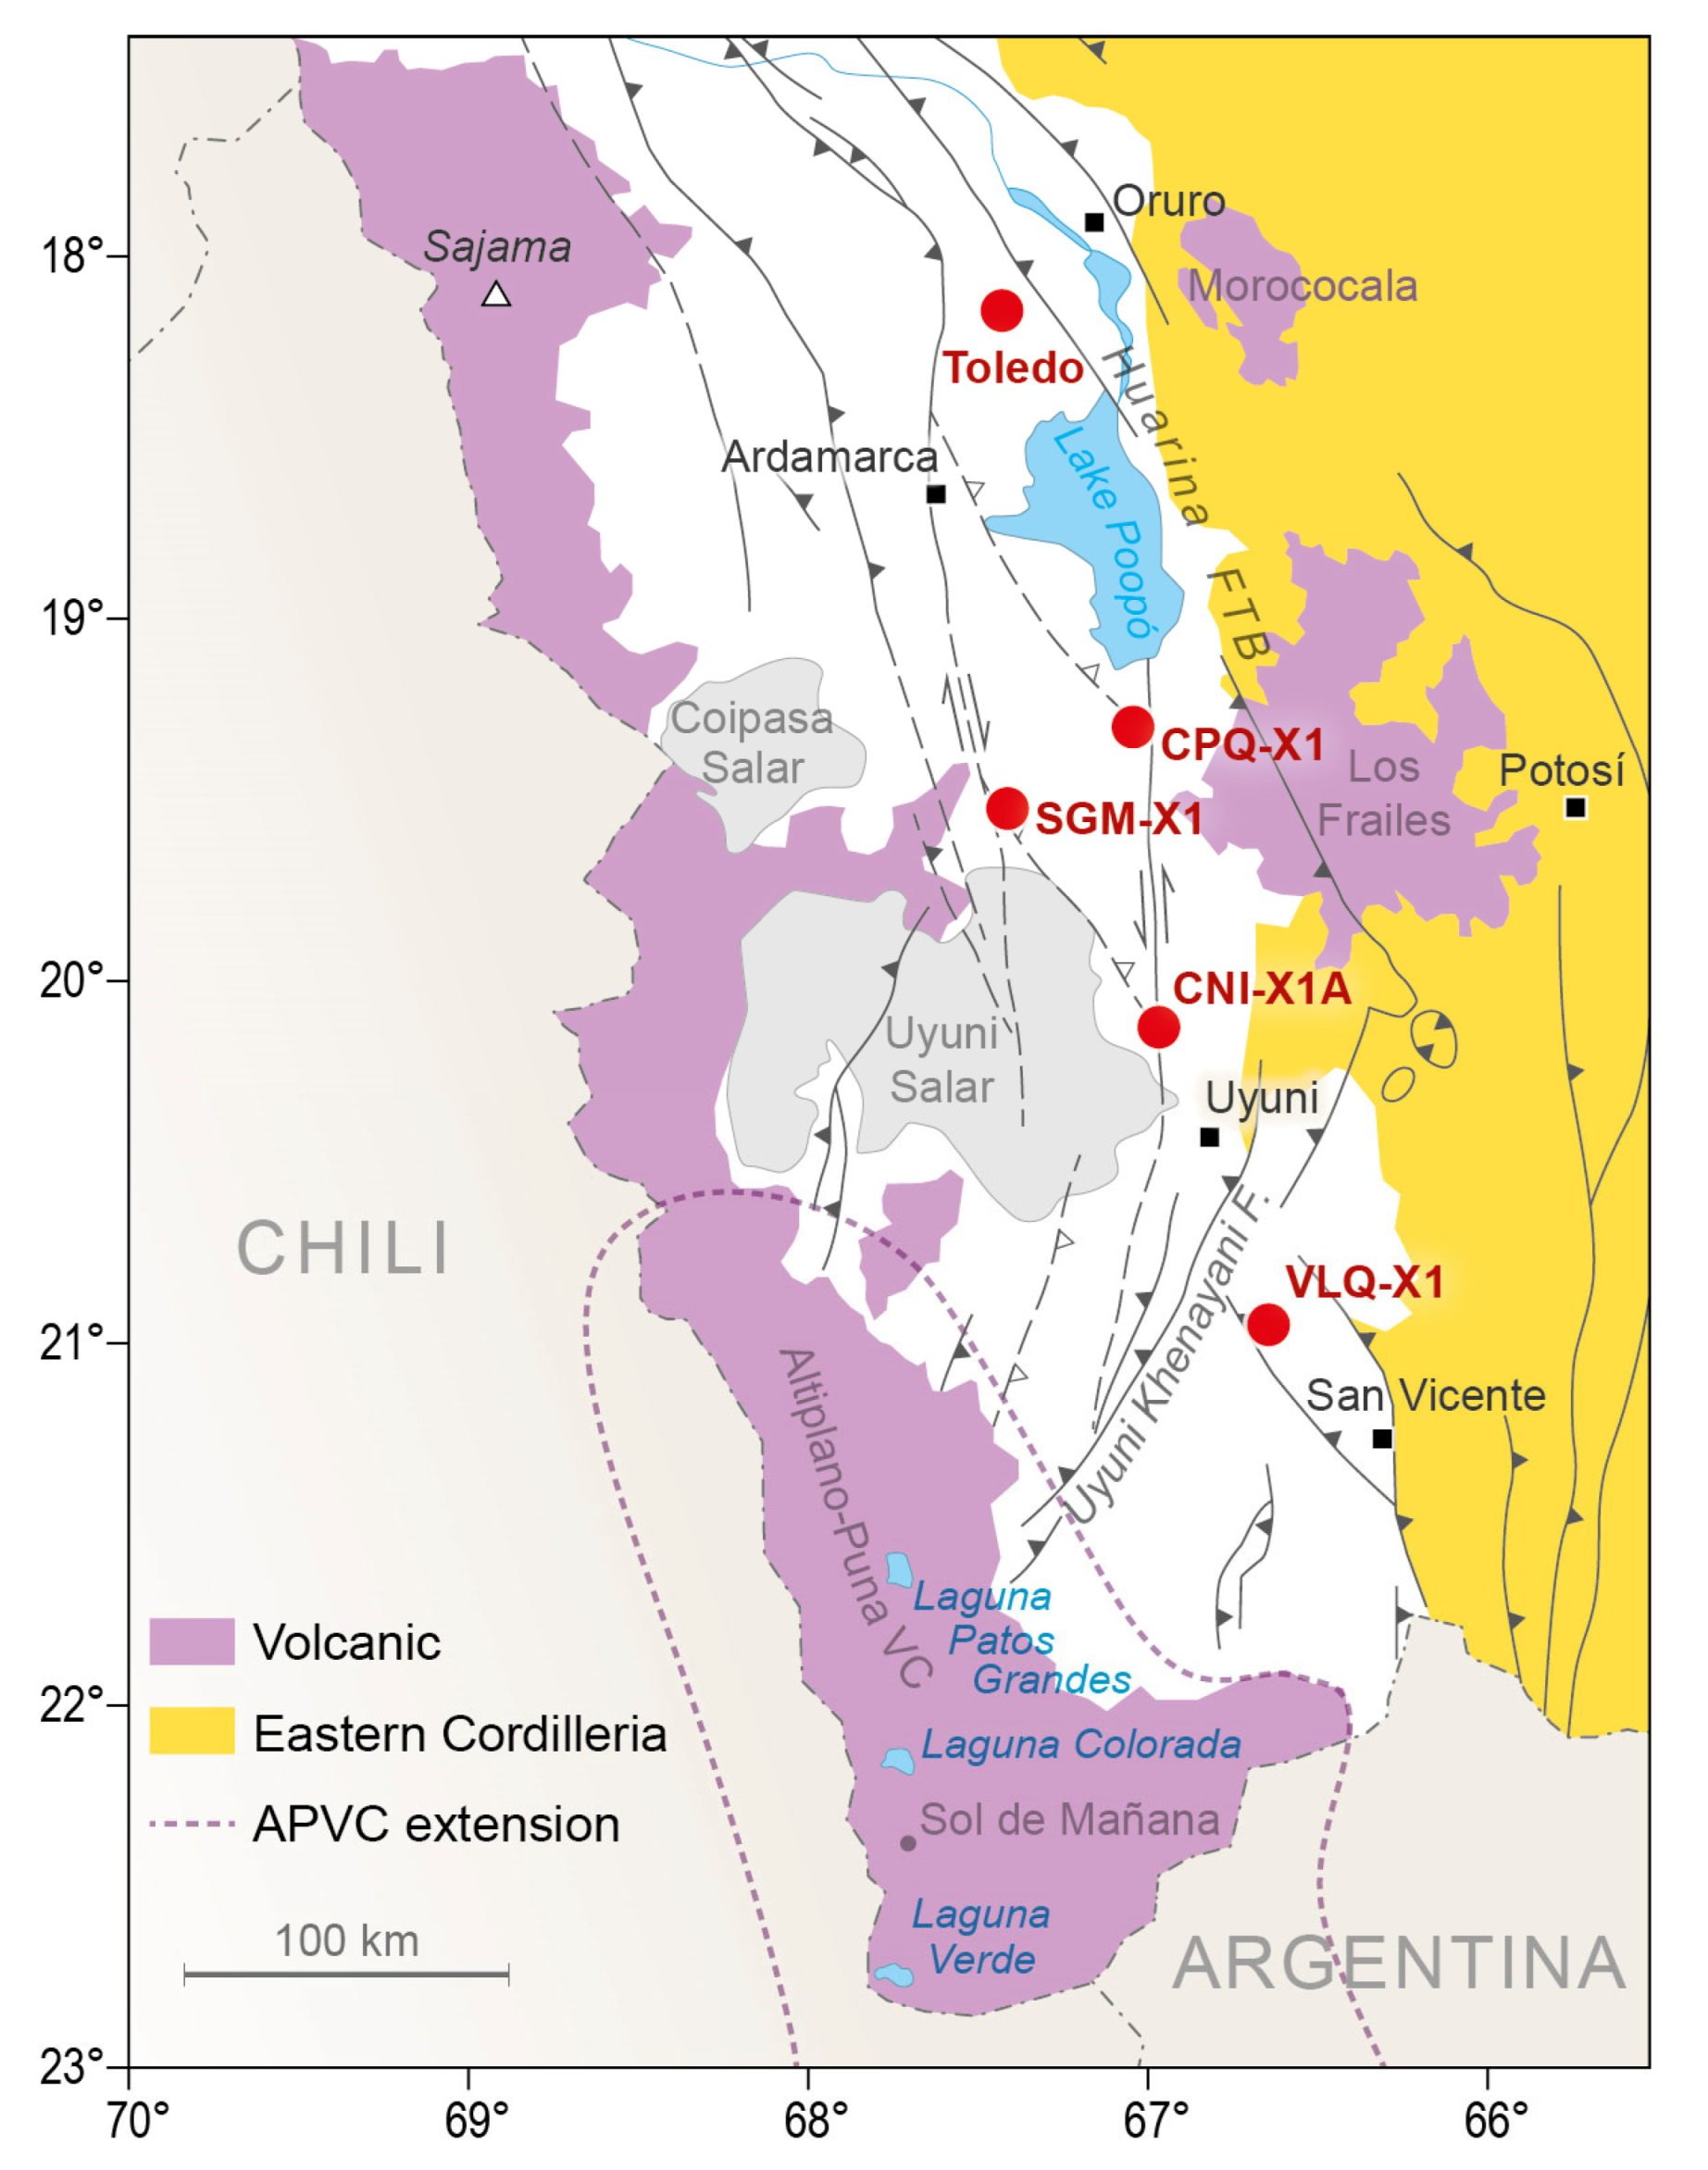
2. Geological Setting

The Andes developed on the western edge of the South American continent during the Mesozoic–Cenozoic Pacific lithosphere subduction. Between lat. 15° S and 23° S (Central Andes), they are characterized by the Bolivian Orocline (elbow-shaped mountain range), high relief (several summits above 6000 m), and the Altiplano high plateau basin. This enigmatic intermontane plateau basin has an average altitude of 3650 m a.s.l. and overlies a thick crust (60–65 km) and an anomalous thin and heterogeneous mantle lithosphere, leaving the place in some regions to a mantle asthenosphere wedge (Figure 2). The Altiplano basin formed between the Western Cordillera magmatic arc and the Eastern Cordillera fold and thrust belt beginning in the late Oligocene. Paleoelevation studies based on multiple proxies show that a rapid uplift of the Altiplano occurred in the late Miocene [40]. This uplift is synchronous with the Sub-Andean Zone’s eastward propagation and a major increase in the crustal shortening [32]. It also corresponds to an intense period of back-arc volcanism (10 to 1 Ma), with eruptions of large volumes of ignimbrites [41] concentered in the southern Altiplano (Altiplano-Puna Volcanic Complex) and the western border of the Eastern Cordillera (Los Frailes Volcanic Complex, Morococala Volcanic Complex, see Figure 3). Deep seismic data [42] show that these ignimbrites are located above areas of thin lithosphere [43].
Most authors agree that crustal shortening alone cannot explain the uplift of the Altiplano high plateau basin. On the basis of the deep seismic data and the presence of the late Miocene–Pliocene anomalous back-arc volcanism, they suggest that the Altiplano uplift is mainly related to an orogen-wide lithosphere thinning, whose mechanism, related to the abnormal hot mantle, is still under debate [43,44,45,46,47].
In Bolivia, the Altiplano basin is characterized by a thick Cenozoic synorogenic continental filling (4–10 km) deformed by north-south-elongated partially inverted half grabens and by the west-vergent thrust system of the Eastern Cordillera fold and thrust belt [33,48]. The Altiplano compressive structures have been partially explored by YPFB and are imaged by seismic reflection and reached by some wells, such as the Salinas de Garcia Mendoza, Colchani, and Vilque wells considered in this study (Figure 3). The west-verging thrust system of the Eastern Cordillera, the so-called Huarina fold and thrust belt, involved Paleozoic and Mesozoic series and controlled the deformation and sedimentation of the Neogene synorogenic deposits of the Altiplano. It has been active at least since the late Oligocene. During the late Miocene and Pliocene, voluminous ignimbrites (Los Frailes Volcanic Complex, Morococala Volcanic Complex) were generated along the Huarina fold and thrust belt [43,49]. The mean tin-producing province of Bolivia is located in the Huarina fold and thrust belt near the Morococala Volcanic Complex, and tin mineralization is genetically related to lower Miocene magmatism [49]. In the South Lipez region (south of 21° S latitude), the Altiplano is formed by the Altiplano-Puna Volcanic Complex, a major magmatic province, which produced eruptions of large-volume ignimbrites during the last 10 Ma [41,50].

3. Gas Emanations, Oil Seeps, and Deep Wells in the Altiplano

3.1. HC Seeps

Oil seeps or gas seeps are proxies for exploration in the oil and gas (O&G) industry, as in this case study, it seems reasonable to start the H2 exploration with a basin-scale study of the H2 surface emanations. Potentially, surface or near-surface acquisition and monitoring will also help to better define the transport mode of the H2 in the subsurface [51].
Oil seeps were found mainly in the Central (Uyuni Salar) and Southern Altiplano, along the Uyuni-Khenayani fault system (Figure 3). In this area, the presence of Late Cretaceous source rock such as the El Molino Fm is recognized. The current TOC is rather low, as it does not exceed 2.2%, but for all the samples being mature (Tmax > 440 °C), the initial one was larger [51]. The Permian and Carboniferous, present in the North around Lake Titicaca, do not extend southward.

3.2. Deep Wells

In the Altiplano region, O&G exploration studies were carried out led by YPFB, the Bolivian national oil company. The expected main source rock was Late Cretaceous (Maastrichtian) from the former back-arc system [51], whereas the petroleum system is mainly Paleozoic in the prolific Sub-Andean Zone [52,53]. Early Silurian and Ordovician have been reached below the Mesozoic in the drilled wells, and so an early Paleozoic source rock cannot be precluded. Eight exploratory wells were drilled between the 1970s and 1990s, none of them with proven HC reserves, and the main results are as follows:
  • Vilque-X1 was drilled by YPFB in 1972, initially as a stratigraphic well. Below about 3000 m of Tertiary, 108 m of Late Cretaceous (El Molino Fm.) was found that directly overlie the early Silurian. In the Eocene-Oligocene Potoco Fm and El Molino Fm, small amounts of C1 + C2 were detected when the major gas was nitrogen in the contact between the Potoco Fm and a saline body at 782 m. The well was completed in the undifferentiated Ordovician at TD 3559.5 mbbp. Methane was detected [54], but the well was abandoned as dry since the flow was low (1.4–1.9 mmcf/day in the tested interval below the salt of the San Vicente Formation (Miocene) and because the gas was at 80% nitrogen [55].
  • Copaquila-X1 was drilled by YPFB in 1973 south of the Poopó Lake on a surface structure. A 600 m thick Cretaceous sequence of sands and shales was drilled before reaching a very thick salt diapir (up to 2900 m). The well was rated dry and abandoned at TD 4065 mbbp. At about 800 m, gas traces of H2 (2.5%) and CH4 (1%), as well as apparently N2, were detected [56].
  • Salinas de Garcia Mendoza was drilled by YPFB in 1975. The targeted structure was an anticline, but the well did not confirm any reservoir or HC indices. The Tambillo Basalt was found at 2015 m, and the well was abandoned at 2641 m depth, still in the Miocene.
  • Toledo-X1 was drilled by Exxon in 1995. Upper Paleogene sediments were found at the top of Palaeozoic rocks. The targets were Oligocene and Cretaceous (El Molino unit). The well was classified dry and abandoned in the upper Ordovician with TD 3974.8 mbbp without finding hydrocarbon manifestations. A wireline formation test in the Upper Miocene recovered gas having a composition of over 89% nitrogen and 10.3% CH4. The δ13C of the CH4 was −36‰, which is compatible with a thermogenic gas. Surprisingly the initial report also mentions a drill stem test, which should have recovered mainly CO2 with traces of CH4, H2S and N2 [57], though the depth of this DST is not indicated.
  • Colchani-X1A was drilled by YPFB in 1995. It is located near Uyuni, and the targeted structure was an anticline [51]. It was abandoned at a depth of 2636.3 mbbp in the Silurian and classified as dry, although it showed the existence of traces of hydrocarbons (C1 and C2) in Cenozoic and Cretaceous rocks. A first well, Colchani-X1, detected H2S from 12 m and, for this reason, was rapidly sealed.
To summarize, although oil and gas seeps exist in the Altiplano, as well as structures due to the ongoing compression, none of these wells proved an economic accumulation of HC. The majority demonstrated large proportions, and sometimes potentially large quantities considering their structure size, of N2. H2 has only been reported in the Copaquila well.

4. Methods

Two methods were used to analyze the gases bubbling in the water sources and the gases present in the soil and the fumaroles: direct measurements on the field with a GA5000 and, later, in the laboratory, GC analyses for sampled gases. The GA5000 is a gas analyzer that may detect the gases present in the fumaroles and in the soil; it has an integrated pump. The one we used measures 6 gases: CH4, CO2, and O2 in % and H2, H2S, and CO in ppm. The GA installation protocol for soil and fumaroles can be found in more detail in [26]. A one-meter-long tube, perforated at its end, was installed in the soil to pump the air present in its porosity when there was no bubbling or fumaroles.
The accuracy of the GA5000 is good, around 1ppm, and our own tests in the laboratory with a known gas have always been conclusive. However, we have to note that the weather in the southern part of the Bolivian Altiplano, the South Lipez, is rather extreme. The day we went in the south, between Laguna Colorada and Laguna Verde (see Figure 3), the external temperature was below −15 °C, and the fumaroles were over 80 °C; it is unknown to us if these unusual temperatures may affect the cells. The company, Geotech, considers that these low temperatures will not affect the measure accuracy, and indeed, the data found in the laboratory was on the same order of magnitude. Our experience is that the H2 content in the fumaroles [20,26] or in the soil [22,58,59] are variable with time, and so the values have to be considered as a range of values and cannot be taken as constant. For the soil gas content, months of monitoring are required to obtain average representative values [22,58].
When the gas flow was large enough, several samples were collected in exetainers for further gas analysis. The sampling was systematically triplicated. Classical gas chromatograph (GC) analyses were carried out at Isolab (Holland), and a plasma GC was used for a better characterization of hydrogen. The Isolab GC has a minimum threshold of 300 ppm for the H2, while the plasma GC has a 1 ppm minimum. However, it only measures H2, while the classical GC measures CO2, CH4, C2H6, and O2.
When possible, isotopes (δ13C) have been obtained for CH4 and CO2. However, due to the small sample quantity, it was impossible to realize a full set of isotope measurements. The majority of the values that will be discussed later on are issued from the literature.

5. Data Recollection

The exact position of the sampling and the GA5000 dataset, can be found in the Supplementary Materials.

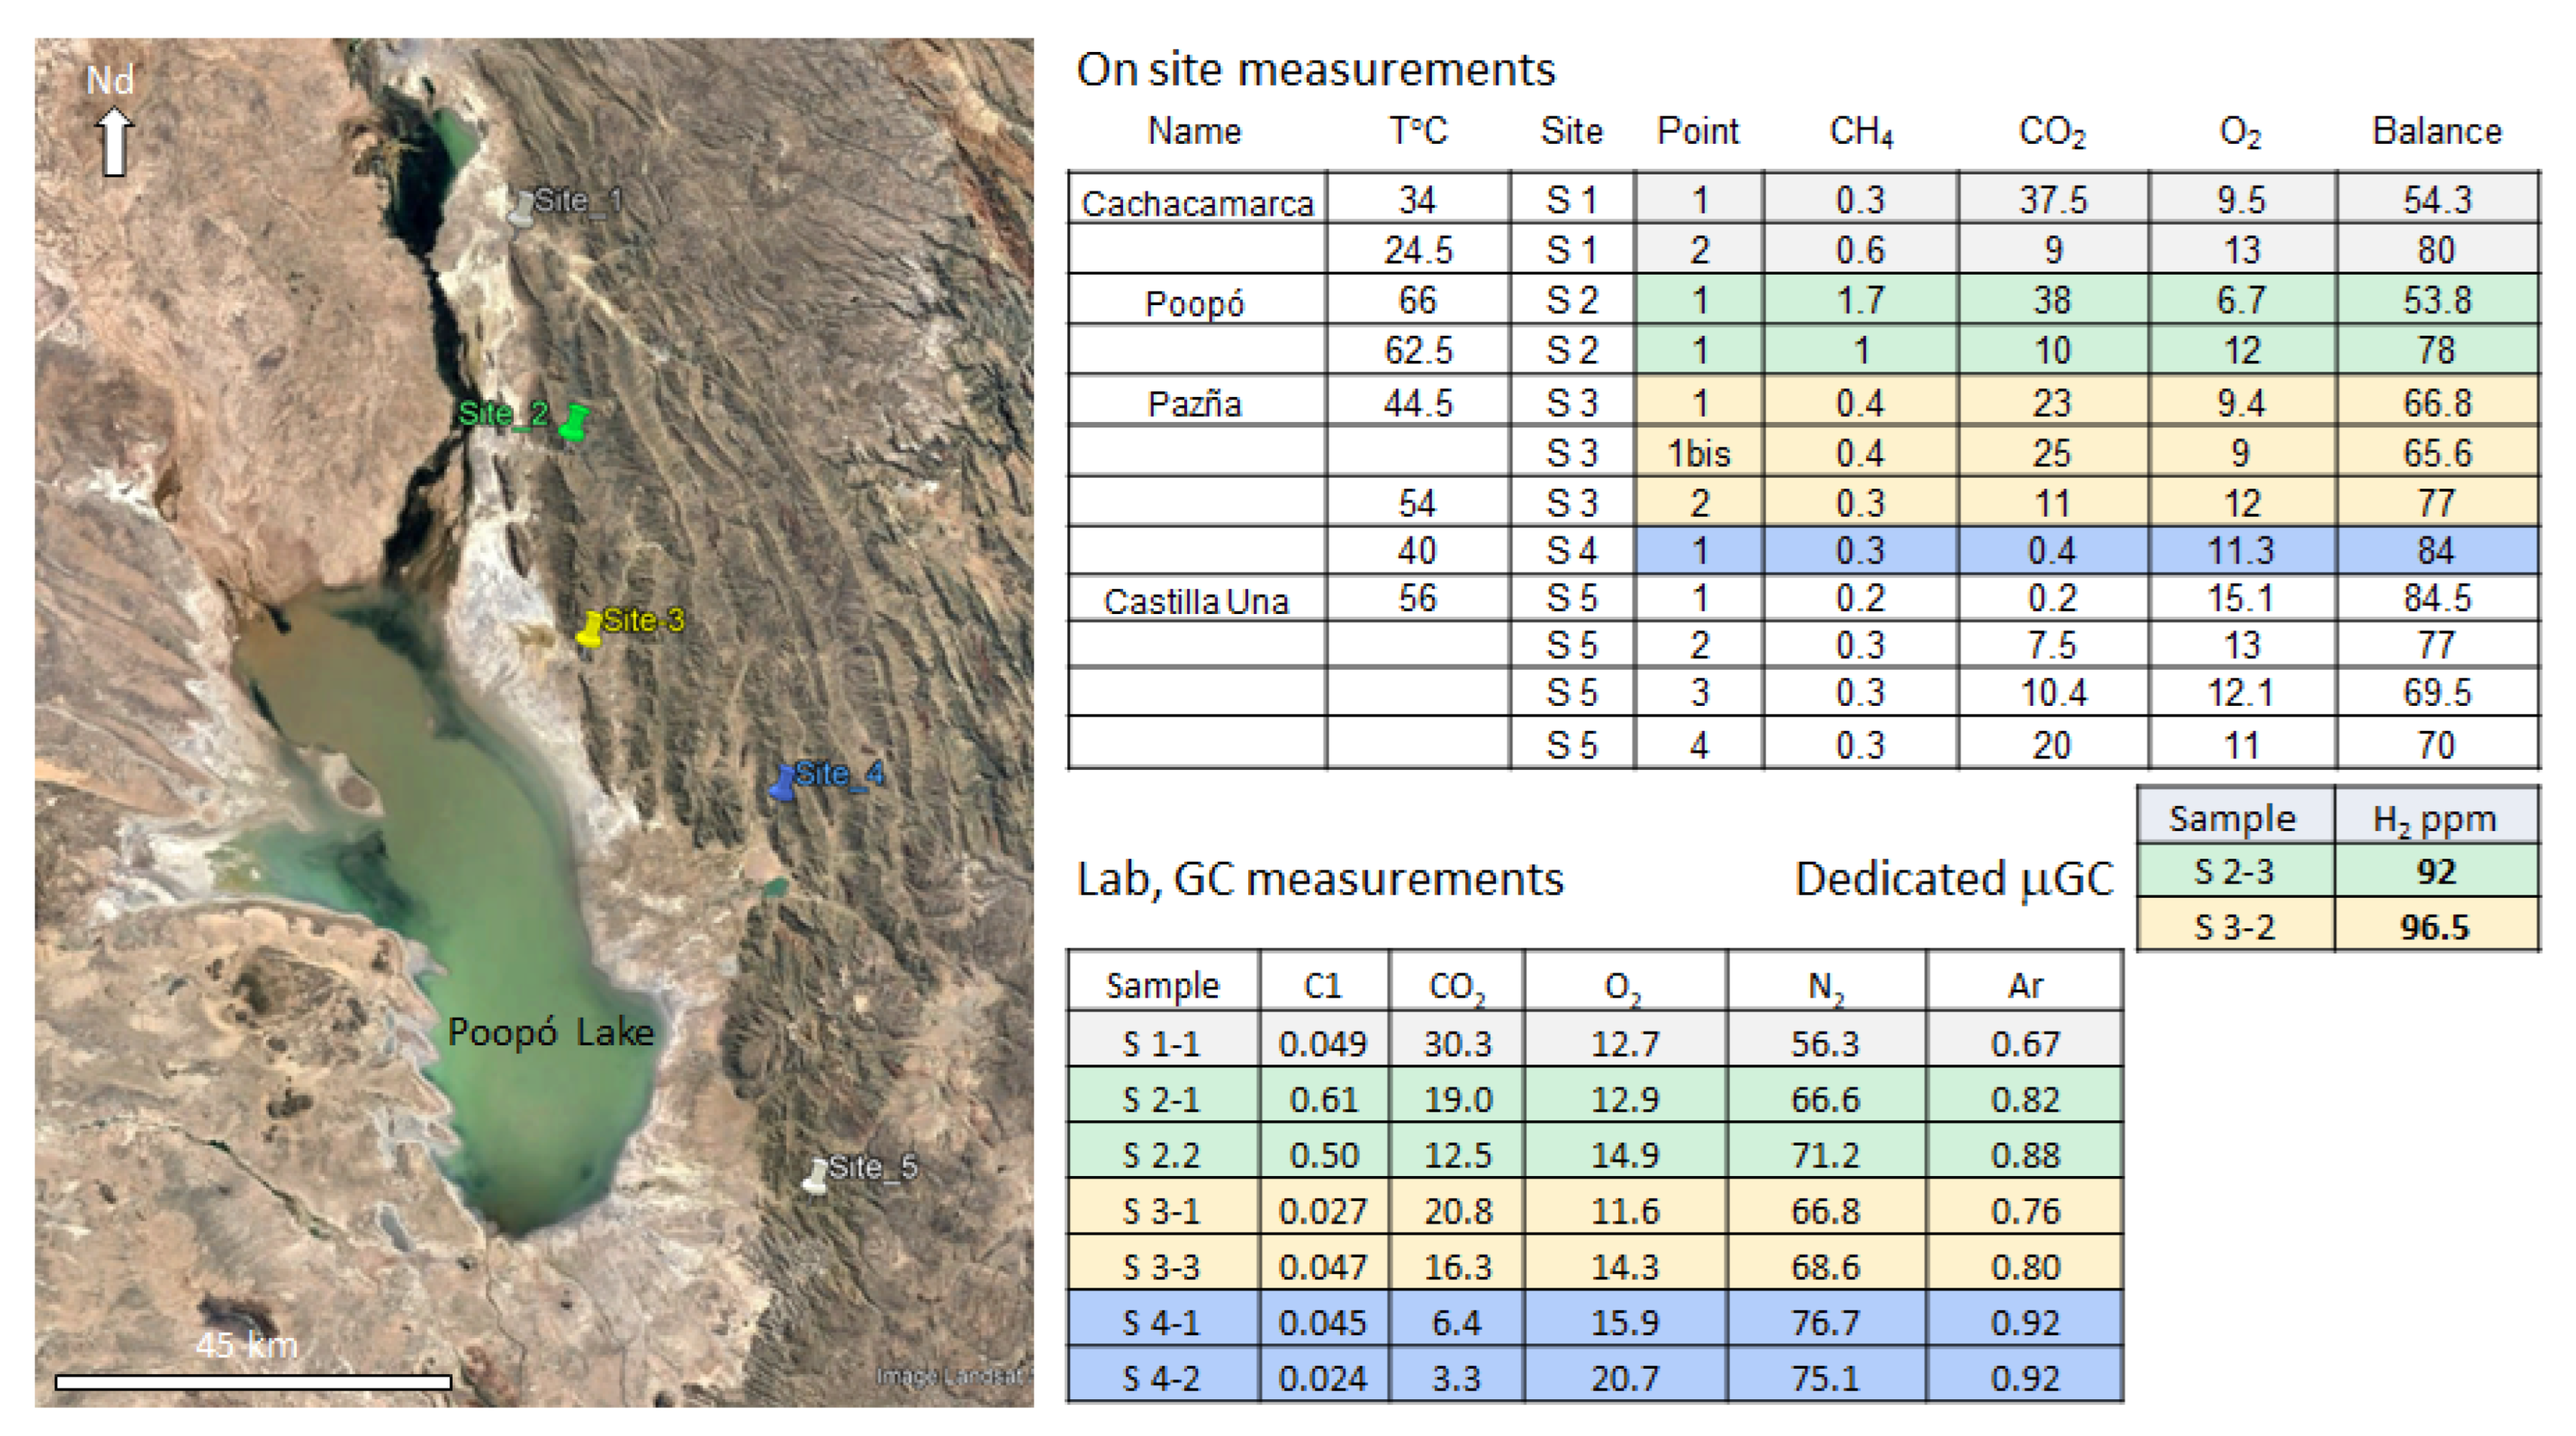
5.1. Gas in the Huarina Fold and Thrust Belt of the Eastern Cordillera (Oruro-Uyuni)

The first studied site (Site 1 Figure 4) is located near the Morococala Volcanic Complex. The area with hot water sources is about 12,000 m2 large. It is located below a tin mine and along a small transfer zone between two N 170°, east-dipping thrusts that correspond to the last emerging ones of the Eastern Cordillera. Various pools allow the inhabitants to take baths and/or wash clothes. The temperatures ranged from 24 to 34 °C depending on the pools when we measured them (23 June 2022). Bubbling is active. The gas content is about 1/3 of CO2 and is low in methane and hydrogen.
The other sites, Poopó (Site 2) and Pazña (Site 3), are located in similar structural contexts along the border faults (Figure 4). Often, the water flow is high, and the temperatures range from 44 to 66 °C. In many villages, to enjoy it, the surrounding areas have been converted into swimming pools and spas. The initial sources are usually still accessible behind the buildings, which is where we carried out our measurements and sampling. In the Poopó village (site 2 Figure 4), there are many swimming pools, and hot water leaks everywhere. Along the river, at 2 km eastward of the village, the sources are also numerous; the temperature was 66 °C, and the whole river was hot. This was where we sampled the gas, which was bubbling in many places. Site 4 is also on a fault zone, but a few kilometers eastward in the Cordillera, the temperature of the bubbling source is around 40 °C, and the hot water is also used for recreative purposes even if the place, named Malliri, is rather remote. Site 5 is a strongly bubbling source, a little bit warmer at 56 °C, and with water that is also used for a public swimming pool. The place is known as Castilla Una, and the water also leaks along an N140° inverse fault.
The data from the GA in the field or in the laboratory from the samples all show a mixture of N2 and CO2 in variable proportions, and the methane content is always low. At Sites 2 and 3, the H2 content was around 100 ppm.

5.2. Around the Salar (Altiplano Basin)

Various measurements were carried out around Uyuni Salar (see the location in Figure 3) in the Altiplano plateau basin where some thrusts related to the Huarina FTB are still present. We also sampled the soil near the Colchani well heads (the two wells were very close) and in the area where the Salinas de Garcia Mendosa well had been drilled. We found no trace of this well drilled almost 50 years ago. The soil gas was mainly air enriched in N2 (with about 15% O2), except near the Colchani well, where CO2 was found (about 25%). The CH4 remained low, around 0.2% from the GA5000 (Table 1). There is no fumarole nor gas bubbling source in this area, so gas sampling of these sources was not carried out.

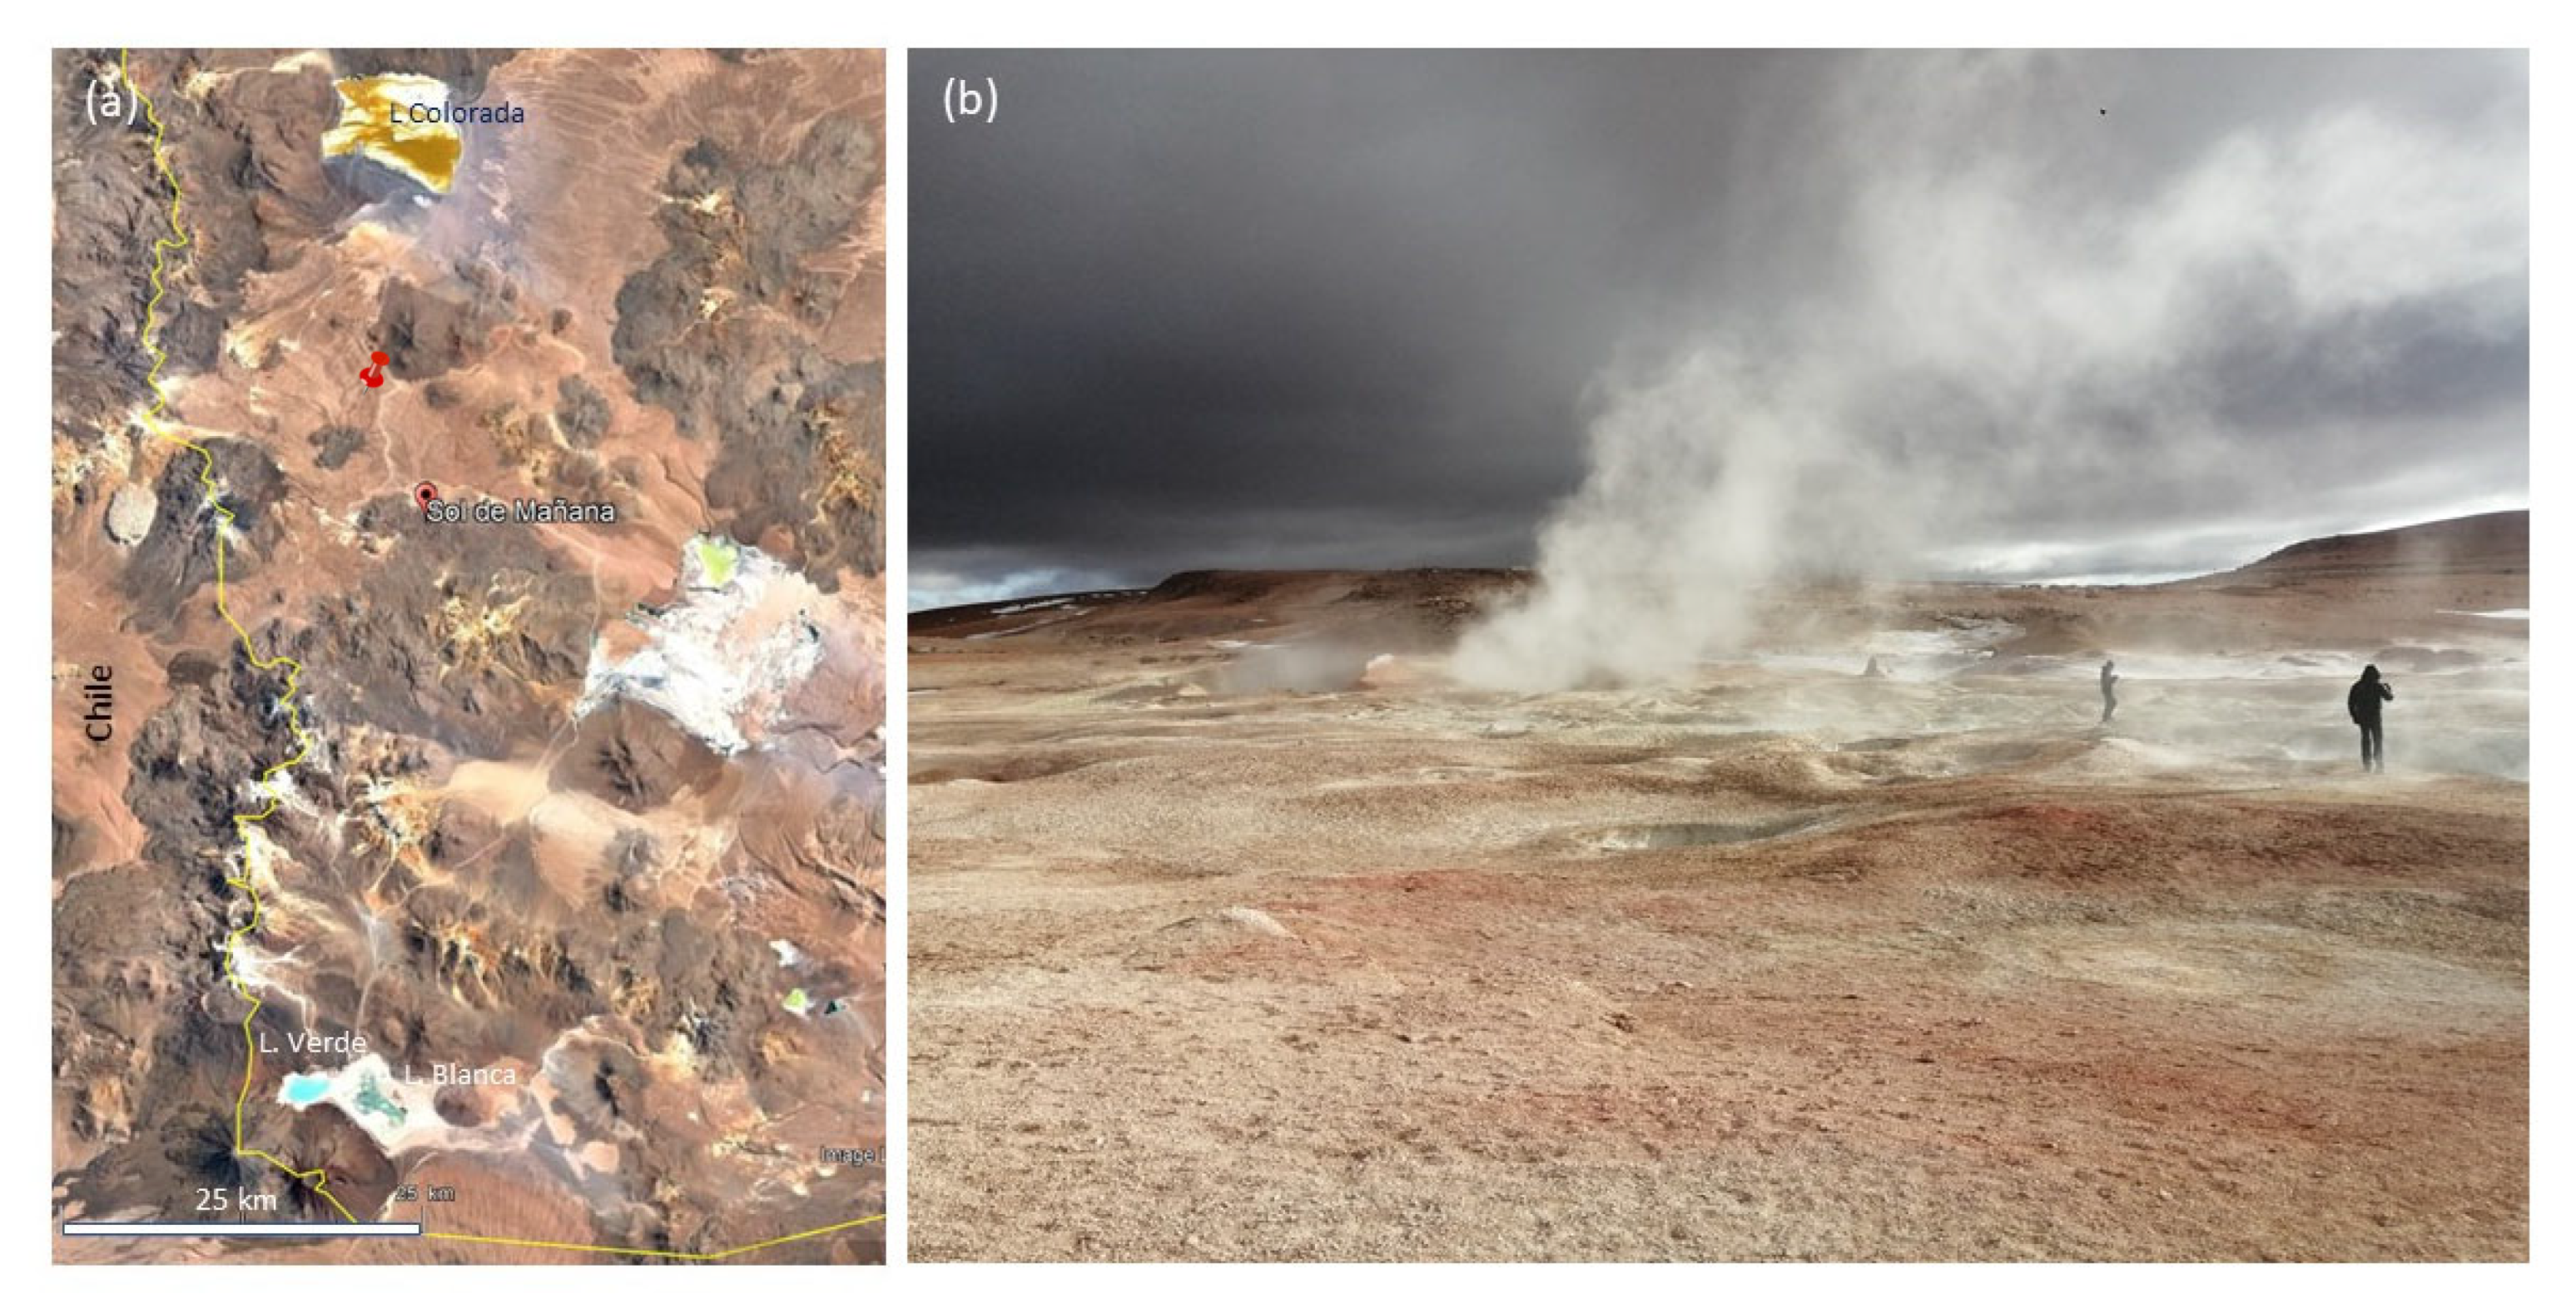
5.3. In South Lipez (Altiplano-Puna Volcanic Complex)

The hot water sources and fumaroles are rather numerous in this area; we analyzed and sampled 12 of them located around the main road between the Salar de Uyuni and the Lagunas Blanca y Verde southward (see location Figure 3 and Figure 5). Soil gas contents were also measured. The field data are presented in Table 2, and the GC analyses of the Sol de Mañana samples are presented in Table 3.
The gas within the soil, as in the fumaroles, was completely different from what we measured northward; the CO2 content is very low, and the N2 is high, even without air correction (Table 2). The methane content also remains low, around 0.5%. H2S is present in the fumaroles of the Sol de Mañana area but remains quite low or absent in the other locations.
In terms of H2, at all the visited sites, some H2 was measured in the field, either directly from soil gas measurements or in the fumaroles for the geothermal area. We have to note that the soil was very difficult to drill, and some of the measures were not made at 80 cm depth as usual but at just 20 or 30 cm, which, from our experience, always results in smaller values. The highest H2 content was found in the geothermal area where, at ground level, the water steam reaches 95 °C, which indicates a rapid ascent of the gas to the surface. Table 3 lists the H2 content measured in the laboratory from the samples taken in the steam. One may notice that the values are higher than those given by the GA5000 in the field. The H2 content is sometimes variable, even in the steam, which could be an explanation for this. Alternatively, the GA sensor may have difficulties with the extreme conditions of the area; as already noted, the outside temperature was −18 °C the morning we did the sampling, and the steam was very hot. One may consider the GC values as more representative.

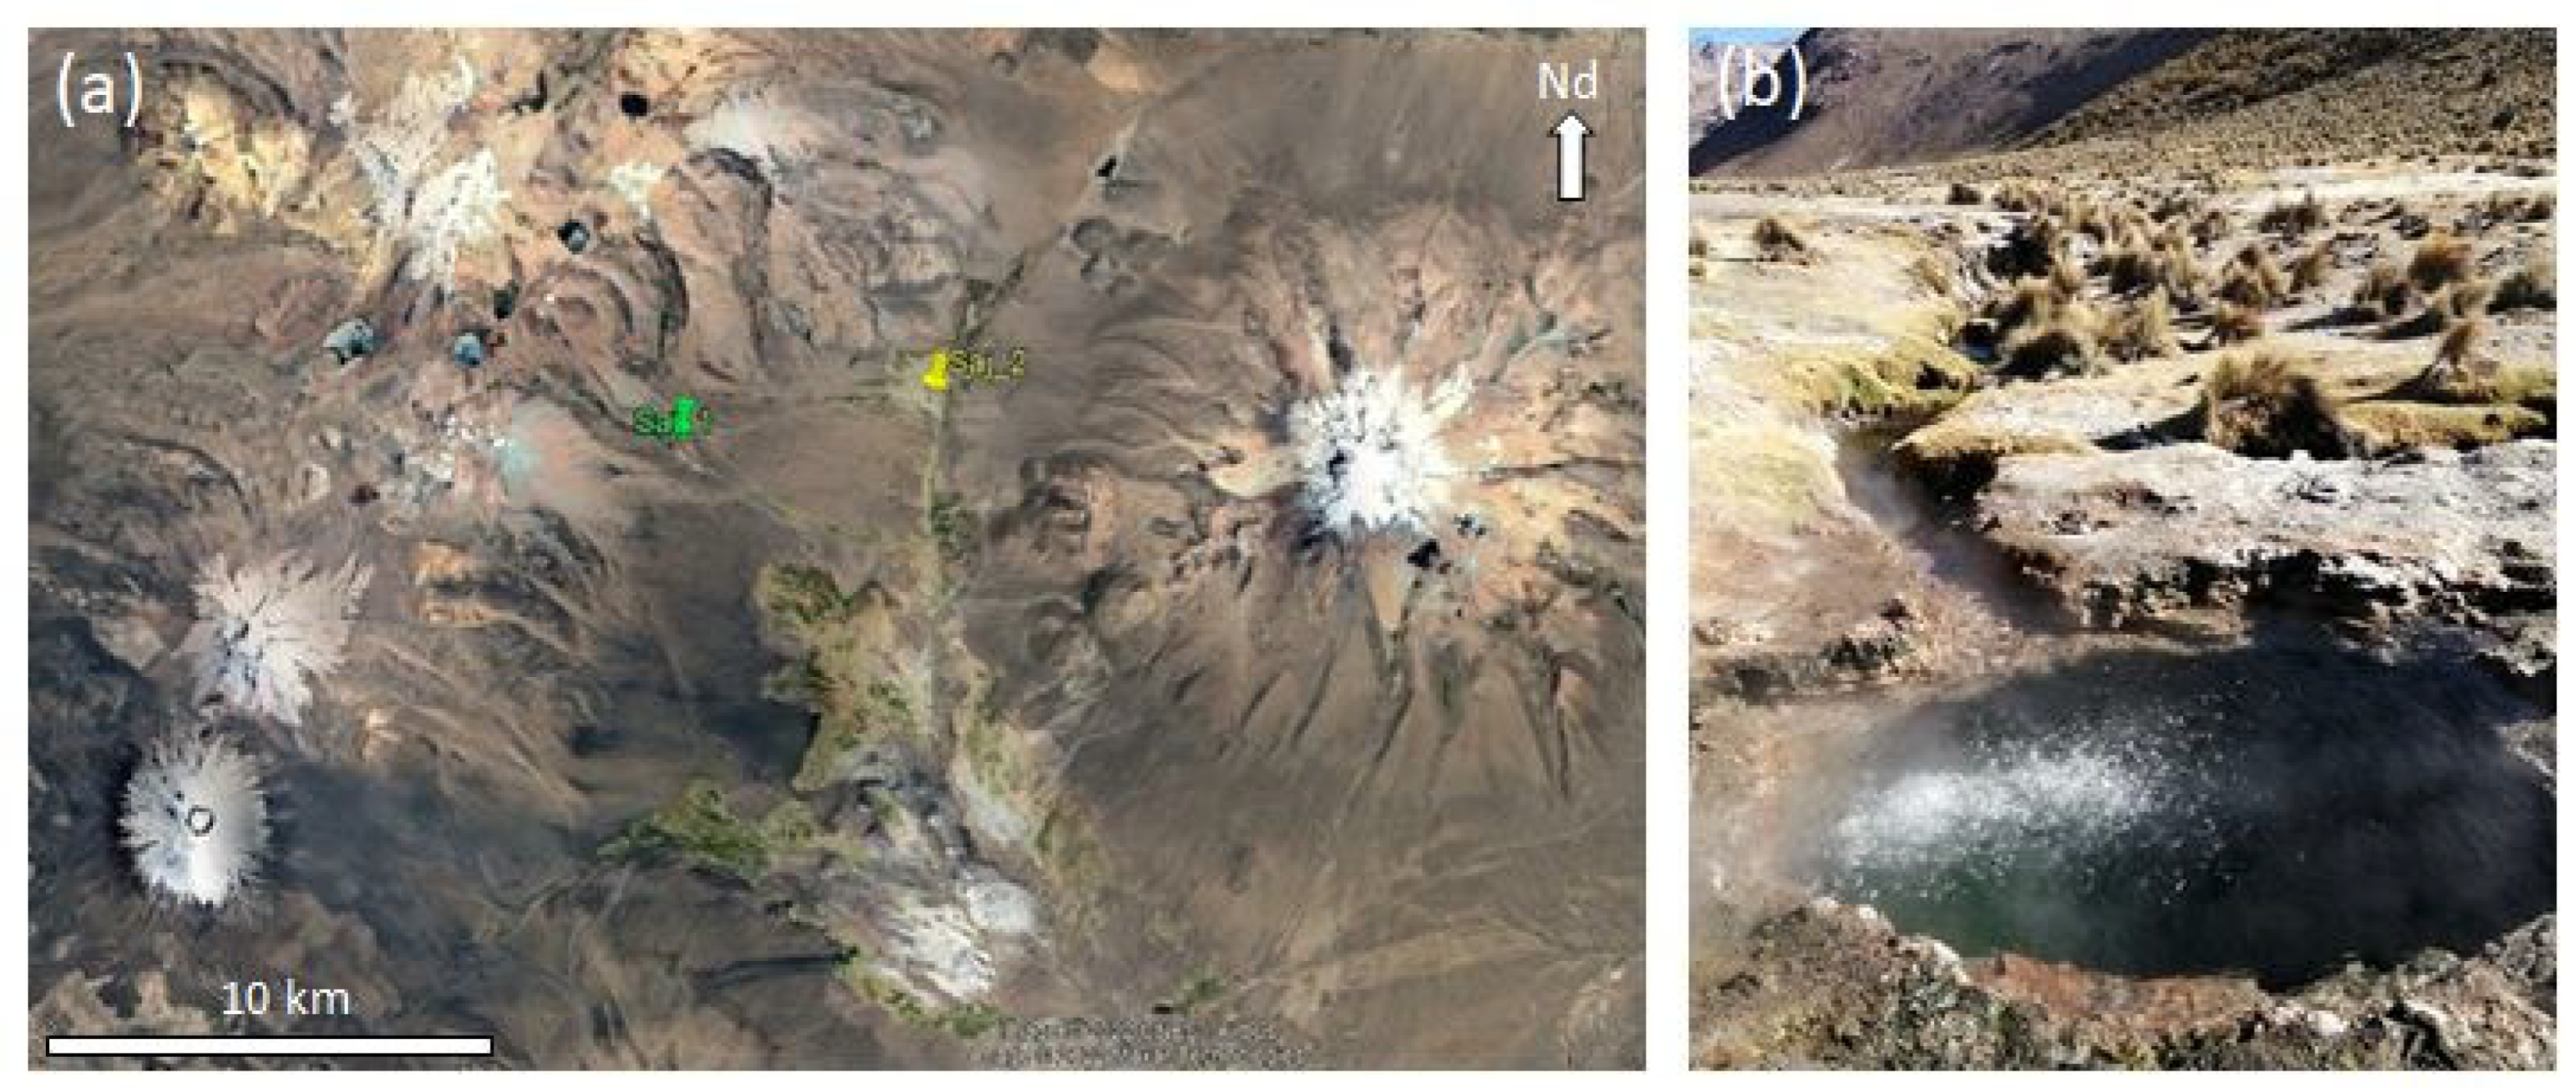
5.4. Near the Sajama Volcano (Western Cordillera Magmatic Arc)

The bubbling hot water sources and fumaroles are numerous in the Sajama area near the Chilean border. Some are used for spas and swimming pools, while some remain remote (Figure 6). The temperature was between 60 and 86 °C. The CO2 content reached 41% (Table 4, without air correction) and surpassed 80% with air correction, with the remaining 10 to 20% consisting mainly of nitrogen (12 to 14% Figure 7). In the field, the hydrogen content was null.

6. Discussion

Due to sampling difficulty and air circulation in the upper crust, all our samples are air contaminated. “Air correction” on gas samples refers to the process of removing the component gases that are present in the atmosphere (such as nitrogen, oxygen, and argon) from the gas sample being analyzed. This correction is necessary to obtain accurate measurements of the trace gases in the sample, such as methane or hydrogen, as the atmospheric gases can interfere with the analysis. We executed a simple correction based on the oxygen content, and the resulting CO2/N2/CH4 is presented in Figure 7. In the Sajama area, CO2 is clearly the dominant gas, while in the eastern border of the Altiplano, the ratio of CO2/N2 is variable but closer to one. The methane is always negligible, and the N2 is dominant south of the Uyuni Salar in the Altiplano Puma Volcanic Complex.

6.1. Huarina Fold and Thrust Belt, Central Altiplano Eastern Border

In the west-verging thrusts of the Huarina FTB, our results are coherent with the measurements made by previous authors, which also showed CO2- and N2-rich gas with a very low methane content [60]. For instance, in Pazña, the authors of one study found 64% CO2 and 36% N2. They measured about 0.6% H2 content, and our values were even lower. The higher values were found eastward of the area we sampled, along other thrust faults parallel to the ones studied in this work.
The isotopes measurement done by [60], δ18O(SMOWV) − 14.89‰ and δ2H − 108‰, suggest that the water is from meteoric origin, recharged in the Eastern Cordillera with a small contribution, less than 10% of deep water. The neutral pH, between 6.36 in Pazña and 6.98 in Poopó, is in agreement with this shallow water circulation; other authors measured close values, respectively, 6.57 and 7.24 [61]. In terms of shallow water circulation cells, similarly, in the Sub Andean Zone, the faulted anticlinal and syncline succession, linked with sharp relief variations, induce water flow between the western and eastern borders of the anticlines. The high permeability of the damaged fault zones channels the flow, and all the sources and oil seeps, in the SAZ case, are located along the thrusts [62,63]. In the current study, the hot water springs are also located on the thrust fault zones; tritium content shows that the circulating meteoric waters are young, less than 70 years, in the Altiplano [60], as in the Sub-Andean Zone [63]. This rather shallow water circulation through the Paleozoic and Cretaceous series that are involved in the thrusts in the western border of the Eastern Cordillera does not suggest large H2 potential for the area. Locally, it should be better to have additional data to completely disregard a local production hypothesis in the proximity of the tin mines.
In the Uyuni and Copaisa Salar area, none of the surface data allow us to localize the upward flow of H2.

6.2. Western Cordillera Magmatic Arc, Central Altiplano Western Border

In the Sajama area, our data do not indicate a noticeable H2 presence. The gas is a blend of N2/CO2 with more than 80% CO2 after air correction (Figure 7). The δ18O(SMOWV) isotope values indicate −12.87 for Saj_1 and −16 to −62 for Saj_2—called Kasilla in Morteani et al.’s paper. The δ2H values are, respectively, −90 and −121‰.
The very large geothermal gradient (200 °C at 1800 m, [60]) indicates a rather shallow magma chamber. The proposed fluid circulations are similar to what has been sketched for Iceland and the Republic of Djibouti [26,64] with meteoric cold water experiencing a downward flow and hot steam experiencing an upward flow; however, in other provinces, the H2 content is higher. In Bolivia, the material is basaltic [65], and thus, it is not likely that there are iron- or olivine-rich facies that may allow H2 generation by fluid–rock interactions. The melting of the thick crust may also play a role that remains to be studied.

6.3. South Lipez, Altiplano-Puna Volcanic Complex

In South Lipez, the geological context and the gas content are different: the CO2 content of all our data is low. In the geothermal zone of Sol de Mañana, values were between 1 and 4% in the fumaroles—all the points where only soil gas measurements were possible, indicating values lower than 0.3%. The GC analysis of the collected samples confirmed the low CO2 content (from 0.07 to 2.4%; see Complementary Material). This CO2 content is drastically lower than the values found northward and may look surprising for a volcanic area. However, these data are completely consistent with the results of the Vilque well that tested a gas with more than 80% N2.
What has been measured in the soil is mainly air but enriched in N2 and some hydrogen. H2S was also present, up to 300 ppm. CO was absent. In the sol de Mañana area, the fumaroles are at 99% water. This absence of gas has already been noted by previous authors [66] and is clearly a positive point for the geothermal exploitation of the resources. There are almost no toxic or corrosive gases in the steam.
Along this western border (see location Figure 3), the area of Pastos Grandes Laguna studied by other authors [14,15] displays a similar fluid flow pattern. These authors, who studied the freshwater carbonate of this laguna, sampled the various bubbling gases in the hot springs that border the seasonal lake. They did not measure H2 or CH4 but did measure CO2 (up to 86%) and N2. They also studied the water of the springs. They concluded that the water is mainly meteoric and heated by the magma chamber that is close to the surface. The CO2 is mantellic, and the large proportion of mantellic helium versus crustal helium, about 47% [17], confirms the upward migration of deep gases.

7. Conclusions

7.1. H2 Resources in the Altiplano

The H2 content is globally rather low in the measured points of the Altiplano. The main gases are CO2 and N2. In the sources bordering the Eastern Cordillera, the maximum H2 content is always lower than 1%, and the CH4 content is also always small. The existing data do not indicate an active H2 generation in that zone or the upward migration of H2 from the surrounding mantle.
Moving westward, the volcanic area of the Sajama exhibits a high heat flow, and deep gases reach the surface. At more than 80%, this gas is CO2, and the data showed no H2 or methane content. This area does not look prospective for H2 exploration.
In contrast, in the Laguna Colorada geothermal area, the gases are different. The N2 content is very large, ranging between 80 and 90% after air correction, and the strong steam flow may compensate for the relatively low H2 content. Several wells have been drilled in this area down to 1700 m by ENDE; they were all productive and confirm its HT geothermal potential [66]. An excellent energy resource of about 300MW has been confirmed, but the area is 4900m above sea level, in a desertic and windy zone, 340 km south of Uyuni city. This resource has been known since 1994, but the activity is very slow to start, and, meanwhile, different larger projects have been elaborated. Only a small 5MW pilot project was under construction in 2022. The average production rate in the wells was 350 t/h. The temperature in the reservoir is about 265 °C, and the pressure is 55 bars. Considering the fact that the steam contains 99% H2O and that we measure about 1000 ppm of H2 within, 39 kg of H2 is released per hour, or 936 kg/day.
A co-production of this resource deserves to be evaluated for the Iceland power plans [25] or in the Republic of Djibouti [26]. Gas separation from steam is an industrial process that does not require innovation. The economy of the geothermal power plants is often challenging, and any co-production that can increase revenue is typically welcome.

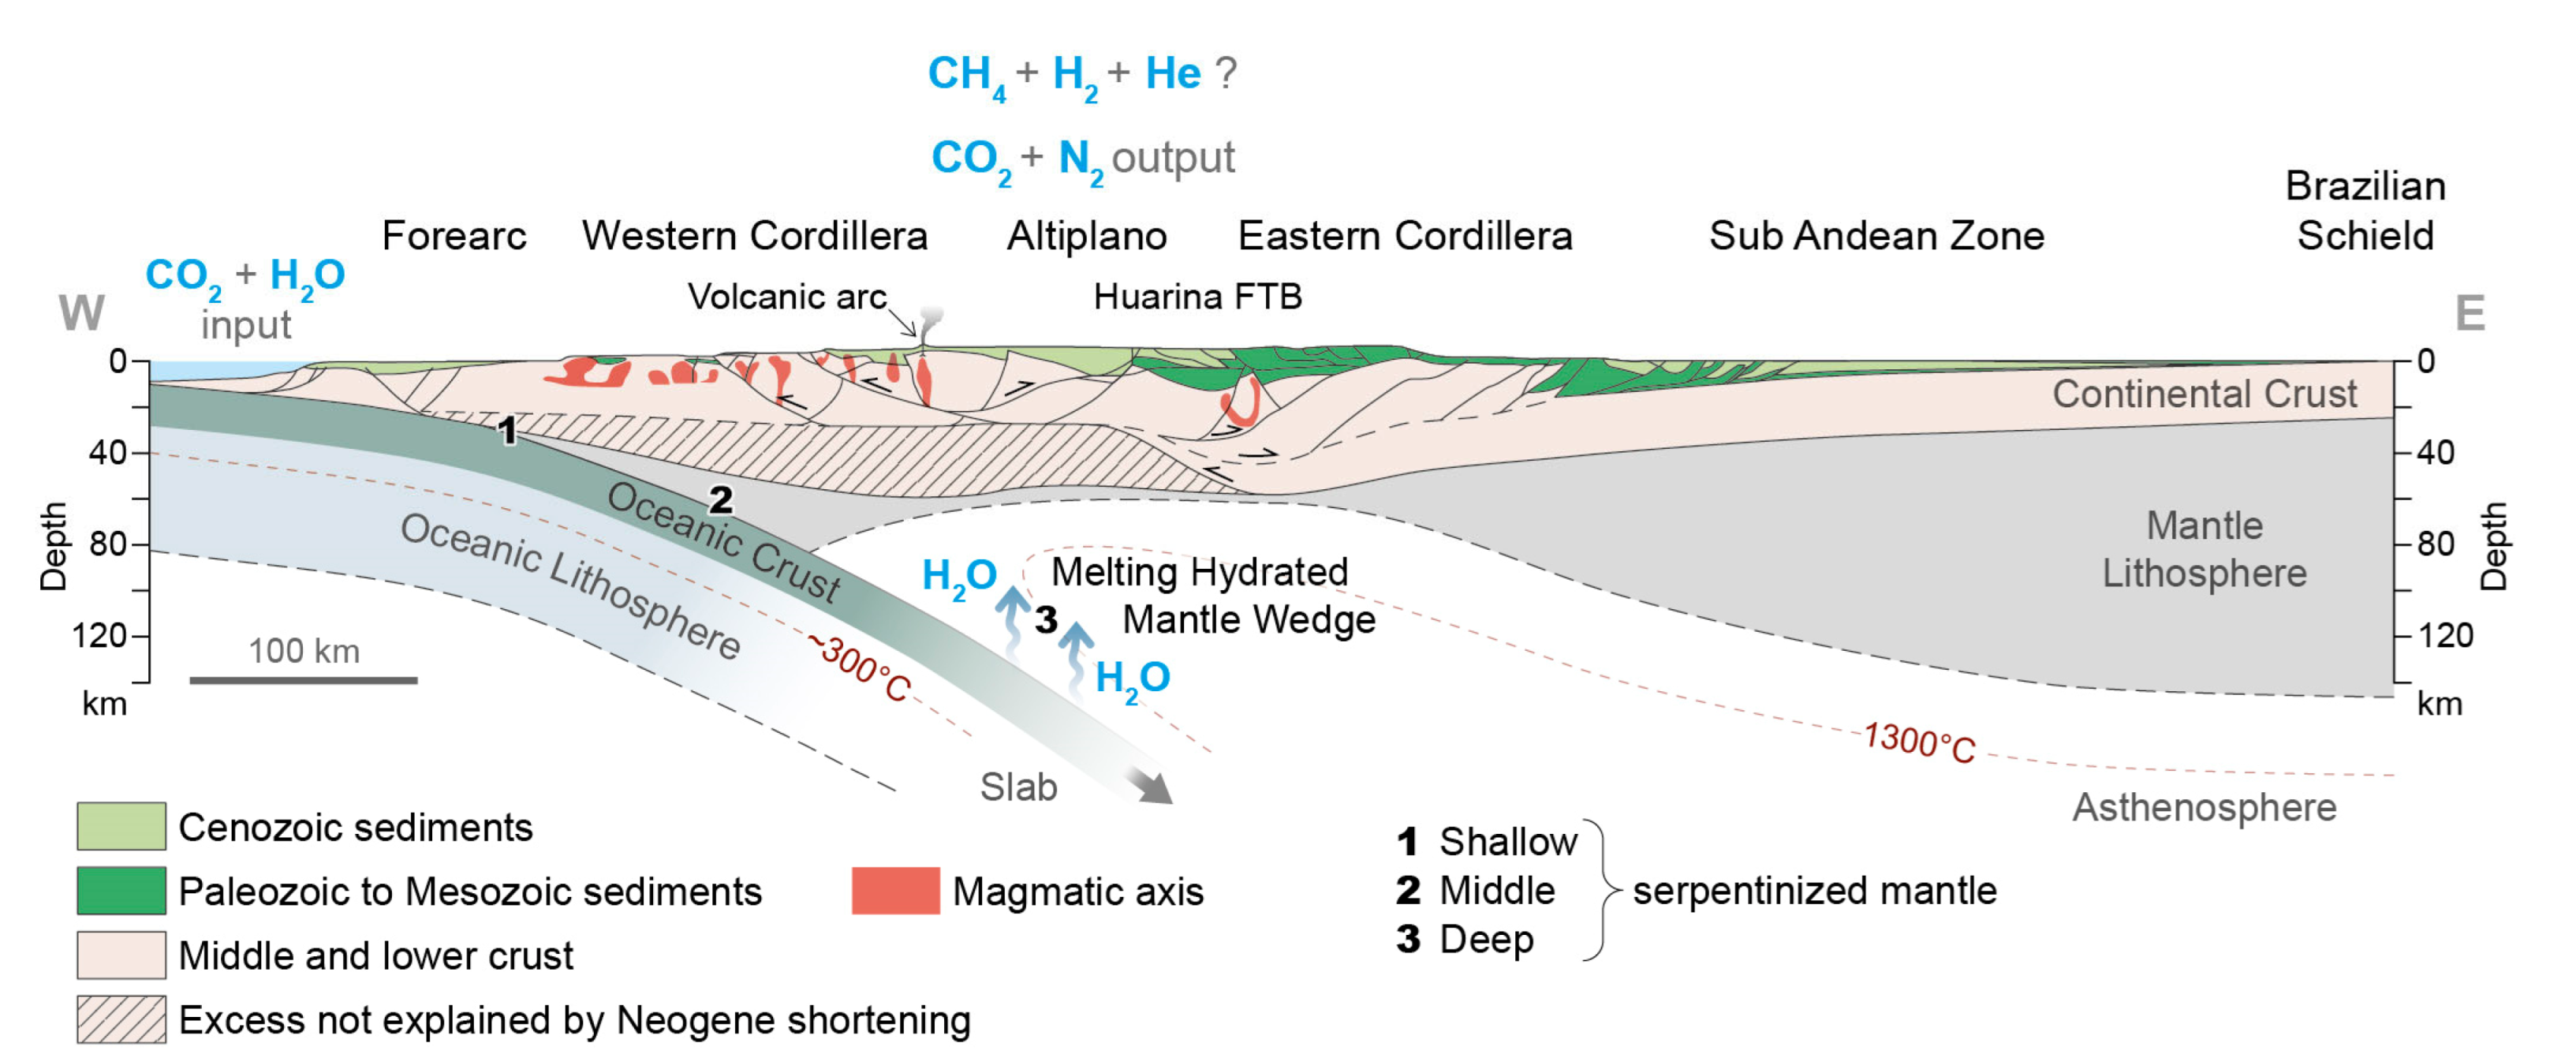
7.2. Gases from the Mantle Wedge

Previous studies have already highlighted the upward gas flow from the mantle in the Central Andes [16]. The 3He/4He ratio, expressed as R/RA, reaches 5.5 in the volcanic arc of the Western Cordillera between 22° and 19° S (Figure 1b). In the Laguna Colorado and Sol de Mañana area, the R/RA is around 2.3, which means that a little bit more than 27% of the helium is mantellic; the value reaches 44% mantle He in the Laguna Pastos Grandes. In comparison, in the Eastern Cordillera, the values are lower. This helium signature has been interpreted as the mark of the degassing of volatiles from mantle-derived magma. The Altiplano and the Eastern Cordillera are behind the current volcanic arc, but convective cells are proposed in the mantle; the extreme thinning of the mantellic lithosphere is considered to be due to this convection. Within that general frame, the sharp variation between the CO2-dominated area and the N2-dominated area southward remains to be understood. The relationship of this gas content evolution and the north-to-south variation (topographic, Bouguer anomaly and surface wave dispersion) from 21° S to 24° S highlighted by [44] deserves attention.
We may also note that above the flat subduction zone in Peru, the high 3He/4He ratio has been explained as derived from the subcontinental lithospheric mantle, mobilized by the slab-derived fluids [17]. We have not yet collected new H2 data from the area of the flat slab, but the database suggests that the values could be higher than in the Altiplano (Figure 1a).

Supplementary Materials

The following supporting information can be downloaded at: https://www.mdpi.com/article/10.3390/geosciences13040109/s1, Table S1: Site coordinates; Table S2: GA5000 raw data, B gas from bubbling water, soil gas soil measurement, F Fumaroles.

Author Contributions

The project has been launched by I.M., all the authors participated to preparation of the campaign and sites selections as well as the field acquisition. Analyses, interpretation and first draft of article has been done my I.M. and P.B.; P.A.Z. and R.V.M. participated to its improvement and finalization. All authors have read and agreed to the published version of the manuscript.

Funding

The fieldwork was funded by the CNRS through the TelluS-CESSUR action.

Institutional Review Board Statement

Not applicable.

Informed Consent Statement

Not applicable.

Data Availability Statement

Data in the text and in the Supplementary Materials.

Acknowledgments

The compilation of the preexisting data set at the scale of South America was completed by Charly Marconnet in 2021, and Figure 1a is extracted from his license practice report. The H2 analyses was completed by O. Sissmann and U. Geymond; thanks are extended to both of them. We are also grateful to IRD for its field assistance. Figure 2 and Figure 3 were drawn by A. Lethiers at SU. We would like to extend our sincere gratitude to the three anonymous reviewers for their work, which has greatly improved the manuscript and clarified several important points.

Conflicts of Interest

The authors declare no conflict of interest.

References

  1. Smith, N.J.P.; Shepherd, T.J.; Styles, M.T.; Williams, G.M. Hydrogen Exploration: A Review of Global Hydrogen Accumulations and Implications for Prospective Areas in NW Europe. Pet. Geol. Conf. Ser. 2005, 6, 349–358. [Google Scholar] [CrossRef] [Green Version]
  2. Moretti, I.; Webber, M.E. Natural Hydrogen: A Geological Curiosity or the Primary Energy Source for a Low-Carbon Future? Available online: https://www.renewablematter.eu/articles/article/natural-hydrogen-a-geological-curiosity-or-the-primary-energy-source-for-a-low-carbon-future (accessed on 20 February 2023).
  3. Lapi, T.; Chatzimpiros, P.; Raineau, L.; Prinzhofer, A. System Approach to Natural versus Manufactured Hydrogen: An Interdisciplinary Perspective on a New Primary Energy Source. Int. J. Hydrogen Energy 2022, 47, 21701–21712. [Google Scholar] [CrossRef]
  4. Prinzhofer, A.; Tahara Cissé, C.S.; Diallo, A.B. Discovery of a Large Accumulation of Natural Hydrogen in Bourakebougou (Mali). Int. J. Hydrogen Energy 2018, 43, 19315–19326. [Google Scholar] [CrossRef]
  5. Frery, E.; Langhi, L.; Maison, M.; Moretti, I. Natural Hydrogen Seeps Identified in the North Perth Basin, Western Australia. Int. J. Hydrogen Energy 2021, 46, 31158–31173. [Google Scholar] [CrossRef]
  6. Moretti, I.; Brouilly, E.; Loiseau, K.; Prinzhofer, A.; Deville, E. Hydrogen Emanations in Intracratonic Areas: New Guide Lines for Early Exploration Basin Screening. Geosciences 2021, 11, 145. [Google Scholar] [CrossRef]
  7. Boreham, C.J.; Edwards, D.S.; Czado, K.; Rollet, N.; Wang, L.; van der Wielen, S.; Champion, D.; Blewett, R.; Feitz, A.; Henson, P.A. Hydrogen in Australian Natural Gas: Occurrences, Sources and Resources. APPEA J. 2021, 61, 163. [Google Scholar] [CrossRef]
  8. Zgonnik, V.; Beaumont, V.; Deville, E.; Larin, N.; Pillot, D.; Farrell, K.M. Evidence for Natural Molecular Hydrogen Seepage Associated with Carolina Bays (Surficial, Ovoid Depressions on the Atlantic Coastal Plain, Province of the USA). Prog. Earth Planet. Sci. 2015, 2, 31. [Google Scholar] [CrossRef] [Green Version]
  9. Vacquand, C.; Deville, E.; Beaumont, V.; Guyot, F.; Sissmann, O.; Pillot, D.; Arcilla, C.; Prinzhofer, A. Reduced Gas Seepages in Ophiolitic Complexes: Evidences for Multiple Origins of the H2-CH4-N2 Gas Mixtures. Geochim. Cosmochim. Acta 2018, 223, 437–461. [Google Scholar] [CrossRef]
  10. Vitale Brovarone, A.; Martinez, I.; Elmaleh, A.; Compagnoni, R.; Chaduteau, C.; Ferraris, C.; Esteve, I. Massive Production of Abiotic Methane during Subduction Evidenced in Metamorphosed Ophicarbonates from the Italian Alps. Nat. Commun. 2017, 8, 14134. [Google Scholar] [CrossRef] [PubMed]
  11. Zgonnik, V. The Occurrence and Geoscience of Natural Hydrogen: A Comprehensive Review. Earth Sci. Rev. 2020, 203, 103140. [Google Scholar] [CrossRef]
  12. Lollar, B.S.; Onstott, T.C.; Lacrampe-Couloume, G.; Ballentine, C.J. The Contribution of the Precambrian Continental Lithosphere to Global H2 Production. Nature 2014, 516, 379–382. [Google Scholar] [CrossRef] [PubMed]
  13. Newell, D.L.; Jessup, M.J.; Hilton, D.R.; Shaw, C.A.; Hughes, C.A. Mantle-Derived Helium in Hot Springs of the Cordillera Blanca, Peru: Implications for Mantle-to-Crust Fluid Transfer in a Flat-Slab Subduction Setting. Chem. Geol. 2015, 417, 200–209. [Google Scholar] [CrossRef] [Green Version]
  14. Bougeault, C.; Durlet, C.; Vennin, E.; Muller, E.; Ader, M.; Ghaleb, B.; Gérard, E.; Virgone, A.; Gaucher, E.C. Variability of Carbonate Isotope Signatures in a Hydrothermally Influenced System: Insights from the Pastos Grandes Caldera (Bolivia). Minerals 2020, 10, 989. [Google Scholar] [CrossRef]
  15. Muller, E.; Gaucher, E.C.; Durlet, C.; Moquet, J.S.; Moreira, M.; Rouchon, V.; Louvat, P.; Bardoux, G.; Noirez, S.; Bougeault, C.; et al. The Origin of Continental Carbonates in Andean Salars: A Multi-Tracer Geochemical Approach in Laguna Pastos Grandes (Bolivia). Geochim. Cosmochim. Acta 2020, 279, 220–237. [Google Scholar] [CrossRef] [Green Version]
  16. Hoke, L.; Hilton, D.R.; Lamb, S.H.; Hammerschmidt, K.; Friedrichsen, H. 3He Evidence for a Wide Zone of Active Mantle Melting beneath the Central Andes. Earth Planet. Sci. Lett. 1994, 128, 341–355. [Google Scholar] [CrossRef]
  17. Hiett, C.D.; Newell, D.L.; Jessup, M.J. 3He Evidence for Fluid Transfer and Continental Hydration above a Flat Slab. Earth Planet. Sci. Lett. 2021, 556, 116722. [Google Scholar] [CrossRef]
  18. Larin, N.; Zgonnik, V.; Rodina, S.; Deville, E.; Prinzhofer, A.; Larin, V.N. Natural Molecular Hydrogen Seepage Associated with Surficial, Rounded Depressions on the European Craton in Russia. Nat. Resour. Res. 2015, 24, 369–383. [Google Scholar] [CrossRef]
  19. Milkov, A.V. Molecular Hydrogen in Surface and Subsurface Natural Gases: Abundance, Origins and Ideas for Deliberate Exploration. Earth Sci. Rev. 2022, 230, 104063. [Google Scholar] [CrossRef]
  20. Leila, M.; Lévy, D.; Battani, A.; Piccardi, L.; Šegvić, B.; Badurina, L.; Pasquet, G.; Combaudon, V.; Moretti, I. Origin of Continuous Hydrogen Flux in Gas Manifestations at the Larderello Geothermal Field, Central Italy. Chem. Geol. 2021, 585, 120564. [Google Scholar] [CrossRef]
  21. Rigollet, C.; Prinzhofer, A. Natural Hydrogen: A New Source of Carbon-Free and Renewable Energy That Can Compete With Hydrocarbons. First Break 2022, 40, 78–84. [Google Scholar] [CrossRef]
  22. Prinzhofer, A.; Moretti, I.; Françolin, J.; Pacheco, C.; D’Agostino, A.; Werly, J.; Rupin, F. Natural Hydrogen Continuous Emission from Sedimentary Basins: The Example of a Brazilian H2-Emitting Structure. Int. J. Hydrogen Energy 2019, 44, 5676–5685. [Google Scholar] [CrossRef]
  23. Guelard, J. Caractérisation des Emanations de Dihydrogène Naturel en Contexte Intracratonique: Exemple d’Une Interaction Gaz/Eau/Roche au Kansas. Ph.D. Thesis, Université Pierre et Marie Curie, Paris, France, 2016. [Google Scholar]
  24. Guélard, J.; Beaumont, V.; Rouchon, V.; Guyot, F.; Pillot, D.; Jézéquel, D.; Ader, M.; Newell, K.D.; Deville, E. Natural H2 in Kansas: Deep or Shallow Origin? Geochem. Geophys. Geosyst. 2017, 18, 1841–1865. [Google Scholar] [CrossRef]
  25. Combaudon, V.; Moretti, I.; Kleine, B.I.; Stefánsson, A. Hydrogen Emissions from Hydrothermal Fields in Iceland and Comparison with the Mid-Atlantic Ridge. Int. J. Hydrogen Energy 2022, 47, 10217–10227. [Google Scholar] [CrossRef]
  26. Pasquet, G.; Houssein Hassan, R.; Sissmann, O.; Varet, J.; Moretti, I. An Attempt to Study Natural H2 Resources across an Oceanic Ridge Penetrating a Continent: The Asal–Ghoubbet Rift (Republic of Djibouti). Geosciences 2021, 12, 16. [Google Scholar] [CrossRef]
  27. Charlou, J.L.; Donval, J.P.; Fouquet, Y.; Jean-Baptiste, P.; Holm, N. Geochemistry of High H2 and CH4 Vent Fluids Issuing from Ultramafic Rocks at the Rainbow Hydrothermal Field (36j14VN, MAR). Chem. Geol. 2002, 15, 245–359. [Google Scholar]
  28. Cannat, M.; Fontaine, F.; Escartín, J. Serpentinization and associated hydrogen and methane fluxes at slow spreading ridges. In Geophysical Monograph Series; Rona, P.A., Devey, C.W., Dyment, J., Murton, B.J., Eds.; American Geophysical Union: Washington, DC, USA, 2010; Volume 188, pp. 241–264. ISBN 978-0-87590-478-8. [Google Scholar]
  29. Lévy, D.; Callot, J.-P.; Moretti, I.; Duttine, M.; Dubreuil, B.; de Parseval, P.; Boudouma, O. Successive Phases of Serpentinization and Carbonation Recorded in the Sivas Ophiolite (Turkey), from Oceanic Crust Accretion to Post-Obduction Alteration. BSGF Earth Sci. Bull. 2022, 193, 12. [Google Scholar] [CrossRef]
  30. Deville, E.; Prinzhofer, A. The Origin of N2-H2-CH4-Rich Natural Gas Seepages in Ophiolitic Context: A Major and Noble Gases Study of Fluid Seepages in New Caledonia. Chem. Geol. 2016, 440, 139–147. [Google Scholar] [CrossRef]
  31. Lee, C.; Seoung, D.; Cerpa, N.G. Effect of Water Solubilities on Dehydration and Hydration in Subduction Zones and Water Transport to the Deep Mantle: Implications for Natural Subduction Zones. Gondwana Res. 2021, 89, 287–305. [Google Scholar] [CrossRef]
  32. Baby, P.; Rochat, P.; Mascle, G.; Hérail, G. Neogene Shortening Contribution to Crustal Thickening in the Back Arc of the Central Andes. Geology 1997, 25, 883. [Google Scholar] [CrossRef]
  33. Rochat, P.; Hérail, G.; Baby, P.; Mascle, G.; Aranibar, O. Analyse géométrique et modèle tectonosédimentaire de l’Altiplano Nord-Bolivien. Comptes Rendus l’Académie Sciences Ser. IIA Earth Planet. Sci. 1998, 327, 769–775. [Google Scholar] [CrossRef]
  34. Gonzalez, C.M.; Gorczyk, W.; Gerya, T.V. Decarbonation of Subducting Slabs: Insight from Petrological–Thermomechanical Modeling. Gondwana Res. 2016, 36, 314–332. [Google Scholar] [CrossRef]
  35. Ulmer, P.; Trommsdorff, V. Serpentine Stability to Mantle Depths and Subduction-Related Magmatism. Science 1995, 268, 858–861. [Google Scholar] [CrossRef]
  36. Lefeuvre, N.; Truche, L.; Donzé, F.; Ducoux, M.; Barré, G.; Fakoury, R.; Calassou, S.; Gaucher, E.C. Native H2 Exploration in the Western Pyrenean Foothills. Geochem. Geophys. Geosyst. 2021, 22, e2021GC009917. [Google Scholar] [CrossRef]
  37. Lefeuvre, N.; Truche, L.; Donzé, F.-V.; Gal, F.; Tremosa, J.; Fakoury, R.-A.; Calassou, S.; Gaucher, E.C. Natural Hydrogen Migration along Thrust Faults in Foothill Basins: The North Pyrenean Frontal Thrust Case Study. Appl. Geochem. 2022, 145, 105396. [Google Scholar] [CrossRef]
  38. Mével, C. Serpentinization of abyssal peridotites at mid-ocean ridges. Comptes Rendus Geosci. 2003, 28, 825–852. [Google Scholar] [CrossRef]
  39. Vacquand, C. Genèse et Mobilité de l’hydrogène Naturel: Source d’énergie ou Vecteur Energétique Stockable? Ph.D. Thesis, Université Pierre et Marie Curie, Paris, France, 2011. [Google Scholar]
  40. Garzione, C.N.; Hoke, G.D.; Libarkin, J.C.; Withers, S.; MacFadden, B.; Eiler, J.; Ghosh, P.; Mulch, A. Rise of the Andes. Science 2008, 320, 1304–1307. [Google Scholar] [CrossRef] [PubMed] [Green Version]
  41. De Silva, S.; Zandt, G.; Trumbull, R.; Viramonte, J.G.; Salas, G.; Jiménez, N. Large Ignimbrite Eruptions and Volcano-Tectonic Depressions in the Central Andes: A Thermomechanical Perspective. Geol. Soc. Spec. Publ. 2006, 269, 47–63. [Google Scholar] [CrossRef]
  42. Beck, S.L.; Zandt, G. The Nature of Orogenic Crust in the Central Andes. J. Geophys. Res. 2002, 107, ESE 7-1–ESE 7-16. [Google Scholar] [CrossRef] [Green Version]
  43. Wang, H.; Currie, C.A.; DeCelles, P.G. Coupling Between Lithosphere Removal and Mantle Flow in the Central Andes. Geophys. Res. Lett. 2021, 48, e2021GL095075. [Google Scholar] [CrossRef]
  44. Perkins, J.P.; Ward, K.M.; de Silva, S.L.; Zandt, G.; Beck, S.L.; Finnegan, N.J. Surface Uplift in the Central Andes Driven by Growth of the Altiplano Puna Magma Body. Nat. Commun. 2016, 7, 13185. [Google Scholar] [CrossRef] [PubMed] [Green Version]
  45. Garzione, C.N.; McQuarrie, N.; Perez, N.D.; Ehlers, T.A.; Beck, S.L.; Kar, N.; Eichelberger, N.; Chapman, A.D.; Ward, K.M.; Ducea, M.N.; et al. Tectonic Evolution of the Central Andean Plateau and Implications for the Growth of Plateaus. Annu. Rev. Earth Planet. Sci. 2017, 45, 529–559. [Google Scholar] [CrossRef]
  46. Pons, M.; Sobolev, S.V.; Liu, S.; Neuharth, D. Hindered Trench Migration Due To Slab Steepening Controls the Formation of the Central Andes. JGR Solid Earth 2022, 127, e2022JB025229. [Google Scholar] [CrossRef]
  47. Göğüş, O.H.; Sundell, K.; Uluocak, E.Ş.; Saylor, J.; Çetiner, U. Rapid Surface Uplift and Crustal Flow in the Central Andes (Southern Peru) Controlled by Lithospheric Drip Dynamics. Sci. Rep. 2022, 12, 5500. [Google Scholar] [CrossRef]
  48. Rochat, P.; Hérail, G.; Baby, P.; Mascle, G. Bilan crustal et contrôle de la dynamique érosive et sédimentaire sur les mécanismes de formation de l’altiplano. Comptes Rendus L’académie Sci. Ser. IIA Earth Planet. Sci. 1999, 328, 189–195. [Google Scholar] [CrossRef]
  49. Jiménez, N.; López-Velásquez, S. Magmatism in the Huarina Belt, Bolivia, and Its Geotectonic Implications. Tectonophysics 2008, 459, 85–106. [Google Scholar] [CrossRef]
  50. Salisbury, M.J.; Jicha, B.R.; de Silva, S.L.; Singer, B.S.; Jimenez, N.C.; Ort, M.H. 40Ar/39Ar Chronostratigraphy of Altiplano-Puna Volcanic Complex Ignimbrites Reveals the Development of a Major Magmatic Province. Geol. Soc. Am. Bull. 2011, 123, 821–840. [Google Scholar] [CrossRef]
  51. Moretti, I.; Aranibar, O. Evaluacion del potencial petrolifero del Altiplano de Bolivia. Rev. Tec. YPFB 1994, 15, 327–352. [Google Scholar]
  52. Baby, P.; Moretti, I.; Guillier, B.; Limachi, R.; Mendez, E.; Oller, J.; Specht, M. Petroleum System of the Northern and Central Bolivian Sub-Andean Zone. In Petroleum Basins of South America; American Association of Petroleum Geologists: Tulsa, OK, USA, 1995; ISBN 978-1-62981-083-6. [Google Scholar]
  53. Moretti, I.; Baby, P.; Mendez, E.; Zubieta, D. Hydrocarbon Generation in Relation to Thrusting in the Sub Andean Zone from 18 to 22° S, Bolivia. Pet. Geosci. 1996, 2, 17–28. [Google Scholar] [CrossRef]
  54. Arandia, J.; Mariaca, O. Informe Geológico Final Pozo Vilque—A; YPFB Internal Report; YPFB: La Paz, Bolivia, 1973. [Google Scholar]
  55. Welsink, H.J.; Franco, M.A.; Oviedo, G.C. Andean and pre-andean deformation, boomerang hills area, Bolivia. In Petroleum Basins of South America; American Association of Petroleum Geologists: Tulsa, OK, USA, 1995; ISBN 978-1-62981-083-6. [Google Scholar]
  56. Arandia, J.; Mariaca, O. Informe Geológico Final Pozo Copaquila—1; YPFB Internal Report; YPFB: La Paz, Bolivia, 1974. [Google Scholar]
  57. Bacchiana, M. Toledo X-1—Geological Completion Report; Esso Exploration Bolivia Ltd.: Santa Cruz, Bolivia, 1995. [Google Scholar]
  58. Moretti, I.; Prinzhofer, A.; Françolin, J.; Pacheco, C.; Rosanne, M.; Rupin, F.; Mertens, J. Long-Term Monitoring of Natural Hydrogen Superficial Emissions in a Brazilian Cratonic Environment. Sporadic Large Pulses versus Daily Periodic Emissions. Int. J. Hydrogen Energy 2021, 46, 3615–3628. [Google Scholar] [CrossRef]
  59. Moretti, I.; Geymond, U.; Pasquet, G.; Aimar, L.; Rabaute, A. Natural Hydrogen Emanations in Namibia: Field Acquisition and Vegetation Indexes from Multispectral Satellite Image Analysis. Int. J. Hydrogen Energy 2022, 47, 35588–35607. [Google Scholar] [CrossRef]
  60. Morteani, G.; Möller, P.; Dulski, P.; Preinfalk, C. Major, Trace Element and Stable Isotope Composition of Water and Muds Precipitated from the Hot Springs of Bolivia: Are the Waters of the Spring’s Potential Ore Forming Fluids? Geochemistry 2014, 74, 49–62. [Google Scholar] [CrossRef]
  61. Ormachea Muñoz, M.; Bhattacharya, P.; Sracek, O.; Ramos Ramos, O.; Quintanilla Aguirre, J.; Bundschuh, J.; Maity, J.P. Arsenic and Other Trace Elements in Thermal Springs and in Cold Waters from Drinking Water Wells on the Bolivian Altiplano. J. S. Am. Earth Sci. 2015, 60, 10–20. [Google Scholar] [CrossRef]
  62. Labaume, P.; Moretti, I. Diagenesis-Dependence of Cataclastic Thrust Fault Zone Sealing in Sandstones. Example from the Bolivian Sub-Andean Zone. J. Struct. Geol. 2001, 23, 1659–1675. [Google Scholar] [CrossRef]
  63. Moretti, I.; Labaume, P.; Sheppard, S.M.F.; Boulègue, J. Compartmentalisation of Fluid Migration Pathways in the Sub-Andean Zone, Bolivia. Tectonophysics 2002, 348, 5–24. [Google Scholar] [CrossRef]
  64. Combaudon, V.; Moretti, I. Generation of Hydrogen along the Mid-Atlantic Ridge: Onshore and Offshore. Geol. Earth Mar. Sci. 2021, 3, 1–14. [Google Scholar] [CrossRef]
  65. De Silva, S.L. Altiplano-Puna Volcanic Complex of the Central Andes. Geology 1989, 17, 1102. [Google Scholar] [CrossRef]
  66. Terceros, Z.D. State of the geothermal resources in Bolivia. In Proceedings of the World Geothermal Congress, Kyushu-Tohoku, Japan, 28 May–10 June 2000; pp. 153–160. [Google Scholar]
Figure 2. Schematic view of the Pacific subduction below the Andes at about 20° S and of its gas and water budget. Water, CO2, and N2, among others, are pushed down with the sediments covering the subducting oceanic crust. Part of this water is incorporated within the serpentine that forms during the burial of this oceanic lithosphere (1). At a deeper level, the mantle lithosphere of the overriding plate is also hydrated (2). The serpentinites remain stable for a while, but when the temperatures surpass 1000 °C, the water is released and hydrates the hot asthenospheric mantle wedge that melts (3). In this cross-section, the overriding plate corresponds to the Andes in Bolivia (modified from [32,33]).
Geosciences 13 00109 g002
Figure 3. Simplified map of the Altiplano with the major faults, the well locations, and the studied area. Wells: CPQ, Coipasa; CNI, Colchani; SGM, Salinas de Garcia Mendoza; VLQ, Vilque.
Geosciences 13 00109 g003
Figure 4. Raw data on-site and in laboratory, without correction. The gas is an N2/CO2 blend with a variable ratio. The color code, different for each site, allows us to quickly link the map and the 2 tables.
Geosciences 13 00109 g004
Figure 5. Altiplano Puma volcanic zone: (a) satellite view from Laguna Colorada to the Lagunas Blanca y Verde, the yellow line is the border between Chile and Bolivia; (b) Sol del Mañana area with its high fumaroles.
Geosciences 13 00109 g005
Figure 6. Sajama area: (a) satellite view of the zone with the location of the studied areas. (b) Details of one of the bubbling pools on the site Saj_1. There are numerous hot springs that lead to green vegetation growth in this high, about 4160 m, and desertic area. The gas is a blend of CO2/N2 and is very CO2 rich.
Geosciences 13 00109 g006
Figure 7. Main gas content after air correction. The Sol de Mañana area is characterized by its N2 content (>85%), and the Sajama area is characterized by its CO2 content (>80%). On the eastern border faults, it is a blend.
Geosciences 13 00109 g007
Table 1. Soil gas in situ measurement around the Uyuni Salar.
NameSampleCH4 (%)CO2 (%)O2 (%)H2 (ppm)CO (ppm)H2S (ppm)BALANCE (%)
Colchani Well7_10.325.713.302061.2
7_20.325.812.112061.8
7_30.328.511.710059.5
7_40.38.314.1872077.4
7_50.36.214.400079
7_60.30.615410084.1
Seep, East Salar8_10.30.215.5140084
8_20.30.215.500084.1
Table 2. Soil gas in situ measurement around the South Lipez.
NameSampleCH4 (%)CO2 (%)O2 (%)H2 (ppm)CO (ppm)H2S (ppm)BALANCE (%)
Laguna Cachi10_10.40.215.350084.1
10_20.40.215.3110084.1
Laguna Kara11_10.40.415.200084
11_20.40.215.200084.2
11_30.40.215.200084.2
Sol del Mañana, hot steam12_10.74.114.832021484
12_20.51.115.6007482.6
12_30.51.615.68030080.4
12_4only sampling
Laguna Chalvari13_10.40.515.3873783.8
13_20.40.315.5200583.8
13_30.30.315.4230483.9
13_40.40.415.11501584.1
13_50.40.315.3140484
13_60.40.315.480484
13_70.40.315.400084
Laguna Blanca14_10.40.415.3761383.9
14_20.40.315.440383.9
15_10.40.214.9001284.5
15_20.40.21500484.5
15_30.30.21500484.4
16_10.50.315.41210383.7
16_20.50.315.51180383.6
16_30.50.315.9820383.3
16_40.50.315.9830383.2
Laguna Horda17_10.40.415.1431184.1
17_20.40.315.200184.2
17_30.40.715.100183.9
17_40.40.315.200184.1
17_50.40.315.220184.1
18_10.40.515.5420183.8
18_20.40.315.5100183.9
18_30.40.215.500183.9
18_40.40.315.4700183.9
18_50.40.215.500183.9
Table 3. H2 from GC in the fumaroles of Sol de Mañana.
SamplesH2 (ppm)
S 12-1161
S 12-4371
S 12-5106
S 12b-11050
S 12b-31335
Table 4. Field and GC values in the Sajama area.
NameT°CCH4 (%)CO2 (%)O2 (%)H2 (ppm)CO (ppm)H2S (ppm)BALANCE (%)
Saj_1_1740.53312.600054
Saj_1_2610.5451400045
Saj_1_3800.4481000240
GC values CH4 (%)CO2 (%)O2 (%)H2 (ppm)CO (ppm)H2S (ppm)N2 (%)
Saj_1_2 0.00741.712.8ndndnd44.9
Disclaimer/Publisher’s Note: The statements, opinions and data contained in all publications are solely those of the individual author(s) and contributor(s) and not of MDPI and/or the editor(s). MDPI and/or the editor(s) disclaim responsibility for any injury to people or property resulting from any ideas, methods, instructions or products referred to in the content.

