Abstract
The occurrence of groundwater in urban hard rock areas is mostly controlled by secondary permeability caused by the fracturing degree and weathering grade. Vulnerability GIS-mapping, monitoring, and infiltration/recharge of water resources, and the delineation of the environmental protective background are key issues in evaluating, planning, managing, and decision-making for urban water systems. A small-scale urban area in Penafiel City was used as a case study. Historical and current scenarios were compared using hydrogeological GIS-based modelling. Water sources and potential contamination sources were mapped around the study area. Groundwater is mainly acidic, with a low mineralization and a Cl-Na to Cl-SO4-Na or Cl-Ca to Cl-SO4-Ca hydrogeochemical facies. Considering potential contamination sources, the moderate and the moderate-high classes dominate the area. The combined approach of the vulnerability indexes suggests that most of the area has a low to moderate vulnerability to contamination. The Infiltration Potential Index in urban areas (IPI-urban) indicates the prevalence of a low to moderate infiltration. Groundwater recharge evaluation indicates values < 2.3 mm/year and <60 mm/year for summer and winter scenarios, respectively. Finally, the investigation addresses insights for decision-makers for the appropriate planning and sustainable management of groundwater resources in small-scale urban areas.
Keywords:
urban groundwater; hydrogeomorphology; hydraulics; vulnerability; GIS mapping; NW Portugal 1. Introduction
“Water is the blood of a city; of your good or poor quality depends on much of the health status of a population”(Bourbon e Noronha, 1885)
Sustainable urban groundwater systems are increasingly considered to be significant in global development issues such as management, protection, supply, security, and services (e.g., References [1,2,3,4,5,6,7,8,9,10,11,12,13]). Urban population growth, in combination with better-quality living standards, lead to increased water use and demand. In addition, climate change and environmental subjects address several issues related to the sustainable availability of water resources.
An approach to monitoring the availability and sustainability of water resources need to focus on all features of ecosystems and necessarily requires a transdisciplinary methodology that encompasses socio-economic and cultural perspectives, technical-scientific solutions based on a design and nature, and an ethical approach and attention to societal dynamics. The Sustainable Development Goals (SDG) of the United Nation’s 2030 Development Agenda highlight the significant role of sustainable urban groundwater management and interactions with sanitation issues [14,15,16]. Reference [17] addresses the need to use a methodological approach to analyze groundwater interlinkages with SDG targets, supported by the clear identification of evidence-based and logical interlinkages, including in urban areas.
Reference [18] points out that the concept of urban water security addresses the provision of all different water system services, considering the overall well-being in terms of social equity and environmental sustainability, and also includes hazards, risks, uncertainties, and resilience. In addition, Reference [13] defines urban water security as an adequate supply of clean freshwater to support humans and ecosystems and calls for an improved understanding and the better management of the quantity, quality, and societal nexus of water resources. Reference [19] also highlights a vital topic focused on access to good-quality water as a basic human right. Reference [20] emphasizes urban groundwater as a core resource to human health, and well-being, decisive for sustainable development, including the rural in areas [21].
Groundwater represents a major portion of the available freshwater resources and is widely exploited around the world [22,23]. Sustainable urban water resources must be managed without causing adverse environmental impacts and urban planning must be designed to be sustainable with nature. In addition, urban water resources are variable and even asymmetric on the regional scale, with natural limitations to infiltration and/or recharge, because water is a finite resource and is an impervious material to surface block infiltration.
Hydrological conceptualization is a decisive step in urban groundwater site model development. It provides a systematic, internally consistent overview of system boundaries, properties, and processes, bridging the gap between a reliable hydrogeological characterization and groundwater modelling (e.g., References [24,25,26]).
The useful concepts of urban groundwater systems are supported by earth-based models and numerical modelling (probabilistic, deterministic, and/or stochastic) to outline prediction scenarios [24,25] and are sometimes incorporated in a multi-model approach [27]. They should be built into a robust and calibrated framework on a back-analysis and must include the intrinsic geological ground variability and uncertainty of earth-based systems, as well as a multi-model and risk assessment in a multi-hazard environment approach (see References [25,26], and references therein). In addition, Geographical Information Systems (GIS) and related technologies provide an accurate tool to improve the data analysis of geospatial information about urban hydrological systems. GIS mapping and GIS-enabled site modelling of coupled urban groundwater data are based on a multi-analysis approach based on reliable and valid high-quality data sources (e.g., References [24,25,26,28,29,30,31,32]).
The main goal of this research is to outline an integrative urban water system assessment by using hydrogeology, hydrogeomorphology, hydraulic, and GIS-based mapping studies, including a historical urban water supply understanding of a small-scale urban area (Penafiel city, NW Portugal).
2. Materials and Methods
Figure 1 shows a methodological flowchart that allows for a hydrogeological conceptual site model in a small-scale urban area (the site investigated here is ca. 5.1 km2). The study corresponds to a multidisciplinary approach using GIS technology based on a multicriteria methodology. The research is grounded on basic data collection in order to create a geo-database to organize and analyze the spatial data. The cartographic data were collected for the characterization of the study area relative to its topography, land use, geology, morphotectonics, hydroclimatology, net recharge, and urban hydraulics and sanitation. The inventory techniques allowed us to obtain the hydrogeological features, the surface and shallow groundwater potential contamination activities, and hydrotoponymical survey. The different fieldwork inventories (e.g., hydrogeological features, potential contamination sources and hydrotoponymical features) were performed using a high-accuracy GPS device (Trimble GeoExplorer) and field inventory datasheets were produced. The potential contamination activities were classified in categories by their sources of origin (details in References [33,34,35]): urbanization, industry, agriculture, water mismanagement, and miscellaneous.
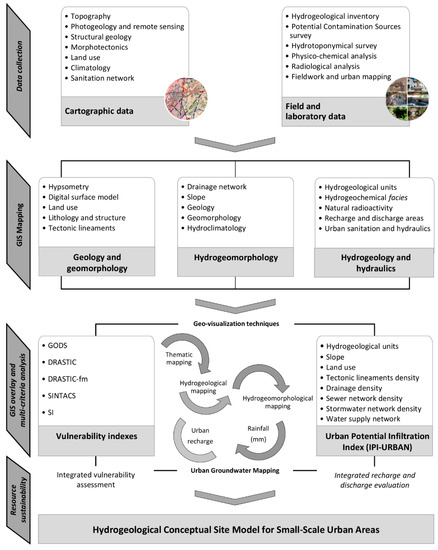
Figure 1.
Conceptual flowchart overview for the urban groundwater studies of small-scale urban areas, namely Penafiel municipality (NW Portugal).
Groundwater vulnerability assessment cannot be directly measured in the field. In order to obtain groundwater vulnerability maps, GIS technology is often used. It is a powerful tool to analyze, process, and combine spatial layers. Given the complexity of urban areas, the application of various indexes allowed for the comparing and improving of vulnerability analyses [36]. The aim of using these various indexes was to carry out an integrated evaluation between the different methods, allowing for an assessment of the vulnerability of urban groundwater. In fact, for the urban groundwater vulnerability, an integrated assessment was performed using several indexes, including DRASTIC—A standardized system for evaluating groundwater pollution potential [37], GODS—Groundwater Quality Protection [38], DRASTIC-fm—A standardized system for evaluating groundwater pollution potential for fracture media [39], SINTACS—Assessing and mapping groundwater vulnerability to contamination [40], and SI—Susceptibility Index [41]. The hydrogeological background was the basis of the vulnerability assessment. In the vulnerability maps, the international color code for DRASTIC was used. Finally, the urban groundwater vulnerability assessment was achieved using an integrated evaluation of all the methods.
The definition of the areas with the greatest infiltration potential was established on a quantitative basis and a multicriteria analysis was performed in a GIS environment. Evaluation of recharge and discharge used the Infiltration Potential Index in Urban Areas (IPI-Urban), for details see References [34,35]. The factors used in the IPI-Urban were based, revised, and updated from the key bibliographical sources (e.g., References [34,35,42,43,44,45,46,47], and their relative weight/score for each factor was calculated using the analytical hierarchy process (AHP). The AHP technique allowed for the comparison of factors to each other, assigning a weighting to each factor to describe the importance of each of those factors that contributed to the overall goal (e.g., References [48,49,50,51]). For the hierarchy of factors, the knowledge gathered in the fieldwork was fundamental. The IPI-Urban was a weighted sum of eight factors: hydrogeology, tectonic lineaments density, land use, drainage density, slope, sewer network density, stormwater network density, and water supply network density. Each factor was spatially represented and analyzed in a GIS environment. The application of the IPI-Urban allowed us to obtain a map (regular grid of 4 × 4 m2) representing the combination of all factors, ranging from 0 to 100. The areas where the IPI-Urban index showed higher values, corresponding to the more favorable conditions for water infiltration, according to all factors.
For the Penafiel urban area, two scenarios were developed, covering both summertime and wintertime. Table 1 presents the relative weight of the explained factors for each scenario. Since the study area is hot and dry during the summer, the stormwater network density was not considered for that scenario.

Table 1.
Infiltration Potential Index in Urban Areas (IPI-Urban): Relative weight of the factors for each scenario (updated from Reference [34]).
In order to calculate the urban recharge (mm/year), an analysis of the amount of rainfall was performed. That allowed us to conclude that the period between June and August was predominantly dry. According to regional hydrogeological key studies [47,52], performed in fissured media and surrounding the study area, an initial recharge rate of 8% was considered. The yearly average for dry months (35.4 mm/year) was used to calculate the urban recharge in the summer scenario, while the average for the remaining months (wet period) was used for the winter scenario (1299.3 mm/year).
3. Penafiel Urban Area: Setting and Historical Background
3.1. General Setting and Hydroclimatology
Penafiel municipality occupies the interflow of the rivers Sousa—Tâmega—Douro in North Portugal. The site investigation is situated in the Northern district of Porto and it is called the capital of the Tâmega Sub-region. The studied area—the small-scale urban area of Penafiel—has 8761 inhabitants [53], with an area of 5.1 km2, which corresponds to a low population density (1717 people/km2).
For this study, the urban area was delimited using the criteria of land use as well as geomorphological features. The study area is mainly located in a planned surface with an NE–SW orientation. Figure 2 presents the geographical and geomorphological setting of the Penafiel urban area. The region is mainly constituted by soils, essentially granitic, suitable for intensive agricultural purposes. The urban area is formed by granitic rocks and they outcrop in some parts of the urban area, particularly in the NE sector (Santa Marta) [54].
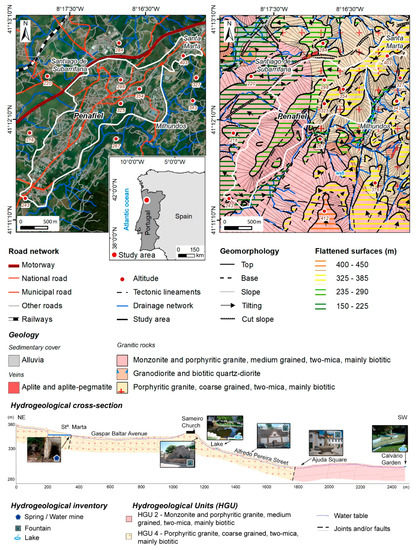
Figure 2.
Geographical and geomorphological setting of the Penafiel urban area, as well as an interpretative hydrogeological cross-section of the studied area.
The urban area of Penafiel is characterized by a temperate climate with Atlantic influence, with the existence of a hot and dry period that corresponds to the summer months—more precisely, Csb in the Köppen climate classification [55,56]. Climate series from the Portuguese Water Resources Information System (SNIRH) were used to obtain a local characterization of the climate in the Penafiel region. The average annual rainfall is 1335 mm. The average monthly precipitation values of above 150 mm are found between November and March and the driest months correspond to July and August, with values rarely exceeding 30 mm monthly. The average annual temperature is 14.1 °C, with a minimum value in January (7.9 °C) and a maximum value in July (21.1 °C).
In Northern Portugal, urban water systems were absent or seriously degraded, in quantity and quality, by flawed sanitation infrastructures and hygiene practices only set out in the early 19th century (see, e.g., References [57,58,59,60,61,62], and references therein).
3.2. Urban Hydro-Historical Milestones
Landamnn [63] made impressive remarks in terms of the landscape, geology and water resources about Penafiel urban area and surroundings during the Napoleonic invasions of the Iberian Peninsula: “Hence we obtain a view of Penafiel on the summit of a third chain, two leagues distant, and from which we are separated by a beautiful valley richly cultivated, abundantly wooded, refreshed by numerous springs, the sources of small rivulets, and interspersed with substantial villas and cottages. […] The town of Penafiel is situated on a mountain, which extends from the river Souza to a small rivulet at two leagues beyond Penafiel: the town is not very considerable. […], the streets are very irregular, tolerably well paved, but narrow, and few of the houses exceed two stories in height.
Soon after our departure, in looking towards the north and west, we have a very grand view: Penafiel is on the left, whence towards the right extends the valley we traversed from Balthar, and beyond this horizon is bounded by the second great chain of mountains from Porto, where Balthar is seated near the summit; the fore-ground is composed of the declivities of the mountain on which we stand, forming extensive ravines, where scattered pine-trees, and large masses of soft granite, many of them nearly spherical, are seen on the surface in great profusion.”
References [64,65] clearly report the extremely bad sanitary conditions of the Penafiel urban area, circa 1928–1934. In fact, there was no urban sewage system, the urban stormwater arrangements were deficient and smelly water was often fed into the water supply system (details in References [64,65]). Only in the late 1930s and early 1940s were some key hydrological and hydraulic studies made about the Penafiel area [66,67].
The recorded urban water systems conditions are very similar to the concerns of other Portuguese municipalities in the 19th century (e.g., Lisbon, Coimbra, Figueira da Foz, Porto, Guimarães, and Braga) related to initiating comprehensive groundwater studies for urban water supply (e.g., References [57,60,62,68,69,70,71,72,73,74,75,76], and references therein). In addition, References [77,78] reported several cholera epidemic outbreaks in Portugal, showing poorer hygienic conditions than most Portuguese cities. More recently, some urban groundwater studies and investigations were performed in Penafiel, aimed at the use of the urban water resources in the irrigation of green spaces and public fountains [26,79,80].
Figure 3 outlines the evolution of the key historical landmarks concerning the water supply and sanitation in the Penafiel urban area, as well as the overall historical framework in Portugal (e.g., References [63,81]).
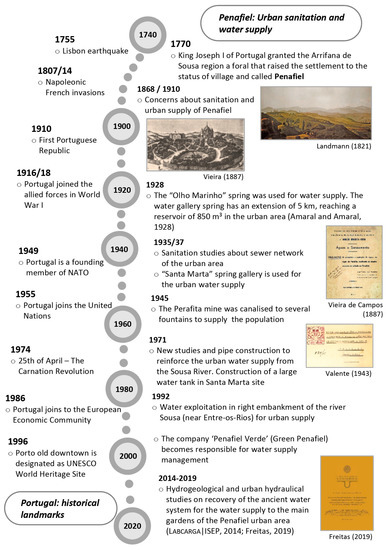
Figure 3.
Outline of historical milestones (18th–21st centuries) related to the hydrological studies, urban sanitation and water supply in the Penafiel urban area, as well as some key historical landmarks of Portugal.
3.3. Urban Hydraulics and Penafiel’s Water Supply
Water supply systems should make use of the best available water sources, whether groundwater or surface water. Priority should be given to solutions based on existing water sources. By using the water from the existing underground mining galleries in the city of Penafiel, the efficient use of available water resources is promoted, contributing to sustainable management.
Water mine galleries capture fissured aquifers occurring in hard rocks, and are dug on hillslopes, where the topography intersects with the water table, almost always enabling gravity water supplies. This type of catchment can have significant flow fluctuations throughout the year, making them sometimes less reliable water sources.
The hydraulic study of Reference [67] refers to three water mines in the upper part of the city of Penafiel that fed public fountains, drinking fountains, and community wash-houses: (i) Parque Mine, (ii) Ponte Mine, and (iii) Santa Marta (or Chãos) Mine.
With population growth and increasing per capita consumption, the pressure on the water resources grew and there was a need to explore other sources. This led to the opening of galleries and water mines in Perafita (the Duas Igrejas site), whose water was sent to a reservoir in Penafiel (Alto do Sameiro), today wedged between the Penafidelis restaurant and the Pena hotel. Still, due to the lack of water in hot and dry years, in the 1970s water supply reinforcement works were carried out from the Sousa River to Penafiel, and an additional water reservoir was built in the Alto do Castro (Santa Marta). Later, a water catchment in the Tâmega River was constructed and this is now supplying the public water distribution network of Penafiel.
The old system was therefore abandoned and has deteriorated due to lack of use and maintenance. It should be noted that, in addition to the fact that there is no inventory of the old system, it was found, locally, that a large part of the network was destroyed when the public water supply system was built and also during urban regeneration works. To promote sustainable urban management, the feasibility of recovering the old water supply system was assessed, considering the available mine flows and the conservation status of existing pipelines.
It is noted that the main fountains and public green spaces of the city are located between the topographic elevations 300 and 350 m. Of the three mines, only the Santa Marta mine gallery can satisfy this range of elevations, as it is located at a higher topographic elevation, approximately 352 m. This provides the necessary pressure for the city’s garden irrigation network. This management of water resources is also environmentally advantageous, as water from the mine does not carry harmful substances to green spaces.
An assessment of the flow rates for the current needs of the water supply network to public fountains and public green spaces reveals that the existing mine cannot meet all contemporary needs. Accordingly, a study was conducted on the use of the mine flow to partially meet these needs. A rational use of the flow rates was proposed, leading to the re-use of these waters and minimizing the costs associated with the public supply network consumption.
In the proposed supply system, the water is transported by gravity through buried pipelines. Initially, a connection between the Santa Marta Mine and a reservoir to be located at the top of Sameiro’s Garden is proposed. The proposed solution replicates the old system that was deactivated a few years ago but still exists. It is a buried reservoir, built in stone masonry, from which the gardens and fountains were supplied.
The proposed network starts from a new reservoir to be located at the site of the old one, and its scheme is outlined in Figure 4. The design network begins by establishing the connection between the Santa Marta Mine (MNA) and the reservoir located at the top of Sameiro’s Garden (RSV).
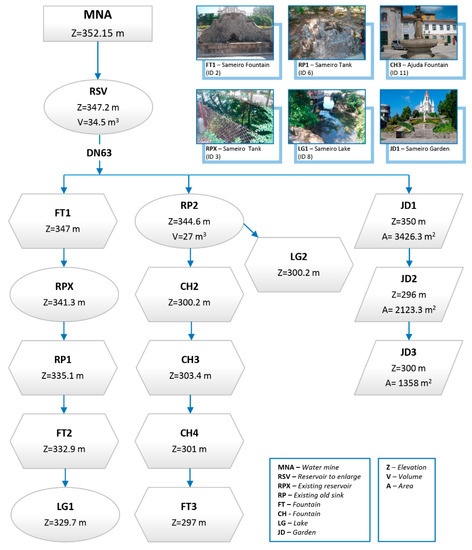
Figure 4.
The design scheme of the proposal for the supply network of fountains and irrigation of green spaces.
The need for water storage through the construction of a reservoir is due to hydraulic, economic, and safety reasons. This storage is ensured by the reservoir, which simultaneously performs the following functions: (i) to serve as a regularization device, compensating for consumption fluctuations; (ii) to set up water reserves to ensure distribution in the event of voluntary or accidental disruption of the upstream network; (iii) and to balance the pressures in the distribution network.
From the reservoir, three branches develop: the first pipeline conducts water to the gardens (Sameiro Garden—JD1, Praça da República Garden—JD2 and Calvário Garden—JD3); the second pipeline directs the water to a set of fountains, such as Largo da Ajuda (CH3); and the third pipeline leads the water to the fountain located on the steps of the Sanctuary of Nossa Senhora da Piedade (CH2) and Santos Passos (CH1). This kind of “cascade” layout solution seeks to achieve better water rationing.
The layout of the pipelines was defined, considering economic optimization criteria, passing on roads and paths, and assessing the costs of possible pavement replacements and interference with residents, natural obstacles, and other infrastructure, seeking to preserve the historical area.
4. Results and Discussion
A hydrogeological inventory was performed, and a total of 44 water sources were mapping (Figure 5a,d). Most of the water sources are fountains/springs and water tanks, and for nearly 50% of them, the origin of water is natural. The remaining water sources are supplied by the municipal network.
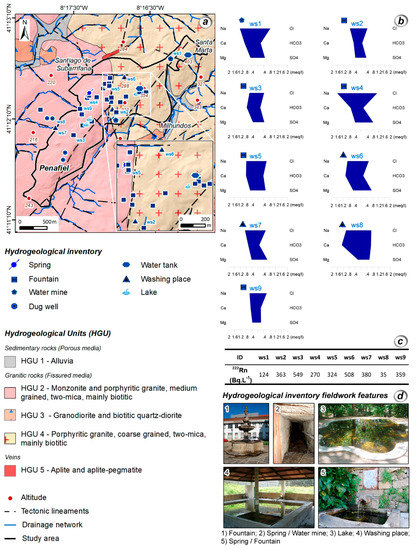
Figure 5.
Hydrogeological inventory and hydrogeochemical characterization in the Penafiel urban area (NW Portugal): (a) hydrogeological inventory; (b) Stiff diagrams for the 9 water sources; (c) groundwater radon concentrations for the selected water sites; and (d) some aspects of the hydrogeological inventory fieldwork.
Two fieldwork campaigns were performed and in situ determinations included temperature (°C), pH, and electrical conductivity (µScm−1). Water samples were collected in each campaign for hydrogeochemical and radioisotope analyses. The hydrogeochemical analyses included major element concentrations, as well as nitrates. To evaluate the impact of radioisotopes on water quality, radon gas (222Rn) was analyzed. The laboratory groundwater results were analyzed with AquaChem software (version 5.1., Waterloo Hydrogeologic, Waterloo, Canada).
For the hydrogeochemical characterization, nine water sources were selected, six in the hydrogeological unit HGU 2: ws3, ws4, ws5, ws7, ws8, and ws9, and three in the hydrogeological unit HGU 4: ws1, ws2, and ws6 (Figure 5a,b).
The groundwater has an acidic character (median pH = 5.5) with relatively low mineralization (electrical conductivities < 300 μScm−1) and three water sources are nitrate enriched: ws1 (65 mgL−1), ws4 (94 mgL−1), and ws6 (68 mgL−1). The hydrogeochemical facies for most of the groundwater are Cl-Na to Cl-Ca and Cl-SO4-Na to Cl-SO4-Ca. Concerning radon gas (222Rn), the concentrations are in the range 35–549 BqL−1 and the median value is 359 BqL−1 (Figure 5c).
Considering the relatively low mineralization and the hydrogeochemical facies, the groundwater appears to have a shallow flow path, with short periods of time between recharge and discharge areas. Moreover, sulphates and nitrates are likely to have an anthropogenic origin, most probably related to the proximity of agricultural fields and public gardens, where fertilizers and pesticides are used. These results are in good agreement with other data reported for urban areas in granitic terrains (see e.g., References [34,52,82,83,84].
Here, 222Rn concentrations in groundwater are within the variation interval observed in Portugal for granitic aquifers [84,85].
An inventory of potential groundwater contaminant activities is based on thorough and systematic work. In urban areas, it is fundamental to understand whether there is contamination, and what its origin is (natural or anthropogenic). It is also an important contribution to a future analysis of the vulnerability of water resources to contamination. It should also be treated as an indispensable part for the development of a groundwater protection strategy [33].
In the studied area, 70 groundwater potential contamination sources were identified, and a field datasheet was created for each one. The groundwater potential contamination sources were inventoried and classified according to the degree of contamination (adapted from Reference [38]). The degree of contamination was divided into four classes, namely: low, moderate, moderate to high, and high. Figure 6 shows the location of the potential contamination sources, as well as the degree of contamination, relative to the hydrogeological units. From an analysis of the figure, it can be concluded that, in the urban area of Penafiel, the high contamination class represents 37.1%, while the moderate and moderate to high classes represent 55.7% of the potential contamination sources. The low class represents 7.1%. Due to the potential for contamination, the nature of contaminations sources may contribute to the locally increasing vulnerability to contamination.
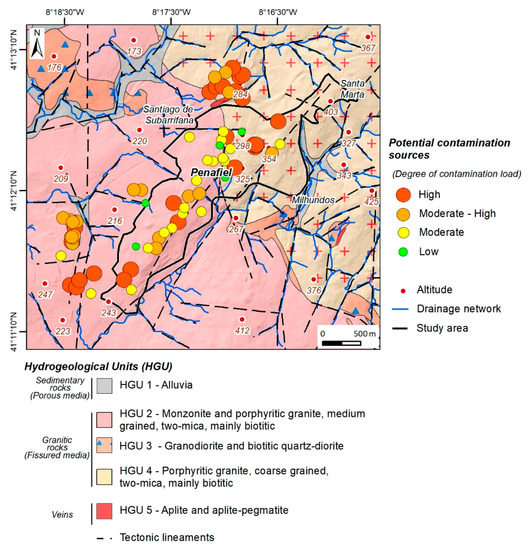
Figure 6.
Potential contamination sources in Penafiel urban area (NW Portugal).
In order to carry out the urban vulnerability assessment in the Penafiel urban area, several indexes were applied, namely the GODS, DRASTIC, DRASTIC-fm, SINTACTS, and SI (Figure 7).
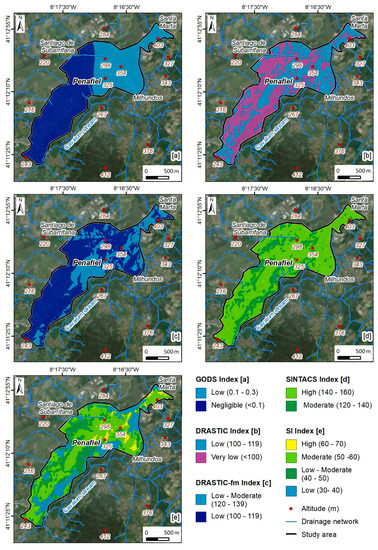
Figure 7.
Urban groundwater vulnerability assessment in the Penafiel urban area (NW Portugal): (a) GODS; (b) DRASTIC; (c) DRASTIC-fm; and (d) SINTACS and (e) SI.
The GODS index (Figure 7a) reflects the hydrogeological units, which can be justified by the smaller number of parameters used in its calculation. Most of the area presents negligible vulnerability (57.5%), and the remaining area corresponds to the low vulnerability class (Table 2). The class with the highest representation occurs in HGU 2 (monzonite and porphyritic granite, medium grained—Figure 8). Figure 7b represents the DRASTIC index. The very low vulnerability class comprises 52.7% of the area, while the remaining area presents a low vulnerability. The relation between the hydrogeological units and the vulnerability classes (Figure 8) allows us to conclude that the very low vulnerability class mostly occurs in HGU 2 and the low vulnerability in HGU 4 (porphyritic granite, coarse grained). The DRASTIC-fm index, which is an adaptation of the DRASTIC method by the addition of the parameter fm (fracture media), was also applied According to DRASTIC-fm (Figure 7c), the urban area presents low vulnerability (69%) overall. The predominance of this class of vulnerability occurs in both hydrogeological units. The study area, according to the SINTACS index (Figure 7d), is classified predominantly as having high vulnerability (77.9%). Finally, the application of the SI index allows the classification of the area into four classes of vulnerability (Figure 7e). Three classes of vulnerability are clearly distinguished: moderate (50.8%), low-moderate (24.7%), and low (20.5%). These correspond to 95.9% of the entire study area. In the calculation of this index, the LU (Land Use) parameter is added, and it can be concluded that its relationship with the hydrogeological units is very low.
Table 2.
Urban groundwater vulnerability assessment in Penafiel urban area (NW Portugal): A statistical overview of GODS, DRASTIC, DRASTIC-fm, SINTACS, and SI results.
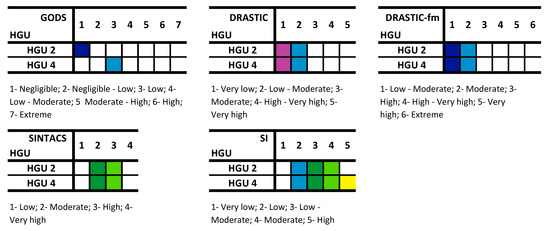
Figure 8.
Matrix of hydrogeological units and each of five potential groundwater vulnerability indexes for contamination in the Penafiel urban area (NW Portugal).
In the study area, according to the various indexes applied, the vulnerability classes have different levels. It can be concluded that the increase of parameters used, as well as their weighting, contributes to a more accurate characterization of the investigation site. Finally, the integrative approach of intrinsic vulnerability is essential for sustainable water resource management in urban areas.
The application of the IPI-Urban allows for the definition of areas where infiltration is most favorable, according to a set of factors [34,35,47]. As such, the factors considered in the IPI-Urban are represented in Figure 8 and Figure 9. Regarding hydrogeology (Figure 9a), HGU 4 (porphyritic granite, coarse grained) and HGU 2 (monzonite and porphyritic granite, medium grained) stand out. These hydrogeological units make up 99.6% of the total urban area. As can be seen in Figure 9b, the low slope class (55%) stands out, followed by the very low slope class (26.6%). Regarding land use (Figure 9c), the “urban fabric” class stands out, corresponding to 58.9% of the study area. In the tectonic lineaments’ density (Figure 9d), the most representative classes are low and very low, corresponding to 83.6% of the urban area. Regarding the drainage density (Figure 10a), it was found that the most representative class is the high class, representing 75.8% of the area under study. The remaining parameters relate to urban hydraulics and sanitation. With regard to the sewer network density (Figure 10b), the most representative classes are low and moderate, corresponding to 96.1% of the urban area. In turn, the stormwater network density (Figure 10c) is mostly low to moderate (96.1%). Regarding the last factor considered, the water supply network density (Figure 10d), two classes that represent 75% of this urban area can be highlighted, namely the moderate and the high-density classes.
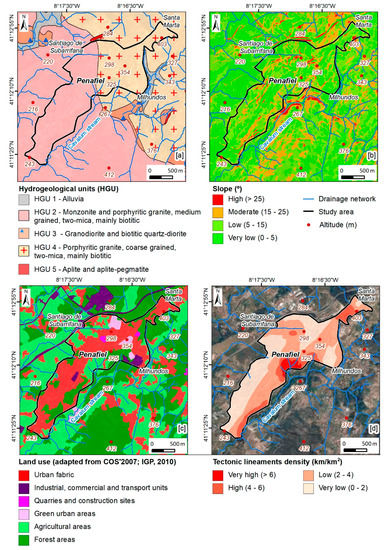
Figure 9.
Urban Potential Infiltration Index (IPI-Urban) in the Penafiel urban area (NW Portugal): hydrogeological units (a), slope (b), land use (c), and tectonic lineaments density (d).
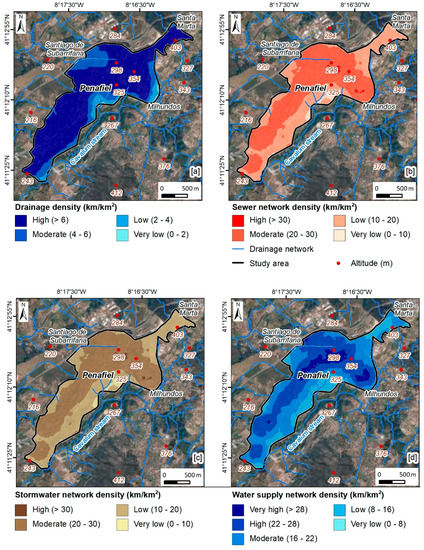
Figure 10.
Urban Potential Infiltration Index (IPI-Urban) in the Penafiel urban area (NW Portugal): drainage density (a), sewer network density (b), stormwater network density (c), and water supply network density (d).
Figure 11 presents the IPI-Urban of the Penafiel area, and both the summer (Figure 11a) and winter scenarios (Figure 11b). The analysis of the figure, together with Table 3, allows us to conclude that, in this urban area and in both scenarios, the low to moderate infiltration class predominates. In the summer scenario, the low to moderate class corresponds to 71% of the area, with 82.9% for the winter scenario. The evaluation of the urban recharge was performed according to the methodology described above. Additionally, here, the two scenarios (summer and winter) are presented regarding recharge in the urban area of Penafiel.
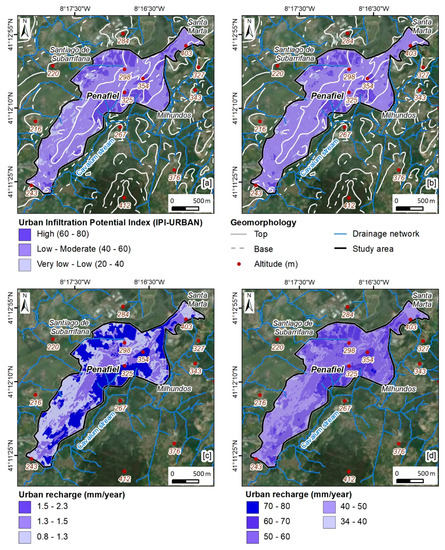
Figure 11.
Urban groundwater mapping in the Penafiel urban area (NW Portugal): Urban Potential Infiltration Index (IPI-Urban) ((a) summer scenario; (b) winter scenario); and urban recharge ((c) summer scenario; (d) winter scenario).
Table 3.
Urban Potential Infiltration Index (IPI-Urban) and urban recharge (mm/year): statistical overview.
Figure 11c,d show the recharge (in mm/year) in the urban area under study. The minimum and maximum recharge values are 0.88 and 2.30 mm/year for the summer scenario and 34.4 and 80.6 mm/year for the winter scenario. As for the average, a value of 1.4 mm/year was reached for the summer scenario, with an average of 53.7 mm/year for the winter scenario.
In the summer scenario (Figure 11c and Table 3), the recharge classes are relatively evenly balanced, with the most representative being the class < 1.3 mm/year (36.1%), followed by the 1.5–2.3 mm/year (35.6%) class. The class least represented is the class 1.3–1.5 mm/year (28.3%). Recharge increases substantially in the winter scenario (Figure 11d and Table 3). Thus, the class 50–60 mm/year stands out, representing 46.6% of the urban area. It is followed by the 40–50 mm/year class, representing 30.8% of the area. The recharge class 60–70 mm/year covers 20.8% of this urban area.
5. Urban Hydrogeological Site Conceptual Model
Figure 12 is the conceptual hydrogeological model of the urban area of Penafiel and its surroundings. The analysis of the figure shows that the recharge is done by meteoric waters, mainly in the flattened areas between 350 and 385 m (Santa Marta), and in areas occupied by forests. Precipitation values vary between 1300 and 1350 mm/year, with infiltration rates of around 3%, reaching values in the range of 40–60 mm/year. The water table follows the topography and is practically at the surface, between 5 and 10 m depth. The occurrence of springs is generally associated with tectonic nodes, with flow rates generally below 0.4 L/s. Underground flow occurs at shallow depths of up to 50–60 m, along the weathered and fractured zones of the granitic rocks; the deepest flow occurs along both the main tectonic axes with adequate connectivity and the veins, namely aplite and aplite-pegmatite.
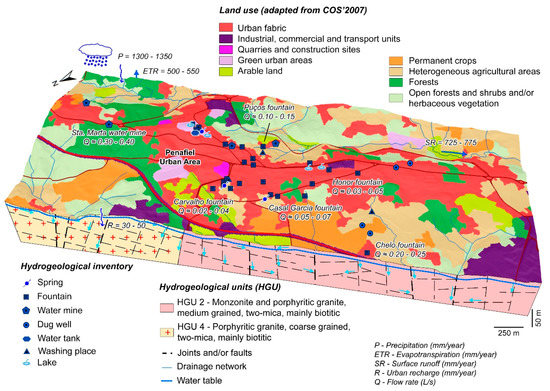
Figure 12.
Urban hydrogeological conceptual site model in the Penafiel urban area (NW Portugal).
In the weathered zone (ranging 10–20 m), unconfined aquifer systems are found, with dominant interstitial permeability, hydraulic conductivity of over 0.1 m/day, and an effective porosity of around 5%. In deep fractured areas, zones of discontinuous circulation will occur, with hydraulic conductivity of less than 0.01 m/day, which may be compared to semi-confined aquifers.
The inventoried groundwater is short cycle, poorly mineralized water, mainly installed in the most altered and fractured area of the granite massif. At greater depths, there will be waters with longer residence time in the reservoir and higher mineralization.
6. Conclusions
The study of the ancient water supply system of the Penafiel urban area (NW Portugal) was performed to seek out the feasibility to recover the old water system, mainly springs, public fountains and community wash places. That approach was based on a comprehensive urban groundwater characterization and evaluation, including the understanding of the historical milestones of the urban water supply in the municipality of Penafiel (NW Portugal). In addition, a detailed survey, inventory, and inspection of the still accessible springs, water mines, and water facilities conservation state was performed.
According to hydro-historical studies (e.g., References [66,67]) and the results of current investigations, a water yield reference value of 34.5 m³/day (≈ 0.40 L/s) is obtained. Groundwater flow is mainly related with the Santa Marta spring. In fact, this value will partly guarantee a sustainable water supply to public fountains and urban green spaces. The connection to the public water supply should remain, which can be used whenever the water mine proves to be insufficient in order to ensure the reliable supply of the quantity and quality of water required. In order to take advantage of the water supply availability for irrigation of the green spaces, an alternating mode was suggested, i.e., during the day the supply of the fountains and at late evening switching of the flow to the irrigation of green spaces. In addition, this urban groundwater resources management is also environmentally balanced because of the water mine quality. According to the average irrigation requirements obtained by hydroclimatological analysis, a daily average of 13.3 m³ is considered acceptable to meet the needs of the grass-covered areas of the main city gardens (e.g., Sameiro Garden, Praça da República Garden, and Calvário Garden).
The proposed design and restoration of the ancient water supply system oriented to the irrigation of the main gardens and for the supply of some fountains will promote environmental protection, a design with nature and sustainable water resource management for the Penafiel city. A comprehensive approach is focused on the adaptation to climate changes and is suitable for reasoning planning and management of groundwater resources in a small-scale urban area.
Author Contributions
L.F. and H.I.C. designed the research. L.F., H.M., T.A., J.F.T., M.J.A., A.J.S.C.P. and H.I.C. gave input on the topics of fields survey and inventory, urban hydrogeology and hydrogeomorphology, hydro-historical milestones, and GIS mapping of the study site. A.J.S.C.P. contributed with radioisotope hydrology. T.A. and J.F.T. wrote the urban hydraulics section. All authors contributed to the data analysis, interpretation and discussed results. L.F. and H.I.C. wrote the manuscript with contributions of all authors. All authors have read and agreed to the published version of the manuscript.
Funding
The research was funded by a doctoral scholarship from the Portuguese Foundation for Science and Technology (FCT) to Liliana Freitas (SFRH/BD/117927/2016).
Acknowledgments
This study was carried out partially under the framework of the INTERREG IV SUDOE/SUD’EAU-2_S (CMP & Labcarga|ISEP), Labcarga|ISEP re-equipment program (IPP-ISEP|PAD’2007/08), GeoBioTec|UA (UID/GEO/04035/2019), CITEUC (UID/Multi/00611/2019), LRN|UC and REQUIMTE/LAQV. The research was also funded by a doctoral scholarship to L. Freitas (SFRH/BD/117927/2016) by FCT (Portuguese Foundation for Science and Technology) and to H. Meerkhan by GPSS|Foundation Casa do Regalo (Lisbon). The authors are grateful to J. Alves, P. Bessa, J. Teixeira, J. M. Carvalho, C. Delerue-Matos and R.L. Nagano for their support in some stages of the research. We acknowledge the anonymous reviewers for the constructive comments that helped to improve the focus of the manuscript.
Conflicts of Interest
The authors declare no conflict of interest.
References
- Tricart, J. Géomorphologie et Eaux Souterraines. Available online: https://iahs.info/uploads/dms/05603.pdf (accessed on 16 December 2019).
- Biswas, A.K. Sustainable water development for developing countries. Water Res. Develop. 1988, 4, 233–242. [Google Scholar] [CrossRef]
- Novotny, V. Sustainable urban water management. In Water and Urban Development Paradigms: Towards an Integration of Engineering, Design and Management Approaches, 1st ed.; Feyen, J., Shannon, K., Neville, M., Eds.; CRC Press, Taylor & Francis Group: Boca Raton, FL, USA, 2008. [Google Scholar]
- Vrba, J.; Th. Verhagen, B. Groundwater emergency situations: A methodological guide. In IHP-VII Series on Groundwater No. 3; International Hydrological Programme, Division of Water Sciences, UNESCO: Paris, France, 2011. [Google Scholar]
- Van Leeuwen, K.; Frijns, J.; van Wezel, A.; van de Ven, F.H.M. Cities blueprints: 24 indicators to assess the sustainability of the urban water cycle. Water Res. Manag. 2012, 26, 2177–2197. [Google Scholar] [CrossRef]
- Martínez-Navarrete, C.; Jiménez-Madrid, A.; Castaño, S.; Luquem, J.A.; Carrasco, F. Integration of groundwater protection for human consumption in land use planning. Eur. Geol. J. 2013, 38, 53–58. [Google Scholar]
- Petitta, M. New challenges for hydrogeologists. Eur. Geol. J. 2013, 35, 6–8. [Google Scholar]
- Foster, S.; MacDonald, A. The ‘water security’ dialogue: Why it needs to be better informed about groundwater. Hydrogeol. J. 2014, 22, 1489–1492. [Google Scholar] [CrossRef]
- McDonald, R.; Weber, K.; Padowski, J.; Floerke, M.; Schneider, C.; Green, P.; Gleeson, T.; Eckman, S.; Lehner, B.; Balk, D.; et al. Water on an urban planet: Urbanization and the reach of urban water infrastructure. Glob. Environ. Chang. 2014, 27, 96–105. [Google Scholar] [CrossRef]
- Kaushal, S.S.; McDowell, W.H.; Wollheim, W.M.; Johnson, T.A.N.; Mayer, P.M.; Belt, K.T.; Pennino, M.J. Urban evolution: The role of water. Water 2015, 7, 4063–4087. [Google Scholar] [CrossRef]
- Koop, S.H.A.; van Leeuwen, C.J. Assessment of the sustainability of water resources management: A critical review of the city blueprint approach. Water Res. Manag. 2015, 29, 5649–5670. [Google Scholar] [CrossRef]
- Chaminé, H.I.; Gómez-Gesteira, M. Sustainable resource management: Water practice issues. Sustain. Water Resour. Manag. 2019, 5, 3–9. [Google Scholar] [CrossRef]
- Gundaa, T.; Hess, D.; Hornberger, G.M.; Worland, S. Water security in practice: The quantity-quality-society nexus. Water Securit. 2019, 6, 100022. [Google Scholar] [CrossRef]
- UN—United Nations. Transforming Our World: The 2030 Agenda for Sustainable Development; United Nations: New York, NY, USA, 2015. [Google Scholar]
- UN—United Nations. Tracking Progress towards Inclusive, Safe, Resilient and Sustainable Cities and Human Settlements; SDG 11 Synthesis Report; United Nations High Level Political Forum: Nairobi, Kenya, 2018. [Google Scholar] [CrossRef]
- UN—United Nations. Water and Sanitation Interlinkages across the 2030 Agenda for Sustainable Development; United Nations: Geneva, Switzerland, 2016. [Google Scholar]
- Guppy, L.; Uyttendaele, P.; Villholth, K.G.; Smakhtin, V. Groundwater and Sustainable Development Goals: Analysis of Interlinkages; UNU-INWEH Report Series, Issue 04; United Nations, University Institute for Water, Environment and Health: Hamilton, ON, Canada, 2018. [Google Scholar]
- Hoekstra, A.Y.; Buurman, J.; van Ginkel, K.C.H. Urban water security: A review. Environ. Res. Lett. 2018, 13, 053002. [Google Scholar] [CrossRef]
- Tortajada, C.; Biswas, A.K. Water as a human right. Int. J. Water Res. Develop. 2017, 33, 509–511. [Google Scholar] [CrossRef]
- Guimarães, L.; Guilhermino, L.; Afonso, M.J.; Marques, J.M.; Chaminé, H.I. Assessment of urban groundwater: Towards integrated hydrogeological and effects-based monitoring. Sustain. Water Resour. Manag. 2019, 5, 217–233. [Google Scholar] [CrossRef]
- Garrick, D.; De Stefano, L.; Yu, W.; Jorgensen, I.; O’Donnell, E.; Turley, L.; Aguilar-Barajas, I.; Dai, X.; Souza-Leão, R.; Punjabi, B.; et al. Rural water for thirsty cities: A systematic review of water reallocation from rural to urban regions. Environ. Res. Lett. 2019, 14, 043003. [Google Scholar] [CrossRef]
- Margat, J.; van der Gun, J. Groundwater around the World: A Geographic Synopsis; CRC Press, Taylor & Francis Group: Boca Raton, FL, USA, 2013. [Google Scholar]
- Chaminé, H.I. Water resources meet sustainability: New trends in environmental hydrogeology and groundwater engineering. Environ. Earth Sci. 2015, 73, 2513–2520. [Google Scholar] [CrossRef]
- Kresik, N.; Mikszewski, A. Hydrogeological Conceptual Site Models: Data Analysis and Visualization; CRC Press, Taylor and Francis Group: Boca Raton, FL, USA, 2013. [Google Scholar]
- Chaminé, H.I.; Carvalho, J.M.; Teixeira, J.; Freitas, L. Role of hydrogeological mapping in groundwater practice: Back to basics. Eur. Geol. J. 2015, 40, 34–42. [Google Scholar]
- Chaminé, H.I.; Teixeira, J.; Freitas, L.; Pires, A.; Silva, R.S.; Pinho, T.; Monteiro, R.; Costa, A.L.; Abreu, T.; Trigo, J.F.; et al. From engineering geosciences mapping towards sustainable urban planning. Eur. Geol. J. 2016, 41, 16–25. [Google Scholar]
- Enemark, T.; Peeters, L.J.M.; Mallants, D.; Batelaan, O. Hydrogeological conceptual model building and testing: A review. J. Hydrol. 2018, 569, 310–329. [Google Scholar] [CrossRef]
- Sui, D.Z. GIS-based urban modelling: Practices, problems and prospects. Int. J. Geogr. Inf. Sci. 1998, 12, 651–671. [Google Scholar] [CrossRef]
- Legrand, H.E.; Rosen, L. Systematic makings of early stage hydrogeologic conceptual models. Ground Water 2000, 38, 887–893. [Google Scholar] [CrossRef]
- Gogu, R.C.; Carabin, G.; Hallet, V.; Peters, V.; Dassargues, A. GIS-based hydrogeological databases and groundwater modelling. Hydrogeol. J. 2001, 9, 555–569. [Google Scholar] [CrossRef]
- Griffiths, J.S.; Stokes, M. Engineering geomorphological input to ground models: An approach based on earth systems. Q. J. Eng. Geol. Hydrogeol. 2008, 41, 73–91. [Google Scholar] [CrossRef]
- Ballukraya, P.N.; Kalimuthu, R. Quantitative hydrogeological and geomorphological analyses for groundwater potential assessment in hard rock terrains. Current Sci. 2010, 98, 253–259. [Google Scholar]
- Zaporozec, A. Groundwater contamination inventory: A methodological guide with a model legend for groundwater contamination inventory and risk maps. In IHP-VII Series on Groundwater No. 2; International Hydrological Programme, Division of Water Sciences, UNESCO: Paris, France, 2004. [Google Scholar]
- Freitas, L.; Afonso, M.J.; Pereira, A.J.S.C.; Delerue-Matos, C.; Chaminé, H.I. Assessment of sustainability of groundwater in urban areas (Porto, NW Portugal): A GIS mapping approach to evaluate vulnerability, infiltration and recharge. Environ. Earth Sci. 2019, 78, 140. [Google Scholar] [CrossRef]
- Freitas, L.; Chaminé, H.I.; Pereira, A.J.S.C. Coupling groundwater GIS mapping and geovisualisation techniques in urban hydrogeomorphology: Focus on methodology. SN Appl. Sci. 2019, 1, 490. [Google Scholar] [CrossRef]
- Gogu, R.C.; Dassagues, A. Current trends and future challenges in groundwater vulnerability assessment using overlay and index methods. Environ. Geol. 2000, 39, 549–559. [Google Scholar] [CrossRef]
- Aller, L.; Bennet, T.; Lehr, J.H.; Petty, R.J. DRASTIC: A Standardized System for Evaluating Groundwater Pollution Potential Using Hydrologic Settings; US EPA Report, 600/2-87/035; Robert, S. Kerr Environmental Research Laboratory: Ada, OK, USA, 1987. [Google Scholar]
- Foster, S.D.; Hirata, R.; Gomes, D.; D’Elia, M.; Paris, M. Groundwater Quality Protection: A Guide for Water Utilities, Municipal Authorities, and Environment Agencies; The World Bank: Washington, DC, USA, 2002. [Google Scholar]
- Denny, S.C.; Allen, D.N.; Journeay, J.M. DRASTIC-Fm: A modified vulnerability mapping method for structurally controlled aquifers in the southern Gulf Islands, British Columbia, Canada. Hydrogeol. J. 2007, 15, 483–493. [Google Scholar] [CrossRef]
- Civita, M.V. The combined approach when assessing and mapping groundwater vulnerability to contamination. J. Water Resour. Prot. 2010, 2, 14–28. [Google Scholar] [CrossRef]
- Ribeiro, L.; Pindo, J.C.; Dominguez-Granda, L. Assessment of groundwater vulnerability in the Daule aquifer, Ecuador, using the susceptibility index method. Sci. Total Environ. 2017, 574, 1674–1683. [Google Scholar] [CrossRef]
- Jaiswal, R.K.; Mukherjee, S.; Krishnamurthy, J.; Saxena, R. Role of remote sensing and GIS techniques for generation of groundwater prospect zones towards rural development: An approach. Int. J. Remote Sens. 2003, 24, 993–1008. [Google Scholar] [CrossRef]
- Yeh, H.-F.; Lee, C.-H.; Hsu, K.-C.; Chang, P.-H. GIS for the assessment of the groundwater recharge potential zone. Environ. Geol. 2009, 58, 185–195. [Google Scholar] [CrossRef]
- Jha, M.K.; Chowdhury, A.; Chowdary, V.; Peiffer, S. Groundwater management and development by integrated remote sensing and geographic information systems: Prospects and constraints. Water Resour. Manag. 2007, 21, 427–467. [Google Scholar] [CrossRef]
- Teixeira, J.; Chaminé, H.I.; Carvalho, J.M.; Pérez-Alberti, A.; Rocha, F. Hydrogeomorphological mapping as a tool in groundwater exploration. J. Maps 2013, 9, 263–273. [Google Scholar] [CrossRef]
- Teixeira, J.; Chaminé, H.I.; Espinha Marques, J.; Carvalho, J.M.; Pereira, A.J.; Carvalho, M.R.; Fonseca, P.E.; Pérez-Alberti, A.; Rocha, F. A comprehensive analysis of groundwater resources using GIS and multicriteria tools (Caldas da Cavaca, Central Portugal): Environmental issues. Environ. Earth Sci. 2015, 73, 2699–2715. [Google Scholar] [CrossRef]
- Afonso, M.J.; Freitas, L.; Chaminé, H.I. Groundwater recharge in urban areas (Porto, NW Portugal): The role of GIS hydrogeology mapping. Sustain. Water Resour. Manag. 2019, 5, 203–216. [Google Scholar] [CrossRef]
- Kim, G.-B.; Ahn, J.-S.; Marui, A. Analytic hierarchy models for regional groundwater monitoring well allocation in Southeast Asian countries and South Korea. Environ. Earth Sci. 2009, 59, 325–338. [Google Scholar] [CrossRef]
- Saaty, T.L. Decision Making for Leaders: The Analytic Hierarchy Process for Decisions in a Complex World, 3rd ed.; RWS Publications: Pittsburgh, PA, USA, 2012. [Google Scholar]
- Brunelli, M. Introduction to the Analytic Hierarchy Process. In SpringerBriefs in Operations Research; Springer: Berlin, Germany, 2015. [Google Scholar]
- Mu, E.; Pereyra-Rojas, M. Understanding the Analytic Hierarchy Process; Springer: Cham, Switzerland, 2017. [Google Scholar]
- Afonso, M.J.; Chaminé, H.I.; Carvalho, J.M.; Marques, J.M.; Gomes, A.; Araújo, M.A.; Fonseca, P.E.; Teixeira, J.; Marques da Silva, M.; Rocha, F. Urban Groundwater Resources: A Case Study of Porto City in Northwest Portugal. In Urban Groundwater: Meeting the Challenge; Howard, K.W.F., Ed.; International Association of Hydrogeologists Selected Papers SP8; CRC Press, Taylor & Francis Group: London, UK, 2007; pp. 271–287. [Google Scholar]
- INE—Instituto Nacional de Estatística. Informação estatística sobre a população portuguesa: Concelho de Penafiel. 2011. Available online: https://www.ine.pt/ (accessed on 5 February 2019).
- Medeiros, A.; Pereira, E.; Moreira, A. Carta Geológica de Portugal, escala 1/50.000. Folha 9-D (Penafiel); Serviços Geológicos de Portugal: Lisboa, Portugal, 1981. [Google Scholar]
- McKnight, T.L.; Hess, D. Climate Zones and Types: The Köppen System; Prentice Hall: Upper Saddle River, NJ, USA, 2000. [Google Scholar]
- Peel, M.C.; Finlayson, B.L.; McMahon, T.A. Updated world map of the Köppen-Geiger climate classification. Hydrol. Earth Syst. Sci. 2007, 11, 1633–1644. [Google Scholar] [CrossRef]
- Silva, A.F. Problems of agency and technological issues in the municipalisation of water supply systems, Portugal (1850–1930). In Proceedings of the Seventh International Conference on Urban History: European City in Comparative Perspective, Athens, Greece, 27–30 October 2004; pp. 1–35. [Google Scholar]
- Pires de Almeida, M.A. The Portuguese Cholera morbus epidemic of 1853-56 as seen by the press. Not. Record. Royal Soc. 2012, 66, 41–53. [Google Scholar] [CrossRef]
- Chaminé, H.I.; Afonso, M.J.; Freitas, L. From historical hydrogeological inventory through GIS mapping to problem solving in urban groundwater systems. Eur. Geol. J. 2014, 38, 33–39. [Google Scholar]
- Freitas, L.; Afonso, M.J.; Devy-Vareta, N.; Marques, J.M.; Gomes, A.; Chaminé, H.I. Coupling hydrotoponymy and GIS cartography: A case study of hydro-historical issues in urban groundwater systems, Porto, NW Portugal. Geogr. Res. 2014, 52, 182–197. [Google Scholar] [CrossRef]
- Afonso, M.J.; Freitas, L.; Pereira, A.J.S.C.; Neves, L.J.P.F.; Guimarães, L.; Guilhermino, L.; Mayer, B.; Rocha, F.; Marques, J.M.; Chaminé, H.I. Environmental groundwater vulnerability assessment in urban water mines (Porto, NW Portugal). Water 2016, 8, 499. [Google Scholar] [CrossRef]
- Afonso, M.J.; Freitas, L.; Devy-Vareta, N.; Teixeira, J.; Fontes, G.; Chaminé, H.I. Cartografia subterrânea dos antigos mananciais de Paranhos e Salgueiros para o abastecimento de água à cidade do Porto (NW de Portugal): Contexto e marcos históricos. In Xeomorfoloxía e Paisaxes Xeográficas: Catro décadas de investigación e Ensino; Blanco Chao, R., Castillo-Rodríguez, F., Costa-Casáis, M., García, J.H., Valcárcel-Díaz, M., Eds.; Homenaxe a Augusto Pérez Alberti. Série Homenaxes, Universidade de Santiago de Compostela Publicacións: Santiago de Compostela, Spain, 2018; pp. 261–292. [Google Scholar]
- Landmann, G. Historical, Military, and Picturesque Observations on Portugal, Illustrated by Seventy-Five Coloured Plates, including Authentic Plans of the Sieges and Battles Fought in the Peninsula during the Later War; Printed by T. Cadell and W. Davies; W. Bulmer & Co.: London, UK, 1821; Volume 2, pp. 258–259. [Google Scholar]
- MI-DGS—Ministério do Interior da Direcção Geral de Saúde. Notícia dos inquéritos de higiene rural e sobre águas e esgotos. Volume II—Águas e esgotos (questionário e respostas circular n.º 1:087 da Direcção Geral de Saúde, de 7 de Dezembro de 1932, informações complementares, pareceres do Conselho Superior de Higiene e da Junta Sanitária de Águas); Ministério do Interior da Direcção Geral de Saúde, Imprensa Nacional de Lisboa: Lisboa, Portugal, 1935; p. 671. [Google Scholar]
- MOPC—Ministério das Obras Públicas e Comunicações. Inquérito sôbre o abastecimento de águas e saneamento das sedes de concelho do País, realizado pela comissão de engenheiros nomeada pelo Ministro das Obras Públicas e Comunicações por portarias de 12 de Janeiro e 23 de Maio de 1934. Distrito do Porto; In Águas e saneamento aos concelhos—praias e termas; Mercados e matadouros; Ministério das Obras Públicas e Comunicações: Lisboa, Portugal, 1935; pp. 221–236. [Google Scholar]
- Vieira de Campos, R.G. Projecto de pesquizas e captação de água, no logar de Parafita, destinada ao abastecimento da cidade de Penafiel (distrito do Porto, concelho de Penafiel, lugar das duas egrejas). Peças escritas e desenhadas; Ministério das Obras Públicas e Comunicações, Direcção Geral dos Serviços Hidráulicos e Eléctricos, 1ª Direcção de Hidráulica- Douro (Águas e Saneamento): Lisboa, Portugal, 1937; p. 23, (unpublished report). [Google Scholar]
- Valente, M.F.N. Parecer hidrogeológico sobre a possibilidade de interferências doutras captações nas obras que realizam o abastecimento de águas de Penafiel; Secção de Melhoramentos de Águas e Saneamento da Direcção Geral dos Serviços Hidráulicos e Eléctricos: Lisboa, Portugal, 1943; p. 13, (unpublished report). [Google Scholar]
- Velloso D´Andrade, J.S. Memoria sobre chafarizes, bicas, fontes, e poços públicos de Lisboa, Belem, e muitos logares do termo. Offerecida á ex.ma camara municipal de Lisboa; Na Imprensa Silviana: Lisboa, Portugal, 1851. [Google Scholar]
- Ribeiro, C. Reconhecimento geologico e hydrologico dos terrenos das visinhanças de Lisboa, com relação ao abastecimento das aguas desta cidade; Na Typographia da Mesma Academia (Real das Sciencias): Lisboa, Portugal, 1857. [Google Scholar]
- Nery Delgado, J.F. Apontamentos para servirem de base ao estudo do projecto de abastecimento de aguas da villa da Figueira. Rev. Obras Publ. Min. 1879, 10, 269–277. [Google Scholar]
- Cecilio da Costa, J. Memoria sobre o saneamento da cidade de Coimbra, esgotos e irrigações; Imprensa da Universidade: Coimbra, Portugal, 1880. [Google Scholar]
- Bourbon e Noronha, T. As Aguas do Porto. Bachelor’s Thesis, Escola Médico-Cirúrgica do Porto, Porto, Portugal, 1885. (In Portuguese). [Google Scholar]
- Choffat, P. Relatorio hydro-geologico sobre o abastecimento d’agua da cidade de Guimarães. In Apontamentos para a historia do concelho de Guimarães: Abastecimento d’aguas potaveis; D’Oliveira Guimarães, J.G., Ed.; Typografia A.J. da Silva Teixeira, Successora: Porto, Portugal, 1898; pp. 82–116. [Google Scholar]
- Ferreira da Silva, A.J. Contribuições para a hygiene da cidade do Porto; Typographia A.J. da Silva Teixeira, Successora: Porto, Portugal, 1889. [Google Scholar]
- Brandão, J.M.; Callapez, P.M. O abastecimento de água à Figueira da Foz em finais de Oitocentos: Comodidade e modernidade; Município da Figueira da Foz: Figueira da Foz, Portugal, 2017. [Google Scholar]
- Antunes, I.M.H.R.; Gonçalves, L.M.B. The “Sete Fontes” groundwater system (Braga, NW Portugal): Historical milestones and urban assessment. Sustain. Water Resour. Manag. 2019, 5, 235–248. [Google Scholar] [CrossRef]
- Lardner, W. History of the progress of the malignant cholera from Oporto to Lisbon. The Lancet 1834, 23, 314–320. [Google Scholar] [CrossRef]
- Bernardino Gomes, A. Aperçu historique sur les épidémies de choléra-morbus et de fièvre jaune en Portugal, dans les années de 1833-1865, par le Délégué du Gouvernement Portugais a La Conférence Sanitaire Internationale Réunie à Constantinople; Imprimerie Centrale: Constantinople, Turkey, 1866; pp. 1–30. [Google Scholar]
- Labcarga|ISEP (Laboratório de Cartografia e Geologia Aplicada, Instituto Superior de Engenharia do Porto). Recuperação do antigo sistema hídrico de águas naturais para o abastecimento de água aos principais jardins do Concelho de Penafiel. 1ª Fase (Caracterização hidrogeológica e avaliação dos recursos hídricos subterrâneos); Relatório Final; Instituto Superior de Engenharia do Porto: Porto, Portugal, 2014; p. 123, (unpublished report). [Google Scholar]
- Freitas, L. Avaliação integrada de recursos hídricos em áreas urbanas: Aplicações para a sustentabilidade e o ordenamento territorial. Ph.D. Thesis, University of Coimbra, Coimbra, Portugal, 2019. [Google Scholar]
- Vieira, J.A. O Minho Pittoresco; Tomo II. Livraria de António Maria Pereira: Lisboa, Portugal, 1887. [Google Scholar]
- Afonso, M.J.; Chaminé, H.I.; Marques, J.M.; Carreira, P.M.; Guimarães, L.; Guilhermino, L.; Gomes, A.; Fonseca, P.E.; Pires, A.; Rocha, F. Environmental issues in urban groundwater systems: A multidisciplinary study of the Paranhos and Salgueiros spring. Environ. Earth Sci. 2010, 61, 379–392. [Google Scholar] [CrossRef]
- Barroso, M.F.; Ramalhosa, M.J.; Olhero, A.; Antão, M.C.; Pina, M.F.; Guimarães, L.; Teixeira, J.; Afonso, M.J.; Delerue-Matos, C.; Chaminé, H.I. Assessment of groundwater contamination in an agricultural peri-urban area (NW Portugal): An integrated approach. Environ. Earth Sci. 2015, 73, 2881–2894. [Google Scholar] [CrossRef]
- Pereira, A.J.S.C.; Godinho, M.M.; Neves, L.J.P.F. On the influence of faulting on small-scale soil-gas radon variability: A case study in the Iberian Uranium Province. J. Environ. Radioact. 2010, 101, 875–882. [Google Scholar] [CrossRef]
- Pereira, A.J.S.C.; Neves, L.J.P.F. Estimation of the radiological background and dose assessment in areas with naturally occurring uranium geochemical anomalies: A case study in the Iberian Massif (Central Portugal). J. Environ. Radioact. 2012, 112, 96–107. [Google Scholar] [CrossRef]


© 2020 by the authors. Licensee MDPI, Basel, Switzerland. This article is an open access article distributed under the terms and conditions of the Creative Commons Attribution (CC BY) license (http://creativecommons.org/licenses/by/4.0/).