Abstract
Particle size distribution is one of the most significant factors determining physical soil properties. Laser diffraction analysis (LDA) is an alternative method to the traditional hydrometric methods (HM) used to determine particle size distribution in soils. However, significant differences in fraction content are found in relation to the applied methods of a particle size test. Above all, measurements performed by LDA for clayey soils usually produce different results to those based on Stokes’ equation. Methodical problems, such as an appropriate method of dispersing the sample and the selection of LDA calculation theory, also play a significant role in fine soils. This paper contains the results of analyses of Neogene clays from Poland, which are characterized by differentiation with regard to the content of clay fraction particles. In this article, the validity of using laser diffraction analysis (LDA) for the identification and characterization of clayey sediments with common genesis is assessed. The possibility of finding reliable pedotransfer functions to the convert LDA results to a hydrometric analysis is discussed.
1. Introduction
Particle size distribution (PSD) determines physical and mechanical soil properties. The proportion of grains and particles of a particular fraction (gravel, sand, silt, clay) is also an essential criterion for their classification.
One of the modern methods, an alternative to traditional hydrometric methods (HM), used in granulometric analyses is laser diffraction analysis (LDA) [1]. The strengths of this technique are the simplicity of use, the rapidity of measurements, the broad measurement range (from 0.01 μm to several millimeter), and high reproducibility [2].
The principle of LDA is the detection of the diffraction pattern created by the particles illuminated by laser light. This diffracted pattern is mainly dependent on the particles size in the sample to be investigated. However, the use of LDA to determine the PSD of soil has also some limitations. Primarily, substantial distinctness in measurement techniques causes difficulties in the interpretation and comparison between the results obtained by LDA and the standardized HM [1,2]. This is relevant when PSD is used as the basis for soil classification.
The biggest discrepancies are observed in the finest clay particles, e.g., [3,4,5,6,7,8]. The discussion concerns inter alia—the standardization of the methodology for sample pretreatment. Particularly important in the case of clay soils, is the method of dispersing particles and stabilizing suspension [9,10,11]. In addition, the obtained calculation of the particle size distribution is significantly influenced by the selection of a computational model adopted for the approximation of the scattered image of a laser beam after passing through a sample. For clays with sizes close to the wavelength of a laser beam, Mie theory would be desirable, requiring consideration of a particle’s optical parameters, such as the refractive index for liquids and the absorption coefficient [11,12,13,14]. Due to the difficulty in the selection of these values, especially the light absorption coefficients for various particles and soil grains, Fraunhofer theory, which only takes into account the occurrence of light diffraction at the edges of particles and grains, is often recommended for natural soils [15,16,17]. Technical parameters of analyzers, such as a measuring range, especially the lower limit of the size of detected particles and the wavelength of laser light, also affect the results [2].
Regardless of the difficulties described, the LDA method is successfully used and positively verified to study the lithological variability of sediments, e.g., Palaeolithic clay-with-flints [17] or quaternary sediments, such as loess loams, glacial fluvial deposits, river sediments, and clays [18]. However, in each case, there is a clear indication to interpret the results individually, depending on the type and the genesis of sediment.
In this paper, the tests results of a hydrometric analysis and LDA for natural clayey sediments, particularly the impact of shape anisotropy, are discussed.
2. Materials and Methods
The tested material is a natural clayey soil, characterized by high contents of clay particles. Such Neogene sediments occur in a large area of Poland [19,20] with significant lithological diversity (Table 1).

Table 1.
The parameters of Neogene clays from the region of Poznan, Warsaw, and Bydgoszcz (after: [20,21,22] and the degree of their expansivity (according to [23])).
Comparative tests were carried out for 10 samples from Bydgoszcz. These soils are classified as ClV—clay with very high plasticity [24]. These are sodium montmorillonite clays, which are characterized by medium, high, and very high expansivity. Particle distribution was tested by the LDA and hydrometric (aerometric) method (HM). The areometric tests of clays were carried out in accordance with the standard [3]. LDA tests were carried out using a Fritsch Analysette 22 MicroTec device, equipped with a green laser (wavelength λ = 532 nm) and an infrared laser (λ = 940 nm). The full measuring range of the device is 0.08–2000 μm. After performing a preliminary series of tests of the grain size in the full measurement range, due to the lack of larger particles and grains in the tested soils, the measurement was limited to the range of 0.08–45 μm, with only the green laser. The Fraunhofer theory was used to calculate the PSD of investigated soils.
The dispersion of soil particles was carried out by a built-in ultrasonic module with a maximum power of 60 W and a wave frequency of 36 kHz. For samples containing clay particles, sodium hexametaphosphate, calgon or sodium pyrophosphate are usually used, e.g., [5,8,17], to stabilize the suspension. Earlier studies of Neogene clays [14] have shown that the addition of a dispersant has a significant impact on the results of particle distribution. The addition of sodium pyrophosphate initially (after 2–3 minutes) improved the dispersion of particles in the samples tested. In all the samples, the percentage of clay (<2 μm) increased significantly, compared to the maximum amounts for tests using only ultrasonic dispersion. However, with a longer duration of the test (after 5 minutes), a decrease in the number of fine particles, as well as a significant increase in the number of particles with a diameter in the range of 10–20 μm, was noted. This indicates the possibility of a coagulation process in the suspension and the instability of the samples with the dispersant. Therefore, tests for Neogene clays were performed in two variants: with ultrasonic dispersion and, additionally, with sodium pyrophosphate at the concentration of about 1.5 g/L of soil suspension.
3. Results and Discussion
3.1. Comparative Tests of HM and LDA
An important practical problem, for example, in the soil classification, is a significant difference in LDA results concerning particle size distribution in relation to hydrometric methods. It refers especially to clay particle content.
For this reason, to compare the results of both methods, the empirical determination of the LDA equivalent of the limits of each fraction is used. For the clay fraction, the values proposed in the literature range from 3.5 to 8 μm [9,14,25]. The relationship between the content of particles of diameters dHM < 2 μm, determined by the areometric method (HM) and the percentage of particles obtained by the LDA method for consecutive values of diameters, was compared, and then goodness of fit was analyzed. The maximum values of the coefficients of determination were obtained for the diameter dLDA = 4.6 μm for the samples tested without sodium pyrophosphate (R2 = 0.72) (Figure 1a), and dLDA = 4.4 μm for the soils tested with a dispersant (R2 = 0.44) (Figure 1b).
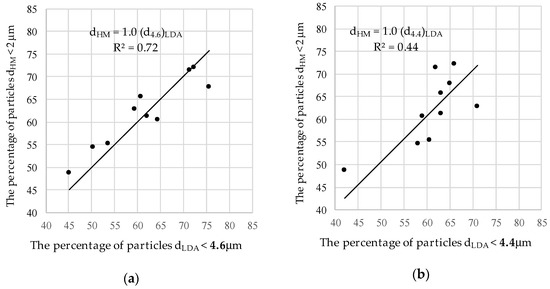
Figure 1.
The correlation between the percentage of clay particles from hydrometric analyses (dHM < 2 μm) and particle diameters from laser diffraction analysis (LDA) with the maximum values of the coefficient of determination: (a) dLDA < 4.6 μm for the samples tested without sodium pyrophosphate; (b) dLDA < 4.4 μm for the samples with sodium pyrophosphate.
Another method for the transformation between LDA and HM results is the use of the empirical relation between the percentage content of the boundary values of diameters, especially between clay and silt fractions (2 μm), in reference to each individual genetic soil types (Table 2).
Table 2.
Exemplary transfer function for HM and LDA percentage of particle below 2 μm.
The research carried out for Neogene clays from Bydgoszcz leads to the determination of the relation between the clay fraction content, which is obtained by hydrometric (ClHM) and laser (ClLDA) methods. The equations for samples with ultrasonic dispersion (Equation (1)) and for samples with ultrasonic and sodium pyrophosphate pretreatment (Equation (2)) are expressed as follows:
After the substitution of the ClLDA values into Formula (1), for samples with ultrasonic dispersion only, and in to formula (2), for samples with ultrasonic and sodium pyrophosphate pretreatment, the goodness of fit results (ClHMcal) versus HM results are presented in Figure 2a,b, respectively.
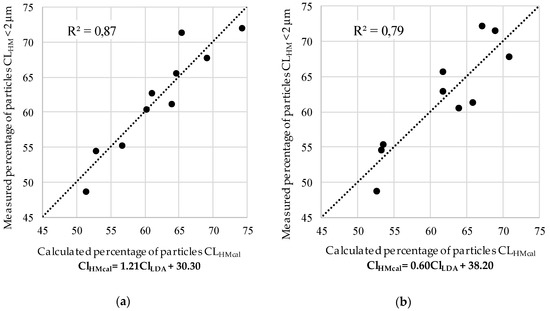
Figure 2.
The correlation between the clay content from HM (ClHM < 2 μm) and the ClHMcal, values calculated on the basis of LDA results (ClLDA < 2 μm): (a) calculated by Equation (1) for samples without a sodium pyrophosphate pretreatment; (b) calculated by Equation (2) for samples tested with a sodium pyrophosphate.
The difference in the percentage of clay fraction in HM and LDA is mainly suggested as an effect of the assumption of the spherical shape of particles, which is used in calculations of the particle size distribution, both in LDA and HM.
3.2. Influence of Particle Shape Anisotropy for LDA and HM Results
The shape of soil particles can be anisotropic, so, in fact, an equivalent spherical distribution of material is obtained, which has varied consequences for HM and LDA methods.
In LDA, the basis for determining the volume of clay particles is the diameter of the plate’s cross-section, which is treated in the calculations as the diameter of the sphere. The error associated with the assumption of the sphericity of particles depends on the degree of anisotropy, which is usually variable for soil particles of different sizes and is difficult to eliminate backwards in the calculation algorithm. The effects of the shape influences for the LDA of particle size distribution are usually estimated based on image analysis from a transmission electron microscope (TEM) [26,27,28]. The particles’ orientation during the flow through the measurement cell in LDA, which cannot be assumed as random [27], is also essential for the adequacy of the obtained results.
To minimalize the effect of shape anisotropy, various estimations of shape factors are considered and are theoretically or experimentally verified. For example, the equivalent circular area is indicated as the most comparable value for particle distribution for standardized rod particles [27]. In the case of platy particles, such as clay minerals, the highest adequacy is obtained when the results are related to the surface area [28]. For particles with a known aspect ratio (a ratio of thickness to their diameter) a volume equivalent disc can also be the most accurate representation [29]. However, this applies to cases of relatively homogeneous soils, when most particles have the shape of very thin plates, with similar thickness. In natural sediments, particles are characterized with a varied anisotropy of shape, as in the case of Neogene clays (Figure 3).
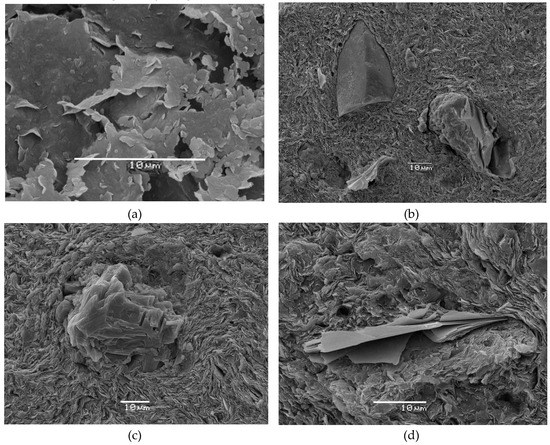
Figure 3.
Anisotropy of particles of Neogene clays from Bydgoszcz: (a–d) particles of clay and quartz, feldspar and mica grains.
For the tested soils, LDA results, calculated as an area dependent, are more relevant to those obtained by HM, than volume LDA, but exhibit varied accuracy for particular samples (Figure 4a,b).
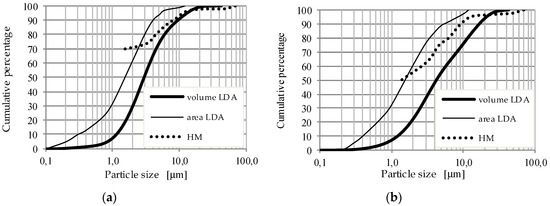
Figure 4.
The comparison of cumulative percentage of particle size distributions for two exemplary samples (a) and (b) of Neogene clays from Bydgoszcz, calculated as volume and area dependent from LDA and HM results.
Hydrometric methods (HM) used to determine the particle size distribution of fine-grained soils use Stokes’ law, which describes a resistance force of a sphere moving in a fluid. For ideal soil particles of spherical shape, Stokes’ equation is valid for diameters from about 0.2 μm, because Brownian motion may be significant for smaller particles [30]. For natural soils, according to procedure described in [3], the least size of the particle is limited to about 1 μm. An assumption about a spherical shape of particles causes the significant differences as it goes against the results taking into account their actual anisotropy, especially in the case of the finest particles [31,32].
To compensate for the influence of shape in sedimentation methods, the platy shape of clay minerals is most often described by an ellipsoid, formed by the rotation of an ellipse, around a short axis of the particle, e.g., [26,33,34]. For such a solid, the aspect ratio (E) is introduced as the relation of the shorter axis of the particle (b) to the longer axis (a), i.e., E = b/a.
The relationship between the equivalent sphere diameter (d), sedimenting at the same velocity as the ellipsoid describing the plate-shaped particle, is illustrated in Figure 5a:
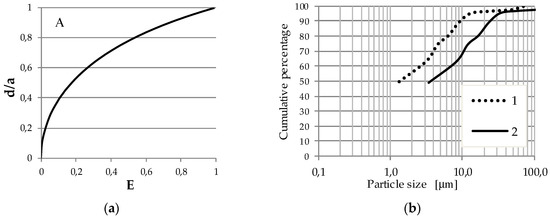
Figure 5.
(a) Relation of the diameter (d) to the longer axis of ellipsoid (a) in relation to the aspect ratio (E) (after: [34]); d—diameter of equivalent sphere particles, a – major axis of an ellipse, b—minor axis of an ellipse, E—aspect ratio (E = b/a). (b) Exemplary particle size distribution curves: 1—by HM, 2—after transformation for an aspect ratio E = 0.1 and d/a = 0.38 (after [35]).
Depending on the value of the shape factor (E), the equivalent diameter of the spherical particle (d) determined from Stokes’ equations will be a part of the dimension of the longer axis (a) of the ellipsoid, e.g., for E = 0.1 this relation according to Figure 5a is d/a = 0.38. For a particle size distribution curve, this means a translation of a granulometric curve towards larger diameters. An illustration of the particle size distribution transformation of an exemplary clay sample is shown in Figure 5 (b). In the case of this sample, the hydrometric determination for E = 1.0 (curve 1 in Figure 5b) showed a content of 56% of clay fraction particles (d < 2 μm). For the assumed shape factor E = 0.1 (curve 2 in Figure 5b), the particle, corresponding to 56% of the content, has the diameter of d = 5.2 μετηοm.
4. Conclusions
The application of laser diffraction analysis (LDA), which could replace the time-consuming hydrometric method (HM) of clayey soils, has been verified to date on various types of natural sediments. According to the investigations presented in this article, the usefulness of LDA for Neogene clays, which are widespread in Poland, was confirmed. However, on the basis of comparative studies, significant differences in the results obtained by the LDA method were found in relation to the results obtained by the areometric method (HM). The main reason for this phenomenon is seen in the shape anisotropy of clay particles.
The particle diameters of particles in the LDA method are determined in relation to their potential volume, which is calculated on the basis of an optical diffraction image at the edges of the particle cross-section. Therefore, their dimensions are usually overstated. In the case of HM analysis, the anisotropic platy shape of clay minerals causes a reduction in the size of the determined equivalent diameters in relation to the actual dimensions of the cross-section. As a solution that allows obtaining comparable results, it is proposed, for each of the soils individually, to introduce a clay fraction limit at a higher value for LDA method. For Neogene clays, the maximum values of correlation coefficients are obtained between the diameters dHM = 2 μm and dLDA = 4.6 μm or dLDA = 4.4 μm, depending on the method of sample pretreatment.
Another solution is to find the transforming functions for the boundary fraction values (Cl = 2.0 μm). As indicated by the research, it is not possible to establish common transformation equations applicable to all soils. This is a significant practical limitation of LDA in the particle size analysis of the soils. Additionally, the method of sample pretreatment, for example, the type of a chemical dispersant, also influences the results of analysis. For tested sodium montmorillonite clays, different dispersants should be tested for the best stability of suspension.
The theoretical recalculation of hydrometric particle size distribution, considering the ellipsoidal shape of clay particles, can also give satisfying effects in the transformation to LDA results. The accuracy of calculations, including the aspect ratio (E) for platy particles, mainly depends on the uniformity of the particles’ shapes in the sample.
Author Contributions
Conceptualization, A.G. and S.T.; methodology, A.G. and S.T.; software, S.T.; validation, A.G. and S.T.; formal analysis, A.G.; investigation, A.G. and S.T.; resources, A.G.; data curation, S.T.; writing—original draft preparation, A.G.; writing—review and editing, A.G. and S.T.; visualization, A.G. and S.T.; project administration, S.T.; funding acquisition, A.G. All authors have read and agreed to the published version of the manuscript.
Funding
The study was supported by RCI Laboratories: Laboratory of Expansive Soil Research and Laboratory of Materials Construction Research, at the UTP University of Science and Technology in Bydgoszcz
Conflicts of Interest
The authors declare no conflict of interest. The funders had no role in the design of the study; in the collection, analyses, or interpretation of data; in the writing of the manuscript, or in the decision to publish the results.
References
- ISO 13320-1. Particle size analysis – Laser diffraction methods, Part 1: General Principles; International Organization for Standardization: Geneva, Switzerland, 1999. [Google Scholar]
- Goossens, D. Techniques to measure grain-size distributions of loamy sediments: A comparative study of ten instruments for wet analysis. Sedimentology 2008, 55, 65–96. [Google Scholar] [CrossRef]
- EN ISO 17892-4. Geotechnical investigation and testing -- Laboratory testing of soil -- Part 4: Determination of particle size distribution; European Committee for Standarization: Brussels, Belgium, 2016. [Google Scholar]
- ASTM D7928–17. Standard test method for particle size distribution (gradation) of fine grained soils using the sedimentation (hydrometer) analysis; ASTM International: West Conshohocken, PA, USA, 2017. [Google Scholar]
- Beuselinck, L.; Govers, G.; Poesen, J.; Degraer, G.; Froyen, L. Grain-size analysis by laser diffractometry: comparison with the sieve-pipette method. Catena 1998, 32, 193–208. [Google Scholar] [CrossRef]
- Frankowski, Z.; Smagała, S. Przydatność metody laserowej w badaniach uziarnienia gruntów spoistych. In Proceedings of the XII Krajowa konferencja Mechaniki Gruntów i Fundamentowania, Szczecin-Międzyzdroje, Poland, 5–7 April 2000; pp. 163–171. [Google Scholar]
- Jonkers, L.; Prins, M.A.; Brummer, G.-J.A.; Konert, M.; Lougheed, B.C. Experimental insights into laser diffraction particle sizing of fine-grained sediments for use in palaeoceanography. Sedimentology 2009, 56, 2192–2206. [Google Scholar] [CrossRef]
- Di Stefano, C.; Ferro, V.; Mirabile, S. Comparison between grain-size analyses using laser diffraction and sedimentation methods. Biosyst. Eng. 2010, 106, 205–215. [Google Scholar] [CrossRef]
- Buurman, P.; Pape, T.; Muggler, C.C. LASER GRAIN-SIZE DETERMINATION IN SOIL GENETIC STUDIES 1. PRACTICAL PROBLEMS. Soil Sci. 1997, 162, 211–218. [Google Scholar] [CrossRef]
- Bieganowski, A.; Ryżak, M.; Witkowska-Walczak, B. Determination of soil aggregate disintegration dynamics using laser diffraction. Clay Miner. 2010, 45, 23–34. [Google Scholar] [CrossRef]
- Ryżak, M.; Bieganowski, A. Methodological aspects of determining soil particle-size distribution using the laser diffraction method. J. Plant Nutr. Soil Sci. 2011, 174, 624–633. [Google Scholar] [CrossRef]
- Eshel, G.; Levy, G.J.; Mingelgrin, U.; Singer, M.J. Critical evaluation of the use of laser diffraction for particle-size distribution analysis. Soil Sci. Soc. Am. J. 2004, 68, 736–743. [Google Scholar] [CrossRef]
- ArrayExpress — a database of functional genomics experiments. Available online: http://www.ebi.ac.uk/arrayexpress/ (accessed on 12 November 2012).
- Konert, M.; Vandenberghe, J. Comparison of laser grain size analysis with pipette and sieve analysis: a solution for the underestimation of the clay fraction. Sedimentol. 1997, 44, 523–535. [Google Scholar] [CrossRef]
- Keck, C.M.; Müller, R.H. Size analysis of submicron particles by laser diffractometry—90% of the published measurements are false. Int. J. Pharm. 2008, 355, 150–163. [Google Scholar] [CrossRef]
- Gorączko, A.; Topoliński, S. Possibilities of using laser diffraction analysis (LDA) techniques for the identification of Neogene clayey sediments from Bydgoszcz. Przegląd Geol. 2017, 65, 243–250. [Google Scholar]
- Scott-Jackson, J.E.; Walkington, H. Methodological issues raised by laser particle size analysis of deposits mapped as Clay-with-flints from the Palaeolithic site of Dickett‘s Field, Yarnhams Farm, Hampshire, UK. J. Archaeol. Sci. 2005, 32, 969–980. [Google Scholar] [CrossRef]
- Traubner, H.; Roth, B.; Tippkotter, R. Determination of soil texture: Comparison of sedimentation method and laser-diffraction analysis. J. Plant Nutr. Soil Sci. 2009, 172, 161–171. [Google Scholar] [CrossRef]
- Kaczynski, R.; Grabowska-Olszewska, B. Soil mechanics of the potentially expansive clays in Poland. Appl. Clay Sci. 1997, 11, 337–355. [Google Scholar] [CrossRef]
- Gorączko, A.; Kumor, M.K. Swelling of mio-pliocen clays from the region of Bydgoszcz in comparison to their lithology. Biuletyn PIG 2011, 446, 305–314. [Google Scholar]
- Przystański, J. Posadowienie Budowli na Gruntach Ekspansywnych, Rozprawy nr 244; Wydawnictwo Politechniki Poznańskiej: Poznań, Poland, 1991. [Google Scholar]
- Gawriuczenkow, I.; Wójcik, E. Comparison of expansive properties of Neogene clays from the Mazovia region. Przegl. Geol. 2013, 61, 243–247. [Google Scholar]
- Niedzielski, A. Factors affecting swelling pressure and free swelling of Poznań and Variegated clays. Rocz. Akad. Rol. w Pozn., Rozpr. Nauk. 1993, 238, 1–99. (in Polish). [Google Scholar]
- ISO 14688-2:2017 Geotechnical investigation and testing — Identification and classification of soil—Part 2: Principles for a classification; European Committee for Standarization: Brussels, Belgium, 2017.
- Makó, A.; Tóth, G.; Weynants, M.; Rajkai, K.; Hermann, T.; Tóth, B. Pedotransfer functions for converting laser diffraction particle-size data to conventional values. Eur. J. Soil Sci. 2017, 68, 769–782. [Google Scholar] [CrossRef]
- Jennings, B.R.; Parslow, K. Particle Size Measurement: The Equivalent Spherical Diameter. Proc. R. Soc. A: Math. Phys. Eng. Sci. 1988, 419, 137–149. [Google Scholar]
- Kelly, R.N.; Kazanjian, J. Commerical reference shape standards use in the study of particle shape effect on laser diffraction particle size analysis. AAPS PharmSciTech 2006, 7, E126–E137. [Google Scholar] [CrossRef]
- Bowen, P.; Sheng, J.; Jongen, N. Particle size distribution measurement of anisotropic—particles cylinders and platelets—practical examples. Powder Technol. 2002, 128, 256–261. [Google Scholar] [CrossRef]
- Dur, J.C.; Elsass, F.; Chaplain, V.; Tessier, D. The relationship between particle-size distribution by laser granulometry and image analysis by transmission electron microscopy in a soil clay fraction. Eur. J. Soil Sci. 2004, 55, 265–270. [Google Scholar] [CrossRef]
- Lamb, H. Hydrodynamics; HardPress Publishing: Los Angeles, CA, USA, 2013; p. 670. [Google Scholar]
- Nadeau, P.H. The physical dimensions of fundamental clay particles. Clay Miner. 1985, 20, 499–514. [Google Scholar] [CrossRef]
- Środoń, J. Direct High-Resolution Transmission Electron Microscopic Measurement of Expandability of Mixed-Layer Illite/Smectite in Bentonite Rock. Clays Clay Miner. 1990, 38, 373–379. [Google Scholar] [CrossRef]
- Jennings, B.R. Size and Thickness Measurement of Polydisperse Clay Samples. Clay Miner. 1993, 28, 485–494. [Google Scholar] [CrossRef]
- Chaney, R.; Demars, K.; Lu, N.; Ristow, G.; Likos, W. The Accuracy of Hydrometer Analysis for Fine-Grained Clay Particles. Geotech. Test. J. 2000, 23, 487. [Google Scholar] [CrossRef]
- Gorączko, A.; Topoliński, S. Influence of shape anisotropy on the results of grain size analysis of the clayey soils. Eng. Environ. Sci. 2018, 27, 142–151. [Google Scholar]
© 2020 by the authors. Licensee MDPI, Basel, Switzerland. This article is an open access article distributed under the terms and conditions of the Creative Commons Attribution (CC BY) license (http://creativecommons.org/licenses/by/4.0/).