
Detection of Dairy Herd Management Issues Using Fatty Acid Profiles Predicted by Mid-Infrared Spectrometry

 , , ,
, , ,  , , , and
Simple Summary
Abstract
1. Introduction
2. Materials and Methods
2.1. Belgian Dataset
2.2. Canadian Dataset
2.3. Unsupervised Learning
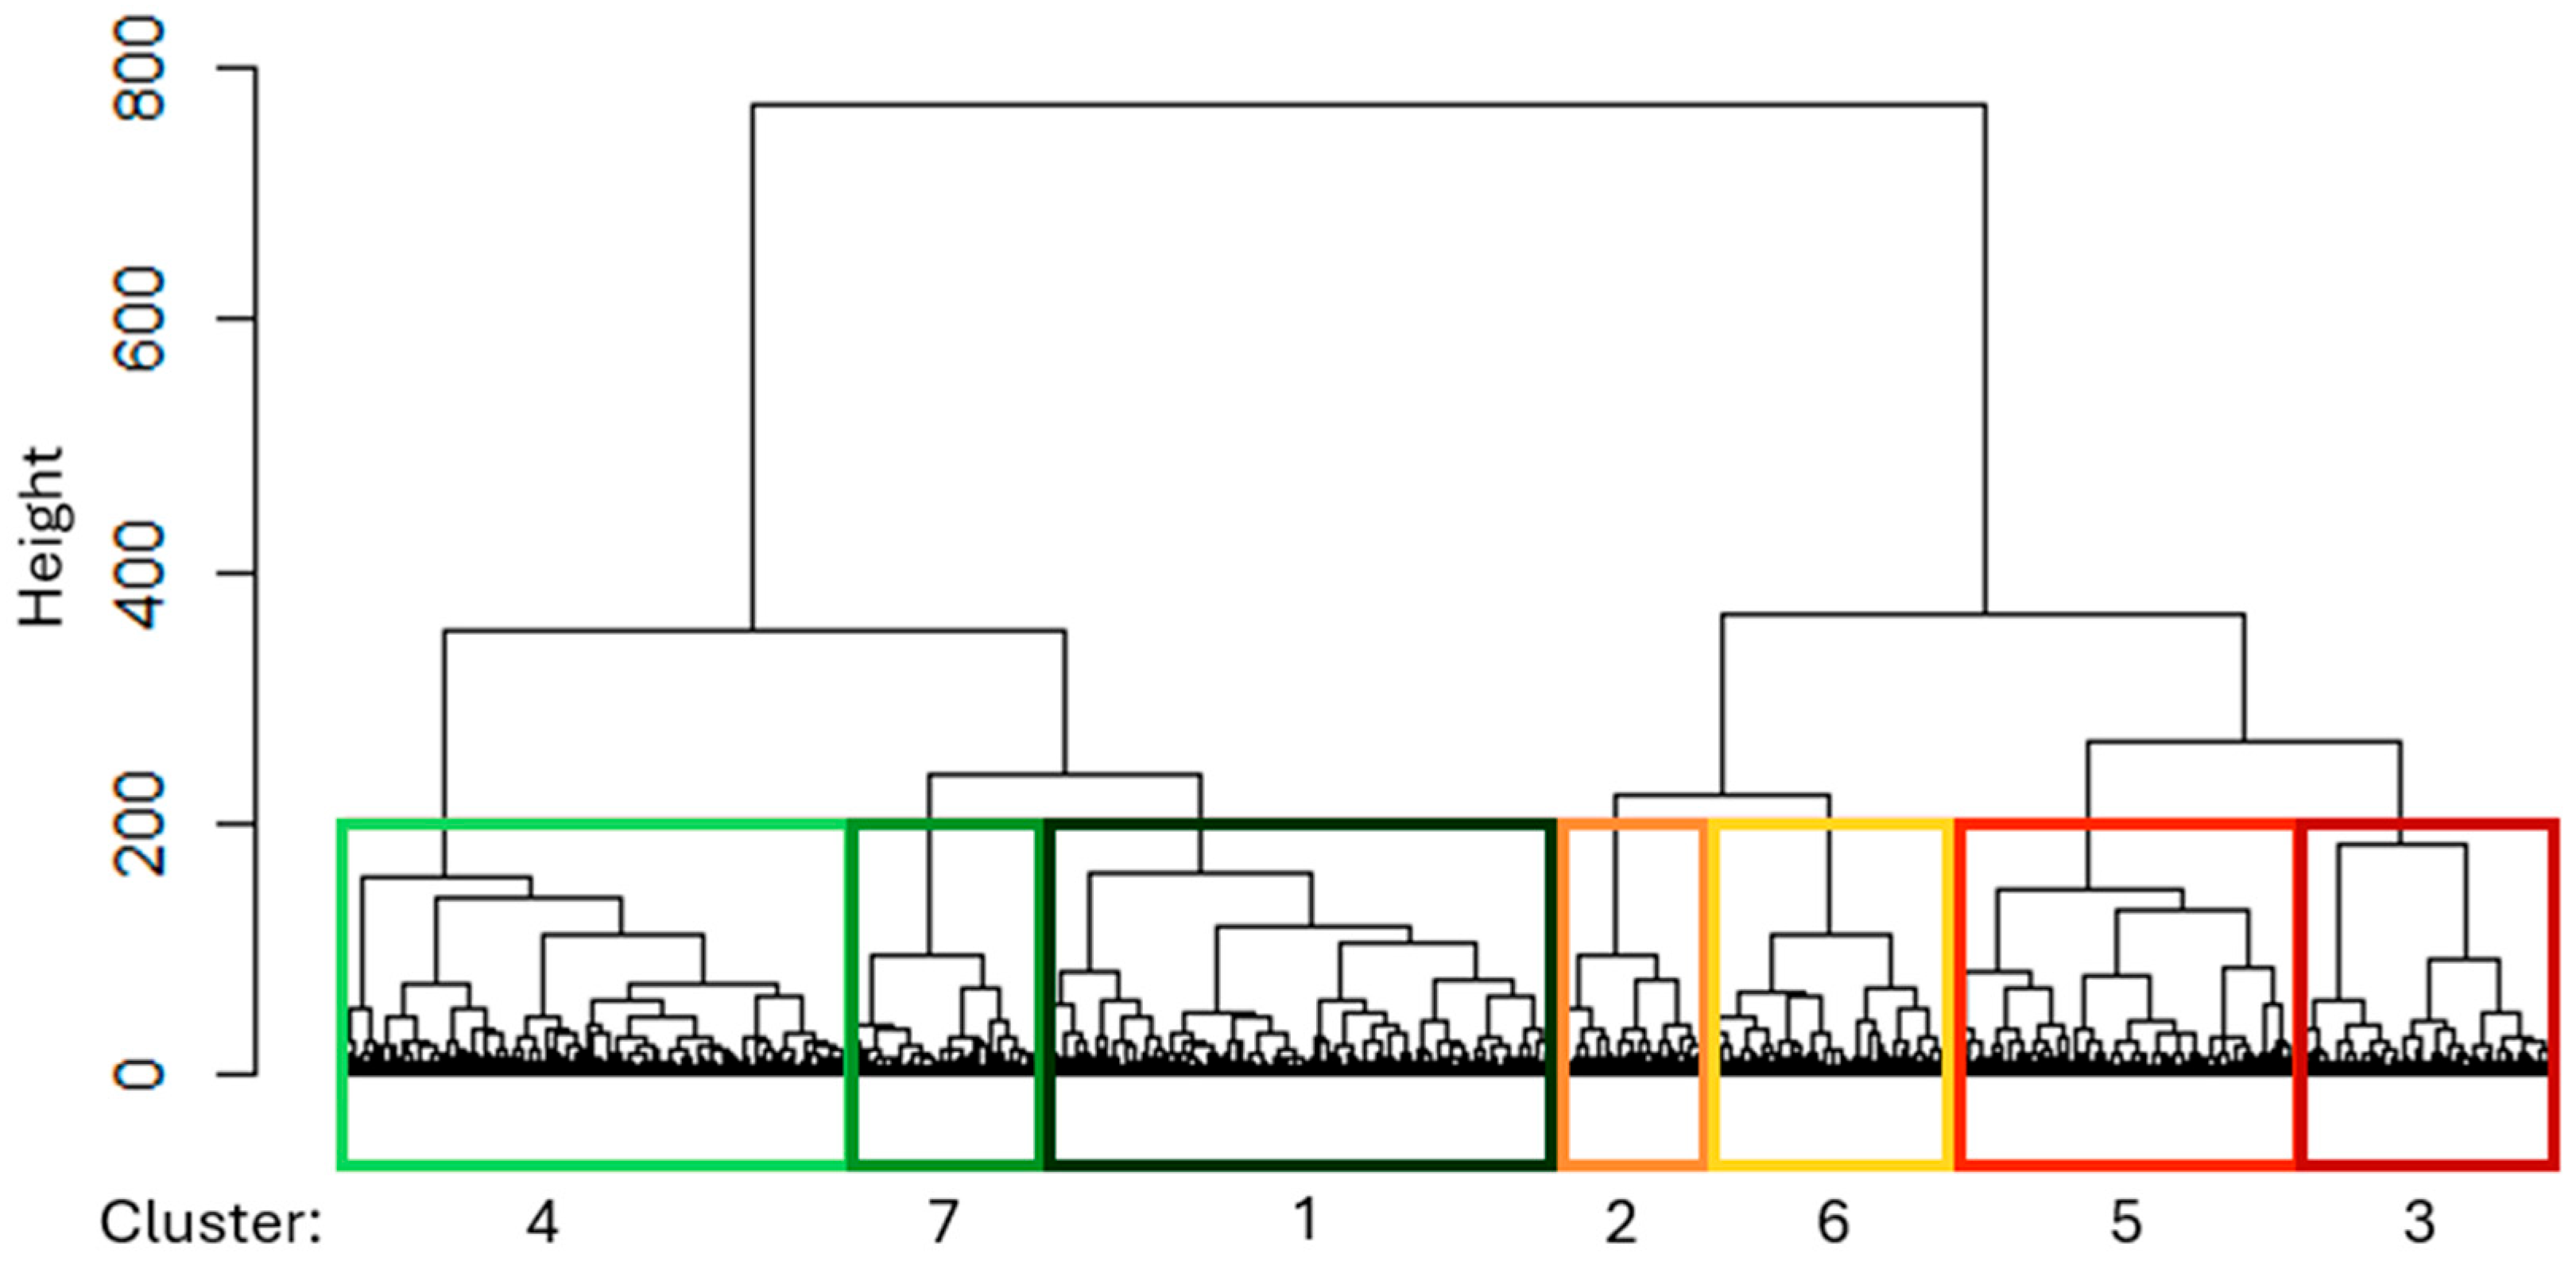
2.4. Hierarchical Clustering
2.5. Cluster Prediction
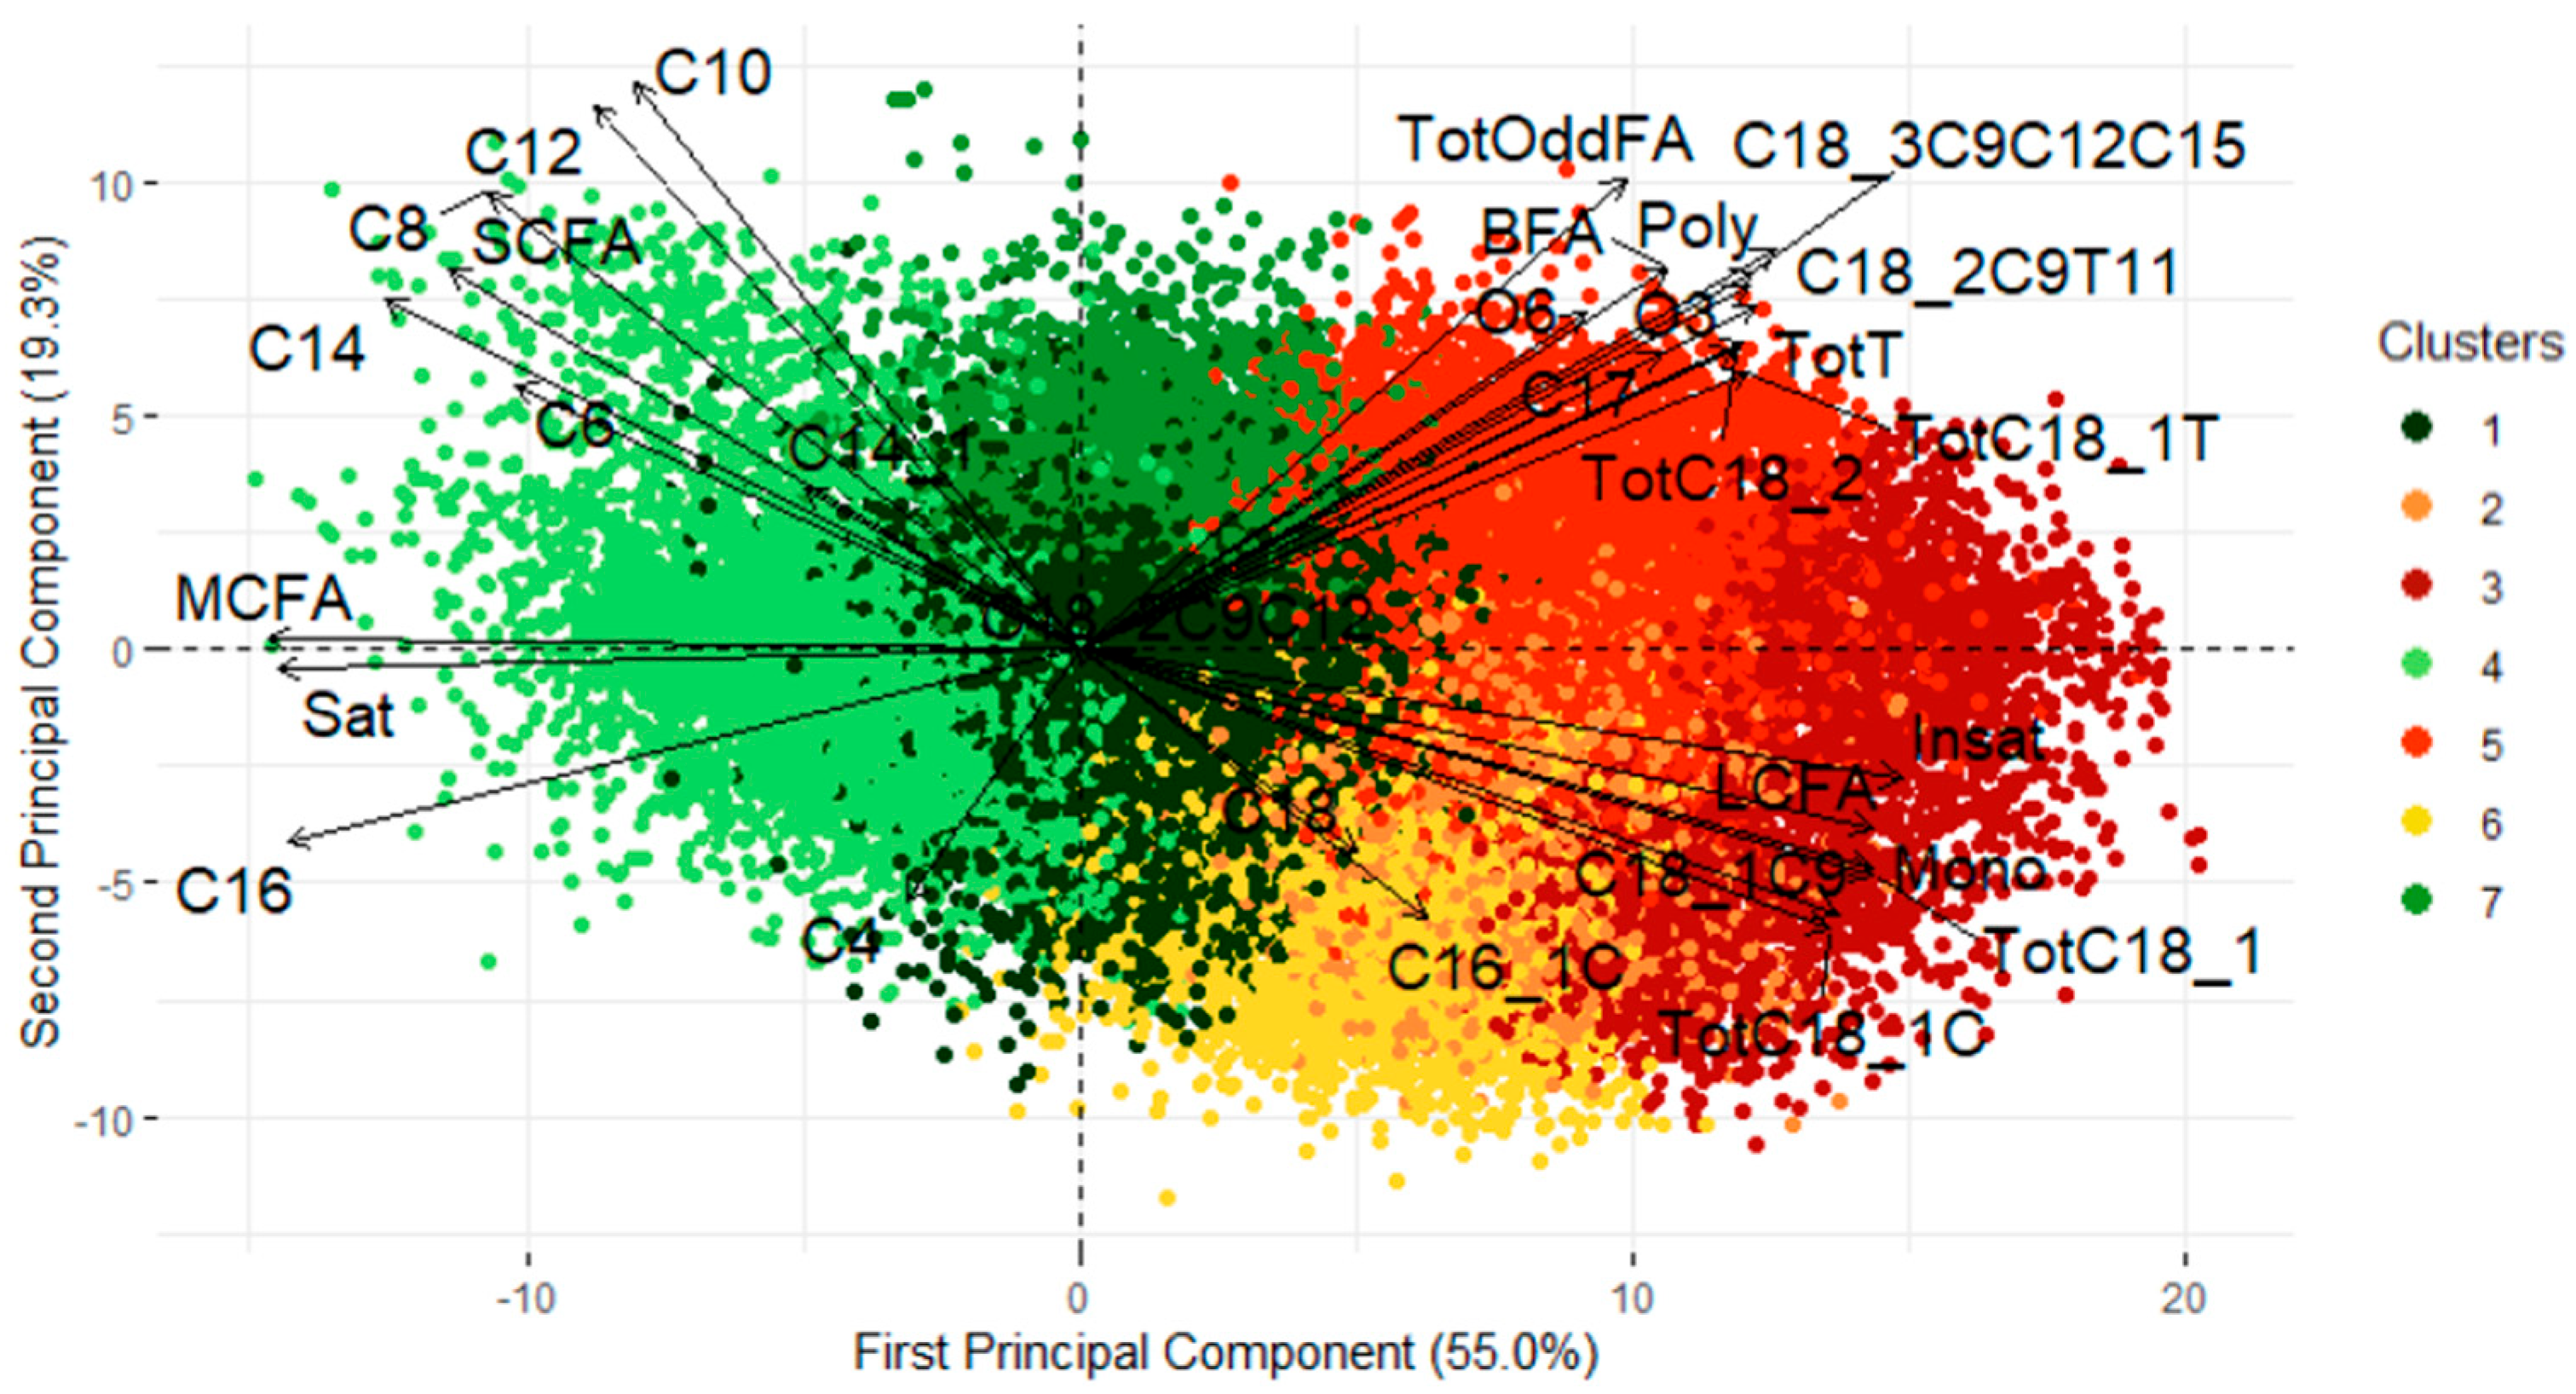
2.6. Interpretation
3. Results and Discussion
3.1. Clustering on Belgian Dataset
3.2. Cluster Prediction on Belgian and Canadian Datasets
3.3. Cluster Interpretation
3.4. From Clusters to Probabilities
3.5. Practical Implications and Study Limitations
4. Conclusions
Author Contributions
Funding
Institutional Review Board Statement
Informed Consent Statement
Data Availability Statement
Acknowledgments
Conflicts of Interest
Abbreviations
| BHB | β-hydroxybutyrate |
| DHI | Dairy Herd Improvement |
| FA | Fatty acid |
| FFA | Free fatty acid |
| FT-MIR | Fourier Transform mid-infrared |
| GH | Standardized Mahalanobis distance |
| PC | Principal component |
| PCA | Principal component analysis |
| THI | Temperature humidity index |
References
- FAO. Contribution of Terrestrial Animal Source Food to Healthy Diets for Improved Nutrition and Health Outcomes—An Evidence and Policy Overview on the State of Knowledge and Gaps; FAO: Rome, Italy, 2023. [Google Scholar] [CrossRef]
- Jensen, R.G. The Composition of Bovine Milk Lipids: January 1995 to December 2000. J. Dairy Sci. 2002, 85, 295–350. [Google Scholar] [CrossRef] [PubMed]
- Chilliard, Y.; Ferlay, A.; Mansbridge, R.M.; Doreau, M. Ruminant Milk Fat Plasticity:Nutritional Control of Saturated, Polyunsaturated, Trans and Conjugated Fatty Acids. Ann. Zootech. 2000, 49, 181–205. [Google Scholar] [CrossRef]
- Giannuzzi, D.; Toscano, A.; Pegolo, S.; Gallo, L.; Tagliapietra, F.; Mele, M.; Minuti, A.; Trevisi, E.; Marsan, P.A.; Schiavon, S.; et al. Associations between Milk Fatty Acid Profile and Body Condition Score, Ultrasound Hepatic Measurements and Blood Metabolites in Holstein Cows. Animals 2022, 12, 1202. [Google Scholar] [CrossRef]
- Riuzzi, G.; Davis, H.; Lanza, I.; Butler, G.; Contiero, B.; Gottardo, F.; Segato, S. Multivariate Modelling of Milk Fatty Acid Profile to Discriminate the Forages in Dairy Cows’ Ration. Sci. Rep. 2021, 11, 23201. [Google Scholar] [CrossRef] [PubMed]
- Lindmark Månsson, H. Fatty Acids in Bovine Milk Fat. Food Nutr. Res. 2008, 52, 1821. [Google Scholar] [CrossRef]
- Bauman, D.E.; Mather, I.H.; Wall, R.J.; Lock, A.L. Major Advances Associated with the Biosynthesis of Milk. J. Dairy Sci. 2006, 89, 1235–1243. [Google Scholar] [CrossRef]
- Jenkins, T.C. Lipid Metabolism in the Rumen. J. Dairy Sci. 1993, 76, 3851–3863. [Google Scholar] [CrossRef]
- Vlaeminck, B.; Fievez, V.; Cabrita, A.R.J.; Fonseca, A.J.M.; Dewhurst, R.J. Factors Affecting Odd- and Branched-Chain Fatty Acids in Milk: A Review. Anim. Feed Sci. Technol. 2006, 131, 389–417. [Google Scholar] [CrossRef]
- Fiore, E.; Blasi, F.; Morgante, M.; Cossignani, L.; Badon, T.; Gianesella, M.; Contiero, B.; Berlanda, M. Changes of Milk Fatty Acid Composition in Four Lipid Classes as Biomarkers for the Diagnosis of Bovine Ketosis Using Bioanalytical Thin Layer Chromatography and Gas Chromatographic Techniques (TLC-GC). J. Pharm. Biomed. Anal. 2020, 188, 113372. [Google Scholar] [CrossRef]
- Palmquist, D.L.; Beaulieu, A.D.; Barbano, D.M. Feed and Animal Factors Influencing Milk Fat Composition. J. Dairy Sci. 1993, 76, 1753–1771. [Google Scholar] [CrossRef]
- Jorjong, S.; van Knegsel, A.T.M.; Verwaeren, J.; Lahoz, M.V.; Bruckmaier, R.M.; De Baets, B.; Kemp, B.; Fievez, V. Milk Fatty Acids as Possible Biomarkers to Early Diagnose Elevated Concentrations of Blood Plasma Nonesterified Fatty Acids in Dairy Cows. J. Dairy Sci. 2014, 97, 7054–7064. [Google Scholar] [CrossRef] [PubMed]
- Craninx, M.; Steen, A.; Van Laar, H.; Van Nespen, T.; Martín-Tereso, J.; de Baets, B.; Fievez, V. Effect of Lactation Stage on the Odd- and Branched-Chain Milk Fatty Acids of Dairy Cattle Under Grazing and Indoor Conditions. J. Dairy Sci. 2008, 91, 2662–2677. [Google Scholar] [CrossRef]
- Mansbridge, R.J.; Blake, J.S. Nutritional Factors Affecting the Fatty Acid Composition of Bovine Milk Fat. Livest. Prod. Sci. 1997, 50, 95–110. [Google Scholar] [CrossRef]
- Soyeurt, H.; Dehareng, F.; Gengler, N.; McParland, S.; Wall, E.; Berry, D.P.; Coffey, M.; Dardenne, P. Mid-Infrared Prediction of Bovine Milk Fatty Acids across Multiple Breeds, Production Systems, and Countries. J. Dairy Sci. 2011, 94, 1657–1667. [Google Scholar] [CrossRef]
- Woolpert, M.E.; Dann, H.M.; Cotanch, K.W.; Melilli, C.; Chase, L.E.; Grant, R.; Barbano, D. Management, Nutrition, and Lactation Performance Are Related to Bulk Tank Milk de Novo Fatty Acid Concentration on Northeastern US Dairy Farms. J. Dairy Sci. 2016, 99, 8486–8497. [Google Scholar] [CrossRef]
- Woolpert, M.E.; Dann, H.M.; Cotanch, K.W.; Melilli, C.; Chase, L.E.; Grant, R.; Barbano, D. Management Practices, Physically Effective Fiber, and Ether Extract Are Related to Bulk Tank Milk de Novo Fatty Acid Concentration on Holstein Dairy Farms. J. Dairy Sci. 2017, 100, 5097–5106. [Google Scholar] [CrossRef]
- Hammami, H.; Vandenplas, J.; Vanrobays, M.-L.; Rekik, B.; Bastin, C.; Gengler, N. Genetic Analysis of Heat Stress Effects on Yield Traits, Udder Health, and Fatty Acids of Walloon Holstein Cows. J. Dairy Sci. 2015, 98, 4956–4968. [Google Scholar] [CrossRef] [PubMed]
- Liu, Z.; Ezernieks, V.; Wang, J.; Arachchillage, N.W.; Garner, J.B.; Wales, W.J.; Cocks, B.G.; Rochfort, S. Heat Stress in Dairy Cattle Alters Lipid Composition of Milk. Sci. Rep. 2017, 7, 961. [Google Scholar] [CrossRef] [PubMed]
- Mann, S.; Nydam, D.V.; Lock, A.L.; Overton, T.R.; McArt, J.A.A. Short Communication: Association of Milk Fatty Acids with Early Lactation Hyperketonemia and Elevated Concentration of Nonesterified Fatty Acids. J. Dairy Sci. 2016, 99, 5851–5857. [Google Scholar] [CrossRef]
- Vlaeminck, B.; Fievez, V.; Demeyer, D.; Dewhurst, R.J. Effect of Forage:Concentrate Ratio on Fatty Acid Composition of Rumen Bacteria Isolated From Ruminal and Duodenal Digesta. J. Dairy Sci. 2006, 89, 2668–2678. [Google Scholar] [CrossRef]
- Vlaeminck, B.; Fievez, V.; Tamminga, S.; Dewhurst, R.J.; Van Vuuren, A.; De Brabander, D.; Demeyer, D. Milk Odd- and Branched-Chain Fatty Acids in Relation to the Rumen Fermentation Pattern. J. Dairy Sci. 2006, 89, 3954–3964. [Google Scholar] [CrossRef] [PubMed]
- Soyeurt, H.; Dardenne, P.; Dehareng, F.; Lognay, G.; Veselko, D.; Marlier, M.; Bertozzi, C.; Mayeres, P.; Gengler, N. Estimating Fatty Acid Content in Cow Milk Using Mid-Infrared Spectrometry. J. Dairy Sci. 2006, 89, 3690–3695. [Google Scholar] [CrossRef]
- Franceschini, S.; Grelet, C.; Leblois, J.; Gengler, N.; Soyeurt, H. Can Unsupervised Learning Methods Applied to Milk Recording Big Data Provide New Insights into Dairy Cow Health? J. Dairy Sci. 2022, 105, 6760–6772. [Google Scholar] [CrossRef]
- R Core Team. R: A Language and Environment for Statistical Computing; R Core Team: Vienna, Austria, 2022. [Google Scholar]
- Grelet, C.; Fernández Pierna, J.A.; Dardenne, P.; Baeten, V.; Dehareng, F. Standardization of Milk Mid-Infrared Spectra from a European Dairy Network. J. Dairy Sci. 2015, 98, 2150–2160. [Google Scholar] [CrossRef]
- Grelet, C.; Dardenne, P.; Soyeurt, H.; Fernandez, J.A.; Vanlierde, A.; Steevens, F.; Gengler, N.; Dehareng, F. Large-Scale Phenotyping in Dairy Sector Using Milk MIR Spectra: Key Factors Affecting the Quality of Predictions. Methods 2021, 186, 97–111. [Google Scholar] [CrossRef] [PubMed]
- Agromet.Be. Available online: https://agromet.be/fr/pages/home/ (accessed on 25 March 2025).
- Nickmilder, C.; Tedde, A.; Dufrasne, I.; Lessire, F.; Glesner, N.; Tychon, B.; Bindelle, J.; Soyeurt, H. Creation of a Walloon Pasture Monitoring Platform Based on Machine Learning Models and Remote Sensing. Remote. Sens. 2023, 15, 1890. [Google Scholar] [CrossRef]
- Jubb, T.; Perkins, N.R. Veterinary Handbook for Cattle, Sheep and Goats; Australian Livestock Export Corporation Limited: Sydney, Australia, 2015. [Google Scholar]
- International Council on Animal Recording (ICAR). Cattle Milk Recording: Standards and Guidelines. Available online: https://www.icar.org/Guidelines/02-Overview-Cattle-Milk-Recording.pdf (accessed on 27 March 2025).
- Lê, S.; Josse, J.; Husson, F. FactoMineR: An R Package for Multivariate Analysis. J. Stat. Softw. 2008, 25, 1–18. [Google Scholar] [CrossRef]
- Zhang, L.; Li, C.; Dehareng, F.; Grelet, C.; Colinet, F.; Gengler, N.; Brostaux, Y.; Soyeurt, H. Appropriate Data Quality Checks Improve the Reliability of Values Predicted from Milk Mid-Infrared Spectra. Animals 2021, 11, 533. [Google Scholar] [CrossRef] [PubMed]
- Music, J.; Charlebois, S.; Marangoni, A.G.; Ghazani, S.M.; Burgess, J.; Proulx, A.; Somogyi, S.; Patelli, Y. Data Deficits and Transparency: What Led to Canada’s ‘Buttergate’. Trends Food Sci. Technol. 2022, 123, 334–342. [Google Scholar] [CrossRef]
- Lactanet Guide to the Sustainability Index. Available online: https://lactanet.ca/en/guide-to-the-sustainability-index/ (accessed on 21 March 2024).
- Murtagh, F.; Legendre, P. Ward’s Hierarchical Agglomerative Clustering Method: Which Algorithms Implement Ward’s Criterion? J. Classif. 2014, 31, 274–295. [Google Scholar] [CrossRef]
- Kuhn, M. Building Predictive Models in R Using the Caret Package. J. Stat. Softw. 2008, 28, 1–26. [Google Scholar] [CrossRef]
- Liaw, A.; Wiener, M. Classification and Regression by randomForest. R News 2002, 2, 18–22. [Google Scholar]
- National Farm Animal Care Council (NFACC). Code of Practice for the Care and Handling of Dairy Cattle: Review of Scientific Research on Priority Issues; National Farm Animal Care Council (NFACC): Lacombe, AB, Canada, 2020. [Google Scholar]
- Arnott, G.; Ferris, C.; O’Connell, N. A Comparison of Confinement and Pasture Systems for Dairy Cows: What Does the Science Say? AgriSearch: Lisburn, UK, 2015. [Google Scholar]
- Production Laitière (Lait de Vache). Available online: https://www.quebec.ca/agriculture-environnement-et-ressources-naturelles/agriculture/industrie-agricole-au-quebec/productions-agricoles/production-lait-vache (accessed on 27 March 2025).
- Service Publique de Wallonie. État de l’Agriculture Wallonne; SPW ARNE: Wallonia, Belgium, 2021. [Google Scholar]
- Chilliard, Y.; Ferlay, A.; Doreau, M. Effect of Different Types of Forages, Animal Fat or Marine Oils in Cow’s Diet on Milk Fat Secretion and Composition, Especially Conjugated Linoleic Acid (CLA) and Polyunsaturated Fatty Acids. Livest. Prod. Sci. 2001, 70, 31–48. [Google Scholar] [CrossRef]


| FT-MIR Predicted Traits 1 | Unit | Belgium (N = 774,781) | Canada (N = 670,165) | R2cv | RMSE |
|---|---|---|---|---|---|
| Fat | g/dL of milk | 4.17 ± 0.34 | 4.14 ± 0.27 | / | / |
| Protein | g/dL of milk | 3.47 ± 0.19 | 2.62 ± 0.13 | / | / |
| Milk yield | kg/day | 26.85 ± 2.85 | 29.97 ± 1.54 | 0.69 | 3.48 |
| Energy balance | −3.12 ± 3.36 | −7.05 ± 1.56 | 0.43 | 1.33 | |
| Nitrogen efficiency | 53.67 ± 14.12 | 17.54 ± 1.25 | 0.52 | 1.44 | |
| Blood BHB | mmol/L plasma (log) | −0.82 ± 0.09 | −0.78 ± 0.06 | 0.7 | 1.85 |
| Blood free FA | µeq/L of plasma | 495.15 ± 131.57 | 421.89 ± 84.79 | 0.39 | 344.2 |
| Dry matter intake | kg/day | 22.81 ± 2.14 | 24.18 ± 1.41 | 0.45 | 1.35 |
| C4 | g/100 g of fat | 2.68 ± 0.19 | 2.63 ± 0.13 | 0.93 | 0.008 |
| C6 | g/100 g of fat | 1.81 ± 0.12 | 1.83 ± 0.08 | 0.91 | 0.006 |
| C8 | g/100 g of fat | 1.18 ± 0.10 | 1.28 ± 0.07 | 0.91 | 0.004 |
| C10 | g/100 g of fat | 2.65 ± 0.36 | 3.26 ± 0.25 | 0.92 | 0.01 |
| C12 | g/100 g of fat | 3.32 ± 0.44 | 4.09 ± 0.33 | 0.93 | 0.011 |
| C14 | g/100 g of fat | 11.43 ± 0.87 | 12.32 ± 0.65 | 0.94 | 0.03 |
| C14:1cis9 | g/100 g of fat | 1.06 ± 0.11 | 1.17 ± 0.08 | 0.71 | 0.008 |
| C16 | g/100 g of fat | 31.33 ± 3.25 | 28.90 ± 1.52 | 0.95 | 0.091 |
| C16:1 | g/100 g of fat | 1.61 ± 0.17 | 1.56 ± 0.09 | 0.73 | 0.013 |
| C17 | g/100 g of fat | 0.64 ± 0.05 | 0.66 ± 0.02 | 0.81 | 0.003 |
| C18 | g/100 g of fat | 9.53 ± 1.03 | 9.05 ± 0.61 | 0.84 | 0.056 |
| Total C18:1trans | g/100 g of fat | 3.12 ± 0.75 | 3.62 ± 0.37 | 0.8 | 0.025 |
| C18:1cis9 | g/100 g of fat | 18.56 ± 2.63 | 19.98 ± 1.74 | 0.95 | 0.063 |
| Total C18:1cis | g/100 g of fat | 20.04 ± 2.78 | 21.57 ± 1.86 | 0.95 | 0.061 |
| Total C18:2 | g/100 g of fat | 2.10 ± 0.22 | 2.54 ± 0.12 | 0.71 | 0.014 |
| C18:2cis9cis12 | g/100 g of fat | 1.25 ± 0.15 | 1.49 ± 0.11 | 0.75 | 0.011 |
| C18:2cis9trans11 | g/100 g of fat | 0.47 ± 0.10 | 0.61 ± 0.05 | 0.74 | 0.01 |
| C18:3cis9cis12cis15 | g/100 g of fat | 0.76 ± 0.33 | 0.96 ± 0.13 | 0.69 | 0.004 |
| Saturated FAs | g/100 g of fat | 68.49 ± 4.09 | 66.88 ± 2.06 | 0.99 | 0.072 |
| Monounsaturated FAs | g/100 g of fat | 26.78 ± 3.11 | 27.51 ± 1.97 | 0.97 | 0.059 |
| Polyunsaturated FAs | g/100 g of fat | 3.46 ± 0.68 | 4.44 ± 0.28 | 0.79 | 0.021 |
| Unsaturated FAs | g/100 g of fat | 30.33 ± 3.57 | 31.87 ± 2.15 | 0.97 | 0.064 |
| Short-chain FAs | g/100 g of fat | 8.77 ± 0.60 | 9.32 ± 0.42 | 0.93 | 0.025 |
| Medium-chain FAs | g/100 g of fat | 51.68 ± 3.95 | 51.89 ± 2.5 | 0.97 | 0.104 |
| Long-chain FAs | g/100 g of fat | 38.50 ± 4.12 | 39.04 ± 2.72 | 0.95 | 0.11 |
| Branched FAs | g/100 g of fat | 2.27 ± 0.26 | 2.67 ± 0.08 | 0.77 | 0.013 |
| Omega3 | g/100 g of fat | 0.58 ± 0.12 | 0.71 ± 0.05 | 0.68 | 0.006 |
| Omega6 | g/100 g of fat | 2.13 ± 0.24 | 2.58 ± 0.14 | 0.74 | 0.014 |
| Odd-chain FAs | g/100 g of fat | 3.82 ± 0.35 | 4.30 ± 0.12 | 0.84 | 0.016 |
| Total Trans FAs | g/100 g of fat | 3.91 ± 0.93 | 4.59 ± 0.46 | 0.82 | 0.029 |
| Total C18:1 | g/100 g of fat | 23.15 ± 3.08 | 23.7 ± 1.99 | 0.96 | 0.06 |
| Unit | Mean ± SD | |
|---|---|---|
| Number of lactation cows | Cows | 66.65 ± 50.87 |
| Days in milk | days | 176.99 ± 23.64 |
| Margin on feed costs | $CA/cow/year | 5009.77 ± 1254.85 |
| Margin on feed costs per kg of fat | $CA/cow/year/kg | 12.53 ± 1.52 |
| Milk yield | L/day | 26.59 ± 5.05 |
| Fat | kg/cow/day | 1.06 ± 0.30 |
| Protein | kg/cow/day | 0.86 ± 0.24 |
| Milk production at lactation peak | L/day | 39.72 ± 5.76 |
| Days in milk at lactation peak | days | 44.75 ± 4.54 |
| Somatic cells in milk | ×103 cells/mL | 182.02 ± 116.21 |
| % of cows in the herd with somatic cells count > 200,000 cells/mL | % | 18.95 ± 7.92 |
| Urea in milk | g/mL | 5.01 ± 5.90 |
| % of cows in the herd with a urea concentration < 5 or >12 | % | 7.75 ± 9.90 |
| Transition index | 236.12 ± 445.85 | |
| % of cows in the herd with a negative transition index | % | 37.98 ± 18.25 |
| Age at first calving | month | 25.30 ± 2.28 |
| Calving interval | days | 409.75 ± 31.72 |
| Management index | −303.55 ± 1218.80 | |
| Management index for fat | −14.99 ± 52.65 | |
| % of the 3006 farms in conventional farming system | % | 60.98 |
| % of the 3006 farms in organic farming system | % | 13.11 |
| % of the 3006 farms with no information about their farming system | % | 25.91 |
| Cluster | |||||||
|---|---|---|---|---|---|---|---|
| Cluster 1 | Cluster 2 | Cluster 3 | Cluster 4 | Cluster 5 | Cluster 6 | Cluster 7 | |
| All data | 23.55 | 7.90 | 11.72 | 22.75 | 15.89 | 10.81 | 8.71 |
| GH < 3 | 27.53 | 2.29 | 4.07 | 28.51 | 15.64 | 5.48 | 13.47 |
| GH > 3 | 17.98 | 12.51 | 21.04 | 15.73 | 12.54 | 17.29 | 2.91 |
| Reference | ||||||||
|---|---|---|---|---|---|---|---|---|
| Cluster 1 | Cluster 2 | Cluster 3 | Cluster 4 | Cluster 5 | Cluster 6 | Cluster 7 | ||
| Prediction | Cluster 1 | 5781 | 122 | 0 | 279 | 100 | 113 | 59 |
| Cluster 2 | 78 | 1651 | 24 | 0 | 30 | 57 | 0 | |
| Cluster 3 | 0 | 43 | 2979 | 0 | 105 | 72 | 0 | |
| Cluster 4 | 287 | 0 | 0 | 5875 | 0 | 36 | 46 | |
| Cluster 5 | 50 | 36 | 111 | 1 | 4001 | 48 | 62 | |
| Cluster 6 | 96 | 33 | 90 | 36 | 46 | 2623 | 8 | |
| Cluster 7 | 53 | 0 | 0 | 24 | 59 | 4 | 2204 | |
| Cluster 1 | Cluster 2 | Cluster 3 | Cluster 4 | Cluster 5 | Cluster 6 | Cluster 7 | |
|---|---|---|---|---|---|---|---|
| Belgium | 38.47 | 1.18 | 1.04 | 36.60 | 10.40 | 2.51 | 9.80 |
| Canada | 12.00 | 0.28 | 0.04 | 0.48 | 13.22 | <0.01 | 73.98 |
| Cluster 1 | Cluster 2 | Cluster 3 | Cluster 4 | Cluster 5 | Cluster 6 | Cluster 7 | ||
|---|---|---|---|---|---|---|---|---|
| Belgium | Cluster 1 | 65.63 | 1.26 | 0.09 | 20.19 | 5.97 | 1.69 | 5.17 |
| Cluster 2 | 40.24 | 32.52 | 2.32 | 4.97 | 10.86 | 8.90 | 0.20 | |
| Cluster 3 | 2.78 | 2.85 | 55.75 | 0.45 | 23.67 | 14.33 | 0.17 | |
| Cluster 4 | 22.02 | 0.14 | 0.01 | 69.81 | 0.43 | 0.53 | 7.06 | |
| Cluster 5 | 20.68 | 1.23 | 2.25 | 1.62 | 64.65 | 3.00 | 6.56 | |
| Cluster 6 | 24.01 | 4.21 | 6.55 | 8.02 | 13.18 | 43.42 | 0.62 | |
| Cluster 7 | 19.83 | 0.02 | 0.01 | 27.80 | 5.54 | 0.12 | 46.68 | |
| Canada | Cluster 1 | 34.39 | 0.28 | 0.01 | 0.31 | 11.10 | 0.00 | 53.92 |
| Cluster 2 | 11.51 | 18.63 | 0.70 | 0.00 | 60.87 | 0.00 | 8.30 | |
| Cluster 3 | 0.83 | 7.44 | 23.55 | 0.00 | 62.81 | 0.00 | 5.37 | |
| Cluster 4 | 7.10 | 0.00 | 0.00 | 35.09 | 0.69 | 0.00 | 57.12 | |
| Cluster 5 | 10.27 | 1.24 | 0.17 | 0.02 | 63.08 | 0.00 | 25.22 | |
| Cluster 6 | 0.00 | 0.00 | 0.00 | 0.00 | 83.33 | 0.00 | 16.67 | |
| Cluster 7 | 8.79 | 0.04 | 0.00 | 0.38 | 4.43 | 0.00 | 86.35 |
| Belgium | Canada | |||||||||||||
|---|---|---|---|---|---|---|---|---|---|---|---|---|---|---|
| C1 | C2 | C3 | C4 | C5 | C6 | C7 | C1 | C2 | C3 | C4 | C5 | C6 | C7 | |
| C4 | 2.78 | 2.87 | 2.49 | 2.69 | 2.55 | 2.60 | 2.50 | 2.79 | 2.85 | 2.63 | 2.75 | 2.64 | 2.55 | 2.61 |
| C6 | 1.82 | 1.7 | 1.46 | 1.86 | 1.70 | 1.56 | 1.84 | 1.80 | 1.68 | 1.53 | 1.97 | 1.74 | 1.53 | 1.85 |
| C8 | 1.16 | 1.01 | 0.88 | 1.23 | 1.11 | 0.94 | 1.26 | 1.22 | 1.08 | 0.97 | 1.39 | 1.18 | 0.95 | 1.30 |
| C10 | 2.53 | 2.06 | 1.78 | 2.77 | 2.51 | 1.87 | 3.06 | 3.07 | 2.53 | 2.23 | 3.60 | 2.90 | 2.38 | 3.36 |
| C12 | 3.15 | 2.51 | 2.30 | 3.51 | 3.13 | 2.44 | 3.78 | 3.83 | 3.10 | 2.80 | 4.53 | 3.62 | 3.19 | 4.22 |
| C14 | 11.13 | 9.56 | 9.05 | 12.07 | 10.55 | 9.92 | 11.9 | 11.80 | 10.27 | 9.66 | 13.28 | 11.36 | 11.06 | 12.58 |
| C14:1c9 | 1.01 | 0.84 | 1.00 | 1.12 | 1.05 | 1.05 | 1.09 | 1.09 | 0.96 | 1.02 | 1.24 | 1.11 | 1.20 | 1.19 |
| C16 | 31.04 | 27.16 | 24.26 | 34.38 | 25.78 | 30.01 | 29.31 | 28.79 | 25.54 | 23.53 | 32.62 | 26.58 | 29.84 | 29.33 |
| C16:1 | 1.58 | 1.69 | 1.95 | 1.59 | 1.70 | 1.92 | 1.60 | 1.53 | 1.65 | 1.83 | 1.45 | 1.65 | 1.72 | 1.55 |
| C17 | 0.64 | 0.66 | 0.72 | 0.61 | 0.70 | 0.66 | 0.70 | 0.64 | 0.66 | 0.70 | 0.62 | 0.68 | 0.68 | 0.66 |
| C18 | 10.02 | 11.48 | 10.44 | 9.04 | 9.56 | 9.93 | 9.18 | 9.49 | 10.66 | 10.57 | 8.36 | 9.67 | 8.73 | 8.87 |
| Total C18:1t | 3.21 | 3.71 | 4.44 | 2.50 | 4.21 | 3.13 | 3.58 | 3.49 | 4.01 | 4.52 | 2.97 | 4.05 | 3.60 | 3.57 |
| C18:1c9 | 19.06 | 23.82 | 26.28 | 16.56 | 21.81 | 23.26 | 17.98 | 21.18 | 25.25 | 27.26 | 16.46 | 22.62 | 23.21 | 19.31 |
| Total C18:1c | 20.61 | 25.69 | 28.17 | 17.97 | 23.39 | 25.07 | 19.27 | 22.9 | 27.22 | 29.29 | 17.80 | 24.36 | 24.78 | 20.85 |
| Total C18:2 | 2.12 | 2.4 | 2.42 | 1.92 | 2.39 | 2.08 | 2.28 | 2.55 | 2.70 | 2.8 | 2.23 | 2.65 | 2.33 | 2.52 |
| C18:2c9c12 | 1.28 | 1.47 | 1.20 | 1.22 | 1.20 | 1.21 | 1.26 | 1.56 | 1.61 | 1.55 | 1.34 | 1.5 | 1.41 | 1.47 |
| C18:2c9t11 | 0.46 | 0.53 | 0.63 | 0.38 | 0.63 | 0.45 | 0.57 | 0.57 | 0.62 | 0.69 | 0.52 | 0.65 | 0.50 | 0.60 |
| C18:3c9c12c15 | 0.72 | 0.80 | 1.38 | 0.50 | 1.33 | 0.79 | 1.08 | 0.85 | 1.00 | 1.26 | 0.76 | 1.12 | 1.05 | 0.96 |
| SFAs | 68.37 | 63.15 | 57.54 | 71.93 | 61.53 | 64.06 | 67.24 | 66.25 | 61.39 | 58 | 71.84 | 63.48 | 64.81 | 67.59 |
| MUFAs | 27.38 | 32.76 | 36.15 | 24.32 | 30.99 | 32.12 | 26.2 | 28.43 | 33.08 | 36.03 | 23.24 | 30.71 | 30.53 | 26.78 |
| PUFAs | 3.46 | 4.01 | 4.60 | 2.86 | 4.56 | 3.36 | 4.19 | 4.29 | 4.67 | 5.11 | 3.78 | 4.76 | 4.17 | 4.41 |
| UFAs | 30.91 | 36.81 | 40.92 | 27.29 | 35.65 | 35.71 | 30.4 | 32.67 | 37.69 | 41.11 | 27.00 | 35.41 | 34.67 | 31.11 |
| SCFAs | 8.71 | 7.92 | 6.88 | 9.06 | 8.24 | 7.35 | 9.04 | 9.12 | 8.30 | 7.54 | 10.08 | 8.75 | 7.59 | 9.46 |
| MCFAs | 50.62 | 44.07 | 41.79 | 55.53 | 45.67 | 48.2 | 51 | 50.44 | 44.60 | 42.28 | 56.92 | 48.08 | 50.26 | 52.81 |
| LCFAs | 39.84 | 47.81 | 49.86 | 34.8 | 43.67 | 44.21 | 38 | 40.64 | 47.12 | 50.03 | 33.48 | 43.3 | 42.18 | 38.01 |
| BFAs | 2.21 | 2.20 | 2.66 | 2.11 | 2.70 | 2.26 | 2.54 | 2.58 | 2.60 | 2.77 | 2.49 | 2.73 | 2.60 | 2.67 |
| Omega3 | 0.59 | 0.68 | 0.77 | 0.47 | 0.76 | 0.56 | 0.70 | 0.68 | 0.76 | 0.82 | 0.61 | 0.77 | 0.60 | 0.71 |
| Omega6 | 2.17 | 2.48 | 2.36 | 1.95 | 2.36 | 2.03 | 2.34 | 2.61 | 2.73 | 2.78 | 2.30 | 2.66 | 2.34 | 2.56 |
| Odd-chain FAs | 3.74 | 3.73 | 4.29 | 3.59 | 4.34 | 3.75 | 4.26 | 4.14 | 4.10 | 4.35 | 4.10 | 4.34 | 4.41 | 4.32 |
| Total trans FAs | 4.00 | 4.58 | 5.54 | 3.16 | 5.32 | 3.88 | 4.56 | 4.31 | 4.92 | 5.62 | 3.78 | 5.11 | 4.33 | 4.54 |
| Total C18:1 | 23.85 | 29.4 | 32.28 | 20.64 | 27.24 | 28.27 | 22.49 | 24.76 | 29.51 | 32.18 | 19.44 | 26.90 | 26.35 | 22.94 |
| Fat | 4.11 | 3.94 | 4.01 | 4.23 | 4.10 | 4.05 | 4.25 | 4.17 | 4.02 | 3.99 | 4.84 | 4.02 | 3.83 | 4.15 |
| Protein | 3.44 | 3.31 | 3.43 | 3.50 | 3.5 | 3.37 | 3.55 | 2.55 | 2.44 | 2.50 | 2.90 | 2.56 | 2.55 | 2.65 |
| Milk yield | 26.87 | 26.10 | 22.45 | 28.11 | 24.49 | 24.81 | 25.52 | 30.83 | 29.82 | 26.55 | 30.90 | 28.56 | 24.77 | 30.08 |
| EB | −2.75 | −5.40 | −8.50 | −1.43 | −7.40 | −4.83 | −4.04 | −7.87 | −9.51 | −10.14 | −6.95 | −8.22 | −6.94 | −6.69 |
| NUE | 56.67 | 56.29 | 31.04 | 58.10 | 38.73 | 41.78 | 49.67 | 18.70 | 19.76 | 19.75 | 17.96 | 18.24 | 20.14 | 17.22 |
| Blood BHB | −0.81 | −0.74 | −0.71 | −0.87 | −0.73 | −0.77 | −0.79 | −0.75 | −0.67 | −0.68 | −0.89 | −0.73 | −0.77 | −0.80 |
| Blood free FAs | 526.9 | 678.60 | 714.60 | 407.70 | 590.40 | 629.00 | 520.30 | 449.3 | 597.8 | 622.60 | 293.8 | 514.4 | 496.00 | 400.8 |
| DMI | 22.24 | 19.93 | 19.78 | 23.51 | 22.03 | 20.84 | 24.17 | 23.49 | 21.45 | 21.27 | 27.31 | 23.03 | 24.67 | 24.49 |
| THI | 52.27 | 52.45 | 56.71 | 50.28 | 54.67 | 56.31 | 49.12 | / | / | / | / | / | / | / |
| Level | Cluster 1 (N = 4330) | Cluster 2 (N = 520) | Cluster 3 (N = 83) | Cluster 4 (N = 577) | Cluster 5 (N = 3250) | Cluster 6 (N = 4) | Cluster 7 (N = 4639) | |
|---|---|---|---|---|---|---|---|---|
| Farming system | Organic | 8.43 | 11.92 | 3.61 | 12.13 | 8.77 | 0.00 | 8.26 |
| Conventional | 39.33 | 25.77 | 16.87 | 40.56 | 36.15 | 25.00 | 39.21 | |
| Unknown | 52.24 | 62.31 | 79.52 | 47.31 | 55.08 | 75.00 | 52.53 | |
| Additional ventilation | No | 75.83 | 84.75 | 71.43 | 77.91 | 77.19 | / | 75.95 |
| Yes | 21.55 | 13.56 | 28.57 | 18.99 | 20.48 | / | 21.44 | |
| Unknown | 2.62 | 1.69 | 0.00 | 3.10 | 2.33 | / | 2.61 |
| Cluster 1 (N = 498) | Cluster 2 (N = 27) | Cluster 3 (N = 2) | Cluster 4 (N = 66) | Cluster 5 (N = 319) | Cluster 6 (N = 0) | Cluster 7 (N = 529) | ||
|---|---|---|---|---|---|---|---|---|
| Feeding | % of dry matter | 50.03 | 31.33 | 0.74 | 49.53 | 46.56 | / | 49.83 |
| % of corn silage | 22.44 | 8.63 | 2.04 | 33.98 | 18.22 | / | 22.79 |
| Traits | Cluster 1 | Cluster 2 | Cluster 3 | Cluster 4 | Cluster 5 | Cluster 7 |
|---|---|---|---|---|---|---|
| Number of cows in lactation | 65.32 ± 41.63 | 46.04 ± 17.1 | 40.55 ± 28.32 | 66.22 ± 34.38 | 58.13 ± 33.89 | 66.06 ± 42.37 |
| Days in milk | 174.41 ± 20.3 | 177.82 ± 31.35 | 234.75 ± 74.5 | 174.26 ± 19.91 | 176.55 ± 22.29 | 174.94 ± 20.31 |
| MFEED ($CA/cow/year) | 5134.67 ± 959.26 | 4643.00 ± 1056.39 | 3074.75 ± 1120.77 | 4932.20 ± 1056.97 | 5011.12 ± 1005.99 | 5129.53 ± 945.2 |
| MFEED per fat yield ($CA/cow/year/kg of fat) | 12.59 ± 1.17 | 12.83 ± 1.8 | 11.16 ± 0.87 | 12.42 ± 1.30 | 12.59 ± 1.35 | 12.58 ± 1.14 |
| Milk yield (L/cow/day) | 26.88 ± 4.58 | 24.61 ± 4.68 | 18.57 ± 5.99 | 25.69 ± 5.26 | 26.32 ± 4.66 | 26.83 ± 4.56 |
| Fat (kg/cow/day) | 1.08 ± 0.27 | 0.96 ± 0.25 | 0.72 ± 0.18 | 1.07 ± 0.28 | 1.04 ± 0.28 | 1.08 ± 0.26 |
| Protein (kg/cow/day) | 0.89 ± 0.22 | 0.79 ± 0.21 | 0.62 ± 0.19 | 0.87 ± 0.23 | 0.86 ± 0.23 | 0.89 ± 0.22 |
| Milk at lactation peak (L/day) | 40.09 ± 5.02 | 37.12 ± 5.21 | 32.35 ± 5.92 | 38.46 ± 6.35 | 39.39 ± 5.08 | 40.05 ± 5.00 |
| Days in milk at lactation peak | 44.30 ± 4.37 | 42.85 ± 5.92 | 37.5 ± 10.47 | 42.43 ± 4.70 | 44.41 ± 4.73 | 44.25 ± 4.34 |
| Somatic cells (103 cells/mL) | 175.49 ± 106.42 | 183.50 ± 108.72 | 278.25 ± 83.43 | 177.64 ± 110.73 | 181.34 ± 111.68 | 177.34 ± 106.55 |
| Somatic cells > 200,000/mL (% of cows/herd) | 18.57 ± 7.44 | 20.80 ± 8.34 | 31.27 ± 9.15 | 19.54 ± 8.33 | 19.41 ± 7.52 | 18.69 ± 7.49 |
| Urea (g/mL) | 9.36 ± 5.33 | 7.47 ± 5.48 | 5.08 ± 5.89 | 9.10 ± 5.71 | 9.22 ± 5.59 | 9.42 ± 5.33 |
| Urea < 5 or >12 g/mL (% of cows/herd) | 7.50 ± 7.29 | 7.81 ± 7.00 | 6.95 ± 5.25 | 9.26 ± 8.72 | 7.98 ± 7.63 | 7.50 ± 7.22 |
| Transition index | 275.94 ± 406.05 | 53.90 ± 469.31 | −406.75 ± 512.39 | 274.55 ± 429.99 | 200.7 ± 413.45 | 279.08 ± 401.74 |
| Transition index < 0 | 35.90 ± 16.25 | 45.88 ± 19.16 | 67.5 ± 17.71 | 36.06 ± 17.17 | 38.75 ± 16.95 | 35.72 ± 16.05 |
| Age at first calving (month) | 24.99 ± 1.94 | 26.09 ± 3.27 | 30.15 ± 8.28 | 25.12 ± 2.17 | 25.23 ± 2.21 | 24.99 ± 1.92 |
| Calving interval (days) | 403.79 ± 26.51 | 409.22 ± 37.63 | 457.50 ± 95.24 | 404.47 ± 23.5 | 406.06 ± 30.01 | 404.24 ± 26.79 |
| % of involuntary culling | 19.43 ± 8.89 | 18.46 ± 8.19 | 20.94 ± 14.2 | 17.20 ± 7.79 | 19.83 ± 9.43 | 19.51 ± 8.90 |
| % of dead cows | 5.25 ± 4.63 | 4.78 ± 4.46 | 3.69 ± 4.9 | 5.91 ± 5.59 | 5.37 ± 4.94 | 5.33 ± 4.61 |
| Milk MI | −289.96 ± 1223.41 | −798.47 ± 1456.19 | −2423.77 ± 1503.39 | −358.1 ± 1256.43 | −466.23 ± 1284.08 | −299.49 ± 1215.2 |
| Fat MI | −14.49 ± 52.79 | −40.84 ± 62.6 | −107.18 ± 55.86 | −14.57 ± 55.53 | −23.05 ± 54.50 | −14.86 ± 52.25 |
Disclaimer/Publisher’s Note: The statements, opinions and data contained in all publications are solely those of the individual author(s) and contributor(s) and not of MDPI and/or the editor(s). MDPI and/or the editor(s) disclaim responsibility for any injury to people or property resulting from any ideas, methods, instructions or products referred to in the content. |
© 2025 by the authors. Licensee MDPI, Basel, Switzerland. This article is an open access article distributed under the terms and conditions of the Creative Commons Attribution (CC BY) license (https://creativecommons.org/licenses/by/4.0/).
Share and Cite
Franceschini, S.; Fastré, C.; Nickmilder, C.; Santschi, D.E.; Warner, D.; Bahadi, M.; Bertozzi, C.; Veselko, D.; Dehareng, F.; Gengler, N.; et al. Detection of Dairy Herd Management Issues Using Fatty Acid Profiles Predicted by Mid-Infrared Spectrometry. Animals 2025, 15, 1575. https://doi.org/10.3390/ani15111575
Franceschini S, Fastré C, Nickmilder C, Santschi DE, Warner D, Bahadi M, Bertozzi C, Veselko D, Dehareng F, Gengler N, et al. Detection of Dairy Herd Management Issues Using Fatty Acid Profiles Predicted by Mid-Infrared Spectrometry. Animals. 2025; 15(11):1575. https://doi.org/10.3390/ani15111575
Chicago/Turabian StyleFranceschini, Sébastien, Claire Fastré, Charles Nickmilder, Débora E. Santschi, Daniel Warner, Mazen Bahadi, Carlo Bertozzi, Didier Veselko, Frédéric Dehareng, Nicolas Gengler, and et al. 2025. "Detection of Dairy Herd Management Issues Using Fatty Acid Profiles Predicted by Mid-Infrared Spectrometry" Animals 15, no. 11: 1575. https://doi.org/10.3390/ani15111575
APA StyleFranceschini, S., Fastré, C., Nickmilder, C., Santschi, D. E., Warner, D., Bahadi, M., Bertozzi, C., Veselko, D., Dehareng, F., Gengler, N., & Soyeurt, H. (2025). Detection of Dairy Herd Management Issues Using Fatty Acid Profiles Predicted by Mid-Infrared Spectrometry. Animals, 15(11), 1575. https://doi.org/10.3390/ani15111575