Abstract
This study investigated whole-plant maize at three harvest stages: one-third milk line (ML, 1/3 ML), two-thirds ML (2/3 ML), and the mature stage. Two packing densities were applied: 350 kg/m3 (low-density group) and 700 kg/m3 (high-density group). Results showed that starch content increased significantly as the maize matured. The 2/3 ML stage exhibited a 34.0% increase in starch content compared to the 1/3 ML stage (27.96 g/kg dry matter: DM vs. 20.87 g/kg DM, p < 0.01), while the mature stage showed a 13.4% increase compared to the 2/3 ML stage (31.70 g/kg DM vs. 27.96 g/kg DM, p < 0.01). After 60 days of ensiling, DM loss was significantly lower in the high-density group compared to the low-density group (3.37% vs. 9.39%, p < 0.05). From day 7 to day 60 of fermentation, the lactic acid content in the high-density group was consistently higher than in the low-density group by 14.29%, 10.00%, 8.33%, and 9.68%, respectively (p < 0.01). The relative abundance of Clostridium in both groups gradually increased during the first 30 days of fermentation, peaking on day 30 (0.05% in the high-density group vs. 0.12% in the low-density group, p < 0.05), and declined thereafter. On day 30, the abundance of Ruminiclostridium was significantly lower in the high-density group compared to the low-density group (0.12% vs. 0.40%, p < 0.05). Clostridium was negatively correlated with lactic acid bacteria (R2 = −0.58, p < 0.01). It also showed negative correlations with pH, lactic acid, and acetic acid (R2 = −0.25, −0.23, and −0.09, respectively; p > 0.05), but a positive correlation with ammoniacal nitrogen (R2 = 0.28, p > 0.05). In conclusion, the 2/3 ML stage is the optimal harvest time for whole-plant maize. Additionally, a higher packing density can suppress spoilage-associated Clostridium and enhance silage quality.
1. Introduction
Whole-plant maize silage is a vital feed resource, particularly for ruminants such as cattle and sheep [1]. Several factors influence silage quality, with harvest stage, packing density, and microbial community dynamics being especially critical [2]. Proper management of these factors can significantly enhance fermentation quality, promote the proliferation of beneficial microorganisms, and ultimately improve the nutritional value of the feed. The harvest stage directly affects the nutritional composition of maize silage [3]. As maize matures, key nutritional components, such as dry matter (DM), water-soluble carbohydrates (WSC), neutral detergent fiber (NDF), acid detergent fiber (ADF), and crude protein (CP), undergo considerable changes [4]. Therefore, selecting the appropriate harvest stage is essential for optimizing the silage’s nutritional content.
Packing density also plays a pivotal role in shaping microbial structure and influencing silage quality. A low packing density introduces more oxygen into the silage mass, encouraging the metabolism of aerobic microorganisms and impairing fermentation quality [5]. In contrast, a high packing density promotes anaerobic conditions, favoring the growth of lactic acid bacteria and enhancing fermentation quality [6]. Thus, selecting an appropriate packing density is essential for ensuring effective ensiling.
Microbial community dynamics are another key determinant of silage quality [7]. During ensiling, the activity of microorganisms such as lactic acid bacteria and Clostridium significantly influences the microbial ecosystem. When lactic acid bacteria dominate, their rapid production of lactic acid lowers the pH, thereby inhibiting harmful microbes and preserving silage quality [8]. Conversely, anaerobic microorganisms like Clostridium spp. can produce undesirable metabolites such as butyric acid and acetone, which deteriorate fermentation quality [9]. As fermentation progresses, microbial interactions shift, ultimately stabilizing into an anaerobic microbial community [10]. Packing density affects this succession and interplay of microbial populations, thereby influencing the overall fermentation outcome.
Therefore, this study aims to examine the effects of harvest stage and packing density on the fermentation quality of whole-plant maize silage, with a particular focus on the presence of Clostridium. By analyzing variations in nutritional composition, fermentation characteristics, and microbial community dynamics, this research provides a theoretical foundation for effective silage management and offers valuable insights for enhancing feed quality.
2. Materials and Methods
2.1. Experimental Materials
The maize used in this experiment was cultivated at the Forage Experiment Station of Shihezi University in Xinjiang, located at 44°21′4″ N latitude, 85°57′35″ E longitude, and an altitude of 420 m. The region experiences a continental temperate arid to semi-arid climate, with an average annual precipitation of 233 mm and approximately 2740.6 h of sunshine per year. Whole-plant maize was harvested at three developmental stages: one-third milk line (ML, 1/3 ML), two-thirds ML (2/3 ML), and mature stage. For each harvest stage, the maize plants were chopped into 1–3 cm lengths, and five replicates were prepared. Plastic silage tanks with a total volume of 25 kg/m3 were used for ensiling. For the main fermentation experiment, chopped whole-plant maize from the 2/3 ML stage was promptly transported to the laboratory and packed into plastic fermenters (Table 1) at two target packing densities: 350 kg/m3 and 700 kg/m3.

Table 1.
Loading amount of fermenters for each treatment.
Samples were uniformly grouped using the quartering method to ensure consistency across all fermenters. In total, 30 silage samples were prepared (2 packing densities × 5 fermentation time points × 3 replicates). Silage tanks were opened on days 1, 7, 15, 30, and 60. The top and bottom 10 cm of each sample were discarded, and the material was collected from the middle section, thoroughly mixed, and divided into two portions: one for silage quality analysis and the other for microbial diversity analysis.
2.2. Experimental Methods
2.2.1. Determination of Nutritional Composition
Nutritional composition was determined following the method described by Li et al. [11]. DM content was measured by drying fresh whole-plant maize and silage samples at 65 °C for 72 h. After grinding and sieving the samples through a 1 mm screen, CP content was analyzed using a Kjeldahl nitrogen analyzer (K9840, Shandong Haineng Scientific Instrument Co., Ltd., Jinan, China). NDF and ADF contents were measured using an ST116A fiber analyzer (Shandong Shengtai Instrument Co., Ltd., Jinan, China). WSC were determined using the anthrone reagent method [12], and starch content was measured by the dual-enzyme hydrolysis method [13].
2.2.2. Determination of Fermentation Quality
To assess fermentation quality, 20 g of whole-plant maize silage was collected from the fermenters on days 1, 7, 15, 30, and 60. Each sample was mixed with 180 mL of deionized water and thoroughly shaken. The mixture was then stored at 4 °C for 24 h before being filtered through gauze. The pH of the resulting filtrate was measured immediately using a pH meter. A portion of the filtrate was used to determine the concentrations of lactic acid, acetic acid, propionic acid, and butyric acid using a high-performance liquid chromatograph (HPLC) (Agilent 1200, Shandong Jielun Technology Products Co., Ltd., Jinan, China) [14]. The filtrate was centrifuged at 12,000 rpm for 3 min, and the supernatant was filtered through an aqueous-phase filter membrane before HPLC analysis. The HPLC conditions were as follows: chromatographic column: Shodex RSpak KC-811 column (Showa Denko K.K., Tokyo, Japan) (8 mm × 300 mm); mobile phase: 3 mol/L perchloric acid solution, filtered and degassed; column temperature: 50 °C; injection volume; 5 μL; detection wavelength: 210 nm; flow rate: 1 mL/min. Another portion of the filtrate was used to measure ammonia nitrogen content using the phenol-sodium hypochlorite colorimetric method [15].
2.3. Microbiological Analysis Methods
2.3.1. Determination of Viable Microbial Counts
Twenty grams of fresh whole-plant maize (raw and ensiled) were added to 180 mL of sterile physiological saline and shaken in a shaking incubator (B7 Bo’aosi General Shaking Incubator, Shanghai, China) at 120 rpm for 2 h at 37 °C. The mixture was then allowed to stand. One milliliter of the supernatant was transferred to a test tube containing 9 mL of sterile physiological saline and thoroughly mixed. Serial dilutions were prepared using sterile physiological saline.
A 100 μL aliquot of the 10−6 and 10−7 dilutions was spread onto MRS agar, malt extract agar, nutrient agar (NA), and mold medium (all purchased from Qingdao Haibo Biotechnology Co., Ltd., Qingdao, China), and incubated in an inverted position at 37 °C for 48–72 h. Simultaneously, 100 μL of the same dilutions were spread onto reinforced Clostridial agar medium (Qingdao Haibo Biotechnology Co., Ltd., Qingdao, China), placed in anaerobic gas packs (Mitsubishi Gas Chemical Company, Inc., Tokyo, Japan) with CO2 gas generators (Mitsubishi Gas Chemical Company, Inc., Japan), and incubated in an inverted position in a GH4500 water-jacketed incubator (Tianjin Teste Instrument Co., Ltd., Tianjin, China) at 37 °C for 48–72 h. Each dilution was tested in triplicate [16].
Colony Counting: Colonies were counted manually. Only plates with clearly distinguishable colonies and counts between 30 and 300 were used for quantification. The number of specific microorganisms per gram of fresh matter (FM), expressed as colony-forming units (CFU), was calculated using the following formula: Microbial count (CFU/g FM) = (Number of colonies × Dilution factor × 1000 μL)/Volume of diluted sample plated (μL).
2.3.2. Determination of Microbial Community Diversity
A 0.5 g sample was weighed and ground in liquid nitrogen. Bacterial DNA was extracted using a bacterial genomic DNA extraction kit (DP302, Tiangen Biotech Co., Ltd., Beijing, China). DNA concentration and purity were assessed using a micro nucleic acid quantifier (HM-CWF1, Shandong Hengmei Electronic Technology Co., Ltd., Weifang, China). The nucleic acid concentration was required to exceed 10 ng/μL, with an optimal 260/280 absorbance ratio between 1.8 and 2.0. Qualified DNA samples were used for PCR amplification with universal bacterial primers 27F (5′-AGAGTTTGATCCTGGCTCAG-3′) and 1492R (5′-ACGGTTACCTTGTTACGACTT-3′). The PCR reaction mixture contained: 12.5 μL of 2× Taq Platinum PCR MasterMix, 1 μL of 10 μM forward primer (F), 1 μL of 10 μM reverse primer (R), 10 μL of DNA template (approximately 50–408 ng), and 1.5 μL of ddH2O. The PCR program was as follows: initial denaturation at 94 °C for 2 min; 30 cycles of denaturation at 94 °C for 30 s, annealing at 55 °C for 30 s, and extension at 72 °C for 1.5 min; followed by a final extension at 72 °C for 2 min. The remaining amplification product was stored at −80 °C. PCR products that passed electrophoresis were sent to Sangon Biotech Co., Ltd. (Shanghai, China) for sequencing. [7].
3. Results
3.1. Effects of Harvest Stage on Nutritional Quality and Clostridia of Whole-Plant Maize
3.1.1. Effects of Harvest Stage on Nutritional Quality of Whole-Plant Maize
As shown in Table 2, the WSC content at the 2/3 ML stage was significantly lower than at the 1/3 ML stage (30.12 g/kg DM vs. 40.56 g/kg DM, p < 0.01), and significantly lower still at the ML stage compared to the 2/3 ML stage (15.58 g/kg DM vs. 30.12 g/kg DM, p < 0.01).
Table 2.
Nutrient composition analysis of whole-plant maize.
Starch content significantly increased during the maturation of whole-plant maize, rising by 34.0% from the 1/3 ML to the 2/3 ML stage (27.96 g/kg DM vs. 20.87 g/kg DM, p < 0.01), and by 13.4% from the 2/3 ML to the ML stage (31.70 g/kg DM vs. 27.96 g/kg DM, p < 0.01). No significant differences were observed in DM, NDF, ADF, or crude protein content (p > 0.05).
3.1.2. Impact of Harvest Stage on the Number of Clostridium in Whole-Plant Corn
As shown in Table 3, there were no significant differences (p > 0.05) in the counts of lactic acid bacteria, aerobic bacteria, yeasts, Clostridium, or molds among the different harvest stages.
Table 3.
The effect of harvest period on the microbial count of whole-plant maize.
3.1.3. Impact of Harvest Stage on the Relative Abundance of Clostridium in Whole-Plant Corn
As shown in Figure 1, at the phylum level, Proteobacteria (relative abundance 40.83–58.98%), Firmicutes (15.87–42.93%), and Cyanobacteria (11.84–25.20%) were predominant. At the genus level, the main genera included Lactobacillus (7.88–18.87%), Weissella (3.5–17.69%), and Pantoea (5.93–8.42%). Clostridium was detected across all harvest stages (1/3 ML, 2/3 ML, and ML) with low relative abundance (0.006–0.012%, p > 0.05). The relative abundance of Ruminiclostridium at 2/3 ML was lower than at 1/3 ML (0.002% vs. 0.006%, p > 0.05).
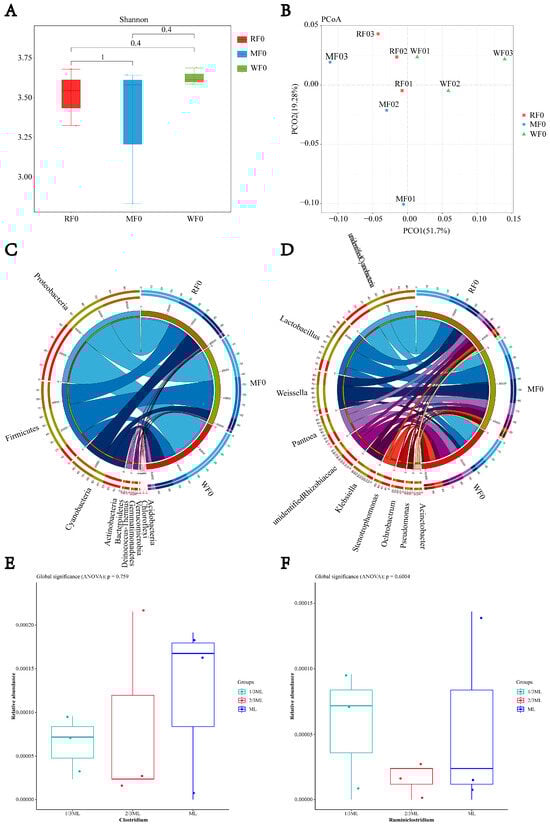
Figure 1.
The effect of harvest period on the relative abundance of Clostridium in whole-plant Maize. (A) Alpha diversity; (B) PCoA analysis; (C) relative abundance of bacteria at the phylum level; (D) relative abundance of bacteria at the genus level; (E) relative abundance of Clostridium; (F) relative abundance of Ruminiclostridium. RF0: 1/3 ML stage; MF0: 2/3 ML stage; WF0: maturity stage.
3.2. Impact of Compaction Density on Whole-Plant Corn Silage Quality and Clostridium
3.2.1. Impact of Compaction Density on the Nutritional Composition of Whole-Plant Corn Silage
As shown in Table 4, the DM content in the high-density group (700 kg/m3) was significantly higher than that in the low-density group (350 kg/m3) on days 1, 7, 15, 30, and 60 of fermentation, with differences of 0.32%, 3.63%, 7.71%, 7.82%, and 6.61%, respectively (p < 0.05). After 60 days of ensiling, DM loss was significantly lower in the high-density group compared to the low-density group (3.37% vs. 9.39%, p < 0.05). Compared to day 1, WSC content in the high-density group significantly decreased after 60 days of fermentation (7.31 g/kg vs. 18.88 g/kg, p < 0.05). Similarly, the WSC content in the low-density group also showed a significant decrease (5.95 g/kg vs. 18.25 g/kg, p < 0.05).
Table 4.
The effect of compaction density on the nutritional components of whole-plant corn silage.
3.2.2. Impact of Compaction Density on the Fermentation Quality of Whole-Plant Corn Silage
As shown in Table 5, from day 7 to day 60 of fermentation, the lactic acid content in the high-density group was significantly higher than in the low-density group by 14.29%, 10.00%, 8.33%, and 9.68%, respectively (p < 0.01). On days 7 and 15, the ammonia-N content in the high-density group was significantly lower than that in the low-density group by 20.00% and 16.67%, respectively (p < 0.01). On days 30 and 60, the butyric acid content in the high-density group decreased by 56.25% and 50%, respectively, compared to the low-density group (p < 0.01). The pH of the high-density group on day 60 was significantly lower than on day 1 (3.80 vs. 5.30, p < 0.05).
Table 5.
The Effect of compaction density on the fermentation quality of whole-plant maize silage.
Similarly, the low-density group showed a significant pH decrease on day 60 compared to day 1 (3.90 vs. 5.50, p < 0.05). Compared to day 1, the high-density group exhibited significant increases on day 60 in lactic acid (6.80 vs. 1.03 g/kg, p < 0.05), acetic acid (1.33 vs. 0.31 g/kg, p < 0.05), butyric acid (0.09 vs. 0.01 g/kg, p < 0.05), and lactic acid/acetic acid ratio (5.11 vs. 3.32, p < 0.05).
3.2.3. Impact of Compaction Density on the Number of Clostridium in Whole-Plant Corn Silage
As shown in Table 6, on days 30 and 60 of fermentation, the number of Clostridium in the high-density group was significantly lower than in the low-density group, decreasing by 24.17% and 16.35%, respectively (p < 0.01). Additionally, on days 7, 15, 30, and 60, the number of lactic acid bacteria in the high-density group was significantly higher than in the low-density group by 14.48%, 6.95%, 6.39%, and 6.34%, respectively (p < 0.05).
Table 6.
The effect of compaction density on the nutritional components of whole-plant maize silage.
3.2.4. Impact of Compaction Density on the Relative Abundance of Clostridium in Whole-Plant Corn Silage
As shown in Figure 2, there was no significant difference in the Shannon index among all groups (p > 0.05). However, microbial composition differed significantly among groups during days 1 to 60 of fermentation (p < 0.05). At the genus level, differential species in the MLF4 group included Ruminiclostridium (relative abundance 0.40%), Anaerosinus (0.40%), and RummeliiBacillus (1.17%). Notably, the relative abundance of Ruminiclostridium in the MLF4 group was significantly lower than in the MHF4 group (0.007% vs. 0.40%), representing a 98.25% decrease (p < 0.01). From days 1 to 30 of fermentation, the relative abundance of Clostridium gradually increased in both high- and low-density groups, peaking on day 30 (0.05% vs. 0.12%, p < 0.05), before decreasing as fermentation progressed. Furthermore, on day 30, the relative abundance of Ruminiclostridium in the high-density group was significantly lower than in the low-density group (0.12% vs. 0.40%, p < 0.05).
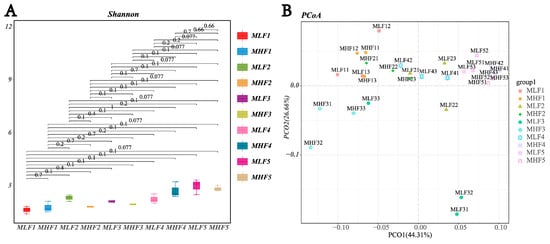
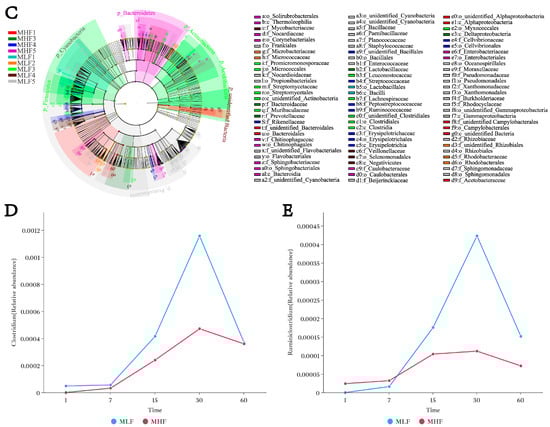
Figure 2.
The effect of compaction density on the relative abundance of spoilage Clostridium in whole-plant maize. (A) Alpha diversity; (B) PCoA analysis; (C) Lefse multi-level taxonomic hierarchy. (D) Changes in the relative abundance of the genus Clostridium in MLF and MHF groups over the fermentation period. (E) Changes in the relative abundance of the genus Ruminiclostridium in MLF and MHF groups over the fermentation period. MLF: Whole-plant maize harvested at the 2/3 milk line stage and ensiled (silage fermentation). MFL1: fermentation 1 d (350 kg/m3); MFL1: fermentation 1 d (350 kg/m3); MFL2: fermentation 7 d (350 kg/m3); MFL3: fermentation 15 d (350 kg/m3); MFL4: fermentation 30 d (350 kg/m3); MFL5: fermentation 60 d (350 kg/m3). MHL1: fermentation 1 d (700 kg/m3); MHL2: fermentation 7 d (700 kg/m3); MHL3: fermentation 15 d (700 kg/m3); MHL4: fermentation 30 d (700 kg/m3); MHL5: fermentation 60 d (700 kg/m3).
3.2.5. Analysis of the Correlation Between Whole-Plant Corn Silage Fermentation Quality and Clostridium
As shown in Figure 2 and Figure 3, there was a negative correlation between putrefactive Clostridium and lactic acid bacteria (R2 = −0.58, p < 0.01). Putrefactive Clostridium was negatively correlated with pH, lactic acid, and acetic acid (R2 = −0.25, R2 = −0.23, R2 = −0.09, p > 0.05), and positively correlated with ammonia-N (R2 = 0.28, p > 0.05).
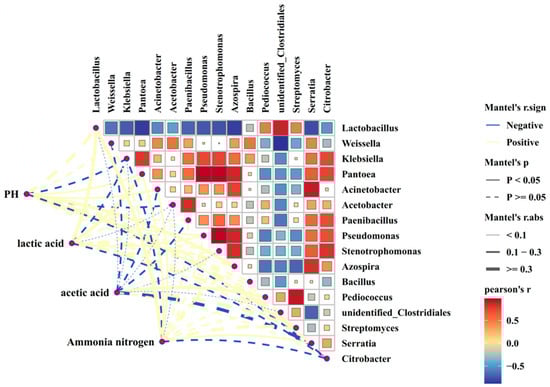
Figure 3.
Correlation analysis between fermentation quality and spoilage Clostridium in whole-plant maize silage. in the correlation diagram, the color represents the correlation coefficient, r, which ranges from −0.5 to 0.5. r < 0 indicates a negative correlation, while r > 0 indicates a positive correlation.
4. Discussion
The continuous increase in DM content during corn maturation results from the accumulation of DM in leaves, stems, and ears as the plant shifts from vegetative to reproductive stages [17]. Previous studies show that WSC are consumed for grain development and other metabolic activities during maturation. Consistent with this, our results reveal significantly lower WSC content at 2/3 ML and ML compared to 1/3 ML. ADF, linked to cellulose and lignin in cell walls [18], increases with plant senescence and lignification [17]. Accordingly, NDF and ADF gradually increased from 1/3 ML to ML, reflecting the conversion of green tissue to lignified material [19]. CP content decreases during maturation, as leaf protein synthesis is higher early on [20], but nitrogen is later redirected from stems and leaves to grains, lowering CP in vegetative parts [21]. Meanwhile, starch content increased steadily, paralleling grain development, since starch serves as the main storage compound during grain filling [22,23].
This study demonstrated that the high-density group effectively reduced DM loss in whole-plant corn silage by optimizing the anaerobic environment and promoting lactic acid fermentation throughout the fermentation process. Previous research indicates that high-density packing, by regulating the quantity and types of inoculated microorganisms, supports the dominance of beneficial lactic acid bacteria, thereby enhancing the anaerobic conditions and significantly minimizing DM loss during silage production [24]. This approach not only improves feed nutritional quality but also offers a more efficient preservation method for animal husbandry [25].
The fermentation quality of whole-plant corn silage is influenced by multiple factors, including compaction density, fermentation duration [26], and dynamic changes in microbial communities [27]. During ensiling, the metabolic activity and community structure of lactic acid bacteria play a direct role in determining fermentation quality [28]. Our results showed that lactic acid content in the high-density group was significantly higher than in the low-density group from day 7 to day 60 of fermentation, indicating that a high-density environment promotes substantial lactic acid accumulation. This occurs because the high-density packing rapidly establishes anaerobic conditions, allowing lactic acid bacteria to multiply swiftly under low-oxygen conditions [29], with lactic acid as the primary metabolic product of anaerobic fermentation [30]. Additionally, prolonged fermentation enhances the sustained activity of lactic acid bacteria, leading to continuous increases in lactic acid content while reducing acetic acid and ammonia-N production. Previous studies have found that with extended fermentation, lactic acid bacteria preferentially produce lactic acid via homofermentation rather than acetic acid via heterofermentation [31], which aligns with our experimental findings.
Compaction density is a critical factor in whole-plant corn silage production, significantly affecting microbial community structure and fermentation quality [32]. This study found that the number of Clostridium in the high-density group was significantly lower than in the low-density group on days 30 and 60 of fermentation, decreasing by 24.17% and 16.35%, respectively. This inhibition likely results from the rapid growth and acid production by lactic acid bacteria under high-density conditions, which cause a swift pH drop, creating an acidic environment unfavorable for Clostridium growth. However, micro-environmental variations, such as localized aerobic and strictly anaerobic zones within high-density silage, may cause uneven fermentation and prevent complete suppression of spoilage bacteria in certain areas [33]. The relative abundance of Ruminiclostridium decreased by 50% in the high-density group, possibly due to the combined inhibitory effects of fluctuating local redox conditions and the acidic environment. Previous research indicates that the growth and metabolism of this anaerobic microorganism are highly sensitive to environmental redox potential [34]. When local redox status shifts, especially toward a more oxidative state, the activity and proliferation of anaerobes like Ruminiclostridium are inhibited [35]. Additionally, an acidic environment (lower pH) stresses this genus by compromising cell membrane stability and metabolic enzyme function, leading to a decline in their population [36].
The results of this study revealed a negative correlation between Clostridium and lactic acid bacteria, suggesting that lactic acid bacteria may produce antimicrobial substances such as hydrogen peroxide and extracellular polypeptides that inhibit Clostridium [37]. The negative correlations between Clostridium and pH, lactic acid, and acetic acid indicate that the accumulation of these organic acids helps maintain a low pH, thereby suppressing the growth of Clostridium. Previous research has demonstrated that when silage pH drops below 4.5, the growth of Clostridium is effectively controlled. This rapid acidification is primarily driven by lactic acid bacteria, whose lactic acid production enhances environmental acidity, creating unfavorable conditions for anaerobic spore-forming bacteria like Clostridium [38]. Additionally, the study identified a positive correlation between Clostridium and ammonia-N, likely because Clostridium decomposes proteins and amino acids, producing ammonia-N. This suggests that higher Clostridium populations lead to increased protein degradation, raising ammonia-N concentrations. Therefore, lowering pH and promoting lactic acid bacteria growth in corn silage provides a theoretical foundation for inhibiting Clostridium and improving silage quality.
5. Conclusions
Harvesting period and compaction density significantly impact the fermentation quality and microbial community structure of whole-plant corn silage. High compaction density helps reduce dry matter loss and significantly inhibits the proliferation of Clostridium. Within the first 30 days of fermentation, the relative abundance of Clostridium rapidly increases, reaching a peak on day 30, and then gradually decreases. On day 30, the Clostridium abundance in the high-density group was significantly lower than that in the low-density group, indicating a stronger inhibitory effect of high density. Concurrently, high compaction density promotes the growth of lactic acid bacteria, which helps optimize the fermentation environment and improve silage quality.
Author Contributions
Conceptualization, F.Y.; methodology, D.F.; software, L.S.; validation, X.Y.; formal analysis, F.Y.; investigation, F.Y.; resources, J.L.; data curation, J.L.; writing—original draft preparation, F.Y.; writing—review and editing, F.Y.; visualization, L.S.; supervision, C.M.; project administration, C.M.; funding acquisition, C.M. All authors have read and agreed to the published version of the manuscript.
Funding
This research was funded by the Ministry of Finance and the Ministry of Agriculture and Rural Affairs: National Modern Agricultural Industry Technology System Project, grant number CARS-34, and the APC was funded by CARS-34.
Institutional Review Board Statement
Not applicable.
Informed Consent Statement
Not applicable.
Data Availability Statement
The original contributions presented in this study are included in the article. Further inquiries can be directed to the corresponding author.
Acknowledgments
Nutritional composition, fermentation quality, and viable microbial counts were analyzed using both one-way and two-way analyses of variance (ANOVA) in SPSS software, version 20.0 (IBM Corp., Armonk, NY, USA). Additional statistical analyses were performed using the stats package (version 4.3.2) in R software (version 4.3.2; R Core Team, Vienna, Austria), and data visualization was conducted with the ggplot2 package (version 3.5.0; Wickham, 2016).
Conflicts of Interest
The authors declare no conflicts of interest.
References
- Temudo, M.F.; Muyzer, G.; Kleerebezem, R.; van Loosdrecht, M.C. Diversity of microbial communities in open mixed culture fermentations: Impact of the pH and carbon source. Appl. Microbiol. Biotechnol. 2008, 80, 1121–1130. [Google Scholar] [CrossRef]
- Wang, Q.; Wang, R.; Wang, C.; Dong, W.; Zhang, Z.; Zhao, L.; Zhang, X. Effects of cellulase and Lactobacillus plantarum on fermentation quality, chemical composition, and microbial community of mixed silage of whole-plant corn and peanut vines. Appl. Biochem. Biotechnol. 2022, 194, 2465–2480. [Google Scholar] [CrossRef]
- Yousef, A.E.; Carlström, C. Food Microbiology: A Laboratory Manual, 2nd ed.; Marcel Dekker: New York, NY, USA, 2003; pp. 1–250. [Google Scholar]
- Li, L.; Xie, Z.; Ning, J.; Zhang, Y.; Sang, Y.; Zhang, L.; Liu, F. An acid-tolerant Clostridium sp. BLY-1 strain with high biohydrogen production rate. Bioresour. Technol. 2024, 409, 131227. [Google Scholar] [CrossRef]
- Li, Y.; Shao, X.; Li, Y.; Xiao, M. Dynamics of physiological characteristics and dry matter accumulation under rain-water storage irrigation. Int. J. Agric. Biol. Eng. 2021, 14, 123–131. [Google Scholar] [CrossRef]
- Liye, C.; Zhenwen, Z. Research of the relationship between photosynthesis and dry matter accumulation in Cabernet Sauvignon leaves. Acta Agric. Boreali-Occident. Sin. 2013, 22, 45–50. [Google Scholar]
- Chen, B.; Feng, S.L.; Hou, J.F.; Zhu, Y.; Bao, F.; Han, H.L.; Tan, H.P.; Wang, G.Y.; Zhao, F.C. Genome-wide transcriptome analysis revealing the genes related to sugar metabolism in kernels of sweet corn. Metabolites 2022, 12, 1254. [Google Scholar] [CrossRef]
- Zhao, H.; Su, T.; Huo, L.; Wei, H.; Jiang, Y.; Xu, L.; Ma, F. Unveiling the mechanism of melatonin impacts on maize seedling growth: Sugar metabolism as a case. J. Pineal Res. 2015, 59, 255–266. [Google Scholar] [CrossRef]
- Abdelgawad, H.; Avramova, V.; Baggerman, G.; Van Raemdonck, G.; Valkenborg, D.; Van Ostade, X.; Guisez, Y.; Prinsen, E.; Asard, H.; Van den Ende, W. Starch biosynthesis contributes to the maintenance of photosynthesis and leaf growth under drought stress in maize. Plant Cell Environ. 2020, 43, 2254–2271. [Google Scholar] [CrossRef]
- Liu, Y.; Wang, G.; Wu, H.; Meng, Q.; Khan, M.Z.; Zhou, Z. Effect of hybrid type on fermentation and nutritional parameters of whole plant corn silage. Animals 2021, 11, 1587. [Google Scholar] [CrossRef]
- Li, X.X.; Li, J.Z. Optimization of anthrone colorimetric method for determination of soluble sugar content in sweet corn. Storage Process. 2013, 17, 24–27. [Google Scholar]
- Cai, K.K.; Huang, Z.W.; Shen, Z.Y.; Sun, C.T. Study on enzymatic hydrolysis of rice bran starch by double enzymes. Chin. J. Cereals Oils 2013, 18, 17–23. [Google Scholar]
- Chen, Y.; Yu, W.Q.; Yang, D.F.; He, Z.G.; Lin, W.Z.; Wei, W.; Xie, H.G. Simultaneous determination of organic acid content in fruits and fruit wine by high performance liquid chromatography. In Proceedings of the 16th Annual Conference of Fujian Association for Science and Technology—Agricultural Branch, Fuzhou, China, 15–17 October 2016. [Google Scholar]
- Maitisaiyidi, T.N.; Yibureyimu, A.G.; Ayishaira, A.; Yang, K.L. Determination of ammonia nitrogen concentration in rumen fluid treated with methanol by alkaline sodium hypochlorite-phenol spectrophotometry. Xinjiang Agric. Sci. 2012, 49, 6–10. [Google Scholar]
- Chen, G.; Liu, M.; Zhao, X.; Bawa, G.; Liang, B.; Feng, L.; Pu, T.; Yong, T.; Liu, W.; Liu, J.; et al. Improved photosynthetic performance under unilateral weak light conditions in a wide-narrow-row intercropping system is associated with altered sugar transport. J. Exp. Bot. 2024, 75, 258–273. [Google Scholar] [CrossRef]
- Yu, H.L.; Wu, Y.Q.; Zhang, Y.; Wang, Y.B. Analysis of key biological pathways for sugar accumulation during kernel development in different genotypes of sweet corn. Pak. J. Bot. 2022, 55, 1001–1012. [Google Scholar] [CrossRef]
- Cardinal, A.; Lee, M.; Moore, K. Genetic mapping and analysis of quantitative trait loci affecting fiber and lignin content in maize. Theor. Appl. Genet. 2003, 106, 866–874. [Google Scholar] [CrossRef]
- Ferreira, G.; Martin, L.L.; Teets, C.L.; Corl, B.A.; Hines, S.L.; Shewmaker, G.E.; de Haro-Marti, M.E.; Chahine, M. Effect of drought stress on in vitro neutral detergent fiber digestibility of corn for silage. Anim. Feed Sci. Technol. 2021, 273, 114803. [Google Scholar] [CrossRef]
- Krakowsky, M.D.; Lee, M.; Coors, J.G. Quantitative trait loci for cell-wall components in recombinant inbred lines of maize (Zea mays L.) I: Stalk tissue. Theor. Appl. Genet. 2005, 111, 337–346. [Google Scholar] [CrossRef]
- Wang, H.; Zhang, X.; Zhang, G.; Fang, Y.; Hou, H.; Lei, K.; Ma, Y. Regulation of Density and Fertilization on Crude Protein Synthesis in Forage Maize in a Semiarid Rain-Fed Area. Agriculture 2023, 13, 715. [Google Scholar] [CrossRef]
- Liu, J.; He, Q.; Wu, Y.; Xiao, X.; Sun, W.; Lin, Y.; Yi, R.; Pan, X. The Effect of Sowing Date on the Nutritional Quality of Kernels of Various Maize Varieties in Northeast China. Agronomy 2023, 13, 2543. [Google Scholar] [CrossRef]
- Wilhelm, E.P.; Mullen, R.E.; Keeling, P.L.; Singletary, G.W. Heat stress during grain filling in maize: Effects on kernel growth and metabolism. Crop Sci. 1999, 39, 1733–1741. [Google Scholar] [CrossRef]
- Kim, J.T.; Yi, G.; Kim, M.J.; Son, B.Y.; Bae, H.H.; Go, Y.S.; Kim, S.L.; Baek, S.B.; Kim, S.H.; Chung, I.M. Glycolysis stimulation and storage protein accumulation are hallmarks of maize (Zea mays L.) grain filling. Appl. Biol. Chem. 2020, 63, 54. [Google Scholar] [CrossRef]
- Yang, J.; Wei, J.; Ran, L.; Liu, P.; Xiong, F.; Yu, X. The accumulation and properties of starch are associated with the development of nutrient transport tissues at grain positions in the spikelet of wheat. Int. J. Biol. Macromol. 2024, 282, 137048. [Google Scholar] [CrossRef]
- Liu, S.; Du, C.; Feng, J.; Jia, Y.; Hao, Z.; Xie, Y.; Wang, C.; Ma, D. Characterization of Starch Physicochemical Properties and Grain Transcriptome Reveal the Mechanism for Resistant Starch Accumulation. Agronomy 2023, 13, 1482. [Google Scholar] [CrossRef]
- Guan, H.; Yan, Y.; Li, X.; Li, X.; Shuai, Y.; Feng, G.; Ran, Q.; Cai, Y.; Li, Y.; Zhang, X. Microbial communities and natural fermentation of corn silages prepared with farm bunker-silo in Southwest China. Bioresour. Technol. 2018, 265, 282–290. [Google Scholar] [CrossRef]
- Zhang, Z.; Wang, Y.; Wang, S.; Zhao, L.; Zhang, B.; Jia, W.; Zhai, Z.; Zhao, L.; Li, Y. Effects of antibacterial peptide-producing Bacillus subtilis, gallic acid, and cellulase on fermentation quality and bacterial community of whole-plant corn silage. Front. Microbiol. 2022, 13, 1028001. [Google Scholar] [CrossRef]
- Zhang, F.; Miao, F.; Wang, X.; Lu, W.; Ma, C. Effects of homo- and hetero-fermentative lactic acid bacteria on the quality and aerobic stability of corn silage. Can. J. Anim. Sci. 2021, 101, 761–770. [Google Scholar] [CrossRef]
- Puntillo, M.; Gaggiotti, M.; Oteiza, J.M.; Binetti, A.; Massera, A.; Vinderola, G. Potential of lactic acid bacteria isolated from different forages as silage inoculants for improving fermentation quality and aerobic stability. Front. Microbiol. 2020, 11, 561235. [Google Scholar] [CrossRef]
- Liu, H.; Li, X.; Hu, J.; Zhao, J.; Xu, G.; Dong, D.; Jia, Y.; Shao, T. Fermentation Quality and Aerobic Stability Evaluation of Rice Straw Silage with Different Ensiling Densities. Fermentation 2024, 10, 20. [Google Scholar] [CrossRef]
- Xu, G.; Yang, F.; Hu, J.; Wang, Y.; Dong, D.; Dong, Z.; Li, J.; Shao, T. Effect of ensiling density on fermentation characteristics and aerobic stability of Pennisetum giganteum silages. Agronomy 2024, 14, 1990. [Google Scholar] [CrossRef]
- Bai, C.; Pan, G.; Leng, R.; Ni, W.; Yang, J.; Sun, J.; Yu, Z.; Liu, Z.; Xue, Y. Effect of ensiling density and storage temperature on fermentation quality, bacterial community, and nitrate concentration of sorghum-sudangrass silage. Front. Microbiol. 2022, 13, 828320. [Google Scholar] [CrossRef]
- Liu, J.; Hao, J.; Zhao, M.; Yan, X.; Jia, Y.; Wang, Z.; Ge, G. Effects of different temperature and density on quality and microbial population of wilted alfalfa silage. BMC Microbiol. 2024, 24, 380. [Google Scholar] [CrossRef]
- Sim, X.Y.; Tan, J.P.; He, N.; Yeap, S.K.; Hui, Y.W.; Luthfi, A.A.I.; Manaf, S.F.A.; Bukhari, N.A.; Jamali, N.S. Unraveling the effect of redox potential on dark fermentative hydrogen production. Renew. Sustain. Energy Rev. 2023, 187, 113755. [Google Scholar] [CrossRef]
- Wang, X.N.; Sun, G.X.; Zhu, Y.G. Thermodynamic energy of anaerobic microbial redox reactions couples elemental biogeochemical cycles. J. Soils Sediments 2017, 17, 2831–2846. [Google Scholar] [CrossRef]
- Lund, P.A.; De Biase, D.; Liran, O.; Scheler, O.; Mira, N.P.; Cetecioglu, Z.; Noriega Fernández, E.; Bover-Cid, S.; Hall, R.; Sauer, M. Understanding how microorganisms respond to acid pH is central to their control and successful exploitation. Front. Microbiol. 2020, 11, 556140. [Google Scholar] [CrossRef] [PubMed]
- Wang, W.; Yuan, X. Effect of lactic acid bacteria on the fermentation quality and mycotoxins concentrations of corn silage infested with mycotoxigenic fungi. Toxins 2021, 13, 699. [Google Scholar] [CrossRef]
- Ward, R.T. Fermentation Analysis of Silage: Use and Interpretation; Forage Lab: Waynesboro, PA, USA, 2012; pp. 1–20. [Google Scholar]
Disclaimer/Publisher’s Note: The statements, opinions and data contained in all publications are solely those of the individual author(s) and contributor(s) and not of MDPI and/or the editor(s). MDPI and/or the editor(s) disclaim responsibility for any injury to people or property resulting from any ideas, methods, instructions or products referred to in the content. |
© 2025 by the authors. Licensee MDPI, Basel, Switzerland. This article is an open access article distributed under the terms and conditions of the Creative Commons Attribution (CC BY) license (https://creativecommons.org/licenses/by/4.0/).