Abstract
Flavohemoglobins, which are widely distributed in prokaryotes and eukaryotes, play key roles in oxygen (O2) transport and nitric oxide (·NO) defense. Hmp is the flavohemoglobin of Escherichia coli, and here we report that the translational fusion of Hmp to the N-terminus of heterologous proteins increases their expression in E. coli. The effect required the fusion of the proteins, and was independent of both the O2-binding and catalytic activity of Hmp. Increased expression was at the translational level, likely to be downstream of initiation, and we observed that as little as the first 100 amino acids of Hmp were sufficient to boost protein production. These data demonstrate the potential of Hmp as an N-terminal fusion tag to increase protein yield, and suggest that the utility of bacterial hemoglobins to biotechnology goes beyond their O2 transport and ·NO detoxification capabilities.
1. Introduction
Flavohemoglobins are composed of globin domains, which can bind heme, fused to FAD- and NAD(P)-binding domains that facilitate electron transfer [1]. They are widely distributed in prokaryotes and eukaryotes and Hmp is the flavohemoglobin of E. coli, which is arguably the most studied [2]. While the main functions of mammalian globins, such as hemoglobin and myoglobin, are O2 transport and supply, the main function of Hmp has been attributed to nitric oxide (·NO) detoxification, where it uses O2 and reducing equivalents to convert ·NO to NO3− [3,4]. Indeed, Hmp is the main ·NO detoxification enzyme for E. coli at dissolved O2 concentrations ranging from fully aerobic down to 1 µM [5]. Additional reactions Hmp has been found to catalyze include ·NO conversion to N2O under anaerobic conditions, and the reduction of O2 to O2− in the absence of ·NO, which can be deleterious [6,7]. Hmp expression in E. coli is largely regulated by NsrR, which represses its transcription in the absence of ·NO, and thus, under normal growth, Hmp is present in cells at trace levels and is induced in response to nitrosative stress [8,9].
Beyond Hmp, numerous microbial hemoglobins have been implicated in ·NO detoxification [10]. However, it was their O2-binding capacity that inspired researchers to use them in high-density fermenters to serve as an O2 reservoir [11,12]. For example, Khosla and Bailey expressed Vitreoscilla hemoglobin (VHb) in E. coli from a plasmid and observed increased growth compared to the empty vector control [11], whereas later work with genomically-integrated VHb increased protein production under O2 limitations [12]. Bioprocess applications of VHb overexpression continued, and improvements to protein expression, overall fitness, and chemical production were observed in multiple microbes, including E. coli [13,14], B. subtilis [15], P. aeruginosa [16], Streptomyces sp. [17], S. cerevisiae [18], P. pastoris [19], and S. cinnamonensis [20]. Initial hypotheses about the mechanism behind these phenomena centered on the O2-binding capacity of VHb, and its ability to serve as an O2 source under O2-limited conditions, and thus increase the efficiency of metabolism [12,13,21,22,23]. Later, the ·NO detoxification capabilities of bacterial flavohemoglobins became apparent, which could protect respiratory terminal oxidases from inhibition by ·NO, and it was found that VHb directly binds to a component of cytochrome bo, which could also impact respiratory metabolism [21,24,25]. Indeed, while the exact mechanism remains incompletely defined [26], VHb has proven to be a valuable biotechnology tool for high-density, low-O2 fermentations [22,27].
Here, we describe our discovery that the fusion of Hmp to various heterologous proteins (super folder GFP (sfGFP), mCherry, bovine β-casein (β-csn)) significantly increases their expression in E. coli. The phenomenon required Hmp to be fused to the N-terminus of the target protein, it required at least the first 100 amino acids of Hmp, and it was not dependent on the catalytic activity or O2-binding ability of Hmp. Importantly, unlike the effect of VHb, the expression of Hmp as a non-fused protein failed to increase target protein production appreciably. Results provided here demonstrate the potential use of Hmp as a fusion tag, and suggest a novel mechanism by which bacterial hemoglobins can increase protein production in biotechnology.
2. Materials and Methods
2.1. Strains and Plasmids
Bacterial strains and plasmids used in this study are summarized in Supplemental Table S1 [28,29,30,31,32,33,[34,35,36]. E. coli K-12 MG1655 strain was used as wild-type. Plasmids were constructed with Q5 site-direct mutagenesis kit (New England Biolabs, Ipswich, MA, USA) or Hifi DNA assembly kit (New England Biolabs, Ipswich, MA, USA) using plasmids from previous studies, synthetic DNA inserts (Genewiz, South Plainfield, NJ, USA), or genomic DNA as templates. All plasmid sequences were confirmed with Sanger sequencing (Genewiz, South Plainfield, NJ, USA).
2.2. Growth Media and Chemicals
Components of growth media and antibiotics were purchased from Fisher Scientific (Pittsburgh, PA, USA), Sigma Aldrich (Milwaukee, WI, USA), or Thermo Fisher Scientific (Waltham, MA, USA) and isopropyl-β-d-thiogalactopyranoside (IPTG) was purchased from Gold Biotechnology (St. Louis, MO, USA). Growth media used in this study were LB broth and M9 minimal media. LB broth was made by dissolving pre-mixed powder (40/40/20 weight percent tryptone, NaCl, and yeast extract, respectively) in Milli-Q water (resistivity of 18.2 MΩ × cm) in a ratio of 25 g LB mix/L water, which was then autoclaved. Concentrated (5X) M9 minimal salts solution was made by dissolving 33.9 g/L Na2HPO4, 15 g/L KH2PO4, 5g/L NH4Cl, and 2.5 g/L NaCl in Milli-Q water, which was then autoclaved. To make M9 minimal media, Milli-Q water, 5× M9 minimal salts solution, CaCl2, MgSO4, and glucose were mixed to reach a final concentration of 1× M9 minimal salts, 0.1 mM CaCl2, 2 mM MgSO4, and 10 mM glucose, which was then sterilized with a 0.22 µm filter (Thermo Fisher Scientific, Waltham, MA, USA).
2.3. Fluorophore Expression Assay
Cells were grown aerobically from −80 °C frozen stock in 1 mL LB at 37 °C and 250 rpm for 4 h. Ten µL of the LB pre-culture was used to inoculate 1 mL of M9 minimal media at 37 °C and 250 rpm for overnight growth. The overnight culture was inoculated into 2 mL of fresh M9 media to an OD600 of 0.01, and grown until mid-exponential phase (OD600 = 0.2). At that point, cultures were induced with 1 mM IPTG when needed and transferred to 96-well black, clear-bottom plates (Corning Incorporated Inc., Corning, NY, USA) that were incubated at 37 °C and 250 rpm with the lid on. Ampicillin (100 μg/mL) or kanamycin (50 μg/mL) was added to cultures as needed for plasmid maintenance.
Cell concentration (OD600) and fluorescence (485/515 nm excitation/emission for sfGFP, or 580/610 nm excitation/emission for mCherry) were quantified using a SynergyTM H1 Hybrid Microplate Reader in 96-well black, clear-bottom plates (Corning Incorporated Inc., Corning, NY, USA). sfGFP/OD600 was reported after subtracting the background signal, which was taken as sfGFP/OD600 of wild-type carrying an empty pQE80L or pUA66 plasmid that was induced identically as samples. When the fluorescence signals were near the limit of detection for the plate reader (mCherry expressed by MO001 strain, and sfGFP expressed by pUA66 plasmid), measurements were conducted with flow cytometry instead. For flow cytometry, at each time point, 300 µL samples were collected, centrifuged at 15,000 rpm for 3 min, fixed with 4% (w/v) paraformaldehyde for 15–30 min, washed with PBS, and fluorescence was measured with LSRII flow cytometer (BD Biosciences, San Jose, CA, USA) with bandpass filters of 525/50 nm for sfGFP and 610/20 nm for mCherry. Median fluorescence readings (AU) from samples were used.
2.4. β-Galactosidase Assay
ΔlacZYA harboring pQE80L, pQE80-hmp-lacZ, and pQE80-lacZ were assayed for β-galactosidase activity. Cells were prepared as described in Section 2.3. The β-galactosidase assay was conducted following the protocol described by Miller [37], with minor modifications to adapt measurements for 96-well plates [38]. Briefly, upon reaching the exponential phase of growth, cells were induced with 1 mM IPTG. At each time point, 300 µL samples were collected, centrifuged at 15,000 rpm for 3 min, and washed with Z-buffer (60 mM Na2HPO4 · 7H2O, 40 mM NaH2PO4 · H2O, 10 mM KCl, 1 mM MgSO4 · 7H2O, 50 mM β-mercaptoethanol). OD600 was measured at that point, and then cells were permeabilized with 5 µL of 1% SDS and 10 µL chloroform, vortexed for 10 s, and stored on ice. After collection of all samples, and allowing the chloroform to settle to the bottom of the centrifuge tubes, permeabilized samples (1 µL for induced and 100 µL for uninduced) were transferred to flat-bottom 96-well plates (USA Scientific, Inc., Enfield, CT, USA). Z-buffer was added to each well of induced samples to reach 100 µL of total volume, and the reaction was initiated by the addition of 20 µL ONPG (4 µg/mL). After incubation at room temperature for an appropriate length of time (7 min for induced and 12 min for uninduced), the reaction was terminated by the addition of 50 µL of 1M Na2CO3. The absorption at 420 nm (OD420) and 550 nm (OD550) were measured, and the Miller units (MU) were calculated based on the formula below [37]:
where T is the time of the reaction in minutes, and V is the volume of culture used in the assay in mL. We note that the procedure was modified slightly between induced and uninduced samples because of the large difference in signal between those conditions.
2.5. Detection of LacZ, sfGFP, and Their Hmp Fusions by SDS-PAGE
The preparation of cells was described earlier in Section 2.3 and Section 2.4. After IPTG induction (3 h for sfGFP, Hmp100-sfGFP, and Hmp-sfGFP, 1 h for LacZ and Hmp-LacZ), cell cultures were centrifuged at 15,000 rpm for 3 min, and resuspended in Milli-Q water. The OD600 of each sample was measured to make sure similar cell numbers were loaded into each well. Afterward, samples were mixed with 2× Laemmli Sample Buffer, boiled for 15 min, and centrifuged at 15,000 rpm for 10 min. Supernatants were loaded into the wells of Mini-PROTEAN TGX stain-free precast gels (Bio-Rad Laboratories, Inc., Richmond, CA, USA) for SDS-PAGE, following the manufacturer’s instructions. Protein gels were visualized on a Bio-Rad GelDoc. Densitometry data were generated using ImageJ [39].
2.6. β-Casein Expression and Detection by Western Blot
Wild-type harboring pQE80-β-csn and pQE80-hmp-β-csn were grown from −80 °C frozen stock in 1 mL LB at 37 °C and 250 rpm overnight. After overnight growth, 200 μL of culture was used to inoculate 20 mL of LB media at 37 °C and 250 rpm until it reached OD600 of 0.4–0.6 (exponential phase) when cells were induced with 1 mM IPTG. Four hours after induction, cells were harvested by centrifugation at 4000 rpm for 10 min, resuspended in lysis buffer (12.5 mM Tris pH 6.8, 4% SDS), and frozen at −20 °C. Once all samples were collected, they were boiled for 10 min, sonicated (10 s ON, 20 s OFF, repeat 5 times, 30% amplitude using a QSonica Q500 sonicator), and centrifuged at 13,000 rpm for 10 min. The total protein concentration of the supernatant was determined with Pierce™ BCA Protein Assay Kit (Thermo Fisher Scientific, Waltham, MA, USA) and was used to ensure similar amounts of protein were loaded into wells in the following step. The supernatant was mixed with 2× Laemmli Sample Buffer, boiled for 15 min, and loaded on Mini-PROTEAN TGX stain-free precast gels (Bio-Rad Laboratories, Inc, Richmond, CA, USA) for SDS-PAGE, following the manufacturer’s instructions. For Western blots, transfers were done in SDS/Glycine/Methanol buffer for 60 min under 100 V. After the transfers, membranes were blocked with 5% BSA solution for 1 h, and incubated with 6×His Tag Monoclonal Antibody (Invitrogen MA1-21315) (1:2000 dilution) for 1 h. After the membrane was washed with TBST for 5 min five times, the membrane was incubated with the Goat anti-Mouse IgG (H + L) cross-absorbed secondary antibody HRP (Invitrogen 31432) (1:10,000 dilution) for 1 h, and washed again with TBST for 15 min, followed by 5 min washes with TBST for three more times. SuperSignal West Pico PLUS Chemiluminescent Substrate (Thermo Fisher Scientific, Waltham, MA, USA) was used before visualization on a Bio-Rad ChemiDoc. Densitometry data were generated using ImageJ [39].
2.7. Protein Degradation Assay
Cells were prepared the same way as for the fluorophore expression assay (Section 2.3). After induction by 1 mM IPTG for 1 h, cells were centrifuged at 15,000 rpm for 3 min, washed with fresh M9 media, diluted to OD600 of 0.1, and treated with spectinomycin (100 µg/mL) to prevent further protein synthesis. Cultures were then shaken in a black 96-well plate (Corning Incorporated Inc.) with lid at 37 °C and 250 rpm, and OD600 and fluorescence (485/515 nm excitation/emission for sfGFP) were monitored using a SynergyTM H1 Hybrid Microplate Reader.
2.8. qPCR
The protocol used for qPCR has been described in detail previously [28,29,40]. Briefly, 30 µL of cell culture (OD600 = 0.2) were collected, treated with RNAprotect bacterial reagent (Qiagen, Germantown, MD, USA), centrifuged, and the resulting pellet was frozen at −80 °C. Once all samples were collected, RNA was extracted with RNeasy Mini kits (Qiagen, Germantown, MD, USA) according to instructions from the manufacturer. As an internal standard, 50 ng of purified phzM mRNA was added to each sample before extraction. phzM mRNA was generated by transcription with a T7 high yield transcription kit (Thermo Fisher Scientific, Waltham, MA, USA) from a linearized pET11a plasmid containing phzM from P. aeruginosa PAO1. Extracted RNA was converted to cDNA with Taqman reverse transcription kits (Thermo Fisher Scientific, Waltham, MA, USA). Real-time qPCR was performed in a 0.1 mL MicroAMP fast optical 96-well reaction plate with SYBR green and appropriate primers (Table S2) in a ViiA 7 real-time PCR system for 40 cycles (Thermo Fisher Scientific, Waltham, MA, USA). The cycle threshold (Ct) value was used to calculate mRNA abundances in each sample. Calibration curves with pQE80-gfpsf for gfpsf and linearized pET11a-phzM for phzM were used to convert signals to DNA concentrations. gfpsf cDNA was normalized by phzM for comparison between samples.
2.9. Protein Solubility Assay
Wild-type harboring pQE80-β-csn and pQE80-hmp-β-csn were prepared as described in Section 2.6. Wild-type harboring pQE80-gfpsf, pQE80-hmp100-gfpsf, and pQE80-hmp-gfpsf were prepared as described in Section 2.3. After 4 h of induction, cell cultures were centrifuged at 4 °C and 4000 rpm for 10 min. Pellets were resuspended in 1 mL of water with 1 mg/mL lysozyme, incubated at 4 °C for 30 min, sonicated on ice (10 s ON, 20 s OFF, repeated 12 times, 30% amplitude using a QSonica Q500 sonicator), and centrifuged again at 4 °C and 8000 rpm for 10 min. The pellets were separated from the supernatant, and 0.5 mL of Milli-Q water was used to resuspend the pellet. Total protein concentrations of samples were determined with Pierce™ BCA Protein Assay Kit (Thermo Fisher Scientific, Waltham, MA, USA), and similar amounts of protein from each sample (for the samples of insoluble fractions, the loaded volume was the same as the total lysate samples and not adjusted based on total protein) were mixed with 2× Laemmli Sample Buffer, boiled for 15 min, and loaded into Mini-PROTEAN TGX stain-free precast gels (Bio-Rad Laboratories, Inc., Richmond, CA, USA) for SDS-PAGE, following the manufacturer’s instructions. Protein gels were visualized on a Bio-Rad GelDoc.
2.10. Fusion Tag Cleavage Assay
Protein samples (125 μg) were mixed with 5 µL of enterokinase (New England Biolabs, Ipswich, MA, USA) in 100 µL of reaction buffer (20 mM Tris-HCl, 50 mM NaCl, 2 mM CaCl2, pH 8.0) and left at room temperature for 16 h, as instructed by the manufacturer. Samples were then mixed with 2x Laemmli Sample Buffer, boiled for 15 min, and loaded into Mini-PROTEAN TGX stain-free precast gels (Bio-Rad Laboratories, Inc., Richmond, CA, USA) for SDS-PAGE, following the manufacturer’s instructions. Protein gels were visualized on a Bio-Rad GelDoc.
2.11. RBS Calculator
The RBS Calculator v2.1 (https://salislab.net/software/predict_rbs_calculator, accessed on 18 November 2021) was used to calculate the translation rate [41]. The mRNA sequences between the transcriptional start site of PT5 to the beginning of the lambda t0 transcriptional termination sites on pQE80 plasmids were used as the input for mRNA sequence. E. coli str. K-12 substr. MG1655 was chosen as the host organism.
3. Results
3.1. Fusion of Hmp to sfGFP Increases Expression
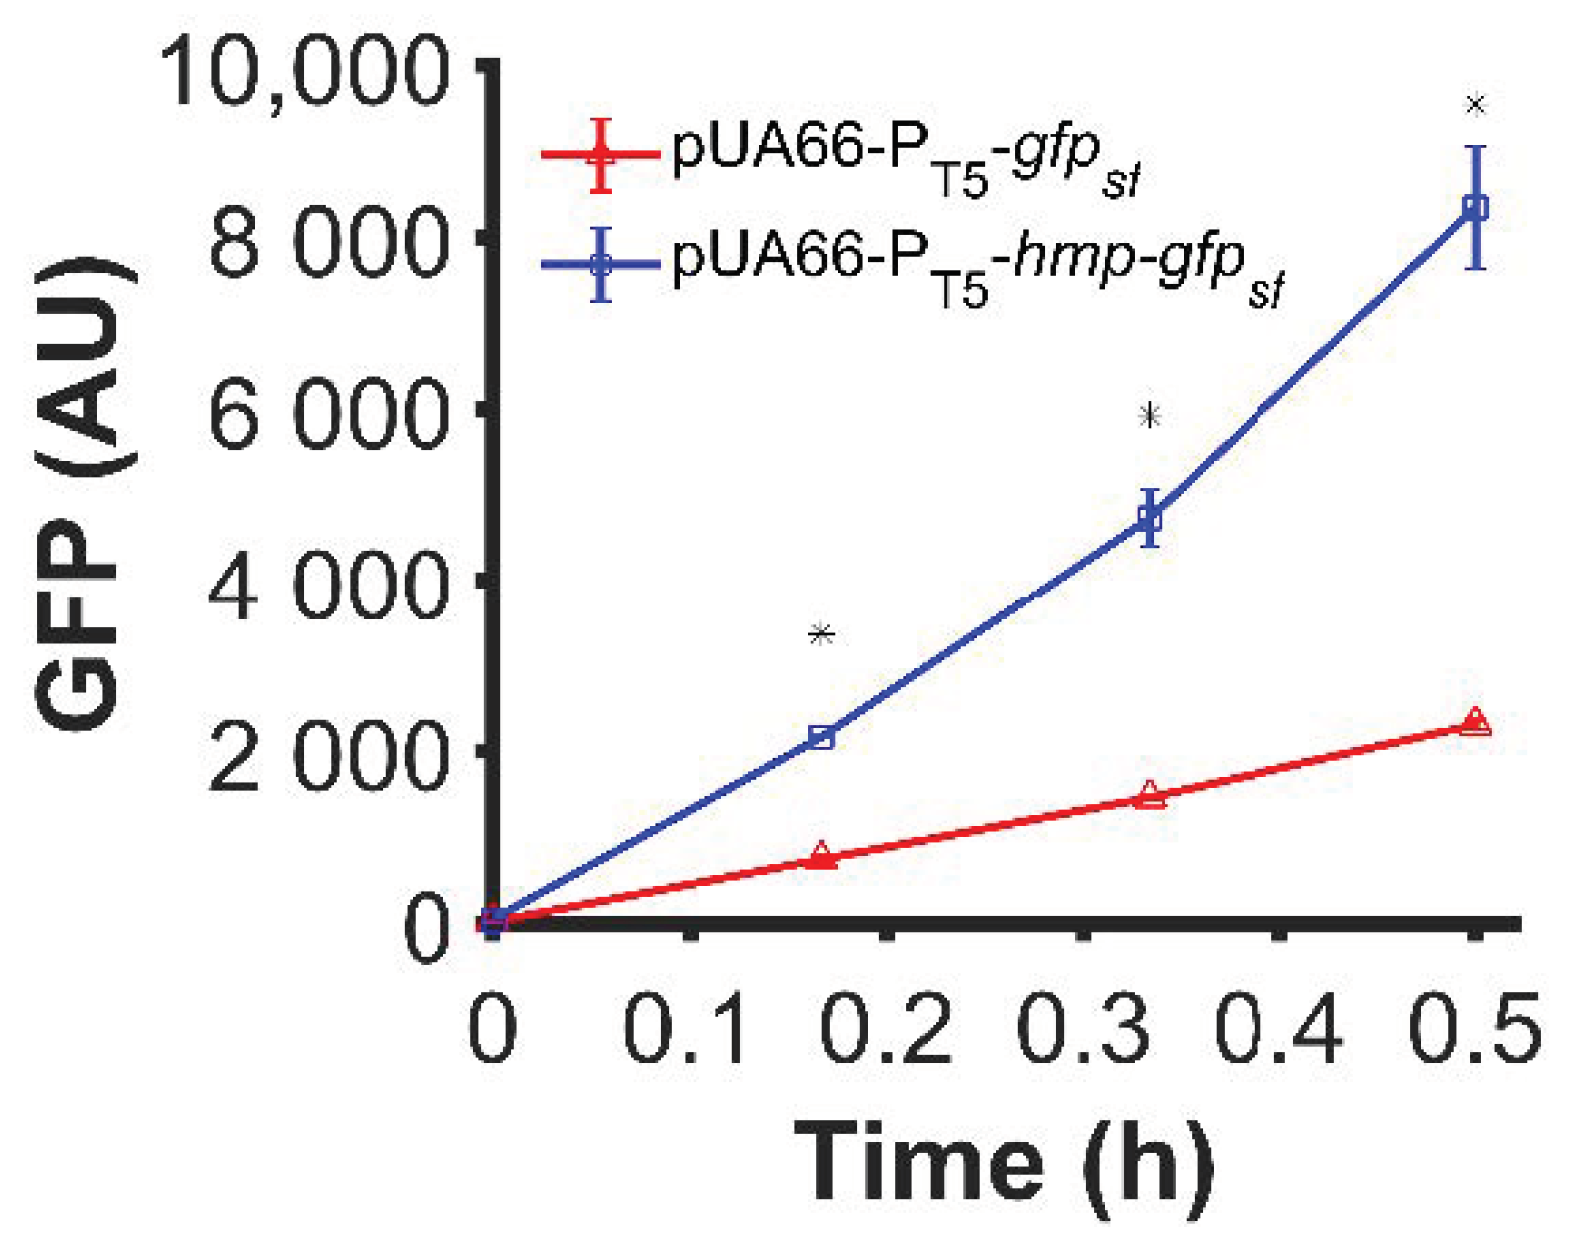
In previous work, we had observed that translationally fusing Hmp to sfGFP with a (Gly-Ser-Ser-Gly)3 linker produced an ~3-fold increase in sfGFP under ·NO stress [28]. Since Hmp is an ·NO-induced stress protein and translation is slower in ·NO-stressed cultures compared to their growing counterparts [42], we tested whether the impact of Hmp on sfGFP expression was generalizable to normal growth conditions. Using a low-copy plasmid (pUA66) where sfGFP and Hmp-sfGFP were expressed from identical IPTG-inducible promoters, we observed a statistically significant 3.6-fold increase in expression for Hmp-sfGFP compared to sfGFP, as measured by fluorescence (Figure 1). These data suggest that the ability of an Hmp translational fusion to increase protein production is translatable to normal, unstressed growth environments.

Figure 1.
Hmp translational fusion increased expression of sfGFP from an IPTG-inducible promoter under normal growth conditions. Data shown are median GFP signal of wild-type E. coli harboring pUA66-PT5-gfpsf (pSA21) (red) and pUA66-PT5-hmp-gfpsf (pJR05) (blue) cultures measured by flow cytometry. Data are the means of three independent replicates, and error bars represent the standard errors of the means. Asterisks (*) indicate statistically significant differences between pUA66-PT5-gfpsf (red) and pUA66-PT5-hmp-gfpsf (blue) as assessed using t-tests and a significance threshold of p-value ≤ 0.05.
3.2. Fusion to Hmp Increases the Expression of Different Proteins from Different Promoters in Different Plasmids and Different Media
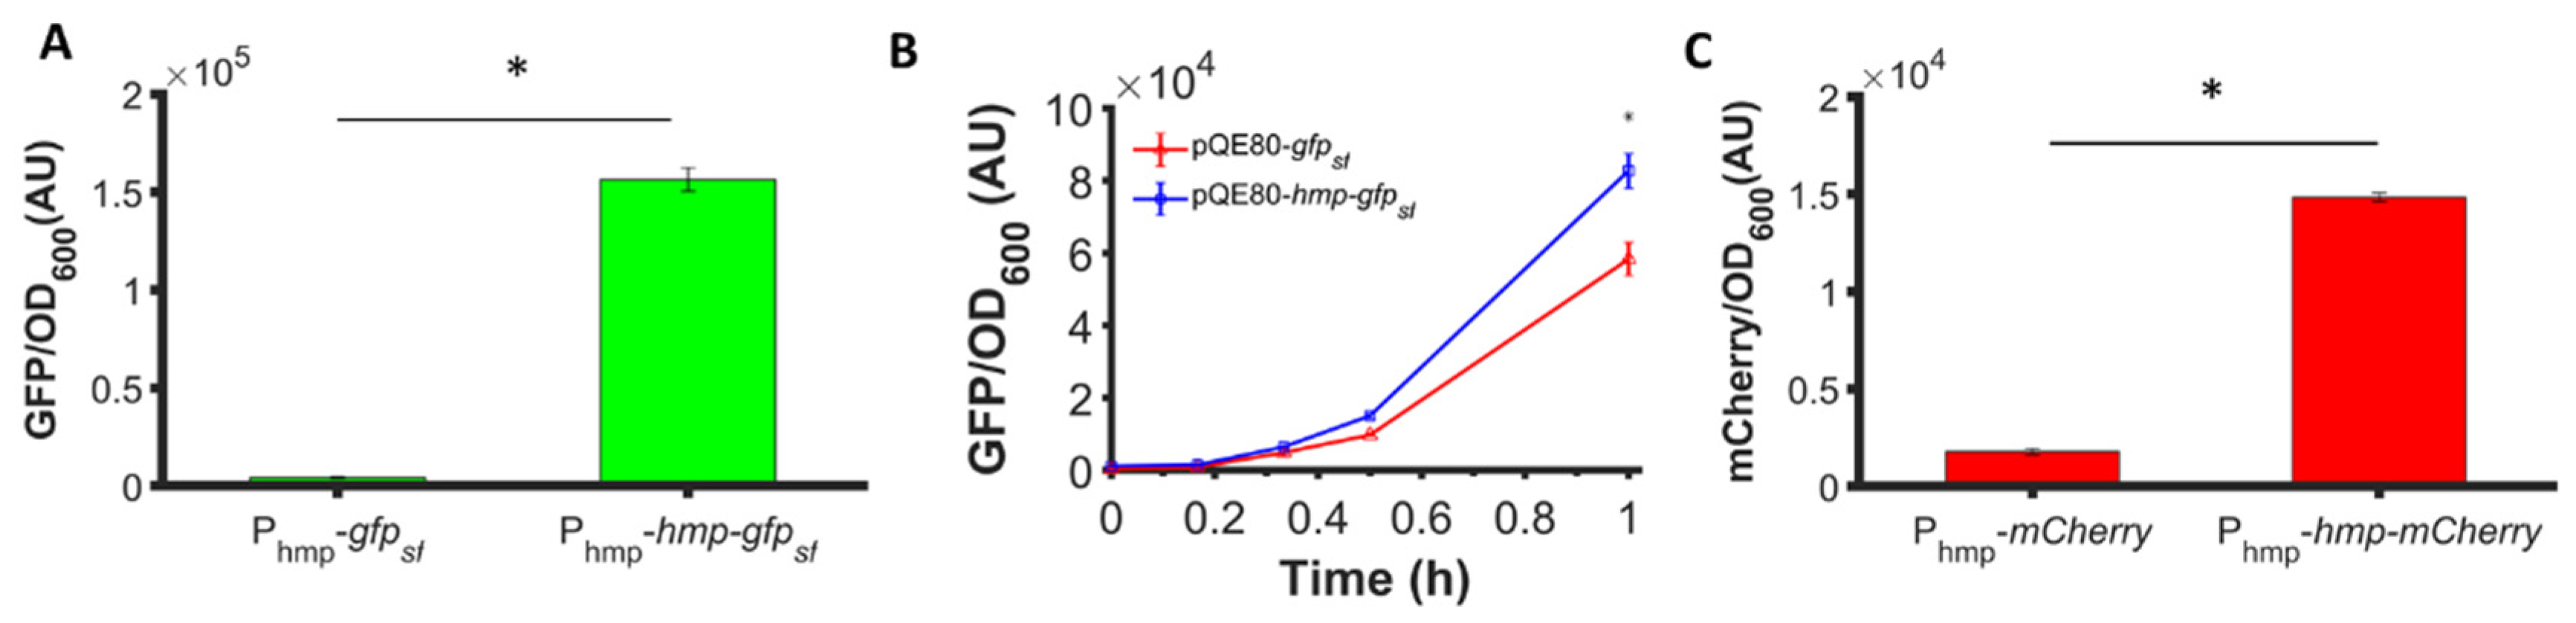
To assess whether the phenomenon could be observed with different promoters, we used low-copy plasmids where Hmp-sfGFP or sfGFP were expressed from the hmp promoter (Phmp), and deleted nsrR from the chromosome to increase basal expression levels. As depicted in Figure 2A, a significant 37-fold increase in Hmp-sfGFP expression compared to sfGFP expression was observed. To assess whether translational fusion to Hmp could increase expressions from different constructs, we used a different plasmid, which was high-copy (pQE80), and an IPTG-inducible expression cassette. We observed a significant 37% increase in Hmp-sfGFP expression compared to sfGFP (Figure 2B). To confirm that increases in fluorescence corresponded to increases in protein quantity, we ran SDS-PAGE gels on whole cell lysates of cells expressing sfGFP and Hmp-sfGFP, and found the quantity of Hmp-sfGFP to be ~9-fold higher than that of sfGFP, based on densitometry, whereas the size of Hmp-sfGFP was only 3-fold larger than sfGFP (Figure S1). Additional experiments showed that Hmp itself was not fluorescent (Figure S2). To assess whether Hmp fusions to other proteins produced a similar effect, we swapped sfGFP for mCherry in the Phmp expression construct and performed analogous experiments. Notably, a significant 8-fold increase in Hmp-mCherry expression compared to mCherry expression was observed (Figure 2C). To assess the generality of this phenomenon to non-fluorophores and different media, we elected to test whether the fusion of Hmp to β-csn, a cow milk protein that is widely used in the food industry and has potential as a carrier of bioactive agents when it aggregates into micelles [43], could increase expression in LB media. As demonstrated in Figure 3, the expression of Hmp-β-csn was significantly increased by 5.4-fold compared to β-csn by itself, as assessed by Western blot. To assess whether Hmp fusions were amenable to excision by proteases, we had incorporated an enterokinase cleavage site into the linker between Hmp and β-csn (Supplemental Table S3). When Hmp-β-csn was incubated with enterokinase, we found that the fusion protein could be successfully cleaved (Figure S3). These data suggest that Hmp translational fusions can increase the expression of different proteins from different promoters in different plasmids and different media, and that they can be removed from tagged proteins with the incorporation of protease cleavage sites.
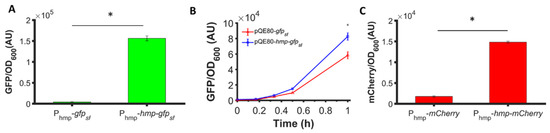
Figure 2.
Hmp fusion increases the expression of sfGFP and mCherry. Shown are (A) GFP fluorescence measurements normalized by OD600 after subtraction of the background signal (wild-type harboring pUA66) at each time point. Depicted are ΔnsrR harboring pUA66-Phmp-gfpsf (pXW02) and pUA66-Phmp-hmp-gfpsf (pXW01); (B) GFP fluorescence measurements normalized by OD600 after subtraction of the background signal (wild-type harboring pQE80L) at each time point. Shown here are wild-type harboring pQE80-PT5-gfpsf (pXW09) and pQE80-PT5-hmp-gfpsf (pXW08) induced by 1 mM IPTG at time 0. Corresponding OD600 measurements and data of uninduced samples can be found in Figure S5. (C) mCherry fluorescence measurements normalized by OD600 after subtraction of the background signal (wild-type harboring pUA66) at each time point. Depicted are ΔnsrR E. coli harboring pUA66-Phmp-mCherry (pXW06) and pUA66-Phmp-hmp-mCherry (pXW05). Data are the means of three independent replicates, and error bars represent the standard errors of the means. Asterisks (*) indicate statistically significant differences between data as assessed using t-tests and a significance threshold of p-value ≤ 0.05.
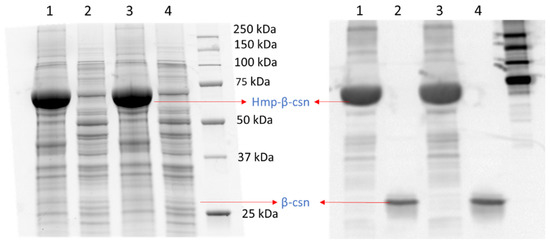
Figure 3.
Hmp fusion increases the expression of β-csn. SDS-PAGE (left) and Western blot image (right) of same protein gel with cell lysates of wild-type E. coli harboring pQE80-PT5-hmp-β-csn (pXW12) in lanes 1 and 3, and pQE80-PT5-β-csn (pXW13) in lanes 2 and 4, with similar total protein quantity after 4 h of induction by 1 mM IPTG. Both Hmp-β-csn and β-csn contained C-terminal 6×His tags and Western blot was conducted with anti-His tag antibodies. Depicted are two independent biological replicates in the same gel.
3.3. Hmp Fusion Proteins Are Largely in the Soluble Fraction of Lysates
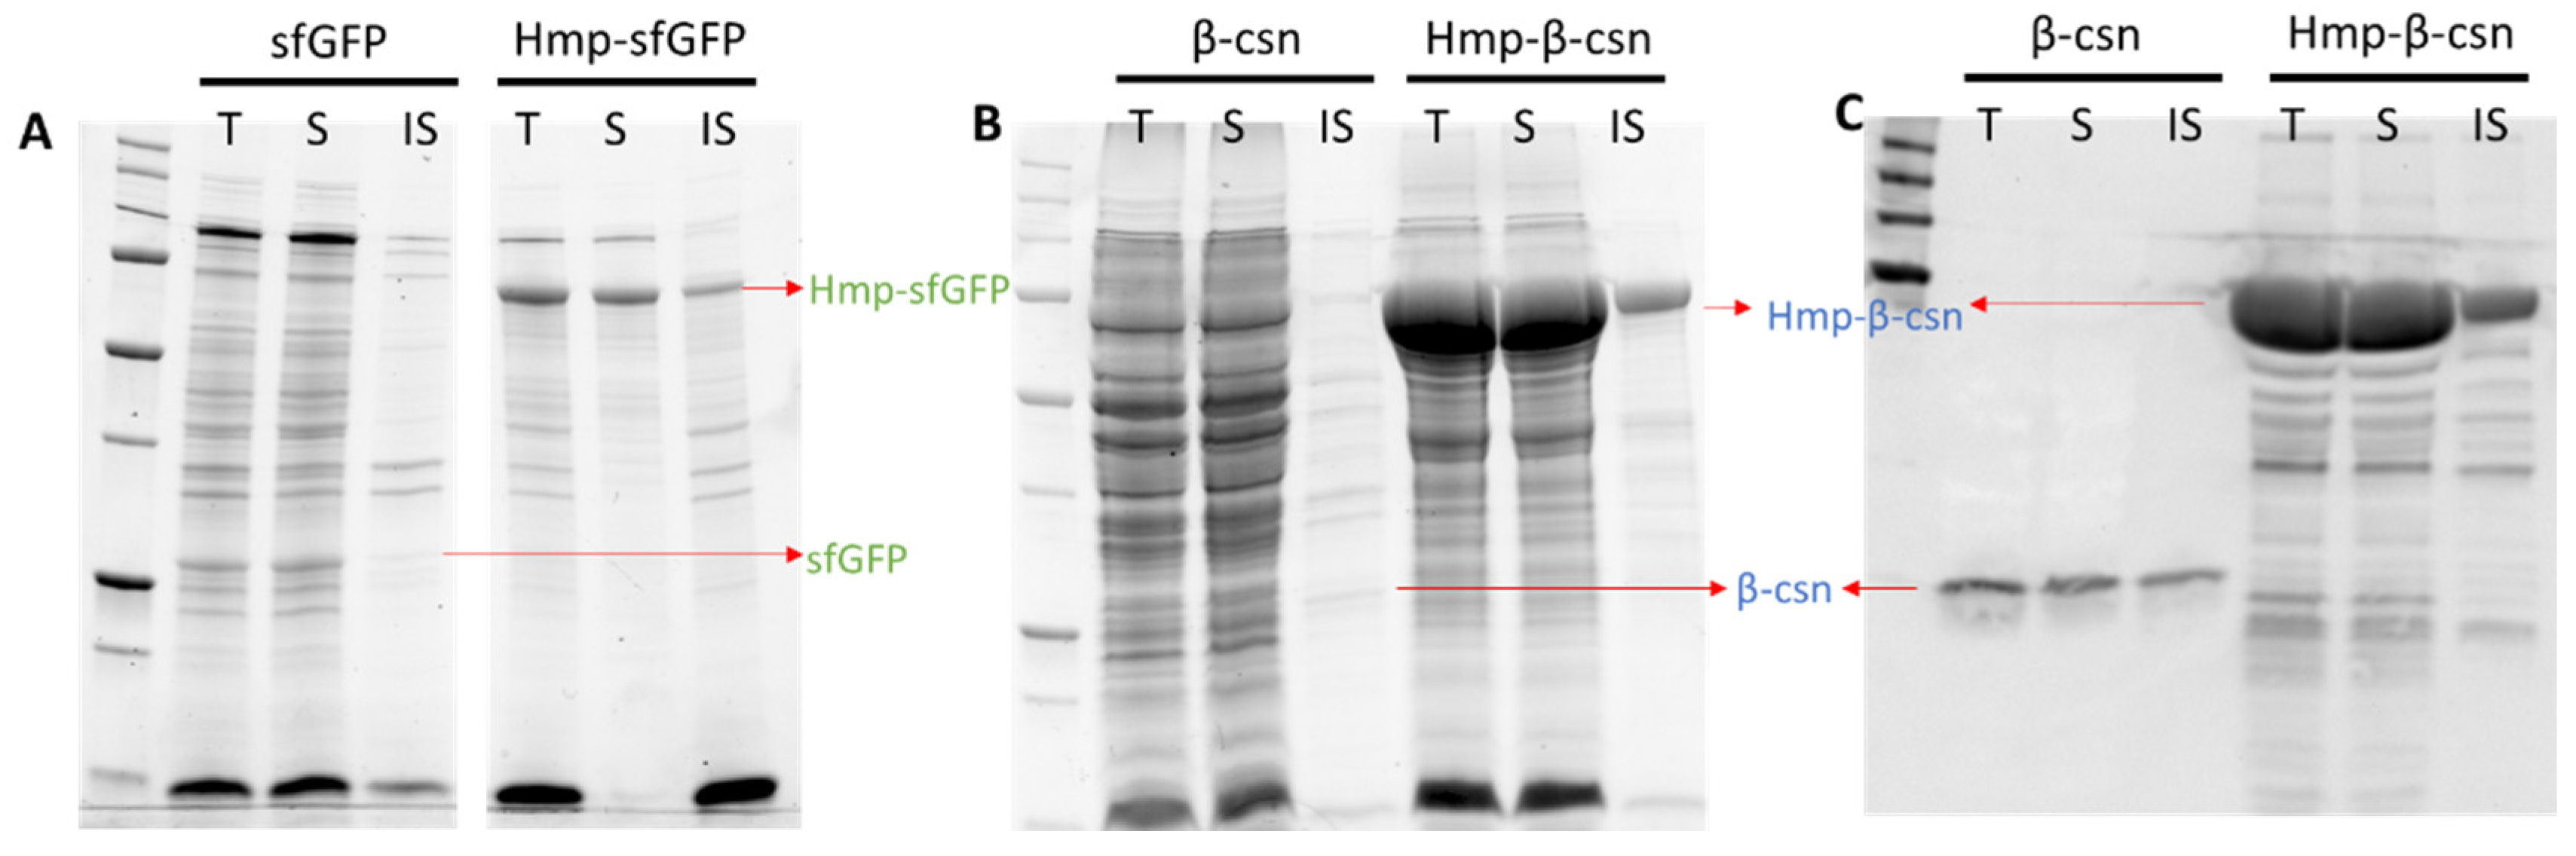
Aggregation into insoluble inclusion bodies can be problematic for over-expressed proteins [44,45]. To determine the solubility status of Hmp fusion proteins, we used centrifugation to separate the soluble and insoluble protein fractions and analyzed them with SDS-PAGE. We found that the majorities of Hmp-sfGFP and Hmp-β-csn were present in the soluble fractions (Figure 4). In consideration that sfGFP and β-csn are largely soluble, these data suggest that translational fusions to Hmp do not appreciably reduce the solubility of expressed proteins. Though we note that whether Hmp fusions increase the solubility of proteins that are prone to aggregation remains to be determined.
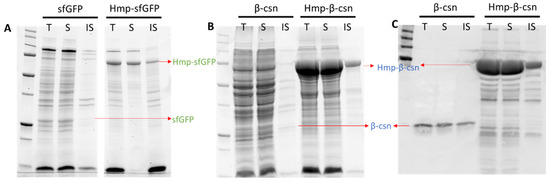
Figure 4.
Solubility of sfGFP, Hmp-sfGFP, β-csn, and Hmp-β-csn. After 4 h induction with 1 mM IPTG at 37 °C, wild-type harboring pQE80-PT5-gfpsf (pXW09), pQE80-PT5-hmp-gfpsf (pXW08), pQE80-PT5-β-csn (pXW13), pQE80-PT5-hmp-β-csn (pXW12) were sonicated, centrifuged, and separated into soluble (S) and insoluble (IS) fractions. Protein fractions were resolved by SDS-PAGE and visualized through stain-free technique in (A,B), and Western blot in (C). Note that (B,C) are from the same protein gel. Arrows indicate expected/observed positions of respective protein bands. Both Hmp-β-csn and β-csn contained C-terminal 6×His tags and Western blot was conducted with anti-His tag antibodies. (T) Total cell lysate from induced culture; (S) soluble fraction; (IS) insoluble fraction.
3.4. Fusion of Hmp to LacZ Does Not Increase Expression
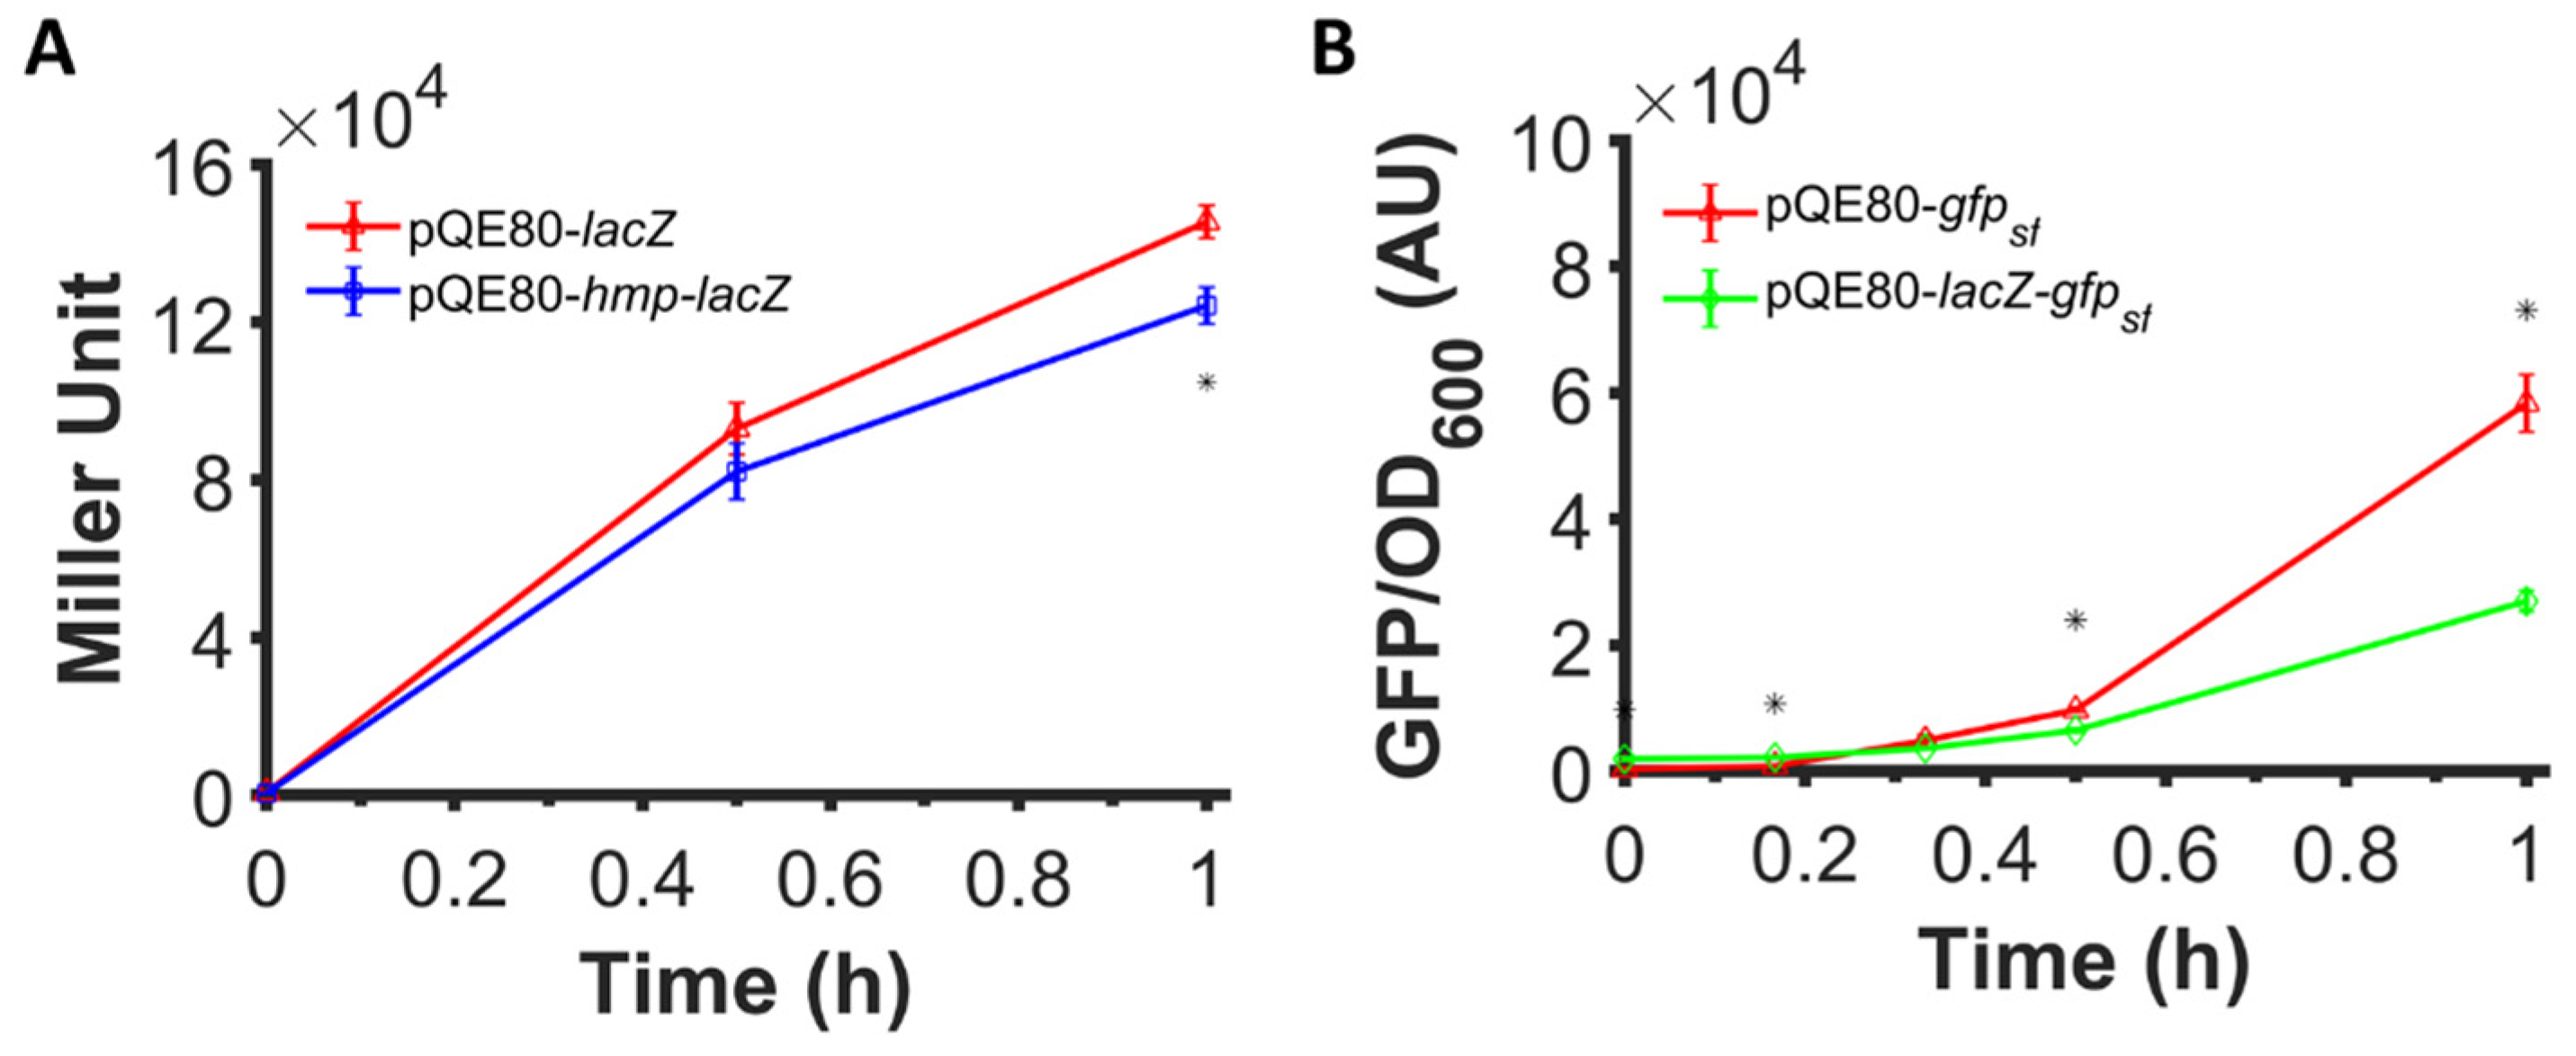
Figure 2 and Figure 3 illustrate that translational fusion to Hmp increases heterologous protein expression, since sfGFP, mCherry, and β-csn are all foreign to E. coli. To assess whether the expression of native E. coli proteins can be increased by fusion to Hmp, we assayed the expression of β-galactosidase (LacZ) fused to the C-terminus of Hmp. We expressed LacZ and Hmp-LacZ from an IPTG-inducible promoter on a high copy plasmid (pQE80), and found that the β-galactosidase activity in cells expressing Hmp fused to LacZ was 15% lower than LacZ by itself (Figure 5A). To assess the protein quantity, we ran an SDS-PAGE on whole cell lysates of cells expressing LacZ and Hmp-LacZ, and found their quantity to be comparable using densitometry, with Hmp-LacZ approximately 24% lower than LacZ by itself (Figure S1). These data suggest that the fusion of Hmp to a native E. coli protein, LacZ, did not boost its expression. Further, these data raised the question of whether Hmp fusions increased heterologous protein expression in E. coli only because it was a native protein, or whether the effect was more specific to Hmp itself. To address this question, we generated a LacZ-sfGFP, where Hmp in the fusion protein was replaced with LacZ, and measured fluorescence after IPTG induction. We observed that the expression of LacZ-sfGFP was ~2-fold lower than sfGFP by itself (Figure 5B). These data suggest that Hmp fusions increase heterologous protein expression through a mechanism that is not shared by all native E. coli proteins.
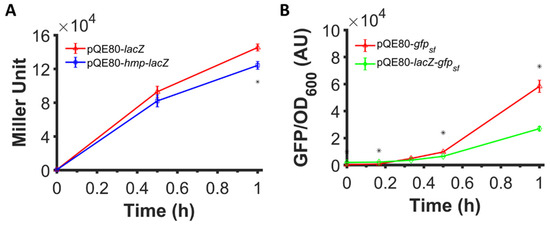
Figure 5.
Fusion to Hmp did not boost the expression level of LacZ and fusion to LacZ did not boost the expression of sfGFP. (A) Shown are β-galactosidase activities of ΔlacZYA E. coli harboring pQE80-PT5-lacZ (pXW11) and pQE80-PT5-hmp-lacZ (pXW10) induced with 1 mM IPTG at time 0 after subtraction of the background signal (wild-type harboring pQE80L). (B) GFP fluorescence measurements normalized by OD600 of wild-type E. coli harboring pQE80-PT5-gfpsf (pXW09) and pQE80-PT5-lacZ-gfpsf (pXW22) induced with 1 mM IPTG at time 0 after subtraction of the background signal (wild-type harboring pQE80L). Corresponding OD600 measurements and data of uninduced samples can be found in Figure S5. Data are the means of three independent replicates, and error bars represent the standard errors of the means. Asterisks (*) indicate statistically significant differences between samples as assessed using t-tests and a significance threshold of p-value ≤ 0.05.
3.5. Catalytic Activity Is Not Required to Observe Expression Enhancement from Hmp Fusions
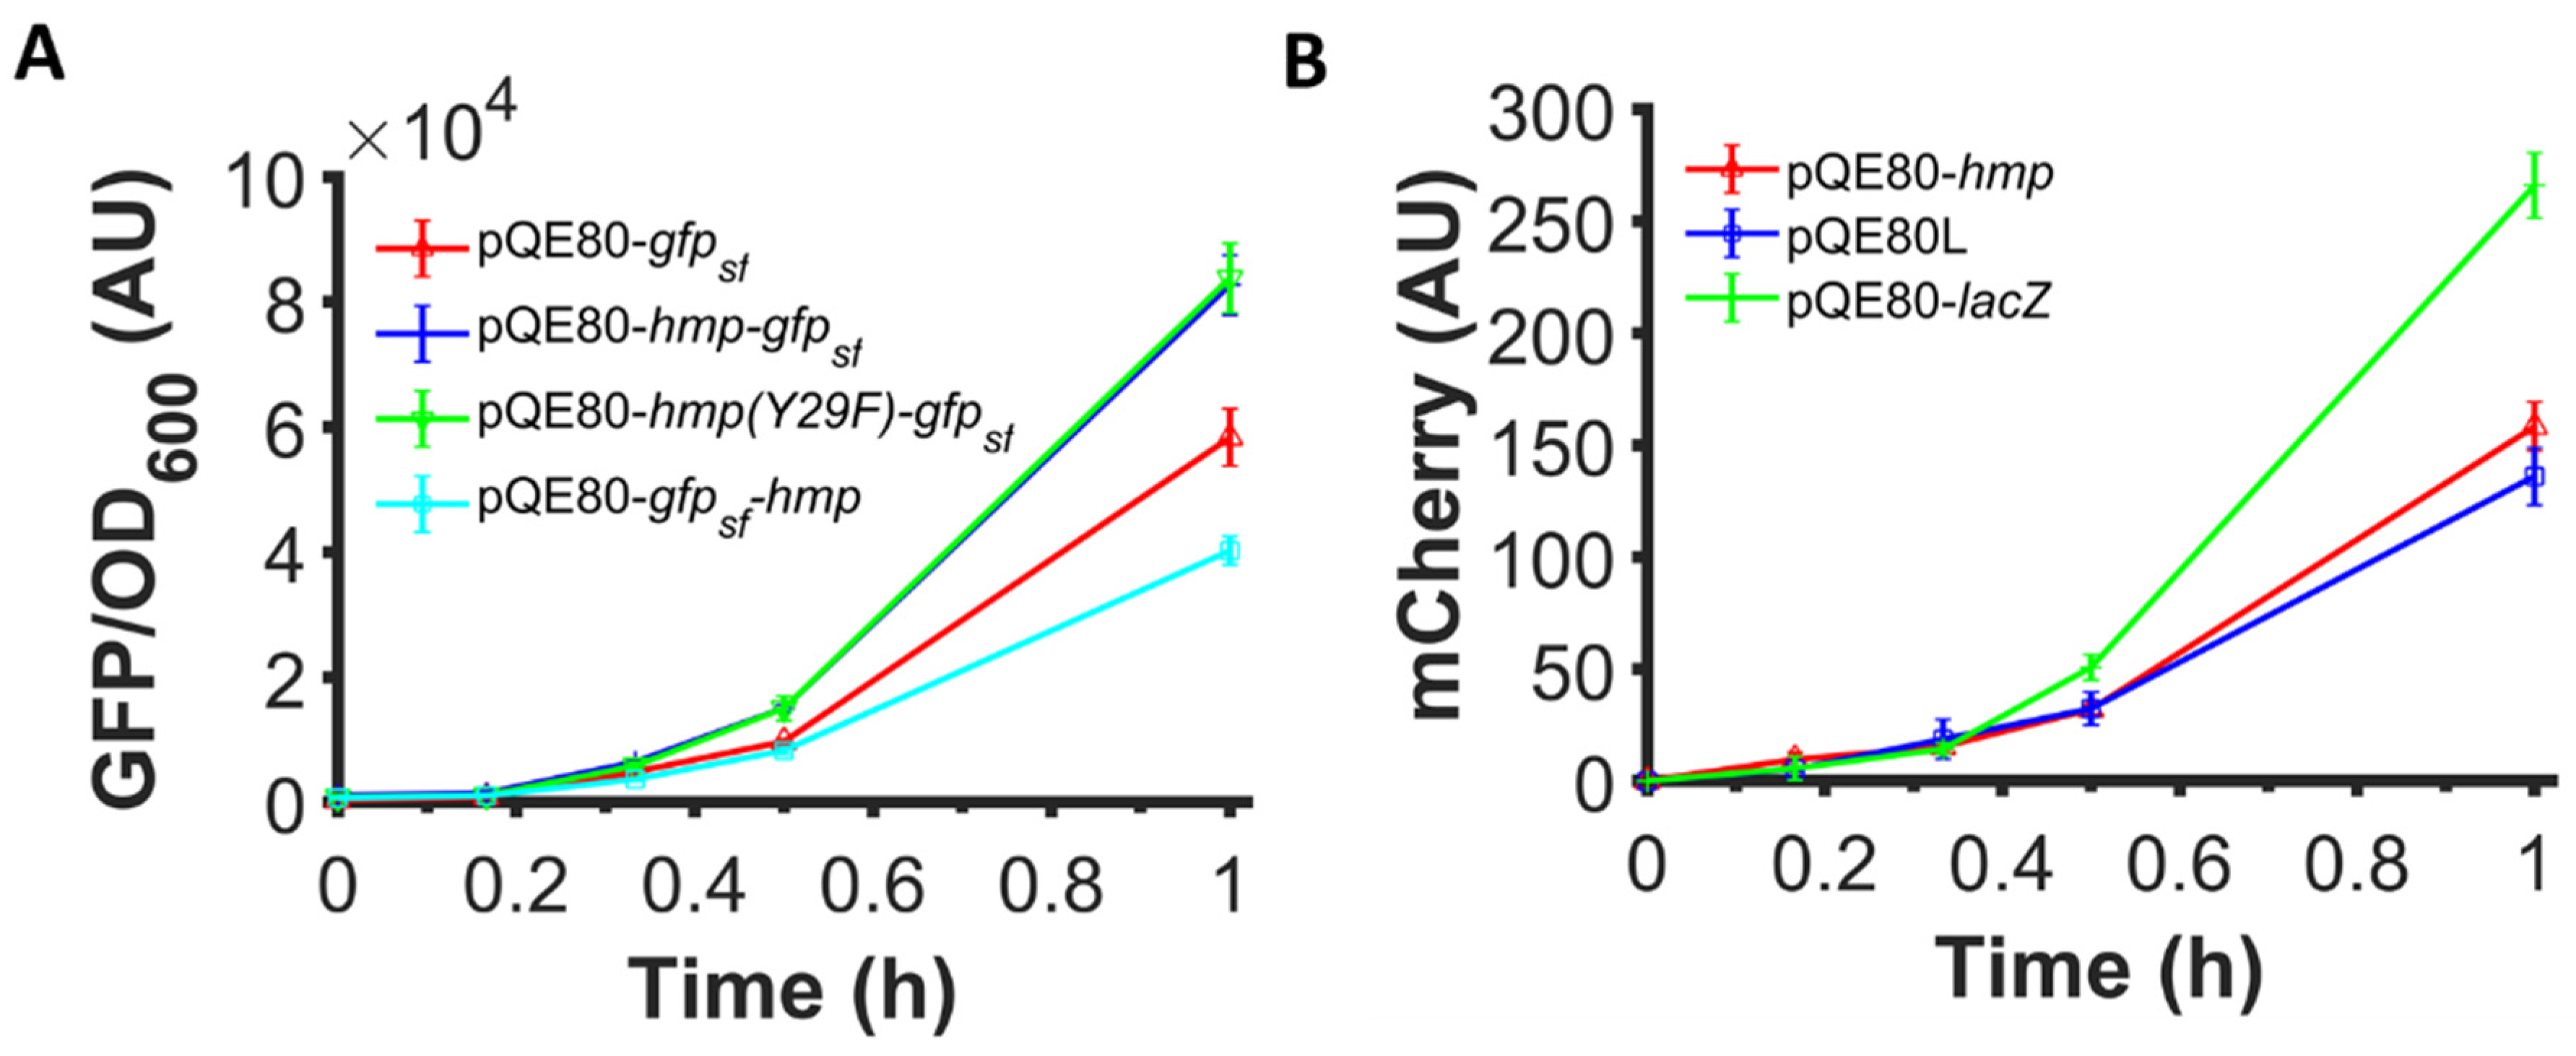
Given that previous studies found that VHb expression increased growth rate and protein yield through a mechanism that was suggested to involve its O2 binding or ·NO detoxification abilities, we tested whether the increased expression observed with Hmp fusions involved those functions. Specifically, we used a catalytically-inactive Hmp, Hmp(Y29F) whose O2 dissociation rate is increased by 80-fold and ·NO detoxification activity is reduced by 30-fold, and translationally fused it with sfGFP. The expression of Hmp(Y29F)-sfGFP fusion from an IPTG-inducible promoter was found to be similar to the expression of Hmp-sfGFP (Figure 6A), indicating that the ·NO defense and O2-binding capabilities of Hmp were not required to observe its ability to increase heterologous protein expression.
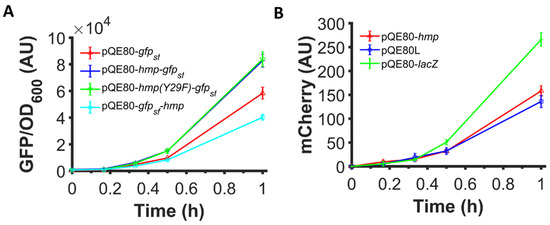
Figure 6.
N-terminal fusion is required and O2 binding and ·NO detoxification activities are dispensable for Hmp to boost protein expression. Shown are (A) GFP fluorescence normalized by OD600 after subtraction of the background signal (wild-type harboring pQE80L) of wild-type E. coli harboring pQE80-PT5-gfpsf (pXW09), pQE80-PT5-hmp-gfpsf (pXW08), pQE80-PT5-hmp(Y29F)-gfpsf (pXW14), whose O2-binding site is destroyed, and pQE80-PT5-gfpsf-hmp (pXW15) induced by 1 mM IPTG at time 0. (B) mCherry fluorescence of MO001 (lacIq, ΔlacZYA::PT5-mCherry) harboring pQE80-PT5-hmp (pXW20), pQE80L (empty vector), and pQE80-PT5-lacZ (pXW11) induced by 1 mM IPTG at time 0. Corresponding OD600 measurements and data of uninduced samples can be found in Figure S5. Data are the means of at least three independent replicates, and error bars represent the standard errors of the means.
3.6. Fusion of Hmp to the N-Terminus of Proteins Is Required for Increased Expression
Previous work that showed that VHb increased growth rate and product yield was done with VHb expressed as an independent protein. To assess whether Hmp can promote the expression of proteins without being fused to them, we used a genomically-integrated, IPTG-inducible mCherry system and expressed Hmp from an IPTG-inducible promoter on a plasmid. We found that the expression of mCherry was not higher when Hmp was expressed compared to an empty vector control or a control that expressed LacZ in place of Hmp from the same plasmid (Figure 6B). To assess whether N- or C-terminal fusions to Hmp could increase protein expression, we constructed a plasmid expressing Hmp translationally fused to the C-terminus of sfGFP, instead of the N-terminus, and found that sfGFP-Hmp production was lower than that of sfGFP (Figure 6A). These data indicate that Hmp only boosts heterologous protein expression when it is translationally fused to the N-terminus of the target protein.
3.7. Increased Expression Is Not Due to a Second Start Codon
To understand how N-terminal Hmp fusions increased heterologous protein expression, we considered whether the start codon of target proteins contributed to fluorescence or catalytic activity measurements. With the concern that the second start codons (ATG) of hmp-gfpsf and hmp-mCherry translational fusions, which were situated at the beginning of gfpsf and mCherry, would promote expression, we removed those start codons from the translational fusion plasmids, and found minimal impact on the overall sfGFP or mCherry level (Figure 7). Overall, these data suggest that the increased expression of Hmp fusions cannot be explained by the presence of second start codons.
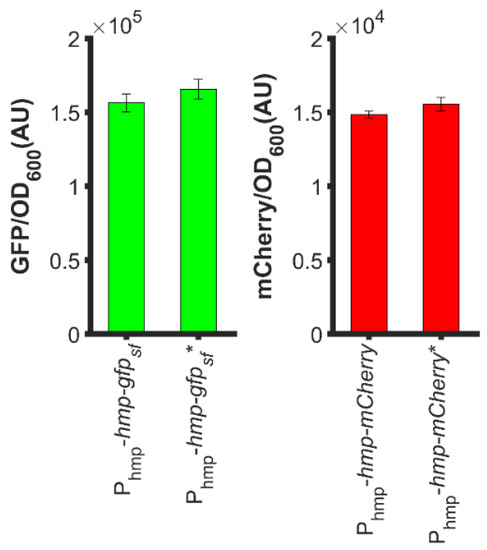
Figure 7.
Second start codons of the translational fusions did not impact expression levels appreciably. (Left): GFP fluorescence normalized by OD600 after subtraction of the background signal (wild-type harboring pUA66) of exponential-phase ΔnsrR E. coli harboring pUA66-Phmp-hmp-gfpsf (pXW01) and pUA66-Phmp-hmp-gfpsf * (pXW04, start codon of gfpsf removed); (Right): mCherry fluorescence normalized by OD600 after subtraction of the background signal (wild-type harboring pUA66) of exponential-phase ΔnsrR E. coli harboring pUA66-Phmp-hmp-mCherry (pXW05) and pUA66-Phmp-hmp-mCherry * (pXW07, start codon of mCherry removed). Data are the means of three independent replicates, and error bars represent the standard errors of the means.
3.8. RBS Calculator Predicts the Impact of an N-Terminal Linker but Not the Increased Expression of Hmp Fusions
To assess whether the linker peptide (Gly-Ser-Ser-Gly)3 contributed to increased protein expression in fusion proteins, we removed only Hmp from Hmp-sfGFP, which left sfGFP preceded by the (Gly-Ser-Ser-Gly)3 linker. Surprisingly, we found that the linker peptide significantly reduced fluorescence by more than 18-fold (Figure S2). To understand this phenomenon, we calculated the protein expression rate of our constructs with an RBS calculator [41,46], which predicts the translational initiation and protein expression based on a free energy model. As shown in Figure S4, the calculator predicted that when the linker peptide is inserted at the N-terminus of sfGFP, its expression should be reduced by ~70 fold, which qualitatively agrees with the trend we observed. However, the RBS calculator also predicted that the expression of sfGFP should be ~5 fold higher than the expression of Hmp-sfGFP, which was not the case. These data suggest that the expression enhancement of Hmp fusion proteins was not due to the linker peptide, and it is unlikely to be explained by differences in translation initiation.
3.9. Transcript Levels and Protein Degradation Are Comparable between Hmp-sfGFP and sfGFP
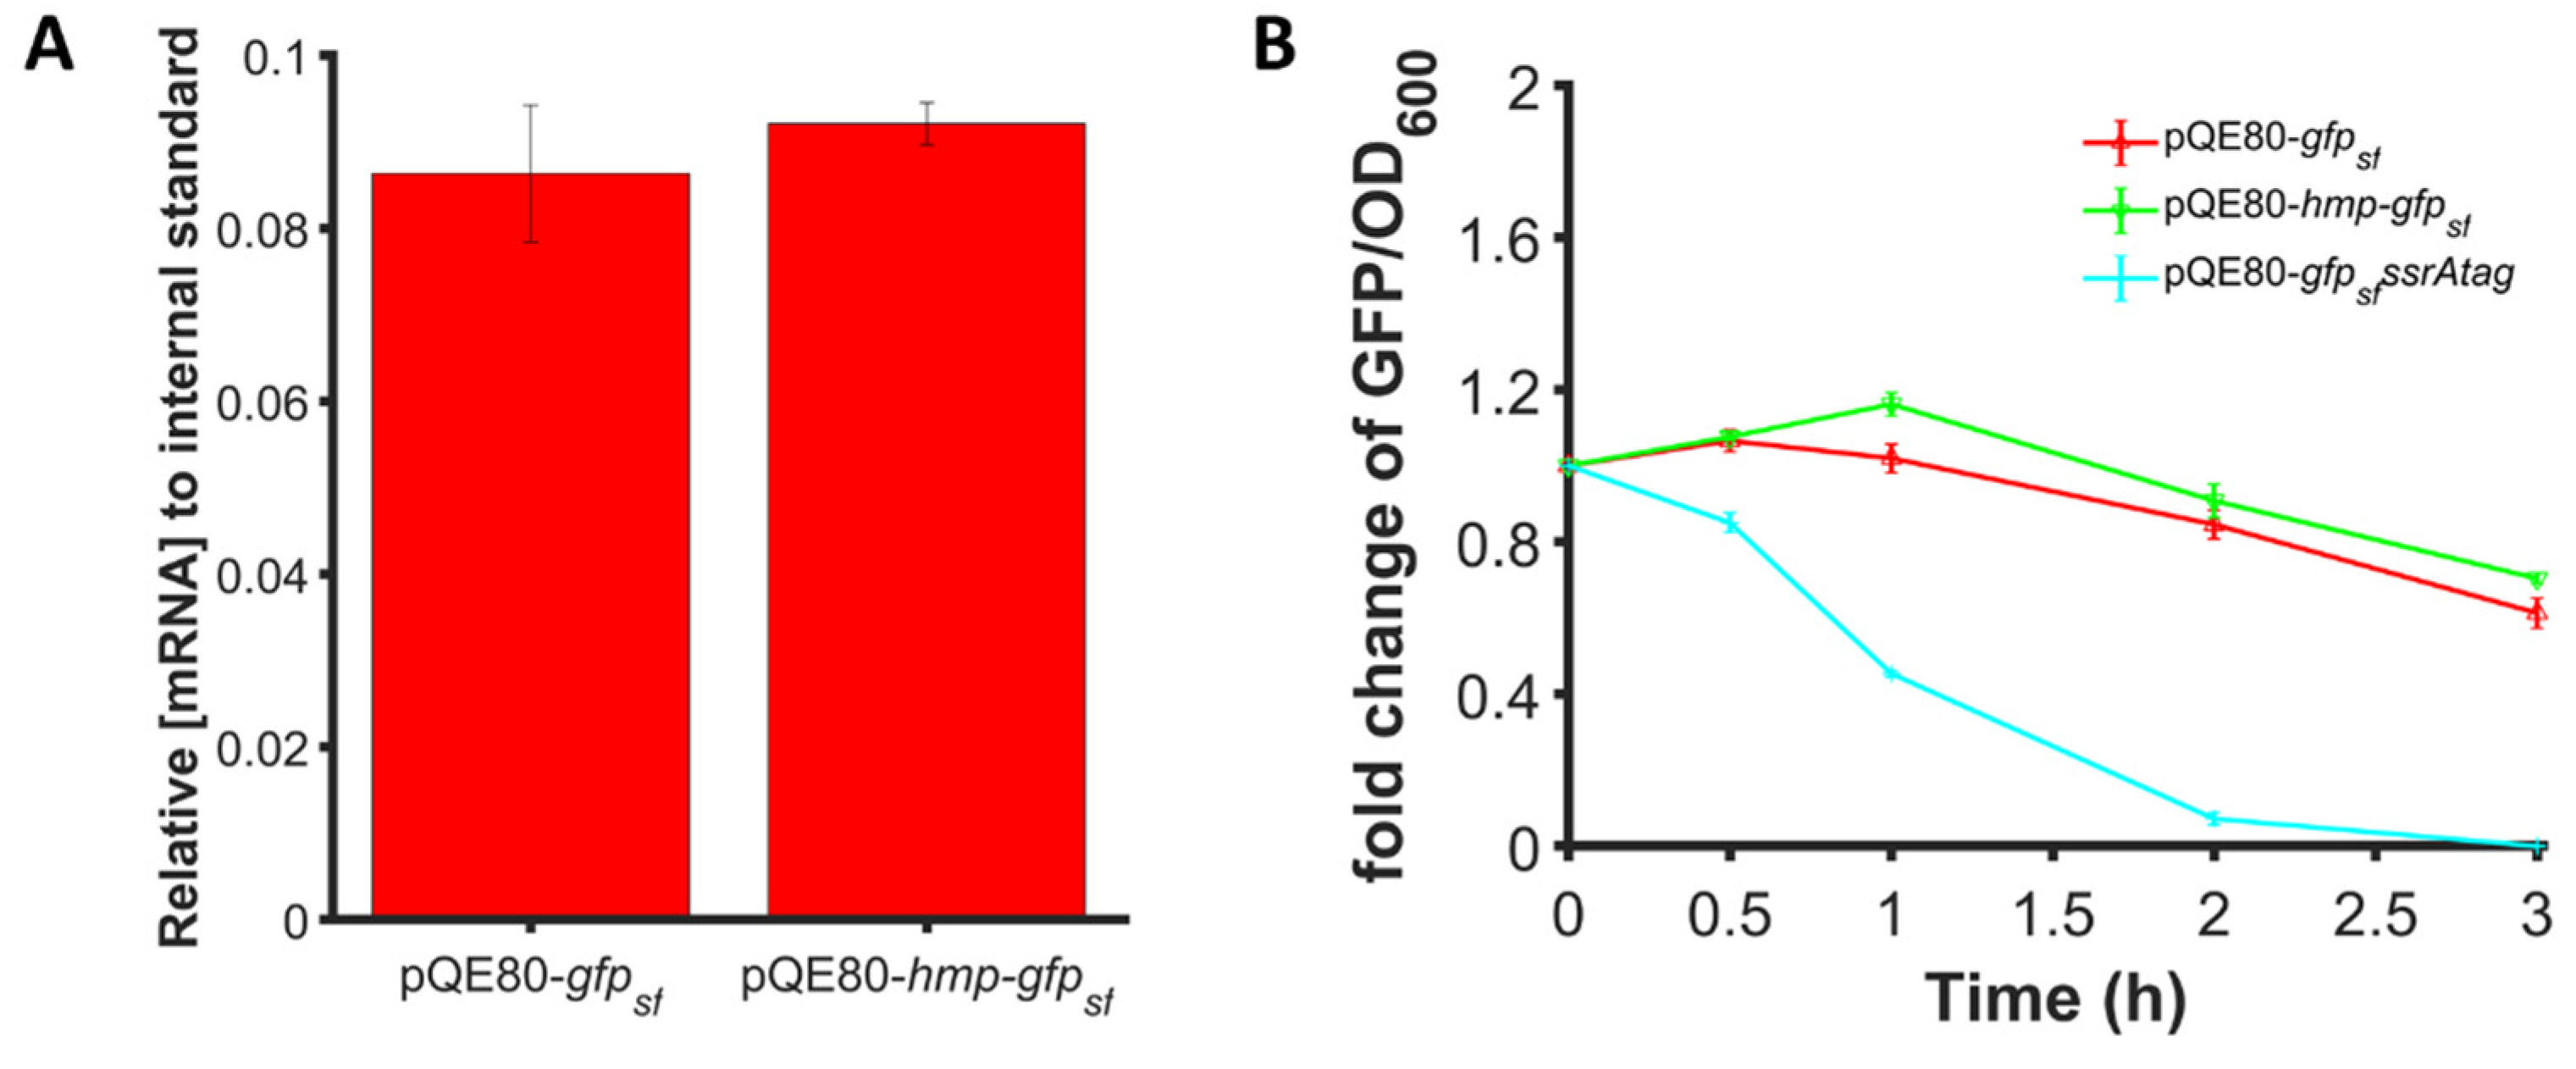
We considered whether differences in transcript levels or protein degradation could explain the enhancements in protein expression observed for Hmp fusion proteins. As shown in Figure 8A, we found that 1 mM IPTG induction generated similar gfpsf transcript levels when expressed from PT5-hmp-gfpsf or PT5-gfpsf even though the protein levels were found to be 37% higher for PT5-hmp-gfpsf (Figure 2B). Using spectinomycin to halt translation, we found that the degradation of Hmp-sfGFP and sfGFP were also similar (Figure 8B). Collectively, these results indicated that the increased expression of Hmp fusions was not attributable to differences in transcript levels or protein degradation, and thus suggested that Hmp-sfGFP was translated more efficiently per transcript compared to sfGFP.
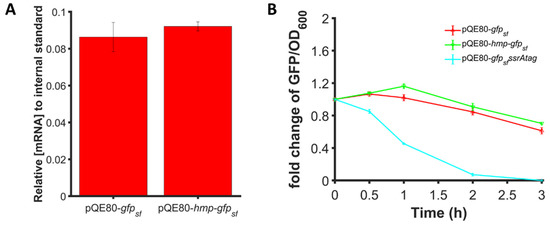
Figure 8.
Expression enhancement is not due to transcript or protein degradation differences. (A) Transcript levels of gfpsf in wild-type harboring pQE80-PT5-gfpsf (pXW09), pQE80-PT5-hmp-gfpsf (pXW08) after 1 h induction of 1 mM IPTG. Transcript levels shown are relative to the phzM internal standard spiked into each sample before RNA extraction. (B) Fold change of GFP/OD600 after subtraction of the background signal (wild-type harboring pQE80L) of wild-type harboring pQE80-PT5-gfpsf (pXW09), pQE80-PT5-hmp-gfpsf (pXW08), and pQE80-PT5-gfpsfssrAtag (pXW21) following treatment with 100 µg/mL spectinomycin to stop translation. Cells were induced with 1 mM IPTG for 1 h before spectinomycin treatment. Data are the means of at least three independent replicates, and error bars represent the standard errors of the means.
3.10. Fusions of Truncated Versions of Hmp Also Increase Expression
Since the catalytic activity of Hmp was not required to observe an increase in expression, and data suggested that translation efficiency was responsible for the observed effects, we investigated whether truncated versions of Hmp could increase protein expression when fused to the N-terminus of proteins. To accomplish this, we used plasmids where different truncations of Hmp (e.g., Hmp25 is the first 25 amino acids of Hmp) were fused to the N-terminus of sfGFP using a (Gly-Ser-Ser-Gly)3 linker. We observed that while Hmp25-sfGFP reduced the protein expression compared to sfGFP alone, all other truncations improved the expression compared to sfGFP and Hmp-sfGFP (Figure 9). Notably, Hmp100-sfGFP was significantly higher than all other constructs.
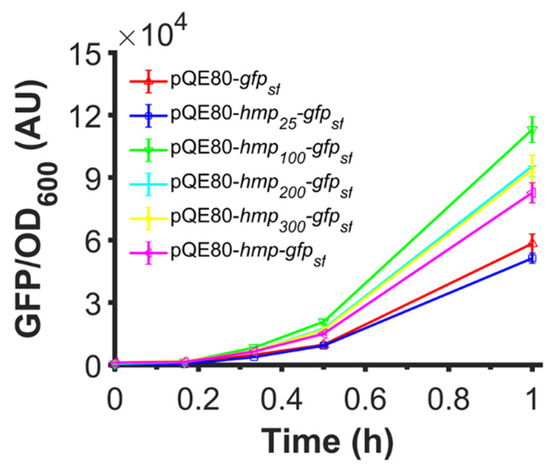
Figure 9.
Fusions of truncated versions of Hmp that are as long as 100 AA also increase expression. Shown are GFP fluorescence normalized by OD600 after subtraction of the background signal (wild-type harboring pQE80L) of wild-type harboring pQE80-PT5-gfpsf (pXW09), pQE80-PT5-hmp25-gfpsf (pXW16), pQE80-PT5-hmp100-gfpsf (pXW17), pQE80-PT5-hmp200-gfpsf (pXW18), pQE80-PT5-hmp300-gfpsf (pXW19), pQE80-PT5-hmp-gfpsf (pXW08) after induction of 1 mM IPTG at time 0. Corresponding OD600 measurements and data of uninduced samples can be found in Figure S5. Data are the means of at least three independent replicates, and error bars represent the standard errors of the means.
4. Discussion
Recombinant protein constitutes a large global market, with more than 100 billion dollars in sales of therapeutic proteins and more than 5 billion dollars in industrial enzymes [47,48,49]. Protein fusion tags are essential tools in recombinant protein expression to improve the yield and solubility of heterologous proteins, enable the purification of target proteins, and specify the location of protein expression within the cell [50]. Many fusion tags, including MBP [51,52], NusA [53], and Trx [54] from E. coli; CpcB [55,56] from Synechocystis; SUMO [57] from Homo sapiens; and GST [58] from Schistosoma japonicum, are found to increase expression yield when fused to the N-terminus [59]. Here, we identified Hmp from E. coli as an N-terminal fusion tag that can increase protein expression in E. coli. Importantly, E. coli is one of the most widely used recombinant protein expression systems, due to its lower production cost and genetic tractability [60]. We found that N-terminal Hmp fusions increase the expression of different proteins, from different plasmids, with different promoters, and in different media (Figure 1, Figure 2 and Figure 3). However, this effect was not present for fusions to lacZ, which is native to E. coli (Figure 5A). While the lack of enhancement in LacZ expression was not further investigated here, we speculate that its role as a native, core metabolic enzyme for growth on lactose may have honed its translational efficiency to approach near-optimal levels, whereas heterologous proteins have not been subjected to the same evolutionary pressures for expression in E. coli. However, it is important to note that additional proteins native to E. coli will have to be tested with Hmp fusions to their N-terminus to determine if LacZ is an outlier or representative E. coli protein in this regard.
To investigate the mechanism of this phenomenon, we found that the catalytic activity and O2-binding abilities of Hmp were not required, and that Hmp had to be fused to the N-terminus of the protein rather than as a C-terminal fusion or separately expressed protein (Figure 6). Although, we note that the experiments performed here were aerobic and whether this phenomenon occurs in anaerobic environments has yet to be determined. The results presented here are in contrast to the application of VHb, where it is expressed as an independent protein (not as a fusion) to improve the overall health of the cell, and its O2-binding properties or nitrosative stress defenses have been proposed to play a role in its ability to boost growth and protein production [21,22,24,27]. In addition, experiments with truncations of Hmp suggested that the portion of Hmp required to observe the phenomenon (Hmp100) was devoid of the FAD- and NAD(P)-binding sites, and thus unable to detoxify ·NO [61]. Alternatively, we found that transcript levels and protein degradation were not involved in the enhancement in protein abundance due to fusion with Hmp, but rather that it is likely due to an increase in translation rate (Figure 8). Further, the predicted translation rate with the RBS calculator (Figure S4) suggested that translation initiation is unlikely to be the translational step responsible for the enhancement.
Stress response proteins, including RpoA [62], SlyD [63], Tsf [64], RpoS [65], PotD [66] and Crr [66], have been suggested to be used as solubility enhancers, as their native function would require them to be properly folded under stressful conditions, which often lead to protein aggregation and misfolding. Here we found that the majority of Hmp-GFP and Hmp-β-csn expressed were soluble, which was expected because both sfGFP and β-csn are fairly soluble by themselves (Figure 4) [67,68]. The extent to which N-terminal Hmp fusions can enhance the expression of insoluble proteins has yet to be assessed and represents a fertile area of future study. Collectively, the data presented here suggest that Hmp, a nitrosative stress response protein, or its first 100 amino acids, have the potential to increase the expression of heterologous proteins when used as an N-terminal fusion tag. Whether this is also true for other microbial hemoglobins, or whether this can be applied to P. pastoris or other eukaryotic cells has yet to be determined; however, these data suggest that there is an unappreciated dimension of how bacterial hemoglobins can be deployed as biotechnological tools.
Supplementary Materials
The following are available online at https://www.mdpi.com/article/10.3390/microorganisms10020358/s1, Figure S1: Visualization of LacZ, Hmp-LacZ, sfGFP, Hmp100-sfGFP, and Hmp-sfGFP with SDS-PAGE of whole cell lysates.; Figure S2: Expression of GFP preceded by the linker peptide is low and Hmp is not fluorescent; Figure S3: Hmp-β-csn with an enterokinase cleavage site cleaved by enterokinase to yield β-csn; Figure S4: Predicted translation rate of constructs used in this study by RBS calculator v2.1; Figure S5: Fluorescence measurements of uninduced controls and the OD600 measurement of induced samples; Table S1: Bacterial strain and plasmid table; Table S2: DNA primer sequence. Table S3: Amino acid sequences of proteins used in this study.
Author Contributions
Conceptualization, X.W. and M.P.B.; methodology, X.W., A.J.L. and M.P.B.; experimentation, X.W.; writing—original draft preparation, X.W.; writing—review and editing, X.W., A.J.L. and M.P.B.; supervision, M.P.B.; funding acquisition, M.P.B. All authors have read and agreed to the published version of the manuscript.
Funding
This research was funded by a Focused Research Team award on Precision Antibiotics that was made possible through the generosity of Helen Shipley Hunt * 71 (MPB).
Institutional Review Board Statement
Not applicable.
Informed Consent Statement
Not applicable.
Data Availability Statement
The data presented in this study are available in the main text and supplemental material.
Acknowledgments
We acknowledge the National BioResource Project (NIG, Japan) for distribution of the Keio collection, and Mohamed Donia for helpful discussions.
Conflicts of Interest
The authors declare no conflict of interest.
Abbreviations
Hmp: E. coli flavohemoprotein; β-csn: bovine β-casein; LacZ: E. coli β-galactosidase; ·NO: nitric oxide; VHb: Vitreoscilla hemoglobin; sfGFP: superfold green fluorescent protein; IPTG: isopropropyl-β-D-thiogalactopyranoside; MBP: E. coli maltose-binding protein; GST: glutathione S-transferase; TRX: thioredoxin; RBS: ribosomal binding site; qPCR: quantitative polymerase chain reaction; SDS-PAGE: sodium dodecyl sulfate-polyacrylamide gel electrophoresis; HRP: horseradish peroxidase; FAD: flavin adenine dinucleotide; NAD: nicotinamide adenine dinucleotide; MU: Miller units; OD: optical density.
References
- Gardner, P.R.; Gardner, A.M.; Martin, L.A.; Salzman, A.L. Nitric oxide dioxygenase: An enzymic function for flavohemoglobin. Proc. Natl. Acad. Sci. USA 1998, 95, 10378. [Google Scholar] [CrossRef] [Green Version]
- Bonamore, A.; Boffi, A. Flavohemoglobin: Structure and reactivity. IUBMB Life 2008, 60, 19–28. [Google Scholar] [CrossRef]
- Hernández-Urzúa, E.; Mills, C.E.; White, G.P.; Contreras-Zentella, M.L.; Escamilla, E.; Vasudevan, S.G.; Membrillo-Hernández, J.; Poole, R.K. Flavohemoglobin Hmp, but Not Its Individual Domains, Confers Protection from Respiratory Inhibition by Nitric Oxide in Escherichia coli. J. Biol. Chem. 2003, 278, 34975–34982. [Google Scholar] [CrossRef] [Green Version]
- Gardner, A.M.; Martin, L.A.; Gardner, P.R.; Dou, Y.; Olson, J.S. Steady-state and transient kinetics of Escherichia coli nitric-oxide dioxygenase (flavohemoglobin). The B10 tyrosine hydroxyl is essential for dioxygen binding and catalysis. J. Biol. Chem. 2000, 275, 12581–12589. [Google Scholar] [CrossRef] [PubMed] [Green Version]
- Robinson, J.L.; Brynildsen, M.P. Discovery and dissection of metabolic oscillations in the microaerobic nitric oxide response network of Escherichia coli. Proc. Natl. Acad. Sci. USA 2016, 113, E1757–E1766. [Google Scholar] [CrossRef] [PubMed] [Green Version]
- Kim, S.O.; Orii, Y.; Lloyd, D.; Hughes, M.N.; Poole, R.K. Anoxic function for the Escherichia coli flavohaemoglobin (Hmp): Reversible binding of nitric oxide and reduction to nitrous oxide. FEBS Lett. 1999, 445, 389–394. [Google Scholar] [CrossRef] [Green Version]
- Wu, G.; Corker, H.; Orii, Y.; Poole, R.K. Escherichia coli Hmp, an “oxygen-binding flavohaemoprotein”, produces superoxide anion and self-destructs. Arch. Microbiol. 2004, 182, 193–203. [Google Scholar] [CrossRef]
- Bodenmiller Diane, M.; Spiro, S. The yjeB (nsrR) Gene of Escherichia coli Encodes a Nitric Oxide-Sensitive Transcriptional Regulator. J. Bacteriol. 2006, 188, 874–881. [Google Scholar] [CrossRef] [Green Version]
- Tucker, N.P.; Le Brun, N.E.; Dixon, R.; Hutchings, M.I. There′s NO stopping NsrR, a global regulator of the bacterial NO stress response. Trends Microbiol. 2010, 18, 149–156. [Google Scholar] [CrossRef]
- Poole, R.K. Flavohaemoglobin: The pre-eminent nitric oxide-detoxifying machine of microorganisms. F1000Research 2020, 9, F1000. [Google Scholar] [CrossRef] [Green Version]
- Khosla, C.; Bailey, J.E. Heterologous expression of a bacterial haemoglobin improves the growth properties of recombinant Escherichia coli. Nature 1988, 331, 633–635. [Google Scholar] [CrossRef] [PubMed]
- Khosla, C.; Curtis, J.E.; Bydalek, P.; Swartz, J.R.; Bailey, J.E. Expression of Recombinant Proteins in Escherichia coli Using an Oxygen-Responsive Promoter. Bio/Technology 1990, 8, 554–558. [Google Scholar] [CrossRef]
- Arnaldos, M.; Kunkel, S.A.; Wang, J.; Pagilla, K.R.; Stark, B.C. Vitreoscilla hemoglobin enhances ethanol production by Escherichia coli in a variety of growth media. Biomass Bioenergy 2012, 37, 1–8. [Google Scholar] [CrossRef]
- Pablos, T.E.; Mora, E.M.; Le Borgne, S.; Ramírez, O.T.; Gosset, G.; Lara, A.R. Vitreoscilla hemoglobin expression in engineered Escherichia coli: Improved performance in high cell-density batch cultivations. Biotechnol. J. 2011, 6, 993–1002. [Google Scholar] [CrossRef]
- Kallio, P.T.; Bailey, J.E. Intracellular expression of Vitreoscilla hemoglobin (VHb) enhances total protein secretion and improves the production of α-amylase and neutral protease in Bacillus subtilis. Biotechnol. Prog. 1996, 12, 31–39. [Google Scholar] [CrossRef] [PubMed]
- Kahraman, H.; Erenler, S.O. Rhamnolipid production by Pseudomonas aeruginosa engineered with the Vitreoscilla hemoglobin gene. Appl. Biochem. Microbiol. 2012, 48, 188–193. [Google Scholar] [CrossRef]
- Wang, T.; Bai, L.; Zhu, D.; Lei, X.; Liu, G.; Deng, Z.; You, D. Enhancing macrolide production in Streptomyces by coexpressing three heterologous genes. Enzym. Microb. Technol. 2012, 50, 5–9. [Google Scholar] [CrossRef]
- Li, J.; Zhang, Y. Modulating betulinic acid production in Saccharomyces cerevisiae by managing the intracellular supplies of the co-factor NADPH and oxygen. J. Biosci. Bioeng. 2015, 119, 77–81. [Google Scholar] [CrossRef] [PubMed]
- Wu, J.-M.; Fu, W.-C. Intracellular co-expression of Vitreoscilla hemoglobin enhances cell performance and β-galactosidase production in Pichia pastoris. J. Biosci. Bioeng. 2012, 113, 332–337. [Google Scholar] [CrossRef]
- Wen, Y.; Song, Y.; Li, J.L. [The effects of Vitreoscilla hemoglobin expression on growth and antibiotic production in Streptomyces cinnamonensis]. Sheng Wu Gong Cheng Xue Bao = Chin. J. Biotechnol. 2001, 17, 24–28. [Google Scholar]
- Frey, A.D.; Kallio, P.T. Nitric oxide detoxification—A new era for bacterial globins in biotechnology? Trends Biotechnol. 2005, 23, 69–73. [Google Scholar] [CrossRef]
- Wei, X.-X.; Chen, G.-Q. Chapter Fifteen—Applications of the VHb Gene vgb for Improved Microbial Fermentation Processes. In Methods in Enzymology; Poole, R.K., Ed.; Academic Press: Cambridge, MA, USA, 2008; Volume 436, pp. 273–287. [Google Scholar]
- Kallio, P.T.; Kim, D.J.; Tsai, P.S.; Bailey, J.E. Intracellular expression of Vitreoscilla hemoglobin alters Escherichia coli energy metabolism under oxygen-limited conditions. Eur. J. Biochem. 1994, 219, 201–208. [Google Scholar] [CrossRef]
- Kaur, R.; Pathania, R.; Sharma, V.; Mande Shekhar, C.; Dikshit Kanak, L. Chimeric Vitreoscilla Hemoglobin (VHb) Carrying a Flavoreductase Domain Relieves Nitrosative Stress in Escherichia coli: New Insight into the Functional Role of VHb. Appl. Environ. Microbiol. 2002, 68, 152–160. [Google Scholar] [CrossRef] [Green Version]
- Park, K.-W.; Kim, K.-J.; Howard, A.J.; Stark, B.C.; Webster, D.A. Vitreoscilla Hemoglobin Binds to Subunit I of Cytochrome bo Ubiquinol Oxidases. J. Biol. Chem. 2002, 277, 33334–33337. [Google Scholar] [CrossRef] [PubMed] [Green Version]
- Frey, A.D.; Shepherd, M.; Jokipii-Lukkari, S.; Häggman, H.; Kallio, P.T. Chapter 3—The Single-Domain Globin of Vitreoscilla: Augmentation of Aerobic Metabolism for Biotechnological Applications. In Advances in Microbial Physiology; Poole, R.K., Ed.; Academic Press: Cambridge, MA, USA, 2011; Volume 58, pp. 81–139. [Google Scholar]
- Webster, D.A.; Dikshit, K.L.; Pagilla, K.R.; Stark, B.C. The Discovery of Vitreoscilla Hemoglobin and Early Studies on Its Biochemical Functions, the Control of Its Expression, and Its Use in Practical Applications. Microorganisms 2021, 9, 1637. [Google Scholar] [CrossRef] [PubMed]
- Wan, X.; Brynildsen, M.P. Robustness of nitric oxide detoxification to nitrogen starvation in Escherichia coli requires RelA. Free Radic. Biol. Med. 2021, 176, 286–297. [Google Scholar] [CrossRef]
- Robinson, J.L.; Brynildsen, M.P. An ensemble-guided approach identifies ClpP as a major regulator of transcript levels in nitric oxide-stressed Escherichia coli. Metab. Eng. 2015, 31, 22–34. [Google Scholar] [CrossRef] [PubMed] [Green Version]
- Baba, T.; Ara, T.; Hasegawa, M.; Takai, Y.; Okumura, Y.; Baba, M.; Datsenko, K.A.; Tomita, M.; Wanner, B.L.; Mori, H. Construction of Escherichia coli K-12 in-frame, single-gene knockout mutants: The Keio collection. Mol. Syst. Biol. 2006, 2, 2006.0008. [Google Scholar] [CrossRef] [Green Version]
- Orman, M.A.; Brynildsen, M.P. Dormancy Is Not Necessary or Sufficient for Bacterial Persistence. Antimicrob. Agents Chemother. 2013, 57, 3230–3239. [Google Scholar] [CrossRef] [Green Version]
- Zaslaver, A.; Bren, A.; Ronen, M.; Itzkovitz, S.; Kikoin, I.; Shavit, S.; Liebermeister, W.; Surette, M.G.; Alon, U. A comprehensive library of fluorescent transcriptional reporters for Escherichia coli. Nat. Methods 2006, 3, 623–628. [Google Scholar] [CrossRef]
- Amato, S.M.; Brynildsen, M.P. Nutrient Transitions Are a Source of Persisters in Escherichia coli Biofilms. PLoS ONE 2014, 9, e93110. [Google Scholar] [CrossRef] [PubMed] [Green Version]
- Amato, S.M.; Brynildsen, M.P. Persister Heterogeneity Arising from a Single Metabolic Stress. Curr. Biol. 2015, 25, 2090–2098. [Google Scholar] [CrossRef] [PubMed] [Green Version]
- Datsenko, K.A.; Wanner, B.L. One-step inactivation of chromosomal genes in Escherichia coli K-12 using PCR products. Proc. Natl. Acad. Sci. USA 2000, 97, 6640. [Google Scholar] [CrossRef] [Green Version]
- Cherepanov, P.P.; Wackernagel, W. Gene disruption in Escherichia coli: TcR and KmR cassettes with the option of Flp-catalyzed excision of the antibiotic-resistance determinant. Gene 1995, 158, 9–14. [Google Scholar] [CrossRef]
- Miller, J.H. Experiments in Molecular Genetics; Cold Spring Harbor Laboratory: Cold Spring Harbor, NY, USA, 1972; p. 466. [Google Scholar]
- Griffith, K.L.; Wolf, R.E. Measuring β-Galactosidase Activity in Bacteria: Cell Growth, Permeabilization, and Enzyme Assays in 96-Well Arrays. Biochem. Biophys. Res. Commun. 2002, 290, 397–402. [Google Scholar] [CrossRef] [Green Version]
- Schneider, C.A.; Rasband, W.S.; Eliceiri, K.W. NIH Image to ImageJ: 25 years of image analysis. Nat. Methods 2012, 9, 671–675. [Google Scholar] [CrossRef]
- Chou, W.K.; Brynildsen, M.P. Loss of DksA leads to multi-faceted impairment of nitric oxide detoxification by Escherichia coli. Free Radic. Biol. Med. 2019, 130, 288–296. [Google Scholar] [CrossRef] [PubMed]
- Reis, A.C.; Salis, H.M. An Automated Model Test System for Systematic Development and Improvement of Gene Expression Models. ACS Synth. Biol. 2020, 9, 3145–3156. [Google Scholar] [CrossRef] [PubMed]
- Chou, W.K.; Vaikunthan, M.; Schröder, H.V.; Link, A.J.; Kim, H.; Brynildsen, M.P. Synergy Screening Identifies a Compound That Selectively Enhances the Antibacterial Activity of Nitric Oxide. Front. Bioeng. Biotechnol. 2020, 8, 1001. [Google Scholar] [CrossRef]
- Głąb, T.K.; Boratyński, J. Potential of Casein as a Carrier for Biologically Active Agents. Top. Curr. Chem. 2017, 375, 71. [Google Scholar] [CrossRef] [Green Version]
- Fahnert, B.; Lilie, H.; Neubauer, P. Inclusion Bodies: Formation and Utilisation. In Physiological Stress Responses in Bioprocesses; Springer: Berlin/Heidelberg, Germany, 2004; pp. 93–142. [Google Scholar]
- Villaverde, A.; Mar Carrió, M. Protein aggregation in recombinant bacteria: Biological role of inclusion bodies. Biotechnol. Lett. 2003, 25, 1385–1395. [Google Scholar] [CrossRef] [PubMed]
- Salis, H.M. Chapter two—The Ribosome Binding Site Calculator. In Methods in Enzymology; Voigt, C., Ed.; Academic Press: Cambridge, MA, USA, 2011; Volume 498, pp. 19–42. [Google Scholar]
- The Business Research Company. Therapeutic Proteins Global Market Report 2021: COVID-19 Impact and Recovery to 2030; The Business Research Company: London, UK, 2021. [Google Scholar]
- Belsey, M.; Pavlou, A. Marketspace: Leading therapeutic recombinant protein sales forecast and analysis to 2010. J. Commer. Biotechnol. 2005, 12, 69–73. [Google Scholar] [CrossRef]
- Dewan, S.S. Global Markets for Enzymes in Industrial Applications; BCC Publishing: Wellesley, MA, USA, 2021; p. 169. [Google Scholar]
- Young, C.L.; Britton, Z.T.; Robinson, A.S. Recombinant protein expression and purification: A comprehensive review of affinity tags and microbial applications. Biotechnol. J. 2012, 7, 620–634. [Google Scholar] [CrossRef] [PubMed]
- di Guana, C.; Lib, P.; Riggsa, P.D.; Inouyeb, H. Vectors that facilitate the expression and purification of foreign peptides in Escherichia coli by fusion to maltose-binding protein. Gene 1988, 67, 21–30. [Google Scholar] [CrossRef]
- Kapust, R.B.; Waugh, D.S. Escherichia coli maltose-binding protein is uncommonly effective at promoting the solubility of polypeptides to which it is fused. Protein Sci. 1999, 8, 1668–1674. [Google Scholar] [CrossRef] [Green Version]
- Davis, G.D.; Elisee, C.; Newham, D.M.; Harrison, R.G. New fusion protein systems designed to give soluble expression in Escherichia coli. Biotechnol. Bioeng. 1999, 65, 382–388. [Google Scholar] [CrossRef]
- LaVallie, E.R.; Lu, Z.; Diblasio-Smith, E.A.; Collins-Racie, L.A.; McCoy, J.M. [21] Thioredoxin as a fusion partner for production of soluble recombinant proteins in Escherichia coli. In Methods in Enzymology; Academic Press: Cambridge, MA, USA, 2000; Volume 326, pp. 322–340. [Google Scholar]
- Chaves, J.E.; Rueda-Romero, P.; Kirst, H.; Melis, A. Engineering Isoprene Synthase Expression and Activity in Cyanobacteria. ACS Synth. Biol. 2017, 6, 2281–2292. [Google Scholar] [CrossRef]
- Formighieri, C.; Melis, A. A phycocyanin·phellandrene synthase fusion enhances recombinant protein expression and β-phellandrene (monoterpene) hydrocarbons production in Synechocystis (cyanobacteria). Metab. Eng. 2015, 32, 116–124. [Google Scholar] [CrossRef] [PubMed]
- Butt, T.R.; Edavettal, S.C.; Hall, J.P.; Mattern, M.R. SUMO fusion technology for difficult-to-express proteins. Protein Expr. Purif. 2005, 43, 1–9. [Google Scholar] [CrossRef]
- Smith, D.B.; Johnson, K.S. Single-step purification of polypeptides expressed in Escherichia coli as fusions with glutathione S-transferase. Gene 1988, 67, 31–40. [Google Scholar] [CrossRef]
- Waugh, D.S. Making the most of affinity tags. Trends Biotechnol. 2005, 23, 316–320. [Google Scholar] [CrossRef] [PubMed] [Green Version]
- Rosano, G.L.; Ceccarelli, E.A. Recombinant protein expression in microbial systems. Front. Microbiol. 2014, 5, 341. [Google Scholar] [CrossRef] [Green Version]
- Ilari, A.; Bonamore, A.; Farina, A.; Johnson, K.A.; Boffi, A. The X-ray Structure of Ferric Escherichia coli Flavohemoglobin Reveals an Unexpected Geometry of the Distal Heme Pocket. J. Biol. Chem. 2002, 277, 23725–23732. [Google Scholar] [CrossRef] [Green Version]
- Ahn, K.-Y.; Song, J.-A.; Han, K.-Y.; Park, J.-S.; Seo, H.-S.; Lee, J. Heterologous protein expression using a novel stress-responsive protein of E. coli RpoA as fusion expression partner. Enzym. Microb. Technol. 2007, 41, 859–866. [Google Scholar] [CrossRef]
- Han, K.-Y.; Song, J.-A.; Ahn, K.-Y.; Park, J.-S.; Seo, H.-S.; Lee, J. Solubilization of aggregation-prone heterologous proteins by covalent fusion of stress-responsive Escherichia coli protein, SlyD. Protein Eng. Des. Sel. 2007, 20, 543–549. [Google Scholar] [CrossRef] [Green Version]
- Han, K.-Y.; Song, J.-A.; Ahn, K.-Y.; Park, J.-S.; Seo, H.-S.; Lee, J. Enhanced solubility of heterologous proteins by fusion expression using stress-induced Escherichia coli protein, Tsf. FEMS Microbiol. Lett. 2007, 274, 132–138. [Google Scholar] [CrossRef]
- Park, J.-S.; Han, K.-Y.; Lee, J.-H.; Song, J.-A.; Ahn, K.-Y.; Seo, H.-S.; Sim, S.-J.; Kim, S.-W.; Lee, J. Solubility enhancement of aggregation-prone heterologous proteins by fusion expression using stress-responsive Escherichia coli protein, RpoS. BMC Biotechnol. 2008, 8, 15. [Google Scholar] [CrossRef] [Green Version]
- Han, K.-Y.; Seo, H.-S.; Song, J.-A.; Ahn, K.-Y.; Park, J.-S.; Lee, J. Transport proteins PotD and Crr of Escherichia coli, novel fusion partners for heterologous protein expression. Biochim. Biophys. Acta (BBA) Proteins Proteom. 2007, 1774, 1536–1543. [Google Scholar] [CrossRef] [PubMed]
- Pédelacq, J.-D.; Cabantous, S.; Tran, T.; Terwilliger, T.C.; Waldo, G.S. Engineering and characterization of a superfolder green fluorescent protein. Nat. Biotechnol. 2006, 24, 79–88. [Google Scholar] [CrossRef] [PubMed]
- Simons, G.; van den Heuvel, W.; Reynen, T.; Frijters, A.; Rutten, G.; Slangen, C.J.; Groenen, M.; de Vos, W.M.; Siezen, R.J. Overproduction of bovine β-casein in Escherichia coli and engineering of its main chymosin cleavage site. Protein Eng. Des. Sel. 1993, 6, 763–770. [Google Scholar] [CrossRef] [PubMed]


Publisher’s Note: MDPI stays neutral with regard to jurisdictional claims in published maps and institutional affiliations. |
© 2022 by the authors. Licensee MDPI, Basel, Switzerland. This article is an open access article distributed under the terms and conditions of the Creative Commons Attribution (CC BY) license (https://creativecommons.org/licenses/by/4.0/).