Abstract
This paper presents feedforward, feedback and two-degree-of-freedom control applied to an Ionic Polymer-Metal Composite (IPMC) actuator. It presents a high potential for development of miniature robots and biomedical devices and artificial muscles. We have reported in the last few years that dehydration treatment improves the electrical controllability of bending in Selemion CMV-based IPMCs. We tried to replicate this controllability in Nafion-based IPMC. We found that the displacement of a Nafion-based IPMC was proportional to the total charge imposed, just as in the Selemion-CMV case. This property is the basis of self-sensing controllers for Nafion-based IPMC bending behavior: we perform bending curvature experiments on Nafion-based IPMCs, obtaining the actuator's dynamics and transfer function. From these, we implemented self-sensing controllers using feedforward, feedback and two-degree-of-freedom techniques. All three controllers performed very well with the Nafion-based IPMC actuator.
1. Introduction
Ionic Polymer-Metal Composite (IPMC) is a bending mode electroactive polymer actuator. Its supple motion and soft body and electroactive nature make it strikingly similar to animal muscle [1,2,3,4,5,6,7,8]. Researchers consider IPMC a promising candidate for creating artificial muscle, miniature robots and biomedical devices. Nafion-based IPMC is the most well-known and investigated IPMC. Attempts to fabricate a practical Nafion-based IPMC actuator have been going on for the past two decades [1,2,3,4,5,6,7]. To date, however, none have been successful. One of the difficulties lies in the electrical control of IPMC bending. Nafion-based IPMC exhibits large bending in response to applied voltage, but the bending follows the voltage for only a few minutes, at the longest, before becoming uncontrollable.
Silver-coated Selemion CMV-based IPMC (hereafter called Selemion IPMC) is another type of IPMC. IPMCs are usually activated in a highly hydrated state even in an aqueous solution, and Selemion IPMC exhibits large bending in response to an applied voltage when in such a state. Its bending controllability was poor like Nafion-based IPMC. However, we found previously that it could be ameliorated greatly by dehydration treatment [9,10,11]. Furthermore, the bending curvature of the dehydrated Selemion IPMC is proportional to the total charge imposed on it. Owing to such a proportional relationship between the curvature and charge, we successfully carried out the bending control of Selemion IPMC by the control of charge imposed on it [12].
Hoping to capitalize on the similarity between Nafion and Selemion CMV, we fabricated a silver-coated Nafion-based IPMC (hereafter called Nafion IPMC) and investigated its bending controllability in the dehydrated state. Contrary to expectation, we observed only a slight improvement in bending controllability in the dehydrated state. However, we carried out further investigation and found the bending controllability of Nafion-based IPMC improved in the extremely low absolute humidity environment. We observed the linear relationship between the Nafion IPMC bending curvature and the quantity of charge imposed on it like Selemion IPMC. This experimental result indicated that the bending controllability of Nafion-IPMC could be significantly improved in the extremely low humidity environment. Therefore, we attempted to self-sensing control the bending of Nafion-based IPMC by feedback, feedforward and two-degree-of-freedom control techniques [13,14,15]. We found that all of them worked.
2. Nafion Based IPMC Actuator
Nafion based IPMC actuator is formed from a piece of Nafion coated with silver. Its fabrication requires several steps. The surfaces of a Nafion sheet are first crazed and sandblasted to improve silver adhesion [16,17,18,19]. Silver is then deposited by the silver mirror reaction [20]. The silver coated Nafion sheet, now 0.2 mm thick, is then cut into strips 20 mm long by 2 mm wide. Because the bending controllability of Nafion IPMC deteriorates when too much water is present, as a result from being submerged in an aqueous solution, for instance [9,10,11,12], the strips are stored in a vacuum with a desiccant to remove almost all moisture. Water, however, is essential for electrical activation, and Nafion IPMC cannot bend without it. Thus, in this work, we allowed the Nafion IPMCs to reabsorb a small amount of water by exposing them to the ambient air for 30 min prior to any experiment. Hence, the results described below were obtained using Nafion IPMCs that were very slightly hydrated. Hereafter we regard and call “a very slightly hydrated Nafion IPMC” as “a dehydrated Nafion IPMC”.
3. IPMC Actuator Bending Model
For clearly explain our research results, firstly, we came to think that it was better to experimentally ascertain the relationship between Nafion IPMC bending behavior and environmental humidity. To do so, following experiment was carried out first.
A dehydrated Nafion IPMC was clamped at one end to a pair of electrodes connected to a power supply as shown in Figure 1. When voltage was applied, the Nafion IPMC bends toward the anode (see Figure 1). We applied a rectangular wave (amplitude = 2 V, frequency = 0.05 Hz) to the strip while monitoring the position of a point on the strip 10 mm away from the clamp point with a laser displacement sensor (LK-085, precision 3μm, KEYENCE, Osaka, Japan). At the same time, the environmental relative humidity and temperature were recorded with a Z2000 (HIOKI, Nagano, Japan) humidity sensor and a K type thermocouple. From these, the absolute humidity was found. The measured tip displacement of the Nafion IPMC was mathematically converted to bending curvature C.

Figure 1.
Experimental setup for measuring the tip displacement of Nafion Ionic Polymer-Metal Composite (IPMC). Illustrations on the left and right respectively show the shape of Nafion IPMC in the OFF and ON stages.
Figure 2 shows Bending curvature of the Nafion IPMC vs. Total charge imposed on the Nafion IPMC per unit surface area in two different absolute humidity environment, when a Nafion IPMC was subjected to the oscillating rectangular voltage (amplitude = 2 V, frequency = 0.05 Hz). As described in the Introduction in this paper, the bending curvature of dehydrated Selemion IPMC is proportional to the charge imposed on it. However, unlike the Selemion IPMC, bending curvature of Nafion IPMC was not proportional to the charge imposed on it, even though it was in the dehydrated state. Its bending curvature response to the total charge imposed was unpredictably complex.
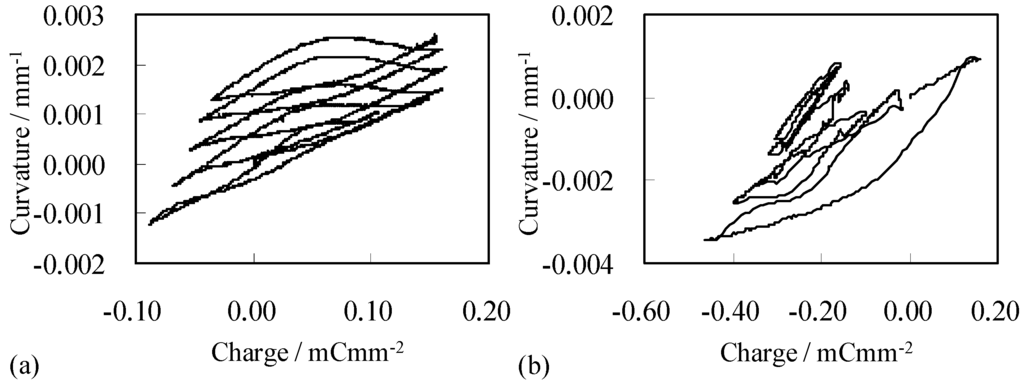
Figure 2.
Bending curvature of the Nafion IPMC vs. Total charge imposed on the Nafion IPMC per unit surface area at an absolute humidity of (a) 17 gm−3 (b) 12 gm−3.
Then we carried out the same experiment even at the lower absolute humidity environment. Figure 3a shows Bending curvature of the Nafion IPMC vs. Total charge imposed on the Nafion IPMC per unit surface area in the environment of absolute humidity 7 gm−3. We could observe a linear relationship between the curvature and charge about Nafion IPMC like Selemion IPMC in the extremely low humidity environment, and the Nafion IPMC exhibited regular triangular form of curvature as a function of time under the oscillating rectangular voltage (amplitude = 2 V, frequency = 0.05 Hz) as shown in Figure 3b). Although commonly investigated hydrated IPMC also exhibits well-controllable bending behavior [21,22,23], it lasts for a few minutes at the longest. Soon, its bending becomes uncontrollable. On the other hand, we repeatedly observed that the Nafion IPMC shown in Figure 3 exhibited a fairly stable oscillation for more than ten minutes.
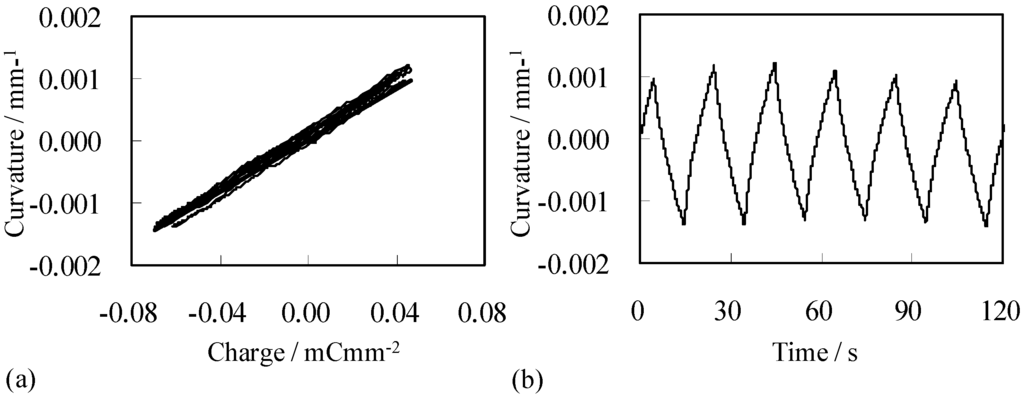
Figure 3.
(a) Bending curvature of the Nafion IPMC vs. Total charge imposed on the Nafion IPMC per unit surface area at an absolute humidity of 7 gm−3 (b) Bending curvature of the Nafion IPMC vs. Time.
Figure 3 suggested that bending curvature could be controlled by the controlling the charge to be imposed on the Nafion IPMC, since we got an approximate simple relationship C = kQ, where Q is the charge per unit area, and the constant of proportionality k was experimentally determined to be 0.02 m C−1. This linearity was all the more surprising because Nafion IPMC was not a precisely structured material. It had a bumpy silver layer as seen in Figure 4. These results require more comment. We had previously reported that the bending of IPMC consisting of merely a Nafion coated with silver only could not be electrically controlled [12]. However, this has turned out not to be the case in all circumstances. The results so far, as seen in Figure 3, already show this. Results later in this paper will more strongly demonstrate that the bending of dehydrated Nafion IMPC in an extremely low humidity environment is actually very controllable.
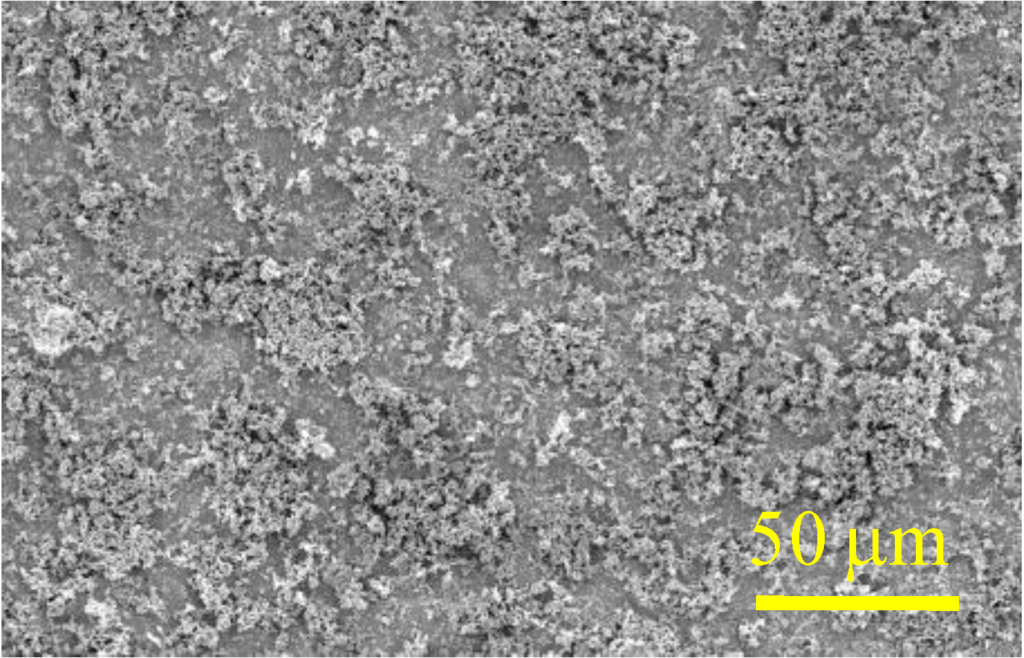
Figure 4.
Top surface of the Nafion IPMC. Notice the bumpy silver layer.
4. Actuator Modeling Using System Identification Method
In an extremely low humidity environment, Nafion IPMC bending comes to exhibit well-ordered characteristics as in Figure 3a,b. It strongly suggests that bending of Nafion IPMC is controllable in the extremely low humidity environment.
Using the experimental data shown in Figure 3b, we derived a transfer function for the Nafion IPMC which associates an output O (bending curvature) to the input signal I (electrical signal imposed) via the equation L[O] = G(s) L[I] where L represents the Laplace transform. The derivation procedure is detailed below.
We employed a system identification technique to derive the transfer function. Among the many applicable techniques, we chose the ARMAX (Auto-Regressive Moving Average exogenous) model. This model is expressed in (1) and its block diagram is shown in Figure 5.
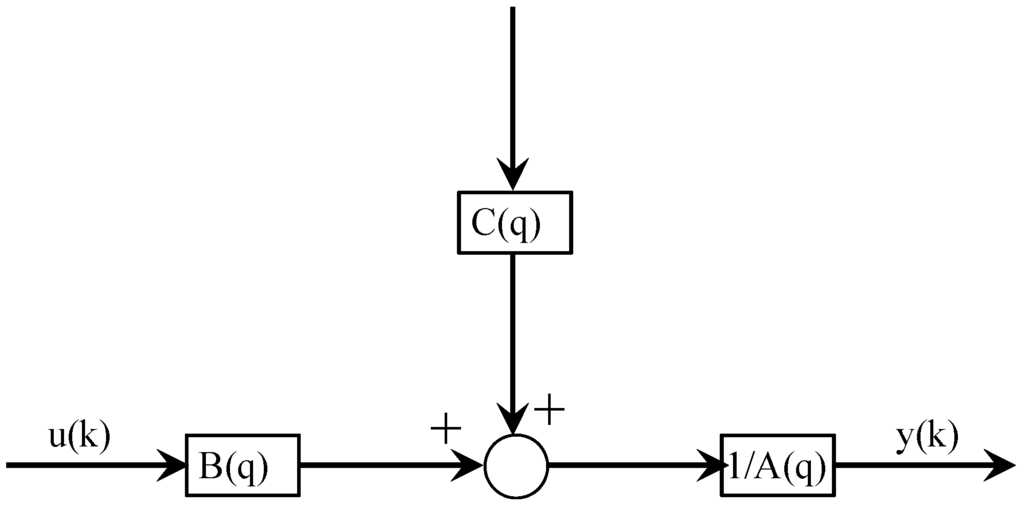
Figure 5.
The ARMAX model used in system identification.

The transfer function G(q) and the noise model are given by Equations (2) and (3), respectively.


The ARMAX model works quite well for building noise models and is widely employed in system identification. In this study, we built a model using the System Identification Toolbox in MATLAB. The data set used for the system identification step consists of the rectangular voltage wave shown in Figure 6 as the input and the corresponding bending curvature on a Nafion IPMC piece shown in Figure 3b as the output. The derived transfer function is shown in Equation (4), where AH in Equation (4) represents absolute humidity.

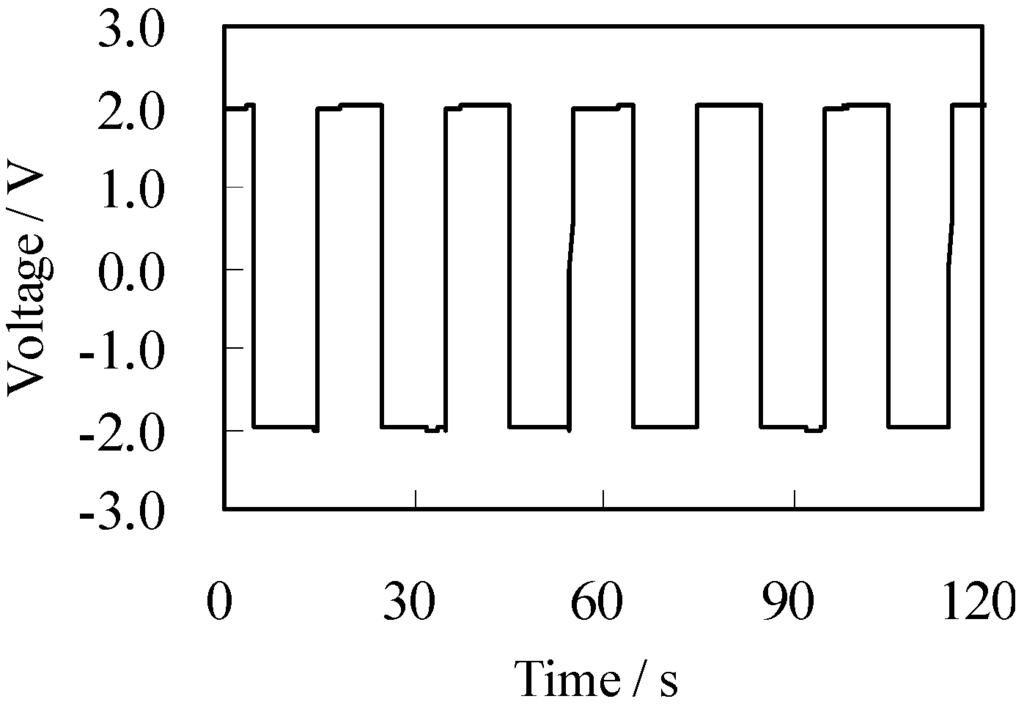
Figure 6.
The oscillating rectangular voltage used as input on a Nafion IPMC specimen to obtain the data shown in Figure 3b. The voltage amplitude is 2 V and frequency is 0.05 Hz.
We refined our model by making more measurements and doing additional system identifications at various humidities between 7 and 11 gm−3. Despite the observation of unpredictably complex bending behavior of highly hydrated IPMC [10], we found that the transfer function of dehydrated Nafion IPMC does change at low absolute humidity environment between 7 and 11 gm−3 but the change can be modeled simply by a multiplicative factor m(AH), whose value depends only on the absolute humidity as shown in Equation (5).

To validate the transfer function Equation (4) of the Nafion IPMC, we compared its predicted output in response to an input waveform of 0.17 Hz frequency which is different from the one (0.05 Hz) used to derived the transfer function, although the amplitude was the same as before (2 V). Figure 7 shows the computational and experimental results. The two curves match closely after an initial period, indicating that the transfer function Equation (4) is a reasonable one.
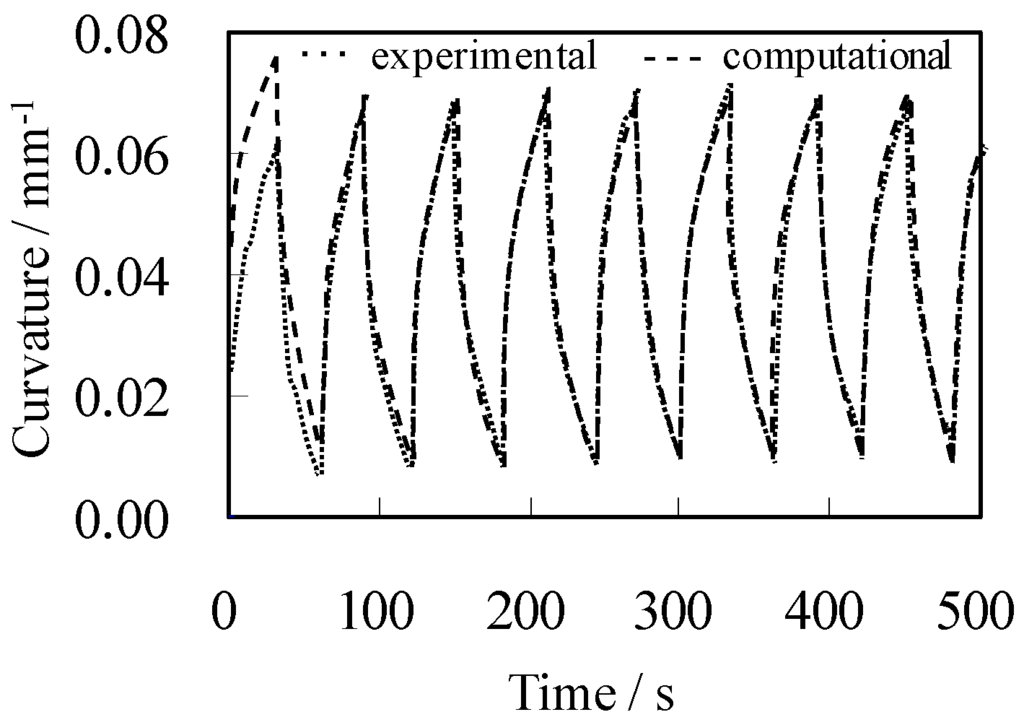
Figure 7.
Time-dependent bending curvature of Nafion IPMC obtained experimentally and computationally.
5. Control Strategy of the Actuator
We attempted to control the bending of dehydrated Nafion IPMC using feedforward, feedback and two-degree-of-freedom techniques. Feedforward control requires an inverse control system using the transfer function of the Nafion IPMC. Thus, we performed a system identification to obtain it. All three control systems were tested in turn by implementing them in Simulink (within Matlab) and using the output to drive an s-BOX (MTT, Tokyo) DSP connected to a Nafion IPMC.
As described already, we tested bending controllability of Nafion IPMC employing feedforward, feedback and two-degree-of-freedom controls. Block diagrams for those three controlling methods were drawn using Simulink of MATLAB. We put in practice those control systems by driving a Simulink-assisted DSP called s-BOX (MTT, Tokyo). All the bending control tests were carried out at the absolute environmental humidity around 7 gm−3.
5.1. Feedforward Control
A diagram of the feedforward control we implemented to control the bending of a Nafion IPMC specimen appears in Figure 8a. The input was the same rectangular wave as before (amplitude = 2 V, frequency = 0.05 Hz). Figure 9 shows the bending curvature of the specimen over time. The thick line represents the ideal curvature, while the fine line shows the experimentally obtained curvature. The two lines almost coincide.
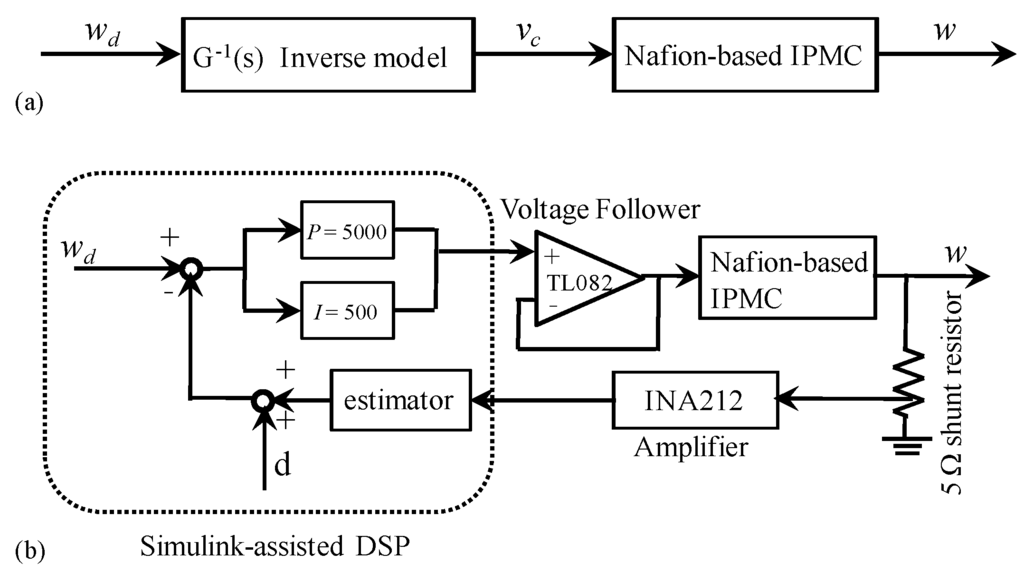
Figure 8.
(a) Feedforward control system (b) Feedback control system.
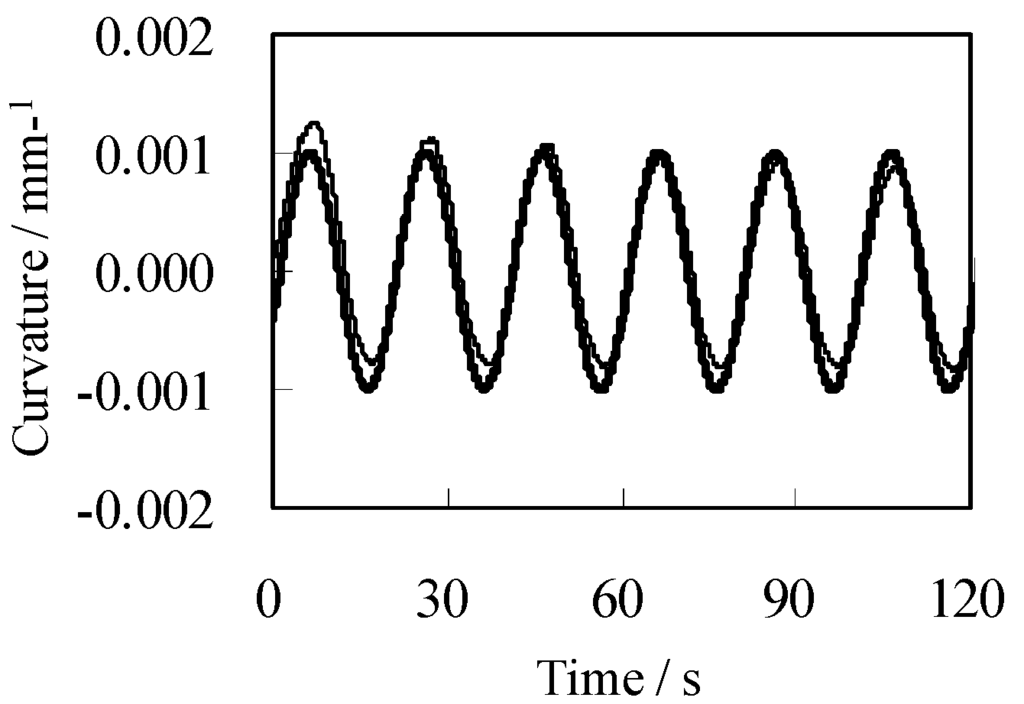
Figure 9.
Bending curvature of the Nafion IPMC vs. Time at AH = 8 gm−3 under feedforward control. Fine curve: Experimental data Thick curve: Desired ideal curve.
Figure 10a,b again show the bending curvature of a Nafion IPMC specimen under feedforward control along with the imposed current per unit surface area over time, respectively.
A step disturbance of C’ = 0.0005 mm−1 in the current was introduced at time t = 53 s and kept from then onward, resulting in a disturbance in the curvature. The current was significantly altered at t = 53 s. However, the curvature continued to follow the input wave despite the disturbance. The bending curvature exhibited a tendency to increase with time after t = 53 s, since the current continued to be elevated after the step.
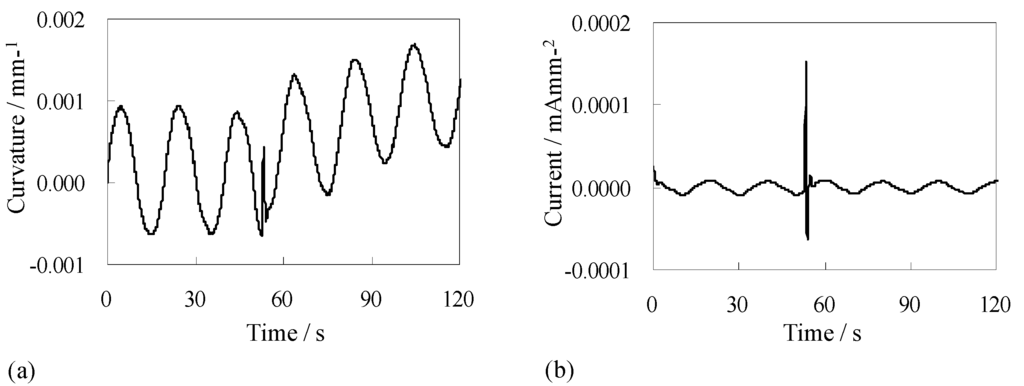
Figure 10.
(a) Bending curvature of the Nafion IPMC vs. Time and (b) Current per unit surface area of the Nafion IPMC vs. Time at AH = 5.5 gm−3 under feedforward control with a disturbance of C’ = 0.0005 mm−1 from t = 53 s onward.
5.2. Feedback Control
We implemented the self-sensing feedback control system in Figure 8b, where P and I were determined by trial and error. A 5 Ω shunt resistor and an amplifier with a gain of 1000 were used to measure Q for the self-sensing, the total charge imposed per unit surface area of the Nafion IPMC. The equation C = kQ (k = 0.02 m C−1) described in section 3 was used to estimate the curvature C resulting from imposing a charge Q for the self-sensing. The input signal was the same oscillating rectangular wave as before. Again, a step disturbance of C’ = 0.0005 mm−1 in the current was introduced at time t = 53 s and kept from then onward. Figure 11a shows the bending curvature over time, while Figure 11b shows the current per unit surface area of Nafion IPMC over the same time. The thick line in Figure 11a is the theoretical ideal while the thin line is the experimentally measured bending. The arrow indicates when the current spike occurred, and shows a negligible amount of disturbance in the bending curvature. Unlike the case with feedforward control, under feedback control, the bending curvature did not exhibit a tendency to increase after the step disturbance. Thus, self-sensing feedback control worked very well for controlling Nafion IPMC bending.
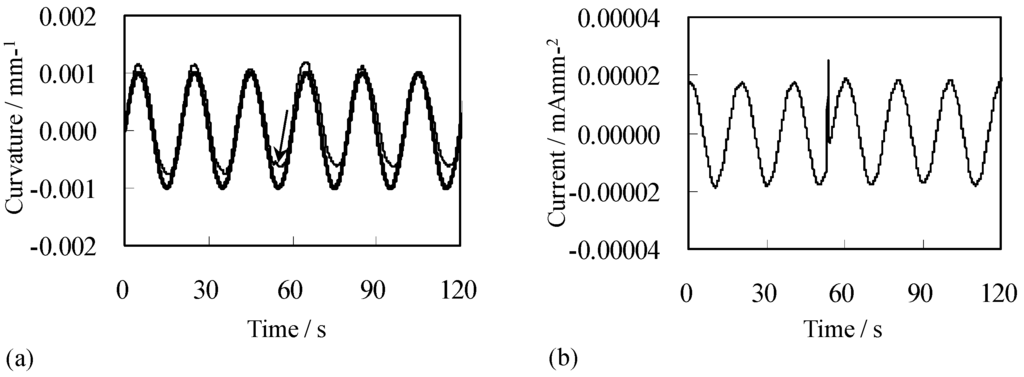
Figure 11.
(a) Bending curvature of the Nafion IPMC vs. Time and (b) Current per unit surface area of the Nafion IPMC vs. Time at AH = 6.5 gm−3 under self-sensing feedback control with a disturbance of C’ = 0.0005 mm−1 from t = 53 s onward. Fine curve: Experimental data Thick curve: Desired ideal curve.
5.3. Two-Degree-of-Freedom Control
Figure 12 shows our design for a self-sensing two-degree-of-freedom controller where P and I were determined by trial and error. Using the same oscillating rectangular input wave as before, we again added a disturbance of C’ = 0.0005 mm−1 from time t = 53 s onward.
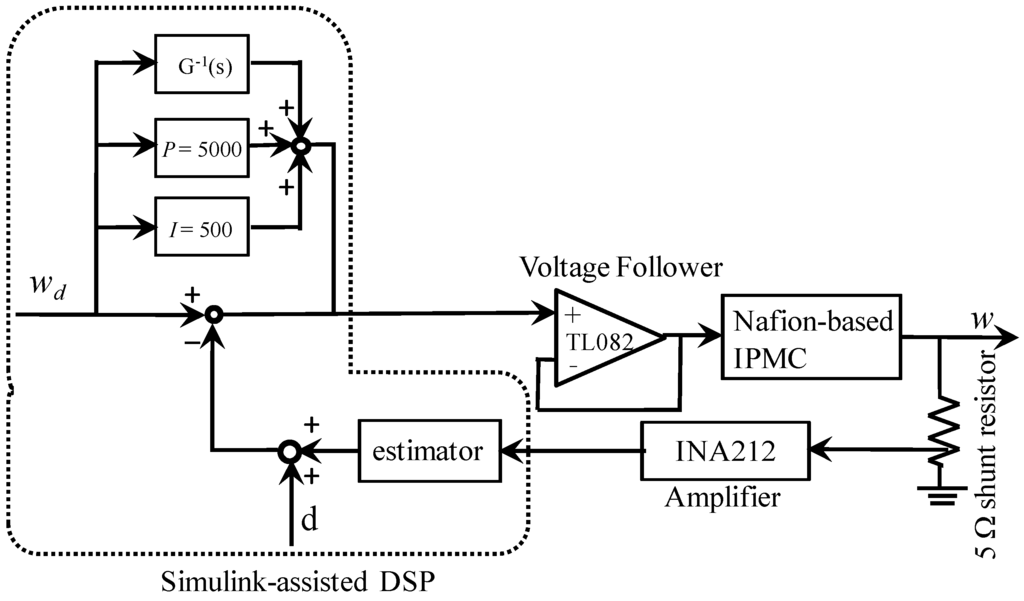
Figure 12.
Two-degree-of-freedom control system.
Figure 13 shows the result, with the arrow indicating the time of the current spike. As with feedback control, the disturbance had almost no effect on the curvature. The experimentally measured bending curvature quantitatively agrees well with the desired ideal bending curvature. Moreover, just as with the self-sensing feedback control, the bending curvature of the Nafion IPMC specimen did not exhibit a tendency to increase with time after the disturbance at t = 53 s. So, while bending control by self-sensing two-degree-of-freedom, control was successful and has good step disturbance rejection performance. The resulting controllability was not much different than that of the feedback control.
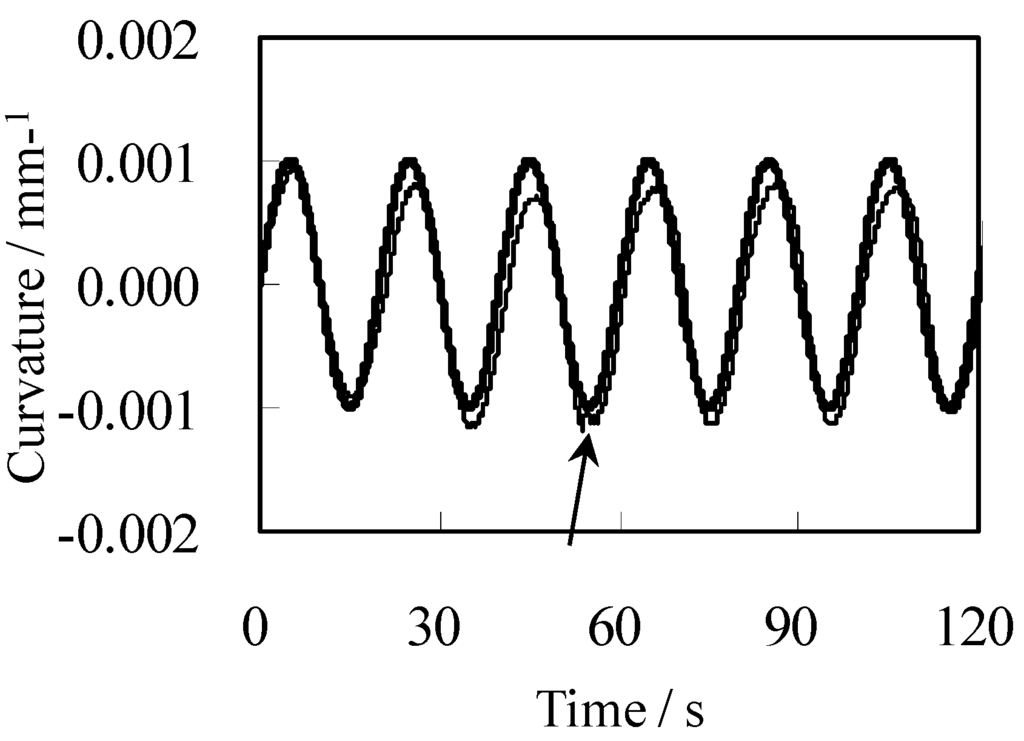
Figure 13.
Bending curvature of the Nafion IPMC vs. Time at AH = 7 gm−3 under the two-degree-of-freedom control with a disturbance of C’ = 0.0005 mm−1 from t = 53 s onward. Fine curve: Experimental data Thick curve: Desired ideal curve.
Exploiting the linear relationship of “bending curvature vs. total charge” of Nafion IPMC, self-sensing feedfoward, feedback and two-degree-of-freedom controls for bending were successfully implemented. Additionally, the latter two techniques were able to reject step disturbances. In short, under conditions of extremely low humidity, all three control techniques worked well.
What we would like to emphasize in this research is not the experimental fact that the three control techniques work well for the bending control of Nafion IPMC. In fact, there have already been a number of publications dealing with the IPMC bending control [21,22,23]. However, there has been very little research about the self-sensing control of IPMC actuator. Our emphasis lies in the fact that the dehydration treatment gives rise to the simple linear relationship of “bending curvature vs. total charge” and such a simple relationship enables us to self-sensing control the Nafion IPMC bending by presented control techniques such as feedfoward, feedback and two-degree-of-freedom controls. Furthermore, we would like to emphasize that the dehydration treatment enable us to achieve the long duration time of Nafion IPMC bending control as long as more than ten minutes (the data of such a long bending control—bending curvature vs. time—is not shown in this paper, because the experimental data is very large and it cannot be accommodated in a single diagram so clearly). As described a moment ago, there have been a number of publications dealing with the IPMC bending control. However, most of them achieve the bending control for a few minutes at the longest. Although we have not confirmed yet if their control techniques work for the bending control of IPMC for long duration time, to our best knowledge, the hydrated IPMC bending control for more than a few minutes is not feasible. In light of this, our research results described in this paper are significant.
6. Conclusions
It was found that the dehydrated Nafion IPMC exhibits linear relationship of curvature vs. charge in the extremely low absolute humidity environment, though the Nafion IPMC does not exhibit such a simple relationship in mere low absolute humidity environment. The simple linear relationship of curvature vs. charge enable us to self-sensing control the Nafion IPMC bending actuator, and actually we successfully achieved the bending control by feedfoward, feedback and two-degree-of-freedom controls. Moreover, as with self-sensing feedback control, the step disturbance had almost no effect on the output of the curvature of the actuator. The experimentally measured bending curvature quantitatively agrees well with the desired ideal bending curvature.
Acknowledgment
The authors would like to express their gratitude to Ministry of Education, Culture, Sports, Science and Technology for the financial support under the Knowledge Cluster Initiative the Second Stage Tokai Region Nanotechnology Manufacturing Cluster and the Grant-in-Aids for Science Research (the research project number 24560291).
Conflicts of Interest
The authors declare no conflict of interest.
References
- Oguro, K.; Kawami, Y.; Takenaka, H. Bending of an ion-conducting polymer film-electrode composite by an electric stimulus at low voltage. Trans. J. Micromach. Soc. 1992, 5, 27–30. [Google Scholar]
- Oguro, K.; Asaka, K.; Takenaka, H. Polymer Film Actuator Driven by Low Voltage. In Proceedings of 4th International Symposium on Micro Machine and Human Science, Nagoya, Japan, 13–15 October 1993; pp. 39–40.
- Asaka, K.; Oguro, K.; Nishimura, Y.; Mizuhara, M.; Takenaka, H. Bending of polyelectrolyte membrane-platinum composite by electric stimuli I, response characteristics to various waver forms. Polym. J. 1995, 27, 436–440. [Google Scholar] [CrossRef]
- Salehpoor, K.; Shahinpoor, M.; Mojarrad, M. Linear and platform type robotic actuators made from ion-exchange membrane-metal composites. Proc. SPIE Smart Mater. Struct. 1997, 3040, 192–198. [Google Scholar]
- Bar-Cohen, Y.; Xue, T.; Shahinpoor, M.; Salehpoor, K.; Simpson, J.; Smith, J. Low-mass muscle actuators using electroactive polymers (EAP). Proc. SPIE Smart Mater. Struct. 1998, 3324, 218–223. [Google Scholar]
- Bar-Cohen, Y.; Leary, S.; Yavrouian, A.; Oguro, K.; Tadokoro, S.; Harrison, J.; Smith, J.; Su, J. Challenges to the Transition Ipmc Artificial Muscle Actuators to Practical Application. In MRS Symposium Proceedings, Boston, MA, USA; 1999. [Google Scholar]
- Dole, U.; Lumia, R.; Shahinpoor, M.; Bermudez, M. Design and test of IPMC artificial muscle microgripper. J. Micro-Nano Mech. 2008, 4, 95–102. [Google Scholar] [CrossRef]
- Sugi, H. Seitaidenkishingoutoha Nanika; (in Japanese). Kodansha: Tokyo, Japan, 2006. [Google Scholar]
- Tamagawa, H.; Nogata, F. Bending response of dehydrated ion exchange polymer membranes to the applied voltage. J. Membrane Sci. 2004, 243, 229–234. [Google Scholar] [CrossRef]
- Tamagawa, H.; Nogata, F. Atomic structural change of silver-plating layers on the surfaces of Selemion, resulting in its excellent bending controllability. Sens. Actuators B Chem. 2006, 114, 781–787. [Google Scholar] [CrossRef]
- Tamagawa, H.; Nogata, F. Charge and water in need for the precise control of Selemion bending. Sens. Actuators B Chem. 2007, 121, 469–475. [Google Scholar] [CrossRef]
- Tamagawa, H.; Lin, W.; Kikuchi, K.; Sasaki, M. Bending control of nafion-based electroactive polymer actuator coated with multi-walled carbon nanotubes. Sens. Actuators B Chem. 2011, 156, 375–382. [Google Scholar] [CrossRef]
- Sasaki, M.; Ozeki, T.; Ito, S.; Tamagawa, H. Position control of a dual-stage actuator. Inter. J. Appl. Eletromagn. Mech. 2010, 33, 839–847. [Google Scholar]
- Sasaki, M.; Onouchi, Y.; Ozeki, T.; Tamagawa, T.; Ito, S. Feedforward control of an Ionic Polymer-Metal Composite actuator. Inter. J. Appl. Eletromagn. Mech. 2010, 33, 875–881. [Google Scholar]
- Sasaki, M.; Onouchi, Y.; Tamagawa, T.; Ito, S. Two-degree-of-freedom control of an ionic polymer-metal composite actuator. Mater. Sci. Forum 2011, 670, 369–378. [Google Scholar]
- Takeno, A.; Nakagaki, N.; Miwa, M. Anisotropic transparency of polystyrene film with crazes. Adv. Compos. Mater. 1998, 7, 35–46. [Google Scholar] [CrossRef]
- Noguchi, F.; Iwashige, Y.; Takeno, A.; Miwa, M. View field selective film of Mono-component polyester composites. J. Adv. Sci. 2001, 13, 382–385. [Google Scholar] [CrossRef]
- Takeno, A.; Yoshimura, M.; Miwa, M.; Yokoi, T. Anisotropic electric conductivity and light transmittance of polypyrrole/poly(vinylidene fluoride) composited film by polymerization in craze. Sen’i Gakkaishi 2001, 57, 301–305. (in Japanese). [Google Scholar] [CrossRef]
- Takeno, A.; Ozeki, T.; Miwa, M.; Yokoi, T. Periodic micro-necking of polyester filament. Sen’i Gakkaishi 2007, 63, 172–176. (in Japanese). [Google Scholar] [CrossRef]
- Onouchi, Y.; Tamagawa, H.; Sasaki, M. Dependence of curvature of dehydrated Selemion on the total charge and environmental humidity. Inter. J. Appl. Eletromagn. Mech. 2009, 17, 59–64. [Google Scholar]
- Yun, K.; Kim, W.J. System identification and microposition control of ionic polymer metal composite for three finger gripper manipulation. Proc. IMechE JSCE215 2006, 220, 539–551. [Google Scholar]
- La, H.M.; Sheng, W. Robust Adaptive Control with Leakage Modification for A Nonlinear Model of Ionic Polymer Metal Composites (IPMC). In Proceedings of the IEEE International Conference on Robotics and Biomimetics, Bangkok, Thailand, 22–25 February 2009; pp. 1783–1788.
- Richardson, R.C.; Levesley, M.C.; Brown, M.D.; Hawkes, J.A.; Watterson, K.; Walker, P.G. Control of ionic polymer metal composites. IEEE/ASME Trans. Mechatr. 2003, 8, 245–253. [Google Scholar] [CrossRef]
© 2013 by the authors; licensee MDPI, Basel, Switzerland. This article is an open access article distributed under the terms and conditions of the Creative Commons Attribution license (http://creativecommons.org/licenses/by/3.0/).