Abstract
In the modern industrial context, many manufacturers design universal testing machines (UTMs) equipped with servo-hydraulic or electromechanical linear actuators, which offer excellent control capabilities and high-quality force signal measurement, at the expense of high costs due to the need for hydraulic power units or dedicated electrical networks. The complexity of these systems discourages manufacturers of mechanical components, especially the ones produced through additive manufacturing (AM), from investing in machines for the determination of mechanical properties according to international standards, settling instead for information derived from technical datasheets of the base material (filament or powders), which rarely include information about fatigue life. Within this context, the Fast Fatigue Machine (FFM), designed by KnoWow srl and ItalSigma srl, makes mechanical characterization of materials a process accessible to any organization that may require it. This was made possible by designing a pneumatic benchtop testing machine with a built-in setup for Thermographic Methods (TMs) usage. The aim of this work is to validate pneumatic actuators as a viable alternative to servo-hydraulic systems, demonstrating their effectiveness and reliability. Frequency analysis on both sinusoidal waveforms, root mean square error (RMSE) evaluation, and percentage total harmonic distortion (THD%) calculations showed that, while the servo-hydraulic system closely follows the load signal with a THD of around 5%, regardless of the applied load intensity, the pneumatic system exhibits higher distortion (THD of approximately 9%, strongly dependent on the load levels) and a high-frequency harmonic component, which, however, does not affect the overall results. Life cycle assessment (LCA) analysis confirmed the convenience of the pneumatic system and TMs in material testing and fatigue characterization.
1. Introduction
Fast Fatigue Machine (FFM) is a pneumatic benchtop universal testing machine (UTM) developed in collaboration between KnoWow Srl, a University of Messina’s academic spin-off, and ItalSigma srl, an Italian manufacturer of testing systems. The FFM can perform both quasi-static tensile tests and fatigue tests with a maximum force of 2.5 kN and a maximum frequency of 15 Hz.
The concept behind the development of the FFM is to make the material characterization a process accessible to companies and research institutions. The servo-hydraulic system’s requirement for a hydraulic power unit, consisting of a pump, oil filter, and control unit [1], can be expensive and unaffordable for many manufacturers. This is particularly critical as the need for material characterization is increasing due to the rise in additive manufacturing (AM) technologies. Whereas in the past, designers could rely on trustworthy technical datasheets reporting both static and, where available, fatigue design parameters, the presence of numerous AM materials, whose mechanical properties are highly dependent on the manufacturing process parameters [2], poses a challenge in rapidly obtaining such information. While static material characterization is generally straightforward, fatigue characterization represents an open design challenge since it is an energy-, material-, and time-consuming process [3,4]. According to ASTM and ISO standards, stress-number of cycles to failure (SN) curve in high-cycle fatigue (HCF) regime should be determined by examining a large set of specimens tested under several loading conditions, due to the probabilistic nature of the fatigue problem.
Many researchers proposed their own approach to rapidly assess the fatigue life of metals, polymers and composites as alternatives to standard methodologies. For thin aluminum films adopted in the fabrication of MEMS devices, Bae et al. [5] developed a very compact HCF testing system employing electromagnetic shakers with a high-frequency response and 10 N load capacity capable of retrieving the SN curve on aluminum films in a short period of time. For the same application, Kim et al. [6] developed an electrodynamic actuator capable of performing tests with high loading frequencies, with a real-time measurement of the deformation. This kind of study also can be conducted by adopting image analysis, for example, during low-cycle fatigue tests, allowing for the study of the strain field in mechanical components, like butt-welded joints, by adopting a digital camera [7] instead of strain gauge. Under uniaxial and multiaxial random loading conditions on metals, several pieces of testing equipment can be adopted, like servo-hydraulic and shaker tables, considering several specimens’ geometries [8]. Ultrasonic testing systems can be adopted to rapidly assess the fatigue life of metals under several loading conditions [9]; however, some issues may arise, like excessive heating during the fatigue test, the design of specimens and different fracture surfaces compared to conventional servo-hydraulic testing systems [10]. To improve the fatigue testing of AM materials, Nicoletto [11] proposed the adoption of the Mini FP2 machine, a compact testing machine which allows for the testing of small, notched specimens under bending conditions.
An approach for the rapid assessment of the fatigue properties of materials is represented by Thermographic Methods (TMs) introduced by Risitano and his School. Since fatigue is a dissipative phenomenon, it is possible to measure with an infrared camera (IR) the temperature evolution of the material subjected to fatigue test conditions.
Risitano’s Thermographic Method (RTM) [12] is a well-established methodology to obtain insight into the fatigue life of materials from a temperature’s trend measured on a specimen loaded with a stepwise increase in the applied stress level [13]. A noticeable increase in temperature occurs just for stress levels above the fatigue limit of the material under study. The RTM allows for the assessment of the fatigue limit and SN curve of the material testing a reduced number of specimens and in a short time.
In 2013, Risitano and Risitano introduced the Static Thermographic Method (STM) to derive, with a quasi-static tensile test, the first damage within the material. This macroscopic stress value can be related, if applied in a cyclic way, with the fatigue limit of the material. More information and comparison with RTM and a conventional fatigue test can be found in [14,15].
In 2022, the FFM was patented and designed to facilitate the testing setup to apply TMs by inserting an infrared (IR) camera and a video camera for digital image correlation (DIC) analysis. It was chosen to use a pneumatic actuator to simplify the working fluid circuit, since it is enough to use a compressor or a compressed air distribution system that is easy to find in most companies.
Pneumatic actuation represents a simplified and cleaner alternative to hydraulic systems, employing gases, typically air, instead of liquids as the working fluid. Because of the lower density, and consequently higher compressibility of air, pneumatic systems exhibit reduced stiffness and greater compliance. Although pneumatic cylinders are extensively used in industrial automation, such systems have traditionally been challenging to control. However, the growing interest in compliant and soft robotic systems has recently prompted the research community to reconsider the potential of pneumatic actuation for more advanced and complex applications. While the pneumatic cylinder remains the most common industrial actuator, a wide range of alternative devices now exploit the power of compressed air for actuation [16]. The simplicity of linear pneumatic actuators allows for their employment in most applications, and to manufacture them by AM process as it was performed in [17]. Although servo-hydraulic actuators are widely employed in material testing applications [18], the use of pneumatic actuators has remained limited due to the inherent compressibility of air, which can influence the accuracy and repeatability of experimental results.
The present study aims to assess and validate pneumatic actuators as a viable alternative to conventional servo-hydraulic systems by comparing the performance of both actuation technologies under quasi-static and fatigue loading conditions. The findings are supported by a gate-to-gate life cycle assessment (LCA), conducted to demonstrate the relative advantages of the two systems in terms of cost-effectiveness and environmental sustainability.
LCA is an analytical tool that captures the overall environmental impacts of a product, process or human activity from raw material acquisition, through the production and use phases, to waste management. This comprehensive view makes LCA unique in the suite of environmental management tools available to decision makers [19]. The LCA analysis highlighted the environmental advantages of employing a pneumatic actuation system, which become even more significant when TMs are applied.
2. Materials and Methods
Two experimental setups have been used for comparisons. The first one consists of a FPF25, a traditional servo-hydraulic UTM produced by ItalSigma srl (Forlì, Italy) which can perform both quasi-static and fatigue tests, exploiting a maximum force of 25 kN in tension-compression, with a maximum frequency reached of 20 Hz. The second one consists of an FFM, the patented prototype which has been described in the introduction.
Due to machines’ different dimensions, two geometries of specimens, both realized in polyammide-12 (PA12) manufactured by HP MultiJet Fusion Process [20] have been used to verify the independence of results on load waveform. The ASTM D638 type I specimens were used to evaluate performance on FPF25 (Figure 1a), while specimens designed according to Avanzini et al. [21] were used to test FFM’s performance (Figure 1b). In fact, producing smaller test specimens, especially when testing materials obtained through additive manufacturing, represents an advantage for companies. Specimens’ geometries are reported in Figure 1c,d, in which units are expressed in millimeters. Both specimens’ sets were manufactured in XY direction, which was demonstrated to be the one characterized by better fatigue behavior [22].
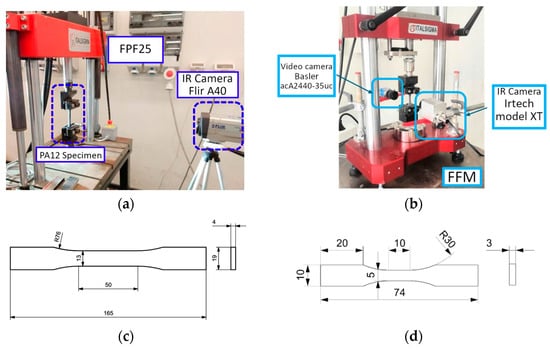
Figure 1.
(a) FPF25 setup; (b) FFM setup; (c) ASTM D638—Type I PA12 MJF specimen; (d) Smooth [21] PA12 MJF Specimen; Units expressed in millimeters.
Surface temperature measurements were performed using a FLIR A40 (Wilsonville, OR, USA) thermal camera for the tests carried out on the FPF25, and an IRtech (Milan, Italy) XT model thermal imaging camera for the tests performed on the FFM. The FLIR A40 is equipped with an FPA sensor offering a resolution of 320 × 240 pixels and a thermal sensitivity of 80 mK. The IRtech XT features an FPA detector with an optical resolution of 382 × 288 pixels, a thermal sensitivity of 80 mK, and operates at a frame rate of 27 Hz. Both cameras exhibit similar technical specifications, ensuring consistency and reliability in the thermal measurements. Temperature fields associated with quasi-static mechanical tests were acquired using a 10 fps framerate, while those related to fatigue tests were recorded by capturing one frame every 15 s.
Using oil as the working fluid requires a dedicated apparatus designed to reach and maintain the desired pressure, ensuring that its properties remain stable under operating conditions. For this reason, in addition to the servo-hydraulic actuator, a hydraulic power unit and a cooling system are also necessary, as it is shown in representative diagram in Figure 2a. In Figure 2b, the FFM’s system representative diagram consisting of the tensile machine mounting the pneumatic actuator, an air compressor and the control system, is shown. In both diagrams, the analog-digital connections and the information required by the control system (such as transducer measurements, oil temperature, and pressure settings) are represented by green arrows, which also represent the feedback signals used in the closed-loop calibration process. These signals are continuously transmitted to the control system, which compares them with reference values and adjusts the actuator command accordingly.
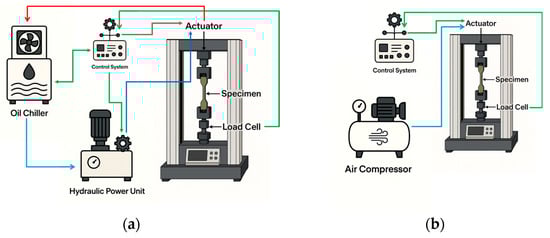
Figure 2.
(a) Representative diagram of the FPF25 (servo-hydraulic actuator); (b) Representative diagram of the FFM (pneumatic actuator).
The pressurized oil flow is indicated in blue. The hydraulic fluid used by the actuator is directed to the chiller (red arrow), where it is cooled before being recirculated into the pump (cyan arrow) to maintain the oil within an optimal temperature range, preventing viscosity changes that could affect dynamic response, control accuracy, and overall system efficiency.
Pneumatic actuator just requires pressured air to work, indicated by cyan arrow, and the air is discharged into the atmosphere without causing any safety or environmental problems.
After both systems have been described, LCA analysis can be carried out. A gate-to-gate approach was adopted [23], as the present study focuses solely on the usage phase of the testing systems within the material characterization process. In this context, the gates considered correspond to the entry to and exit from the laboratory. Consequently, this phase does not include analyses related to raw materials, transportation, manufacturing of the machines and devices, or end-of-life processes. The discussion is centered on four parameters, selected as the environmental impact indicator, namely: Climate Change, expressed in kilograms of CO2 equivalent (kg CO2 eq.) and representing the potential contribution of greenhouse gas emissions to global warming; Ozone Depletion, expressed in kilograms of CFC-11 equivalent (kg CFC-11 eq.) and describing the potential of emitted substances to degrade the stratospheric ozone layer; Particulate Matter Formation, quantified in terms of disease incidence and reflecting the health impacts associated with the formation of fine airborne particles; and Water Use, reported as cubic meters of world-equivalent water deprived (m3 world-eq deprived) and indicating the potential freshwater deprivation caused by water consumption [24,25,26]. These indicators allow for a comprehensive assessment of the potential environmental burdens associated with the system under study, capturing impacts on atmospheric emissions, human health, and resource consumption. The calculation of these parameters was carried out using OpenLCA software (version 2.3.0).
For the FPF25, the total absorbed power amounts to 14.7 kW, resulting from the combined consumption of the cooling system (7.2 kW) and the hydraulic power unit (7.5 kW).
For the FFM, a total power demand of 1.47 kW was considered, entirely attributable to the air compressor.
Specimens’ manufacturing process, based on the Multijet Fusion technology developed by HP [20], requires an energy consumption of 0.05 kWh for the powder-grinding stage and 27.4 kWh for the part-printing stage. The resulting values were calculated for 1 kg of material and subsequently normalized to the mass and number of specimens used in both configurations.
Quasi-static monotonic tensile tests have been performed in displacement control with a crosshead velocity of 2.4 mm/min, chosen after preliminary tests carried out to determine the best velocity to clearly observe the cooling phase in the surface temperature’s trend [22] during quasi-static tensile tests. By doing so, a displacement ramp was used as a reference. Percentage differences between the measured and the reference displacement (disp) has been evaluated as reported in Equation (1).
Fatigue tests were carried out by applying an increasing load to a single specimen, acquiring five complete periods characterized by a frequency of 1 Hz, to avoid excessive self-heating effect in polymers. Regarding the damping properties of PA12 under fatigue loading condition, it exhibits a linear behavior in the first loading cycles; then, when the material’s temperature reaches the glass transition value, the energy loss, as highlighted by the hysteresis loop, is more marked. This will lead to a decrease in the material stiffness. On the other hand, when the glass transition temperature is not reached, no stiffness reduction occurs [27]. Since with the FFM, we can monitor the material’s temperature during the fatigue tests, the frequency has been chosen to avoid the glass transition temperature of the material, maintaining a constant stiffness during the cycles.
Seven increasing stress levels have been applied to each specimen type on both testing machines according to what is reported in Table 1 to apply RTM [22]. Fatigue loads were characterized by a load ratio equal to 0.1 (R = 0.1). PID parameters were preliminarily tuned by manually changing the proportional, integral and derivative factors in order to ensure that the measured force respects maximum and minimum reference values.

Table 1.
Maximum stress and corresponding maximum force for FPF25 and FFM’s setups.
The signal used for harmonic analysis was obtained from the load cell of the testing machines and sampled at 100 Hz for 5 s at the end of each load step.
To increase the frequency resolution ( and enable the discrimination of closely spaced harmonics, the acquired signal was repeated ten times prior to the spectral analysis as indicated in Equation (2), in which is the sampling frequency and N is the total samples number. At a fixed sampling frequency, the frequency resolution Δf improves as the number of available samples increases. Repeating the signal effectively increases the total number of samples, thereby reducing and allowing for a more precise representation of the spectral components.
The transitions between consecutive 5 s segments were smoothed by applying a linear tapering at the segment boundaries. Specifically, the amplitude of the last few samples of each segment was gradually reduced to match the beginning of the next segment, creating a continuous signal without interruptions [28].
Fast Fourier transform (FFT) analysis was performed to evaluate the harmonic content of the fatigue load applied by the testing machine.
The amplitude of each harmonic component was estimated by applying the FFT algorithm to the time-domain signal, extracting the magnitude of the corresponding spectral coefficient and normalizing it by the total number of samples to obtain its true amplitude [29,30] as reported in Equation (3):
where is the signal value in time domain at sample index n and X[K] is the complex-valued spectral coefficient at frequency index k; n is the index in discrete time and is between 0 and N−1, as well as k, which is the index of discrete frequency.
The FFT of a real-valued signal returns both positive and negative frequency components. Therefore, the amplitude spectrum is computed as a single-sided spectrum by taking the absolute value of the coefficients and doubling the amplitudes of all positive frequency components, except for the zero-frequency component and, if present, the Nyquist frequency. This procedure ensures that the amplitudes of the harmonic components correspond to their actual peak values in the time-domain signal.
Each harmonic amplitude was then compared to that of the fundamental harmonic, thus quantifying the distortion and the relative contribution of higher-order harmonics to the overall load waveform. The performance of the actuators was evaluated by calculating the root mean square error (RMSE) and the total harmonic distortion (THD%) [31,32], respectively, using Equations (4) and (5).
where is the measured value, is the reference value and n is the number of observations.
where is the fundamental harmonic amplitude and is the h-th harmonic amplitude.
Both metrics provide insight into the quality of the actuator’s output waveform. RMSE quantifies the deviation of the measured signal from its reference signal, with values approaching zero indicating a close correspondence between the two. THD%, on the other hand, characterizes waveform distortion by expressing the ratio between the root of the sum of the squared amplitudes of all higher-order harmonics (starting from the second) and the amplitude of the fundamental harmonic. Highly distorted signals exhibit large THD% values, whereas an ideal sinusoidal waveform yields a THD% equal to zero [31]. It is worth noting that RMSE alone provides limited information on waveform quality, as signals exhibiting significant harmonic distortion may still produce low RMSE values with respect to the reference signal.
3. Results and Discussion
The performance of the actuators during the quasi-static tests was evaluated by calculating the percentage differences between the measured displacement and the reference ramp. In Figure 3a, it can be observed that FPF25 servo-hydraulic actuator’s crosshead displacement closely follows the reference ramp, as evidenced by the small percentage differences between the measured and reference displacements [33].
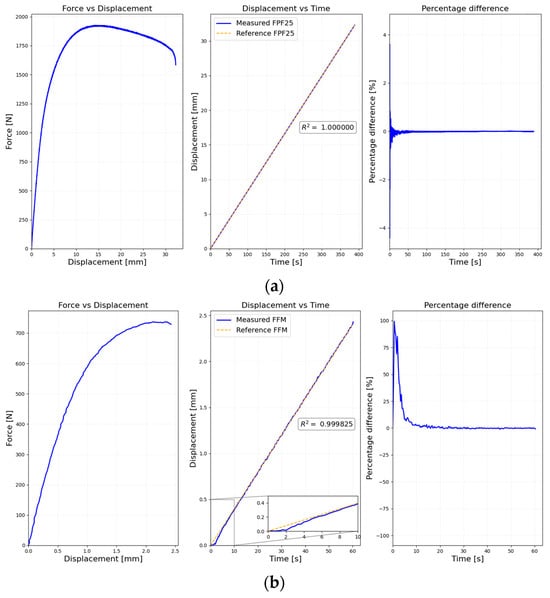
Figure 3.
(a) FPF25 performance during monotonic quasi-static tensile tests; (b) FFM performance during monotonic quasi-static tensile tests.
In the first graph, on the left, the force–displacement relationship is presented. The central graph shows that the measured displacement, represented by the continuous blue line, accurately tracks the reference ramp, indicated by the orange dashed line. In the last graph, it can be observed that the instantaneous measured value deviates by approximately 4% from the reference.
In Figure 3b, the curves obtained from the pneumatic actuator mounted on the FFM are presented in the same order as those of the FPF25. In the first graph on the left, the force–displacement trend exhibits a behavior similar to that of the servo-hydraulic actuator, except that no load reduction phase is observed, and failure occurs directly. In the central graph, it can be observed that the pneumatic actuator requires a longer time to reach equilibrium conditions, as indicated by the deviation between the measured displacement and the reference ramp at the beginning of the test [17] evidenced by the inset, which shows a magnification of 60% in width and 15% in height over the initial 10 s. This behavior is also evident in the last graph, where percentage differences of approximately 100% are calculated in this phase and last longer if compared to servo-hydraulics measured displacement. Such deviations are attributed to the compressibility of air [34,35], which also influences the resulting stress–strain curve. The ASTM D638 standard [36], which provides guidelines for quasi-static tensile testing of polymers, states that an initial settling phase may occur and suggests resolving it by simply extending the actual linear portion of the curve until it intersects the abscissa axis. It is also important to note that, due to the different specimen dimensions, the measured displacement at failure is higher for FPF25 specimens, as it can be observed in y-axis of central graph (Figure 3a), while the strain values obtained with both actuators remain consistent. Finally, the coefficient of determination, reported in both displacement vs. time graphs, approaching unity indicates that the measured displacement closely follows the reference ramp profile, despite the initial response delay.
The analysis began with the evaluation of the cyclic stress waveforms corresponding to each load level, applied to both specimen types using the FPF25 and FFM testing machines, according to the procedures detailed in Section 2.
FFT analysis was performed to assess whether the servo-hydraulic and pneumatic actuators could reproduce stress levels close to the imposed values [33,34]. During the PID control parameter setup, a preliminary visual inspection of the measured load trends highlighted clear differences between the two actuation systems [35]: while the servo-hydraulic actuator was able to deliver an approximately sinusoidal waveform within the prescribed upper and lower stress limits, the pneumatic actuator inevitably generated a distorted waveform. Nevertheless, priority was given to ensuring that the imposed maximum and minimum force values were effectively reached. The optimal P, I, D parameters combination resulted to be P = 0.23, I = 0.02 and D = 0. On the left side of Figure 4a, the last four sinusoidal load signals corresponding to the stress amplitude levels defined in the stepwise fatigue test conducted on a PA12 type I specimen with the FPF25 servo-hydraulic actuator are reported. The measured stress amplitude, calculated as half of the difference between the maximum and minimum stress values, was found to be consistent with the reference value, as no significant deviations were detected. On the right side of Figure 4a, the results of the FFT analysis for the same load levels are presented. In agreement with the high quality of the load waveform, as qualitatively observed from the time-domain graphs, no significant harmonic content was detected in the frequency domain. Accordingly, the calculated first harmonic amplitude was approximately equal to the stress amplitude previously determined. On the other hand, the pneumatic actuator produced a poorer cyclic load waveform, as previously discussed. Figure 4b presents the distorted load signals measured for the last four maximum stress levels. While no distortion was observed during the tensile phase of each cycle, the distortion was concentrated in the relaxation phase, where the load approached its minimum value. The distortion observed in the relaxation phase is attributable to the air properties and to the enforcement of minimum and maximum force constraints. Without PID tuning, the force signal during this phase would remain undistorted, but it would fail to track the reference values. Therefore, the distortion results from a controlled relaxation phase, which effectively manifests as a step-like relaxation. This phenomenon was confirmed by the FFT analysis, which revealed the presence of harmonic content in the frequency domain. Although the corresponding amplitudes were relatively small, they nonetheless affected the signal quality in the time domain. On the right side of Figure 4b, the harmonic amplitudes associated with frequencies up to 10 Hz are reported, as higher frequencies did not exhibit significant amplitudes. However, this does not imply that higher frequencies can be neglected, as they still contribute to the THD%. For this reason, the next discussions will focus on just the fundamental, the third and the fifth harmonics characteristics.
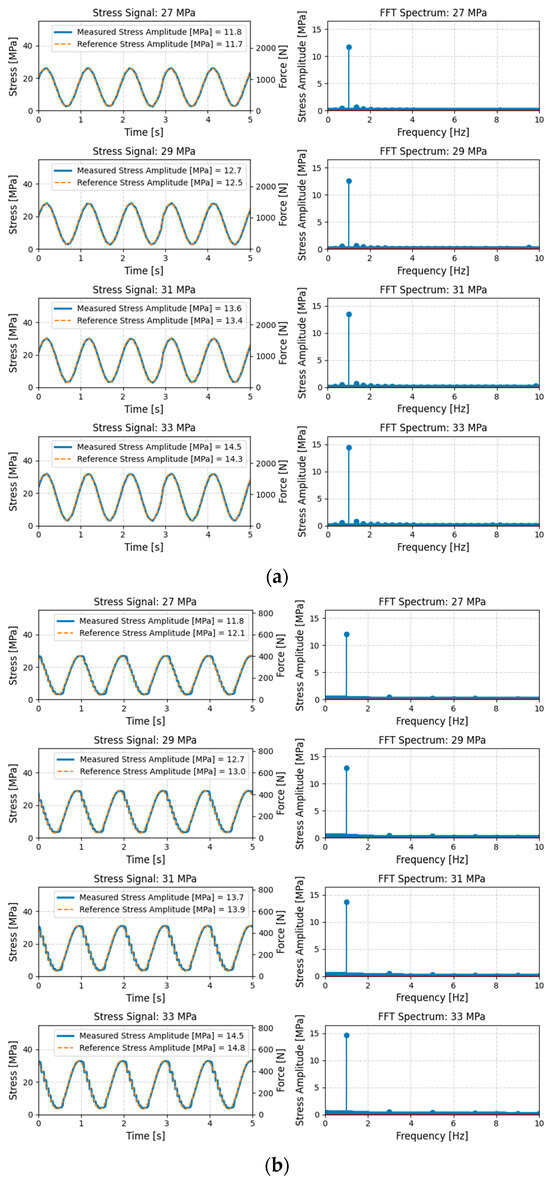
Figure 4.
FFT analysis results for FPF25 (a) and FFM (b).
Figure 5 reports the trends of the first (a), third (b), and fifth (c) harmonics as a function of the applied maximum stress. With regard to the first harmonic amplitude, it can be observed that the FPF25 and FFM provide similar results. Particular attention, however, should be paid to the lower load levels: despite the correct selection of control parameters, the pneumatic actuator applied a load higher than the reference value. This behavior can be addressed to the smaller force increment required to reach the target stress and to the pneumatic actuator’s highly nonlinear behavior due to factors like air compressibility and friction force [37]. Specifically, the force increment corresponding to a stress step for the FFM and its specimen is 30 N, whereas for the FPF25 it is 104 N.
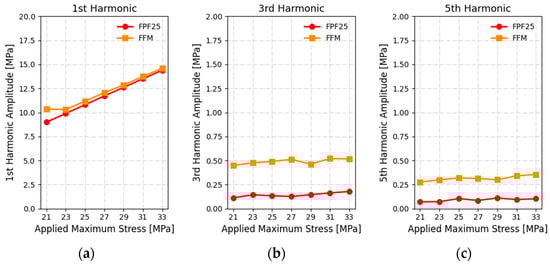
Figure 5.
(a) First; (b) Third; (c) Fifth harmonic amplitude versus applied maximum stress for FPF25 and FFM.
Regarding the third harmonic amplitude associated with each stress level, it can be observed that the stress signals measured with the FFM are characterized by higher third harmonic amplitudes, with a mean value of 0.49 ± 0.03 MPa, which is significantly greater than the mean value obtained with the FPF25 (0.14 ± 0.02 MPa). Nevertheless, the third harmonic amplitudes remain well below the fatigue limit of PA12, estimated to be equal to 26.2 MPa [22], and therefore do not represent a concern for the fatigue characterization. The same consideration applies to the fifth harmonic amplitude, as reported in the final graph, where a mean value of 0.32 ± 0.03 MPa was measured for the FFM and 0.09 ± 0.02 MPa for the FPF25. Detailed results are reported in Table 2, together with their average values and standard deviations.
Table 2.
First, third and fifth harmonics amplitude’s values.
Focusing on the THD% (Figure 6a), which accounts for the entire harmonic content except for the fundamental harmonic, it can be observed that the FPF25 exhibits an average THD% of 4.94 ± 0.22% across all load steps, while the FFM shows a higher value of 8.63 ± 0.85%. This difference is attributed to the characteristics of the working fluid. It is also noteworthy that the THD% of the FFM increases consistently with the applied maximum stress. In the RMSE graph (Figure 6b), it can be observed how increases with applied stress in both cases, highlighting how RMSE alone cannot entirely represent the actuator’s performance, since it encloses both amplitude and phase differences between measured and reference signals. An RMSE of 0.551 ± 0.115 MPa was obtained for FPF25, and 0.932 ± 0.078 MPa for FFM.
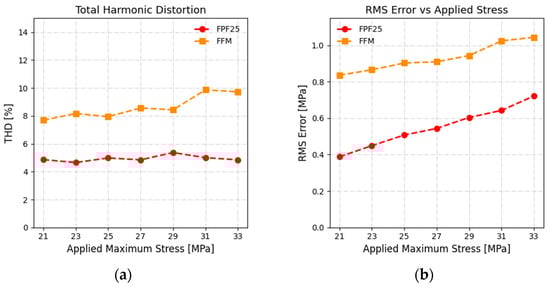
Figure 6.
(a) Percentage of total harmonic distortion for FPF25 (red circles) and FFM (orange squares); (b) Root mean square error for FPF25 (red circles) and FFM (orange squares).
Detailed results are enlisted in Table 3, together with their mean values and standard deviation for both testing machines.
Table 3.
THD% and RMSE results for FPF25 and FFM.
The LCA analysis, carried out using Italian low-voltage electricity mix, yielded significant results, as the simplicity of the pneumatic system had a clear effect on the environmental impact indicator, Climate Change, expressed in kilograms of equivalent CO2 gas emissions (kg CO2 eq.). The comparison showed that, for an equal operating time of 795 h, corresponding to the conventional fatigue testing campaign PA12 MJF specimens carried out by D’Andrea et al. [22] investigating nine stress levels, each represented by a dedicated specimen, even though additional constant-amplitude tests may be required, the servo-hydraulic actuation system resulted in a climate change impact of 4160 kg CO2 eq, whereas the FFM system, equipped with a pneumatic actuator, was characterized by an impact of only 416 kg CO2 eq. Regarding Ozone Depletion, the analysis confirmed the same trend: the servo-hydraulic system exhibited a substantially higher impact compared to the pneumatic solution, respectively, equal to 0.00441 and 0.00073 kg CFC-11 eq. Similar behavior was observed for Water Use. The FFM system, owing to its intrinsically lower power consumption, required significantly fewer water-related resources throughout the testing cycle, whereas the servo-hydraulic system showed a markedly higher water deprivation footprint, respectively, 2540 and 254 m3 world-eq deprived.
Finally, the indicator associated with Particulate Matter Formation, expressed in terms of disease incidence, further highlighted the environmental benefits of the pneumatic actuator leading to a considerably smaller impact on human health (0.31 disease incidence) if compared with the servo-hydraulic configuration (1.88 disease incidence). These results are primarily associated with the higher energy demand of the servo-hydraulic actuator, which amplifies the contribution of electricity-related emissions and impacts on environment and human health.
The sustainability advantage of the pneumatic actuation system, already evident under standard fatigue testing conditions, becomes even more pronounced when Thermographic Methods are employed, as these significantly reduce the total testing time to 84 h and the number of tested specimens to 6. In Figure 7 results discussed above are reported expressed as the percentage of the highest LCA parameters, corresponding to the ones associated with conventional fatigue characterization carried out by FPF25. The FFM approach, combined with TMs, demonstrated to be the most sustainable solution for both quasi-static and fatigue characterization of polymeric materials. Detailed results are reported in the table below.
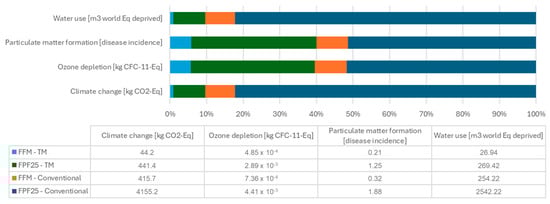
Figure 7.
Gate-to-gate LCA comparison between FPF25 and FFM testing systems on PA12 fatigue campaign.
4. Conclusions
Results demonstrated how servo-hydraulic and pneumatic actuators perform when used in material testing. Quasi-static mechanical tests, carried out to determine the technical properties of the materials, exhibited similar behavior. The test performed using a servo-hydraulic system under displacement control produced a typical force–displacement relationship for polymer materials. The system was characterized by a fast and accurate response and was able to follow the reference displacement ramp with a maximum deviation of 4% in the initial stage, in which both the specimen and the testing machine reached equilibrium related to the material load distribution, the control system stabilization, and the achievement of the desired oil pressure. Optimal results were obtained in terms of dynamic performance, as the measured fatigue load waveform was approximately sinusoidal, and the FFT analysis did not reveal any significant harmonic distortion and amplitudes. This is confirmed by the THD% analysis, which yielded a value of 4.94 ± 0.22%, remaining constant with increasing reference maximum stress. Conversely, the RMSE increased with the applied load, indicating linearly growing deviations between the measured and reference forces, because of combined distortion and negligible time delays. The complexity of FPF25′s testing system, which consists of the testing machine itself, the controller, the pressure station, and the cooling unit ensures high performance and allows for the performance of tensile and compression tests in every condition. On the other hand, the pneumatic actuator mounted in the FFM proved to be a valid alternative to hydraulic actuation. Despite the simplicity of its system, it provided performance levels adequate for the intended application. From the quasi-static point of view, the only issue observed was a delay in response to the reference displacement ramp, which resulted in a percentage difference of approximately 100% between the measured and reference signals. However, this deviation can be corrected in accordance with the ASTM D638 standard.
Fatigue load waveforms exhibited a low harmonic content dependent on the applied stress, as indicated by the FFT analysis, which provided information on the harmonic composition, described by the higher THD% values and the amplitudes of harmonics of orders greater than the fundamental. While the THD% increased with the applied load, reaching values of approximately 9% at the highest stress levels, the amplitudes of harmonics higher than the first remained much smaller than both the fundamental component and the material’s fatigue limit, confirming that preferring to reach maximum and minimum reference values maintaining the desired load ratio is more important than avoiding distortion in signal. RMSE calculation resulted in higher values than those calculated on FPF25, since it takes into account higher distortion and phase’s delay between measured and reference signals.
Both actuation systems produced fundamental amplitudes consistent with the imposed sinusoidal reference load signal, demonstrating that a pneumatic actuation system is suitable for the testing of polymer materials. With an appropriate air treatment setup, namely, a compressor with a higher volumetric flow rate, it would be possible to reach significantly higher frequencies while maintaining the same performance characteristics described in the present work.
The testing of polymer materials is particularly critical for this type of actuation, due to the high and prolonged elastic recovery typical of plastics.
While an applicable force of 2.5 kN is sufficient to test most polymers and to use specimens compliant with standard geometries, this is not feasible for metallic materials, whose yield and ultimate strengths are significantly higher. Consequently, performing static and fatigue characterization on metals would require specimens with very small cross-sectional areas, falling outside the standard requirements. For this reason, future design developments will focus on the use of a pneumatic actuator capable of applying higher forces.
The FFM proved to be a valid alternative to conventional testing machines equipped with servo-hydraulic actuation systems, whose purchase and operation still represent a considerable burden for companies and research institutions requiring both static and fatigue characterization of their materials. While operators must accept some compromises in terms of a response delay during static tests and signal distortion under dynamic loading, the advantages offered by the FFM system in terms of sustainability and operational simplicity are substantial. The advantages in terms of sustainability become even more significant when considering the use of Thermographic Methods, which can reduce the total testing time required for complete material characterization from 795 to 84 h, and consequently lower the energy consumption associated with the characterization process.
Author Contributions
Conceptualization, D.S. and G.R.; methodology, D.D. and D.S.; software, D.D.; validation, D.S. and G.R.; formal analysis, D.D.; investigation, D.D. and D.S.; resources, D.S. and G.R.; data curation, D.D. and D.S.; writing—original draft preparation, D.D.; writing—review and editing, D.S.; visualization, D.D.; supervision, D.S.; project administration, D.S. and G.R. All authors have read and agreed to the published version of the manuscript.
Funding
This research received no external funding.
Institutional Review Board Statement
Not applicable.
Informed Consent Statement
Not applicable.
Data Availability Statement
Dataset available on request from the authors.
Acknowledgments
The authors would thank Italsigma Srl for its support.
Conflicts of Interest
The authors declare no conflicts of interest.
References
- Hossein Sharghi, A.; Karami Mohammadi, R.; Farrokh, M.; Zolfagharysaravi, S. Feed-Forward Controlling of Servo-Hydraulic Actuators Utilizing a Least-Squares Support-Vector Machine. Actuators 2020, 9, 11. [Google Scholar] [CrossRef]
- Nandhakumar, R.; Venkatesan, K. A Process Parameters Review on Selective Laser Melting-Based Additive Manufacturing of Single and Multi-Material: Microstructure, Physical Properties, Tribological, and Surface Roughness. Mater. Today Commun. 2023, 35, 105538. [Google Scholar] [CrossRef]
- Moghanlou, M.R.; Azizian-Farsani, E.; Mahmoudi, A.; Khonsari, M.M. Accelerated Fatigue Characterization of Additively Manufactured Continuous Carbon Fiber Reinforced Thermoplastic: A Thermodynamic Approach. Compos. Part A Appl. Sci. Manuf. 2025, 192, 108805. [Google Scholar] [CrossRef]
- Zhang, L.; Jiang, B.; Zhang, P.; Yan, H.; Xu, X.; Liu, R.; Tang, J.; Ren, C. Methods for Fatigue-Life Estimation: A Review of the Current Status and Future Trends. Nanotechnol. Precis. Eng. 2023, 6, 025001. [Google Scholar] [CrossRef]
- Bae, J.S.; Oh, C.S.; Park, K.S.; Kim, S.K.; Lee, H.J. Development of a High Cycle Fatigue Testing System and Its Application to Thin Aluminum Film. Eng. Fract. Mech. 2008, 75, 4958–4964. [Google Scholar] [CrossRef]
- Kim, C.Y.; Song, J.H.; Lee, D.Y. Development of a Fatigue Testing System for Thin Films. Int. J. Fatigue 2009, 31, 736–742. [Google Scholar] [CrossRef]
- Tateishi, K.; Hanji, T. Low Cycle Fatigue Strength of Butt-Welded Steel Joint by Means of New Testing System with Image Technique. Int. J. Fatigue 2004, 26, 1349–1356. [Google Scholar] [CrossRef]
- Marques, J.M.E.; Benasciutti, D.; Niesłony, A.; Slavič, J. An Overview of Fatigue Testing Systems for Metals under Uniaxial and Multiaxial Random Loadings. Metals 2021, 11, 447. [Google Scholar] [CrossRef]
- Nikitin, A.; Bathias, C.; Palin-Luc, T. A New Piezoelectric Fatigue Testing Machine in Pure Torsion for Ultrasonic Gigacycle Fatigue Tests: Application to Forged and Extruded Titanium Alloys. Fatigue Fract. Eng. Mater. Struct. 2015, 38, 1294–1304. [Google Scholar] [CrossRef]
- Peng, W.; Zhang, Y.; Qiu, B.; Xue, H. A Brief Review of the Application and Problems in Ultrasonic Fatigue Testing. AASRI Procedia 2012, 2, 127–133. [Google Scholar] [CrossRef]
- Nicoletto, G. A Novel Test Method for the Fatigue Characterization of Metal Powder Bed Fused Alloys. Procedia Struct. Integr. 2017, 7, 67–74. [Google Scholar] [CrossRef]
- La Rosa, G.; Risitano, A. Thermographic Methodology for Rapid Determination of the Fatigue Limit of Materials and Mechanical Components. Int. J. Fatigue 2000, 22, 65–73. [Google Scholar] [CrossRef]
- Fargione, G.; Geraci, A.; La Rosa, G.; Risitano, A. Rapid Determination of the Fatigue Curve by the Thermographic Method. Int. J. Fatigue 2002, 24, 11–19. [Google Scholar] [CrossRef]
- Risitano, A.; Risitano, G. Determining Fatigue Limits with Thermal Analysis of Static Traction Tests. Fatigue Fract. Eng. Mater. Struct. 2013, 36, 631–639. [Google Scholar] [CrossRef]
- Corigliano, P.; Cucinotta, F.; Guglielmino, E.; Risitano, G.; Santonocito, D. Fatigue Assessment of a Marine Structural Steel and Comparison with Thermographic Method and Static Thermographic Method. Fatigue Fract. Eng. Mater. Struct. 2020, 43, 734–743. [Google Scholar] [CrossRef]
- Davis, S. Pneumatic Actuators. Actuators 2018, 7, 62. [Google Scholar] [CrossRef]
- Krause, J.; Bhounsule, P. A 3D Printed Linear Pneumatic Actuator for Position, Force and Impedance Control. Actuators 2018, 7, 24. [Google Scholar] [CrossRef]
- Lee, Y.B.; Park, J.W.; Lee, G.C. A Study on Failure Analysis and High Performance of Hydraulic Servo Actuator. Appl. Sci. 2020, 10, 7451. [Google Scholar] [CrossRef]
- Curran, M.A. Life Cycle Assessment: A Review of the Methodology and Its Application to Sustainability. Curr. Opin. Chem. Eng. 2013, 2, 273–277. [Google Scholar] [CrossRef]
- Khorasani, M.; MacDonald, E.; Downing, D.; Ghasemi, A.; Leary, M.; Dash, J.; Sharabian, E.; Almalki, A.; Brandt, M.; Bateman, S. Multi Jet Fusion (MJF) of Polymeric Components: A Review of Process, Properties and Opportunities. Addit. Manuf. 2024, 91, 104331. [Google Scholar] [CrossRef]
- Avanzini, A.; Battini, D.; Pandini, S. Static and Fatigue Behavior in Presence of Notches for Polyamide 12 (PA12) Additively Manufactured via Multi Jet FusionTM Process. Int. J. Fatigue 2022, 161, 106912. [Google Scholar] [CrossRef]
- D’Andrea, D.; Crisafulli, D.; Risitano, G.; Santonocito, D. Rapid Fatigue Life Evaluation over Time of PA12 Obtained by Multijet Fusion Printing Process. Int. J. Fatigue 2025, 200, 109124. [Google Scholar] [CrossRef]
- Hampo, C.C.; Akmar, A.B.; Majid, M.A.A. Life Cycle Assessment of an Electric Chiller Integrated with a Large District Cooling Plant. Sustainability 2021, 13, 389. [Google Scholar] [CrossRef]
- Halkes, R.T.; Hughes, A.; Wall, F.; Petavratzi, E.; Pell, R.; Lindsay, J.J. Life Cycle Assessment and Water Use Impacts of Lithium Production from Salar Deposits: Challenges and Opportunities. Resour. Conserv. Recycl. 2024, 207, 107554. [Google Scholar] [CrossRef]
- Notter, D.A. Life Cycle Impact Assessment Modeling for Particulate Matter: A New Approach Based on Physico-Chemical Particle Properties. Environ. Int. 2015, 82, 10–20. [Google Scholar] [CrossRef]
- van den Oever, A.E.M.; Puricelli, S.; Costa, D.; Thonemann, N.; Lavigne Philippot, M.; Messagie, M. Revisiting the Challenges of Ozone Depletion in Life Cycle Assessment. Clean. Environ. Syst. 2024, 13, 100196. [Google Scholar] [CrossRef]
- Van Hooreweder, B.; De Coninck, F.; Moens, D.; Boonen, R.; Sas, P. Microstructural Characterization of SLS-PA12 Specimens under Dynamic Tension/Compression Excitation. Polym. Test. 2010, 29, 319–326. [Google Scholar] [CrossRef]
- McKechan, D.J.A.; Robinson, C.; Sathyaprakash, B.S. A Tapering Window for Time-Domain Templates and Simulated Signals in the Detection of Gravitational Waves from Coalescing Compact Binaries. Class. Quantum Gravity 2010, 27, 084020. [Google Scholar] [CrossRef]
- Kallel, A.Y.; Hu, Z.; Kanoun, O. Comparative Study of AC Signal Analysis Methods for Impedance Spectroscopy Implementation in Embedded Systems. Appl. Sci. 2022, 12, 591. [Google Scholar] [CrossRef]
- Belega, D.; Petri, D.; Dallet, D. Accurate Amplitude and Phase Estimation of Noisy Sine-Waves via Two-Point Interpolated DTFT Algorithms. Measurement 2018, 127, 89–97. [Google Scholar] [CrossRef]
- Arranz-Gimon, A.; Zorita-Lamadrid, A.; Morinigo-Sotelo, D.; Duque-Perez, O. A Review of Total Harmonic Distortion Factors for the Measurement of Harmonic and Interharmonic Pollution in Modern Power Systems. Energies 2021, 14, 6467. [Google Scholar] [CrossRef]
- Yuce, E.; Minaei, S.; Tokat, S. Root-Mean-Square Measurement of Distinct Voltage Signals. IEEE Trans. Instrum. Meas. 2007, 56, 2782–2787. [Google Scholar] [CrossRef]
- Sahu, G.N.; Singh, S.; Singh, A.; Law, M. Static and Dynamic Characterization and Control of a High-Performance Electro-Hydraulic Actuator. Actuators 2020, 9, 46. [Google Scholar] [CrossRef]
- Sorli, M.; Gastaldi, L.; Codina, E.; De Las Heras, S. Dynamic Analysis of Pneumatic Actuators. Simul. Pract. Theory 1999, 7, 589–602. [Google Scholar] [CrossRef]
- Pustavrh, J.; Hočevar, M.; Podržaj, P.; Trajkovski, A.; Majdič, F. Comparison of Hydraulic, Pneumatic and Electric Linear Actuation Systems. Sci. Rep. 2023, 13, 20938. [Google Scholar] [CrossRef]
- ASTM D-638; Standard Test Method for Tensile Properties of Plastics. ASTM International: West Conshohocken, PA, USA, 1998.
- Rad, C.R.; Hancu, O. An Improved Nonlinear Modelling and Identification Methodology of a Servo-Pneumatic Actuating System with Complex Internal Design for High-Accuracy Motion Control Applications. Simul. Model Pract. Theory 2017, 75, 29–47. [Google Scholar] [CrossRef]
Disclaimer/Publisher’s Note: The statements, opinions and data contained in all publications are solely those of the individual author(s) and contributor(s) and not of MDPI and/or the editor(s). MDPI and/or the editor(s) disclaim responsibility for any injury to people or property resulting from any ideas, methods, instructions or products referred to in the content. |
© 2025 by the authors. Licensee MDPI, Basel, Switzerland. This article is an open access article distributed under the terms and conditions of the Creative Commons Attribution (CC BY) license (https://creativecommons.org/licenses/by/4.0/).