Article

Evidence for Establishing the Clinical Breakpoint of Cefquinome against Haemophilus Parasuis in China

1
National Reference Laboratory of Veterinary Drug Residues (HZAU), Wuhan 430000, China
2
MAO Key Laboratory for Detection of Veterinary Drug Residues, Huazhong Agricultural University, Wuhan 430000, China
3
MOA Laboratory for Risk Assessment of Quality and Safety of Livestock and Poultry Products, Huazhong Agricultural University, Wuhan 430000, China
*
Author to whom correspondence should be addressed.
Pathogens 2021, 10(2), 105; https://doi.org/10.3390/pathogens10020105
Submission received: 30 November 2020 / Revised: 5 January 2021 / Accepted: 5 January 2021 / Published: 22 January 2021

Abstract

:
Haemophilus parasuis can cause high morbidity and mortality in swine. Cefquinome possesses excellent antibacterial activity against pathogens causing diseases of the respiratory tract. This study aimed to establish the clinical breakpoint (CBP) of cefquinome against H. parasuis and to monitor the resistance change. Referring to the minimum inhibitory concentration (MIC) distribution of cefquinome against 131 H. parasuis isolates, the MIC50 and MIC90 were determined to be 0.125 and 1 μg/mL, respectively. And the epidemiological cutoff (ECOFF) value was 1 μg/mL. HPS42 was selected as a representative strain for the pharmacodynamic (PD) experiment, pharmacokinetic (PK) experiment and clinical experiments. The PK/PD index values, area under concentration-time curve (AUC)/MIC, of the bacteriostatic, bactericidal, and bacterial elimination effects were 23, 41, and 51 h, respectively. The PK/PD cutoff was calculated as 0.125 μg/mL by Monte Carlo simulation (MCS), and the clinical cutoff was 0.25−4 μg/mL by WindoW. Combing these three values, the CBP of cefquinome against H. parasuis was found to be 1 μg/mL. In conclusion, this was the first study to integrate various cutoffs to establish the CBP in the laboratory. It is helpful to distinguish wild type H. parasuis and reduce the probability of treatment failure.

1. Introduction

Extensive agricultural use of antibiotics poses a risk of increasing antimicrobial resistance [1], which has been one of the main public health burdens. For controlling and monitoring the emergence of isolates with reduced susceptibility to antimicrobials, the clinical breakpoints (CBPs) are required to be set [2,3].
CBPs are used to categorize the results of antibiotic susceptibility testing (AST) as susceptible, intermediate, or resistant [4]. The European Committee on AST (EUCAST) and Clinical and Laboratory Standards Institute (CLSI) have proposed three cut-off values to constitute CBPs as follows: (1) COWT, an epidemiological cut-off value (also known as ECOFF or ECV) which can differentiate the wild type (WT) from the non-wild strains; (2) Pharmacokinetic/Pharmacodynamic cutoff (PK/PDCO), a minimum inhibitory concentration (MIC) defined as PK/PD cut-off which is the highest MIC value for the most probable critical value (90%) in the target population with the calculated PK/PD index, such as AUC/MIC and T > MIC, where AUC is area under plasma concentration-time curve; and (3) COCL, a MIC value related to the clinical therapeutic outcomes which could result in a high likelihood of successful therapy. Integrated with ECOFF, PK/PDCO, and COCL, CBP could be ultimately determined by the characteristic procedures used in various organizations. VetCAST (Veterinary Antimicrobial Susceptibility Testing Subcommittee of EUCAST) and CLSI/VAST (Veterinary Antimicrobial Susceptibility Testing Subcommittee of CLSI) contributed to updating standardized CBPs processes and providing guidance and cases for researchers in the veterinary field.
Haemophilus parasuis is a commensal gram-negative bacterium of the upper respiratory tract. It can invade the body in particular disease conditions. It can induce Glässer’s disease in piglets characterized by fibrinous polyserositis, arthritis, and meningitis [5]. H. parasuis can interact with other viruses, such as porcine reproductive respiratory syndrome virus (PRRSv), to infect piglets, resulting in high morbidity and mortality and a great financial loss [6]. There are 15 serotypes and many non-typeable serotypes of H. parasuis and they play a variant role in virulence [7]. For the diversity of H. parasuis serovars, vaccines only provide partial protection. Therefore, antimicrobial therapy is the primary method to treat H. parasuis diseases [8].
Cefquinome (CEQ), a fourth-generation aminothiazole cephalosporin, is approved by the European Medicines Agency for the treatment of swine respiratory tract disease at a dose of 2 mg/kg [9]. Multiple reports have suggested that cefquinome exhibits high efficacy against pathogens present in the swine respiratory tract, such as Actinobacillus pleuropneumoniae (A. pleuropneumoniae) [10], Streptococcus suis (S. suis) [11], and H. parasuis [12]. Because of the advantages of its structure, cefquinome conforms outstanding stability to the beta-lactamase and exerts excellent antibacterial activity against gram-positive and gram-negative bacteria in vitro or in vivo antibacterial activity [13] The PK of cefquinome has been characterized by rapid absorption and elimination and limited distribution in healthy piglets [14]. With these characterizations, cefquinome could be used for the treatment of H. parasuis infection. To our knowledge, no study has established the accurate CBP of cefquinome against H. parasuis. Since the ways to denote the antimicrobial susceptibilities of H. parasuis are based upon the breakpoints against A. pleuropneumoniae according to CLSI, they inevitably lead to an error and even undermine the potent effect of cefquinome in the veterinary field [15]. It is necessary to establish the CBP to monitor the trend of resistance of H. parasuis.
Currently, various studies follow the guidelines of VetCAST and CLSI/VAST to estimate the breakpoints or ECOFF and PK/PD cutoff in veterinary applications. Toutain et al. adapted NLME and Monte Carlo simulation (MCS) to determine a MIC of 1 μg/mL as the PK/PD cutoff for the extensively used long-acting formulation of florfenicol for bovine respiratory disease (BRD) [16]. The result was similar to that of Lei et al., who derived the PK/PD cutoff of 1 μg/mL for florfenicol against S. suis in swine [17]. Additionally, Xiao has proposed a MIC of 0.06 μg/mL as the PK/PD cutoff for cefquinome against H. parasuis and analyzed other cutoffs [12]. The PK/PD cutoff could provide only some reference and gist, however, the accurate CBP need to combine the wild and clinical cutoffs. Schwarz summarized the available data for amoxicillin concerning PD, PK, clinical efficacy, and susceptibility to pathogens and proposed a CBP of amoxicillin against pathogens of the swine respiratory tract as follows: MIC <0.5 μg/mL, “susceptible”; MIC = 1 μg/mL, “intermediate”; and other MIC values, “resistant” [18]. CLSI has approved the CBP of florfenicol for BRD to be 2, 4, and 8 μg/mL, respectively, for “susceptible”, “intermediate” and “resistant” types [19]. However, COCL needs strict clinical conditions as a large number of animals are involved and the disease is only caused by the target pathogen. Therefore, few studies have investigated COCL under laboratory conditions and it was difficult to derive the accurate CBP without COCL. Recently, a new method to derive the COCL has been proposed by Turindge [20], aiming to solve the dilemma to determine the COCL of CEQ against H. parasuis.
In this study, we determined the MIC distribution of 131 H. parasuis isolates and integrated this with the results of a previous study to derive an ECOFF value. Then, we investigated the effect of cefquinome against H. parasuis using an ex vivo PK/PD model to derive the COPD by MCS. Next, we evaluated the clinical therapeutic outcomes of CEQ against H. parasuis disease from various MICs and adapted a novel algorithm to estimate the COCL. Finally, we attempted to establish the CBP of cefquinome against H. parasuis for monitoring the changing trend of resistance.

2. Results

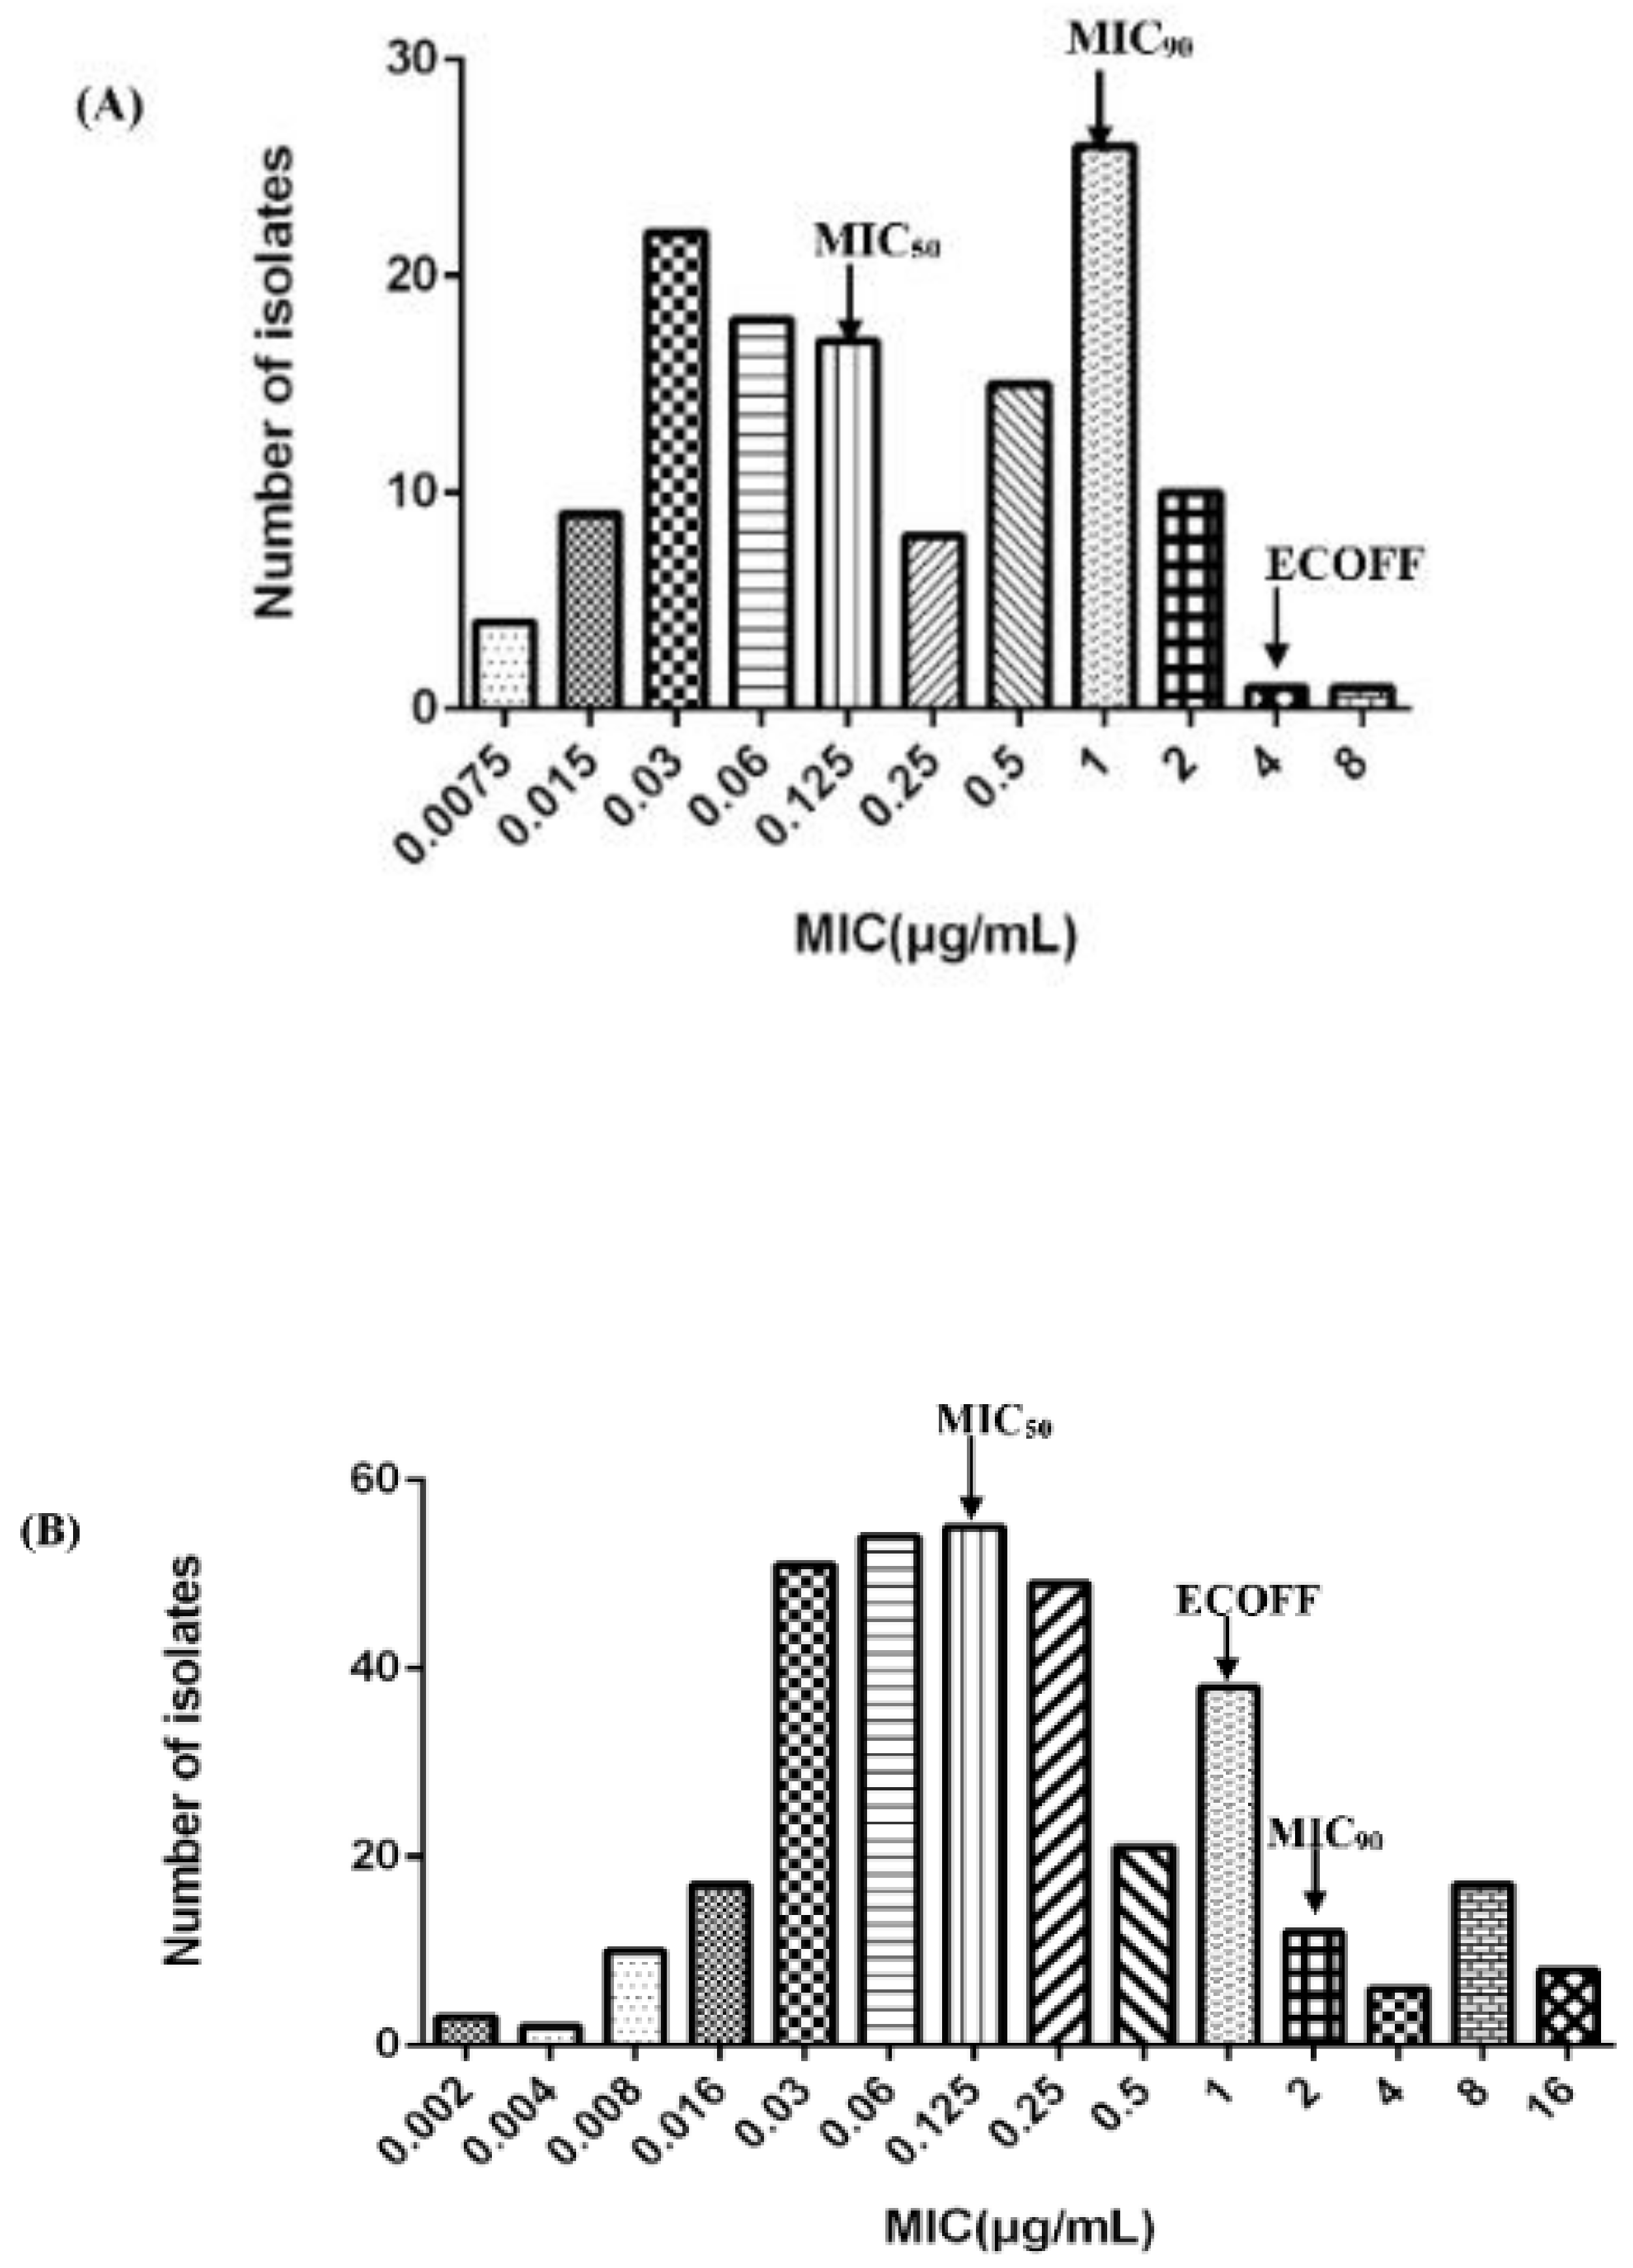
2.1. MIC Distribution of CEQ against H. parasuis and ECOFF Calculation

The MIC of 131 H. parasuis ranged from 0.0075 to 8 μg/mL, as can be seen in Figure 1A. The MIC50 and MIC90 values were calculated as 0.125 μg/mL and 1 μg/mL, respectively. The wild-type strains were statistically discriminated by the ECOFFinder based on Turnidge. Four different endpoints (95%, 97.5%, 99%, and 99.5%) were calculated as 4, 4, 8, and 16 μg/mL. Generally, the ECOFF should be set at least encompassing 95% wild-type strains and the ECOFF value of CEQ against H. parasuis was 4 μg/mL in this study. Previously, Xiao investigated the MIC distribution of cefquinome against 213 isolates of H. parasuis. We combined the results to obtain an expansive MIC distribution (Figure 1B). The MIC distribution of cefquinome against 344 H. parasuis was imputed into the software and the 95%, 97.5%, 99%, and 99.5% endpoints were calculated as 1, 2, 4, and 4 μg/mL, respectively. Conclusively, the ECOFF of CEQ against H. parasuis was 1 μg/mL.

2.2. Selection of Strains and MIC and MBC

Eight H. parasuis strains (serotype 5) were selected from MIC90 to evaluate the virulence by mice experiments (as Supplementary Materials shown). Because HPS42 possessed the strongest virulence with the obvious diseased symptoms, it was selected for the PD experiment. The MIC and MBC of cefquinome against HPS42 in TSB were 1 and 2 μg/mL and in serum were 0.5 and 1 μg/mL. The ratio of MBC/MIC was 2, which signified that cefquinome might have a strong bacteriostatic activity both in vitro and ex vivo. Furthermore, based on the broth: serum MIC ratios (1 μg/mL:0.5 μg/mL), the antibacterial effect of cefquinome against H. parasuis is similar in different mediums, which reveals no serum effect on the potency of cefquinome [21,22].

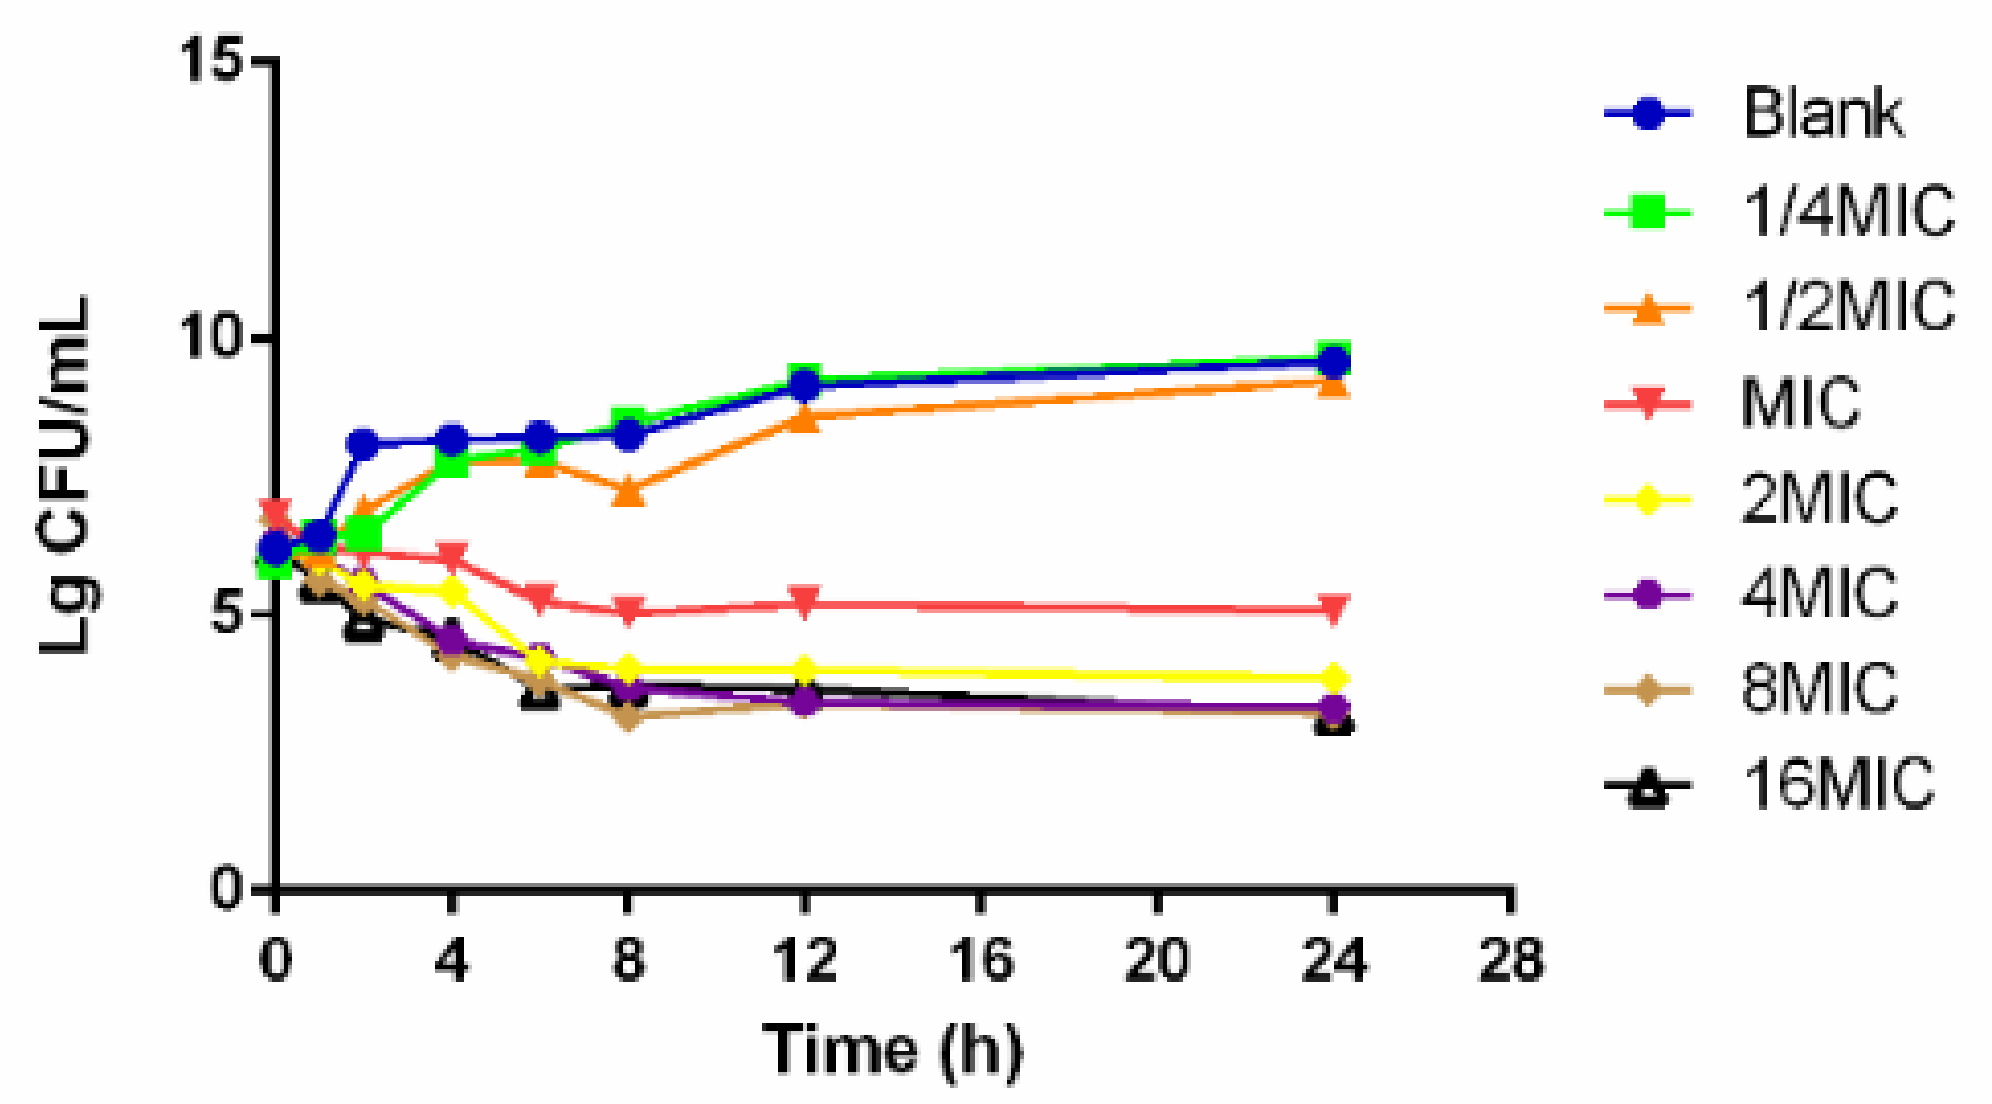
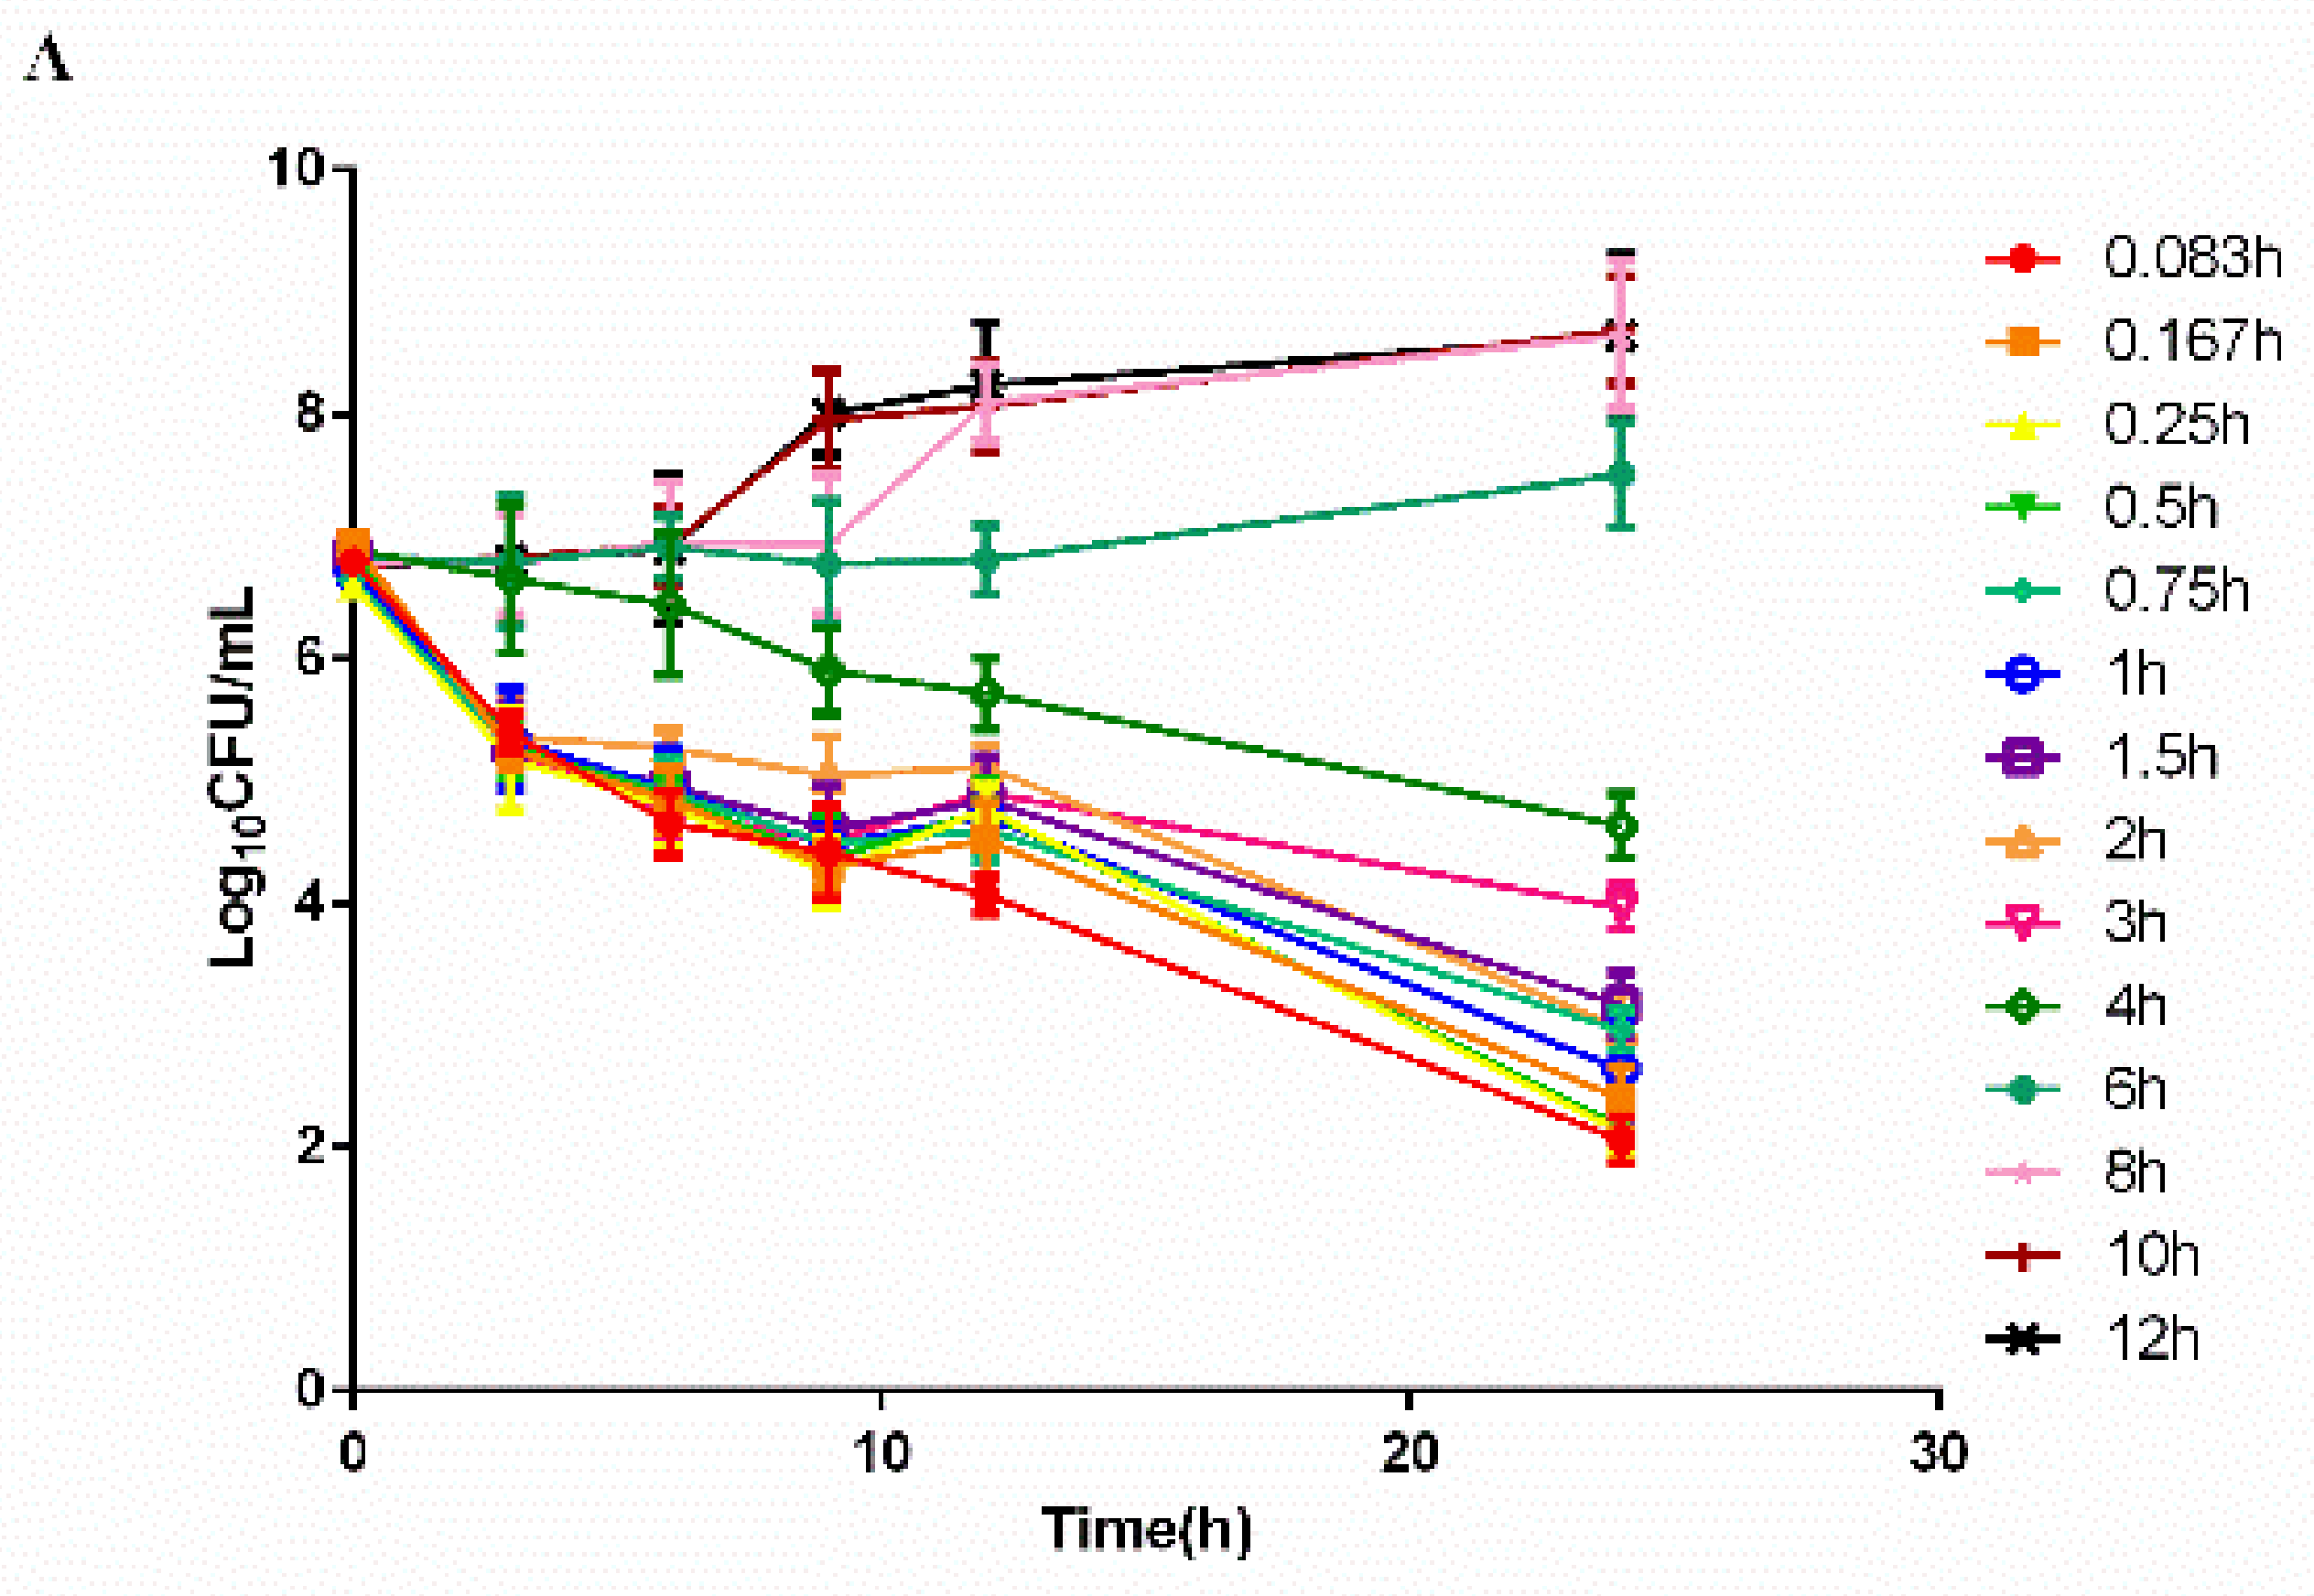
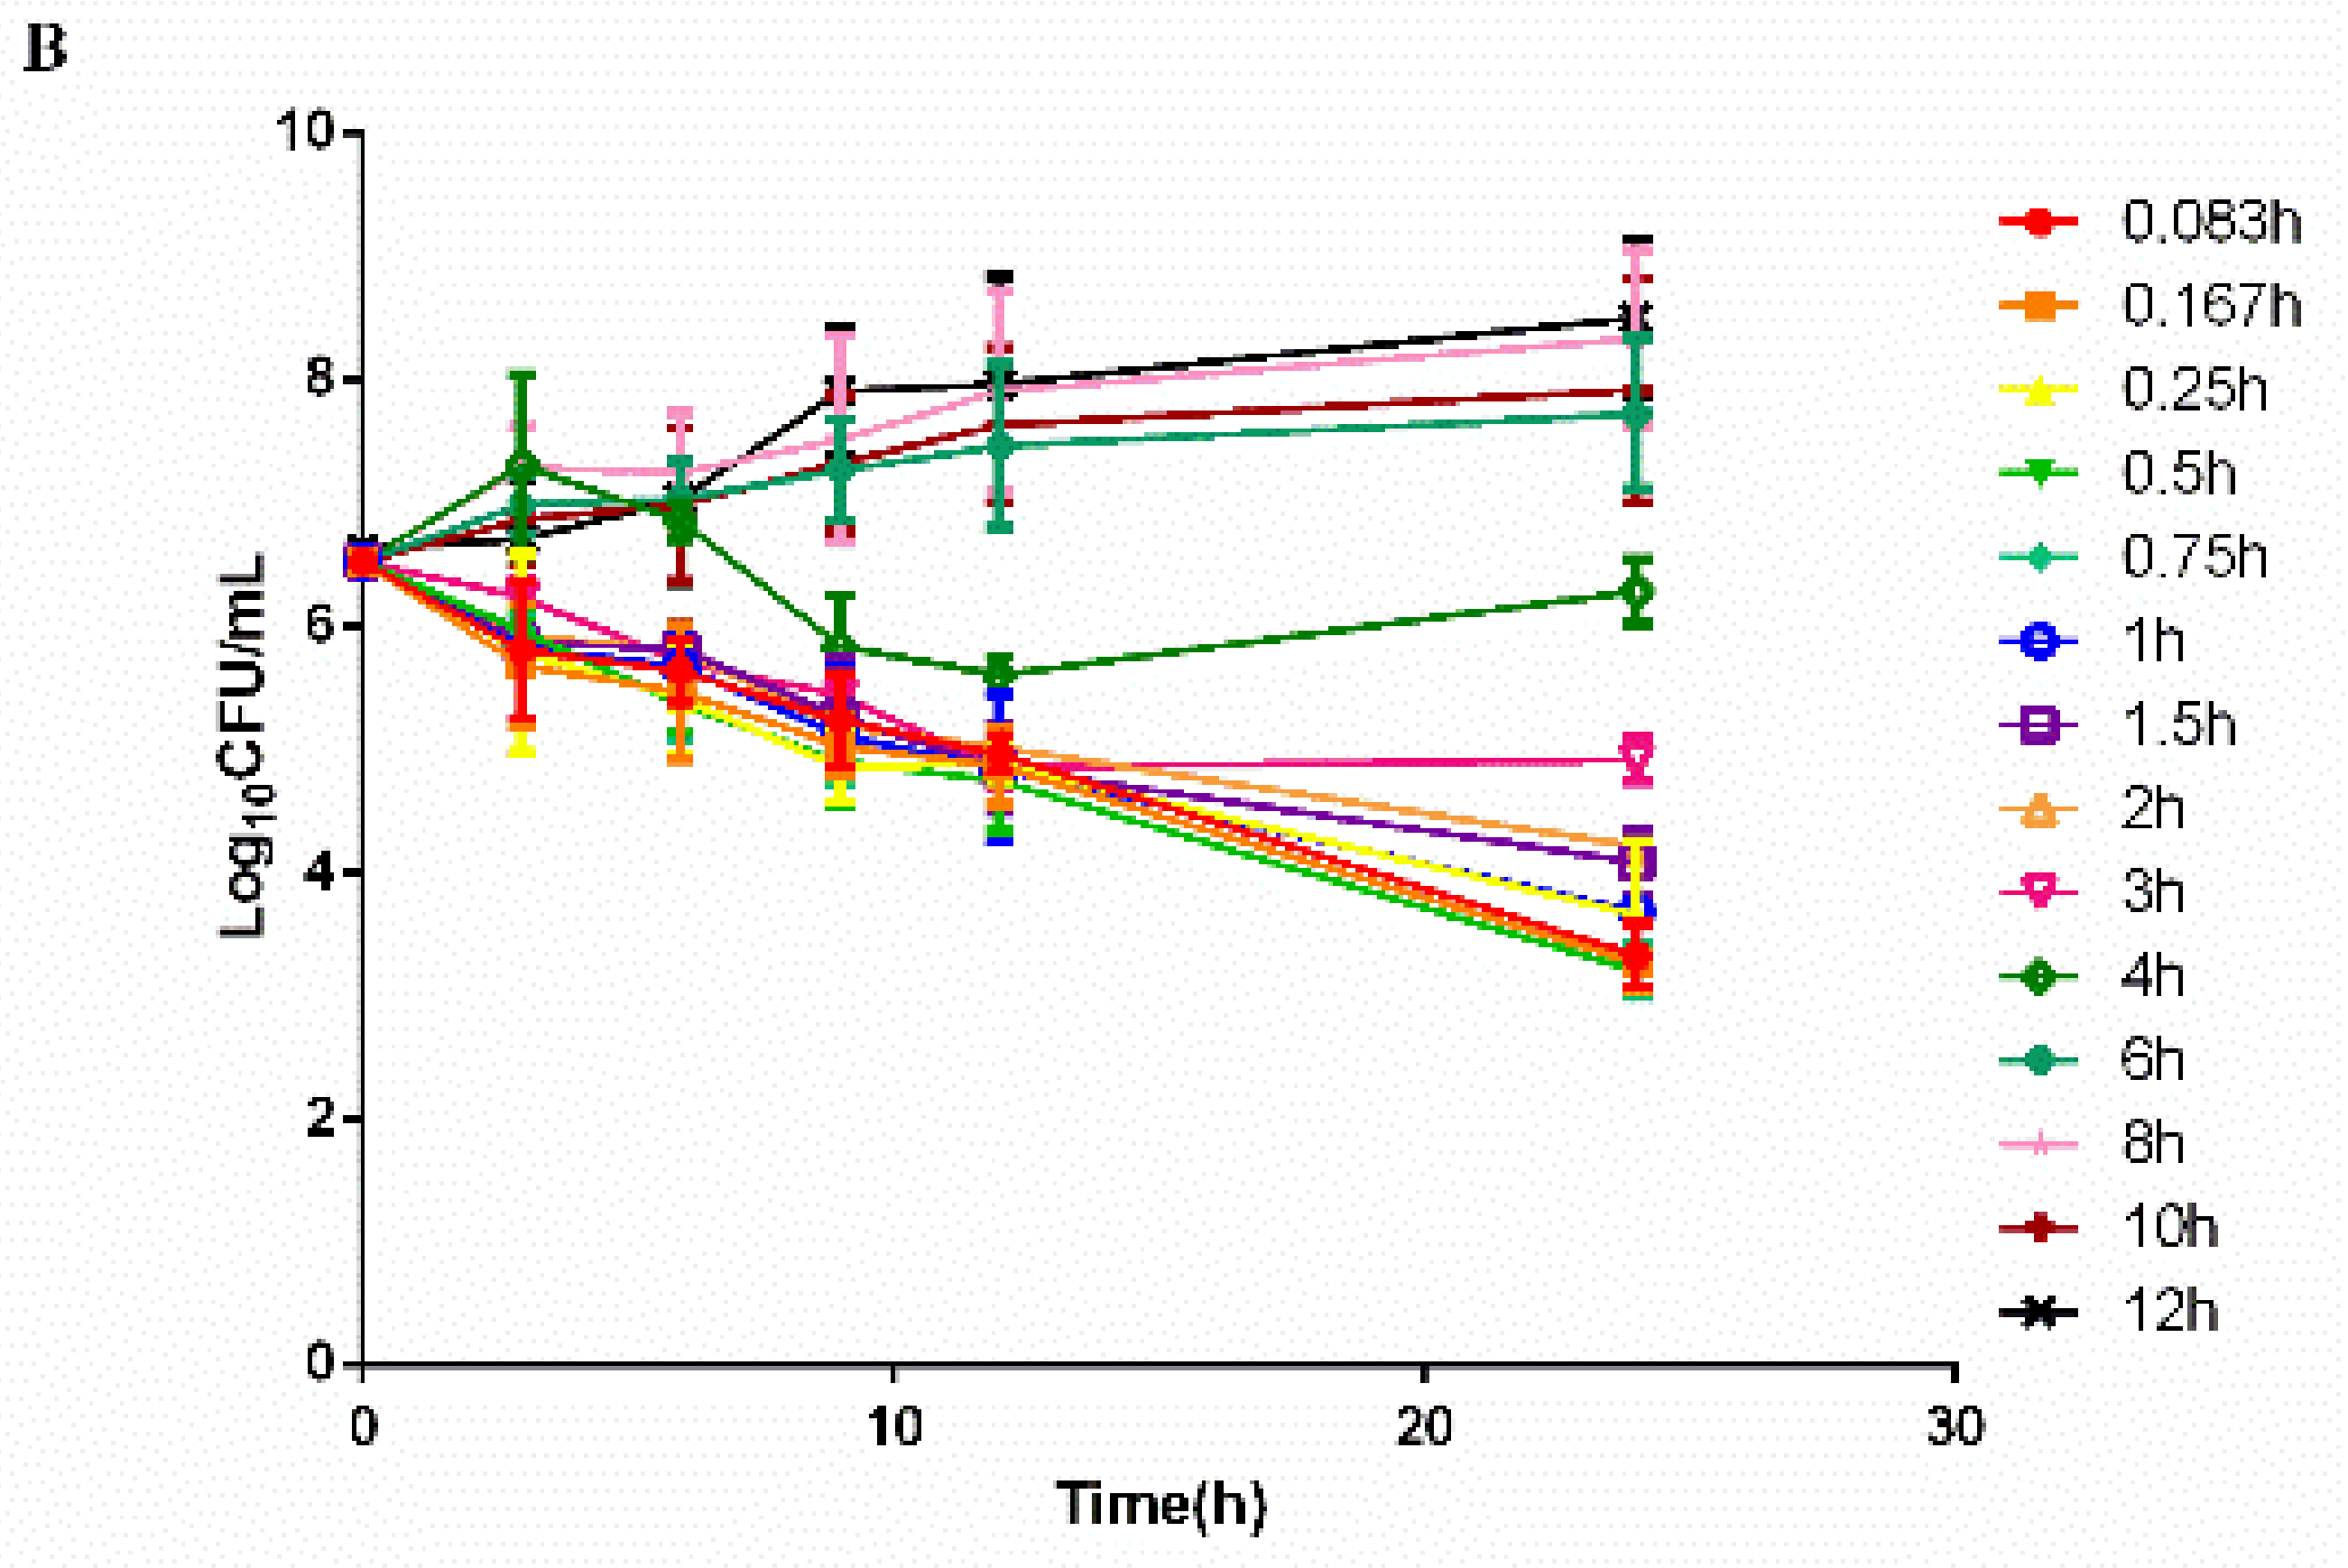
2.3. Time–Killing Curves

The time–killing curves of cefquinome against HPS42 in vitro and ex vivo are shown in Figure 2 and Figure 3. The curves showed a time-dependent antibiotic activity and the optimal bactericidal activity showed a threshold of approximately 4 × MIC. A further increase in the concentration resulted in a similar efficacy [23,24].

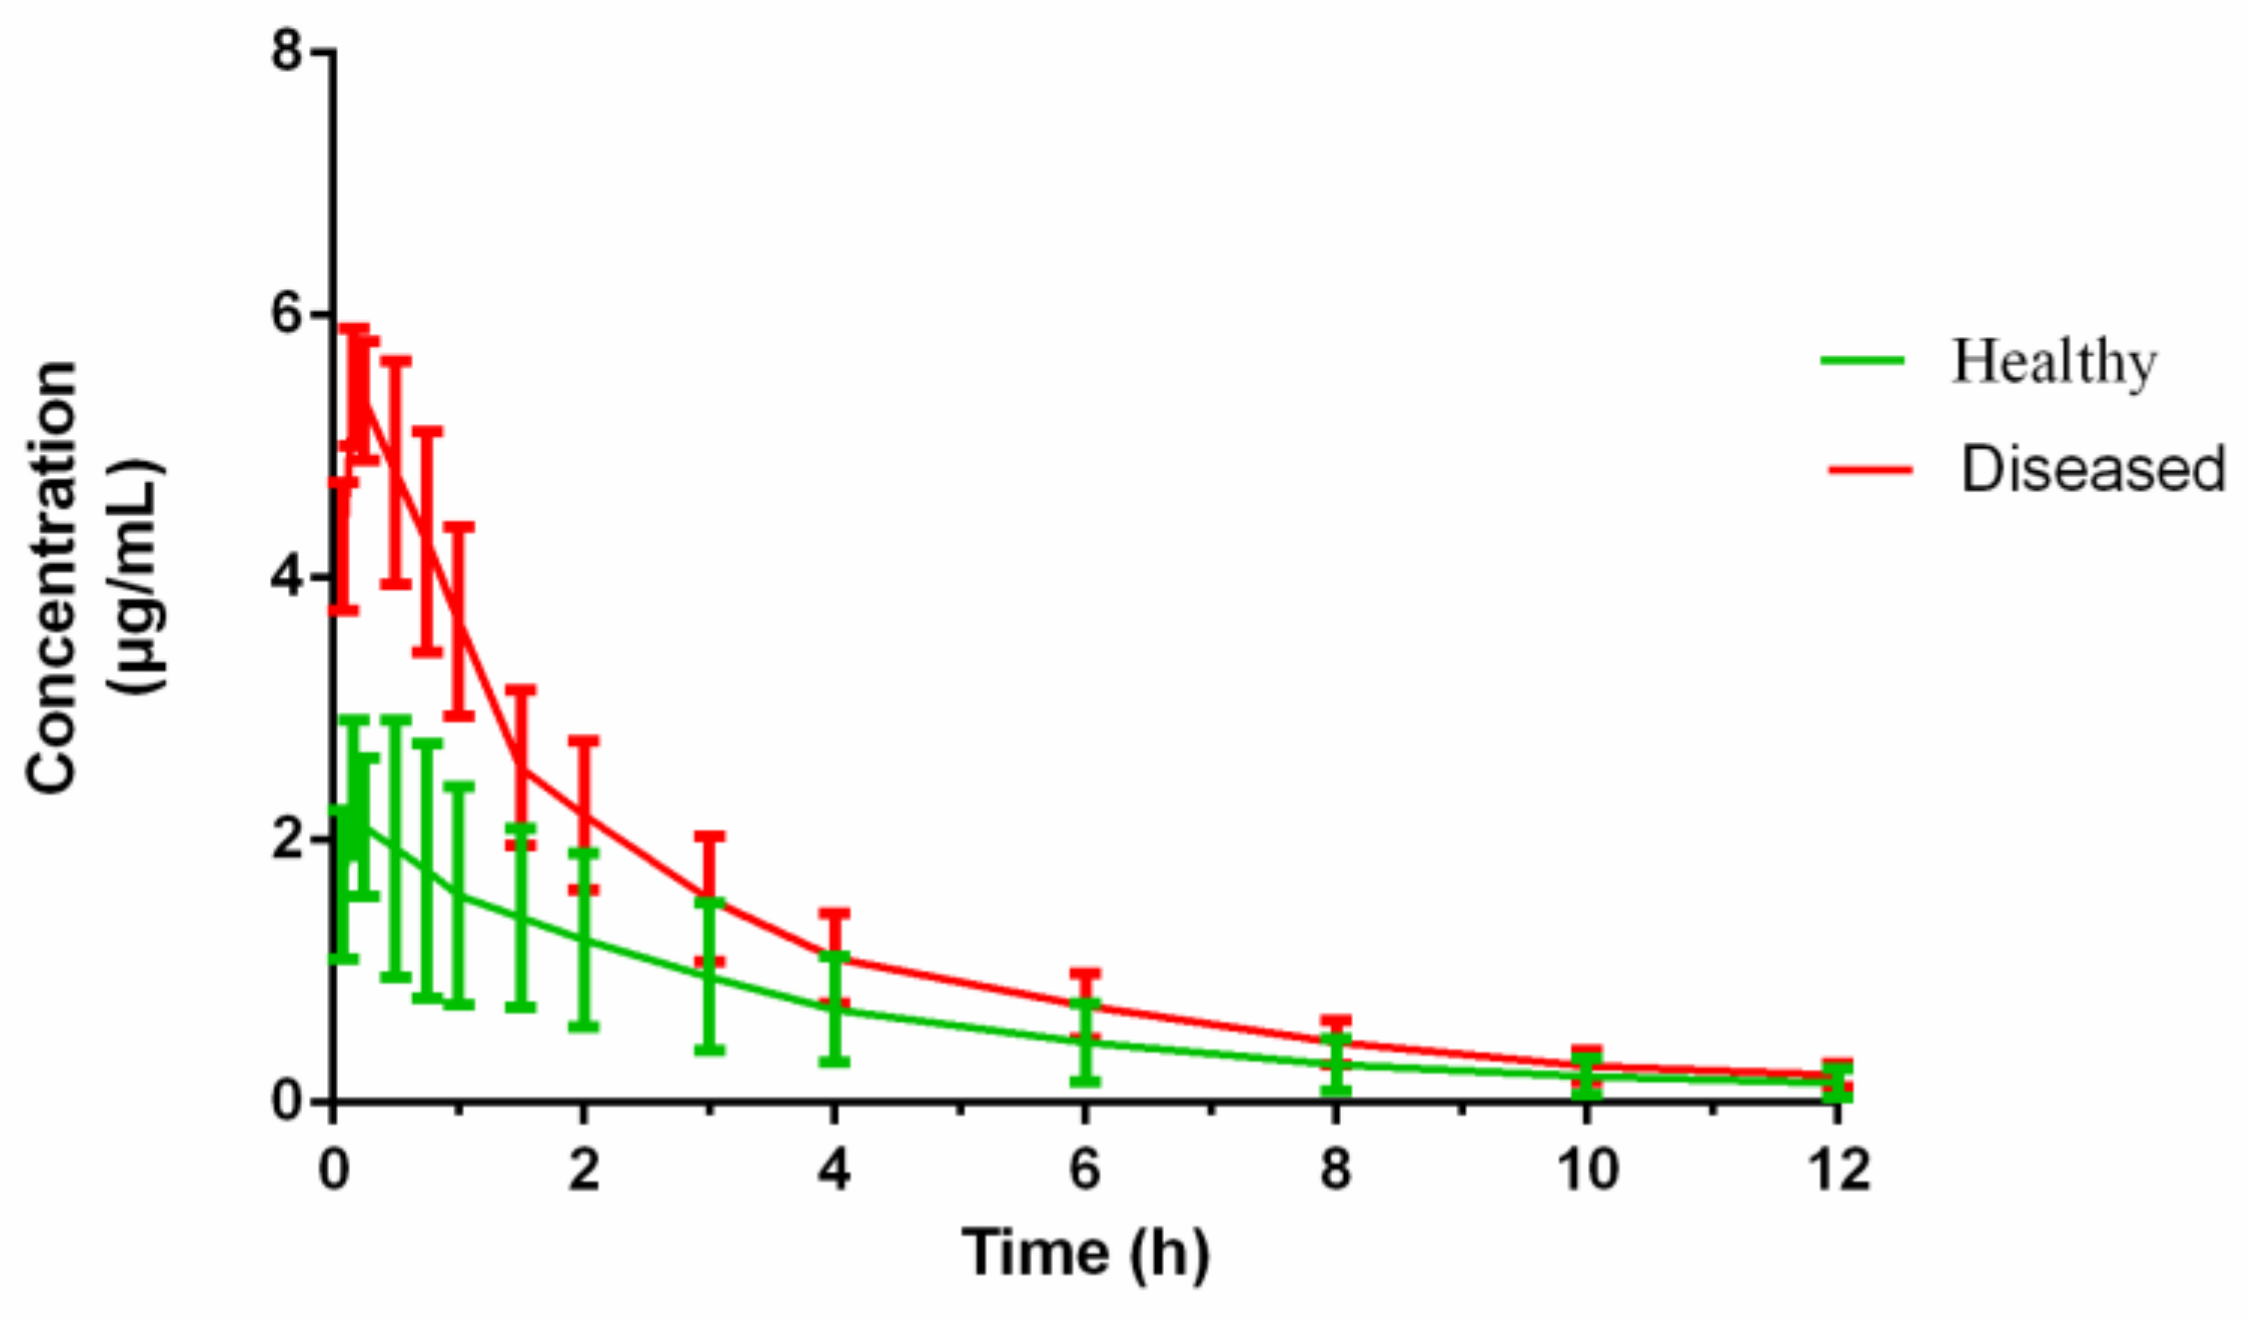
2.4. PK of Cefquinome

The pigs in the infected group did not manifest any adverse reactions before H. parasuis incubation. After 2 days of consecutive bacterial challenge, the pigs showed symptoms of fever and depression at 48 h. The concentration–time profiles of cefquinome in the serum of healthy and diseased pigs are shown in Figure 4 following administration of i.m. cefquinome (2 mg/kg).
The PK parameters of cefquinome in healthy and H. parasuis infected pigs, derived from non-compartmental analysis, are shown in Table 1. The PK parameters of cefquinome in the serum of healthy and diseased pigs were calculated by WinNonlin. Cefquinome was rapidly absorbed within 0.25 h from the injection site and reached the Cmax. The Cmax in the diseased pig was twice that in the healthy group. The AUC, T1/2, and MRT of cefquinome in the healthy and diseased pig sera were 8.61 ± 2.68 and 15.52 ± 4.07 h × μg/mL; 3.52 ± 0.81 and 3.19 ± 0.92 h; and 4.61 ± 0.68 and 3.59 ± 0.88 h, respectively.

2.5. PK/PD Integration and Analysis

The PK/PD parameters were determined from the integration with in vivo PK data and the ex vivo MIC values. The ratio of Cmax/MIC, AUC24/MIC, and T>MIC were 5.05, 17.21 h, and 5.25 h in healthy pigs, whereas these values were 11.49, 31.04 h, and 7.34 h in diseased pigs, respectively. The PK/PD parameters and AUC24/MIC fitted into the inhibitory sigmoid Emax model. Table 2 indicates the model parameters and various antibacterial effects.

2.6. PK/PD Cutoff Calculation of Cefquinome against HPS42

With the bactericidal effect, the target endpoint for the PK/PD index (AUC24 h/MIC) in serum is 41 h. The probability of target attainment (PTA) was calculated by different MIC values. The PTA was 90.41% at a concentration of 0.125 μg/mL with an increase in the MIC of cefquinome against H. parasuis, and it gradually declined to 0% at a concentration of 0.5 μg/mL. Consequently, the COPD of cefquinome against H. parasuis was calculated to be 0.125 μg/mL.

2.7. Determination of the COCL

One isolate H. parasuis should be selected from MIC50, MIC90, PK/PDco, ECOFF, and the highest MIC of the test population to infect swine, respectively. Due to PK/PDco = MIC50 = 0.125 μg/mL, MIC90 = ECOFF = 1 μg/mL, the sensitive strain (MIC = 0.25 μg/mL, HPS64) and the resistant strain (MIC = 4 μg/mL, HPS47) are selected for the clinical cutoff experiment. In addition, PK/PDco = MIC50 = 0.125 μg/mL (HPS80), MIC90 = ECOFF = 1 μg/mL (HPS42), and the highest MIC = 8 μg/mL (HPSL23) were also selected. By WindoW, the COCL is calculated objectively by a mathematical method. For treatment, each group was administered with intramuscular cefquinome (2 mg/kg). The WindoW approach consists of two separate algorithms, MaxDiff and CAR, to reduce the influence of subjectivity. Prior to the use of WindoW, some rules need to be followed. The CAR value cannot be set at the boundary and the estimation could be operated unless the experiment isolates are > 4 (n > 4), etc.
According to previous research [20], the MaxDiff value was calculated as 16.67 which corresponds to a MIC of 4 μg/mL, as well as the cumulative success rate (CAR) value 0.5 for a MIC of 0.125 μg/mL, although it could not be set as the boundary. Therefore, the COCL was defined from 0.25 to 4 μg/mL. The result of WindoW is shown in Table 3.

2.8. Establishment of CBP

The CBP of cefquinome against H. parasuis needs to refer to three values. Because of an ECOFF of 1 μg/mL, PK/PDCO of 0.125 μg/mL, and COCL of 0.25−4 μg/mL, we suggested setting the CBP of cefquinome against H. parasuis at 1 μg/mL.

3. Discussion

H. parasuis, the main pathogen causing respiratory tract diseases, is a serious threat to the survival of weaner pigs. With the use of antibiotics, the resistance of H. parasuis to antibiotics has gradually increased [25,26]. Cefquinome possesses excellent antibacterial activity for the initial treatment of H. parasuis infection. Therefore, to monitor the change in resistance and reduce the failure ratio of clinical treatment, establishing the CBP of cefquinome against H. parasuis is a top priority.
In China, the antibacterial susceptibility of cefquinome against H. parasuis has not changed much from 2015 to 2017. Xiao et al. determined the MIC of cefquinome against 213 isolates of H. parasuis and a MIC50 of 0.125 μg/mL was found, which is similar to the current result; however, fewer strains were tested in this study, and the MIC90 of 8 μg/mL varied from a MIC90 of 1 μg/mL [12]. In Brogden’s study, a MIC50 of ≤ 0.015 μg/mL and a MIC90 of 0.06 μg/mL of cefquinome against 123 isolates of H. parasuis were reported from Germany [27]. The reason for the different antimicrobial susceptibility results was because of the geographical differences that could be frequently found [28,29]. Meanwhile, the MIC determination method could also result in discrimination. As the method approved by CLSI for the determination of the MIC of H. parasuis was unavailable, Brogden adopted the microdilution broth method by CAMHB and the others used the agar dilution method by tryptose soya agar. In addition, the typical ECOFF needs more data, using the exact same method from multiple labs.
ECOFF does not correspond to the clinical therapeutic outcome but it can be a predictor of pathogen resistance to antibacterial when no breakpoint is established [30]. If the MIC derived from the antibacterial susceptibility test is above the ECOFF, the isolates will be non-wild, in which the clinician would consider administering other drugs. Numerous methods have been proposed to determine the ECOFF [31,32,33,34]. Meanwhile, Turinidge’s method [34] and Kronvall’s method [32] are universally recognized. In Kronvall’s method, normalized resistance interpretation (NRI) is used to define the WT population in the inhibition zone diameter histograms [35,36]. An algorithm is available on the website (http://www.bioscand.se/nri/). For minimum inhibitory concentration, ECOFFinder has been used to calculate the epidemiological cutoff value by Turinidge’s method, which could facilitate the computational process [37,38].
It has been proposed that EUCAST and CLSI use a minimum of 100 isolates for each bacterial species to derive the ECOFF, and additionally, at least 30 WT needs to be included to derive the ECOFF [16,39,40]. Few studies have reported the epidemiological cut-off values in veterinary and the ECOFF of tilmicosin against H. parasuis has been set at 16 μg/mL. Amoxicillin, as a widely used beta-lactam antibiotic, was determined the ECOFF to P. multocida and A. pleuropneumoniae in swine as 1 or 0.5 μg/mL by the visual method, which showed a reduced susceptibility as compared to Garch’s method [41,42]. In our study, we determined the MIC distribution of cefquinome against 131 isolates of H. parasuis and derived the ECOFF as 4 μg/mL. Furthermore, we combined our results with the published results and considered the geographical position and culture medium, by running the ECOFFinder; the ECOFF was determined to be 1 μg/mL.
A total of 131 H. parasuis were isolated and identified by PCR [43]. HPS42 is the most virulent strain with a MIC90 of 1 μg/mL of cefquinome against H. parasuis and was selected for further study. In some previous studies, the target strain of the tested population was irregularly selected and SH0165 is a popular selection that ignores the characterization of H. parasuis in the wild type [17,44]. In contrast, the most representative strain can be selected on a reliable basis by our method [38]. If cefquinome can effectively inhibit the most virulent strain from MIC90 of the population, the estimation of the PK/PD model will be much more valuable.
The first step to estimate the PK/PDCO is to determine the PK/PD index derived from the PK/PD model. The AUC/MIC, Cmax/MIC, and T>MIC were empirically used as the PK/PD index [45]. However, the variable values of the T>MIC vs. bacterial count could not be directly obtained from the ex vivo PK–PD model [14]. In this study, we used an inhibitory sigmoidal Emax model, and the PK/PD index (AUC/MIC) showed a favorable correlation (R2 = 0.9926) with the predicted antibacterial efficacy. This indicated AUC/MIC could be the optimal PK/PD index for PK/PD integration model. Some published articles have employed AUC/MIC as a PK/PD index for cefquinome [14,24]. Florfenicol is classified as a time dependent drug; however, AUC/MIC has often been proposed as an optimal PK/PD index that is predictive of clinical efficacy [17,46]. A semi-mechanistic PK/PD model of florfenicol against P. multocida and M. haemolytica was applied in in silico simulations to predict AUC/MIC, and outperformed T> MIC as the PK/PD index [47]. Due to its ethical and economic advantages, a semi-mechanistic PK/PD model could have a wider application in veterinary science [4,16].
In the next step, by Monte-Carlo simulation, the conservative value (AUC/MIC = 41 h) was selected to calculate the PTA. When the MIC was 0.125 μg/mL and the PTA was 90.41%, the value was reduced to <90% by increasing the MIC. Xiao reported a PK/PDCO value of 0.06 μg/mL of cefquinome against H. parasuis [12] which is similar to the current PK/PDCO value of 0.125 μg/mL. Of note, the PK/PDCO value (0.125 μg/mL) was less than the COWT value (1 μg/mL), which was probably due to unknown resistance mechanisms or a lower dose of drug administered to pigs. Moreover, a PK/PDCO of 0.125 μg/mL of cefquinome against H. parasuis was much lower than those of tilmicosin (1 μg/mL) [44] and marbofloxacin (0.5 μg/mL) [48], implying more clinical potency of cefquinome than other antibacterials against H. parasuis.
Beta-lactam antibiotics, including penicillins, cephalosporins and carbapenems, are widely used in veterinary clinics. The production of beta-lactamase is one of the major resistance mechanisms in gram-negative bacteria. β-Lactam resistance in H. parasuis is related to plasmid pB1000, which bears the blaROB-1 β-lactamase [49]. Moreover, biofilm has been associated with resistance to β-lactams in H. parasuis [50]. The MecA gene or the CTX-M gene is considered to positively influence the susceptibility of cefquinome against staphylococcus aureus and escherichia coli, respectively [51,52].
It is acceptable to integrate the results of ECOFF, PK/PDCO, and COCL to establish the CBP. Some difficulties hinder the establishment of COCL; for instance, in practice it is very difficult to distinguish between curable and non-curable diseases solely based on the MIC and find adequate cases infected with the non-wild-type strains. Besides, many random factors affect treatment outcomes, and hence, it is hard to find the relationship between MIC and clinical outcomes for COCL. The clinical cutoff, COCL, can minimize the risk of treatment failures; however, no veterinary case has demonstrated the relationship between the MIC of antibiotics against the target pathogen and the cure rate [4]. Due to the absence of COCL by the standard method, we adopted a less commonly used method to determine the clinical cutoff under laboratory conditions. WindoW, a new approach described to calculate COCL by Turnidge [20], integrates two separate algorithms, MaxDiff and CAR, and recognizes the potential presence of microbial distributions which have clinical relevance. A COCL value of 0.25−4 μg/mL can be calculated by WindoW. For the first time, we used WindoW to establish COCL in the veterinary context in order to provide a reference. Combined with clinical outcomes, CBP is more representative and accurate in monitoring resistance.
The CBP involves comparison among ECOFF, PK/PD cutoff, and clinical cutoff. EUCAST proposed a method that only includes ECOFF and PK/PD breakpoint except for the clinical cutoff. Aside from integrating the conceptual framework of the PK/PD vs. clinical outcome relationship, they did not describe and use clinical cutoff [4]. Following the method to establish the breakpoint, if the PK/PD breakpoint is higher or equal to ECOFF, the PK/PD breakpoint could be selected as the CBP; otherwise, ECOFFs could be recommended. CLSI demands three cutoffs to establish the breakpoint, and remarkably, for the PK/PD cutoff, they used the PK data to meet the PK/PD targets [19]. Recently, Papich et al. followed the documents to determine the CBP of cephalexin against Staphylococcus pseudintermedius in dogs. Firstly, they determined the MIC distribution, and secondly, they used the PK data to ensure that the dosage was effective. Finally, by Monte-Carlo simulations, they derived the breakpoints of ≤2 µg/mL (susceptible), 4 µg/mL (intermediate), and ≥8 µg/mL (resistant) [53].
We derive ECOFF = 1µg/mL, PK/PDco = 0.125 µg/mL and COCL = 0.25−4 μg/mL. However, there is no guideline to follow when the COCL is not an exactly MIC value. VetCAST recommends ECOFF as a surrogate when the CBP is not established [4]. As Lei reports [38], while ECOFF > PK/PDco, ECOFF also plays an important role in establishing the CBP. For our study, ECOFF is within the range of COCL and PK/PDco is out of it. Considerable for the importance of ECOFF, we establish the CBP as 1 µg/mL. Compared to the published breakpoint, our formulated CBP is equal to ampicillin, ceftibuten, and doxycycline against Haemophilus influenzae in humans [54]. It is higher than amoxicillin (0.5 µg/mL) [18] and lower than tildipirosin (4 µg/mL) [38] for swine respiratory tract pathogens.
There are some limitations in our manuscript. We preliminarily proposed ECOFF, PK/PDco and COCL, respectively. Based on the current results, the CBP of cefquinome against H. parasuis is advised to be 1 μg/mL. For an ultimate CBP, more results of the CBP and cutoffs from other institutions are needed. Furthermore, the results of clinical therapy experiments in the wild need to be gathered to narrow the range of COCL. In our study, an ECOFF of 1 µg/mL, PK/PDco of 0.125 µg/mL, and COCL of 0.25−4 μg/mL were determined. We estimated the CBP of cefquinome against H. parasuis (1 μg/mL), which referred to ECOFF PK/PDco and COCL. This result will supply some evidence for the further study of the establishment of clinical breakpoint in laboratory conditions.

4. Materials and Methods

4.1. Animals

Thirty-six six-week-old crossbred (Duroc × Large White × Landrace) pigs (weighing 15–20 kg) were purchased from the Livestock and Poultry Breeding Centre of Hubei Province (Wuhan, China). Before the experiment, all pigs were raised for 7 days to get acclimatized and were not allowed to take any antibiotics. The diseased model was followed from the study of Zhang where pigs were inoculated with 109 CFU/mL of H. parasuis (1−2 mL) in each nostril four times on two consecutive days [55]. After experiment, cefquinome was administrated by intramuscular injection to diseased swine at a dose of 2mg/kg/24h for 3 days. Through etiological surveillance and clinical symptoms observation for seven days, healthy swine were returned to the farm. Diseased swine were euthanized. All efforts were used to reduce the pain and adverse effect of the animals.
Seventy-five six-week-old female BALB/c mice (specific pathogen free grand; bodyweight of 18 ± 2 g) were obtained from the Center of Experimental Animal of Hubei and housed in the SPF animal room in the laboratory. The research was approved by the Ethics Committee of the Faculty of Veterinary Medicine of the Huazhong Agricultural University. All animal experiments were conducted according to the committee guidelines for the Laboratory Animal Use and Care Committee in Hubei Science and Technology Agency. All efforts were used to reduce the pain and adverse effect of the animals. After the experiments, all mice were euthanized.

4.2. Strains and Antibiotic

A total of 131 H. parasuis strains stored at −80 °C in milk were used to determine the MIC of cefquinome by agar dilution (Dr. Ehrenstorfer Standards, Augsburg, Germany) at the National Reference Laboratory of Veterinary Drug Residues and State Key Laboratory for Detection of Veterinary Drug Residues at Huazhong Agricultural University. A. pleuropneumoniae (ATCC 27090) was used as the quality control strain (QC). Tryptone soya agar (TSA) and Tryptone soya broth (TSB), supplemented with 5% fetal calf serum and 1% nicotinamide adenine dinucleotide (NAD, 10 μg/mL), were used to culture H. parasuis.

4.3. MIC Distribution and ECOFF Determination

The antibacterial susceptibility testing was performed by the agar dilution method based on CLSI [56]. H. parasuis were inoculated onto TSA plates containing cefquinome (0.0075−8 μg/mL) by serial twofold dilutions. The plates were incubated at 37 °C in an atmosphere containing 5% CO2 for 36 h. The MIC contained a minimum amount of cefquinome where the visible growth of bacteria was inhibited. The values of MIC50 and MIC90 in the test population were calculated by SPSS version 19.0.
The ECOFF value was described as the upper limit of the wild population which comprised 95% strains of the MIC distribution. A conventional statistical method has been proposed by Turnidge [56]. Briefly, the WT distribution was checked for normality by SigmaStat software, and nonlinear regression was performed to calculate the mean and standard deviation by GraphPad Prism. Finally, the NORMINV and NORDIST functions of Microsoft Excel were applied to set the ECOFF. Additionally, the ECOFFinder program, based on the above method, was used to simplify the statistical method and calculate the ECOFF. It can be found on the website (http://www.eucast.org/mic_distributions_and_ecoffs/).

4.4. Selection of the Virulent Strains

The Balb/c mice model was used as an alternative model to evaluate the virulence of H. parasuis in pigs [57]. Seventy-five female mice were divided into one control group (n = 3) and eight infection groups (n = 72) challenged by different H. parasuis (serovar 5) chosen from MIC90. Each infection group was intraperitoneally administrated for three infection doses (107, 108, and 109 CFU/mL with 0.5 mL). Three mice were infected with each dose for an infection group. The control group was challenged by 0.5 mL of PBS. During 72 h after infection, the number of deaths among mice was monitored and the organs were observed after anatomy to evaluate the most virulent strain from MIC90 selecting for PD experiment.

4.5. Pharmacodynamics Experiments

4.5.1. Determination of MIC and MBC

The MIC of cefquinome against HPS42 was determined with serial two-fold dilution by broth microdilution technique following the guidelines of the CLSI at serial concentrations between 8 and 0.0075 μg/mL. For the MBC of cefquinome against HPS42, 100 µL of suspension from the 96 well plates of CEQ were diluted with TSB by 1:10 steps and 10 µL was spread on TSA agar plates for the colony-forming unit (CFU) counting and incubated at 37 °C with 5% CO2 for 24 h. The MBC was the minimum concentration of cefquinome inhibiting 99.9% of the bacterial density.

4.5.2. Time–Killing Curves In Vitro and Ex Vivo

The bacteria (106 CFU/mL) were cultured with a two-fold dilution of cefquinome ranging from 1/4 to 16 × MIC. The growth was compared with the control. The tubes were incubated at 37 °C with 5% CO2 and the viable counts of bacteria were determined at 0, 1, 2, 3, 4, 6, 8, 10, 12, and 24 h. At each time point, 100 µL of aliquots were serially diluted by saline, and then, the CFUs were counted after 24 h of incubation. The limit of detection was 10 CFU/mL.
The plasma samples obtained from the healthy and diseased group was considered as a culture media for the ex vivo MIC, MBC, and time–killing curves. The bacteria (106 CFU/mL) cultured with the plasma samples were collected at 0.083, 0.167, 0.25, 0.5, 0.75, 1, 1.5, 2, 3, 4, 6, 8, 10, 12, and 24 h after cefquinome administration. The tubes were incubated at 37 °C with 5% CO2 and the viable counts of bacteria were determined at 0, 3, 6, 9, 12, and 24 h after co-culture.

4.6. Pharmacokinetic Experiments

4.6.1. Sample

Blood samples were collected from healthy (n = 6) and diseased groups (n = 6). Each pig received cefquinome (cefquinome sulfate 2.5%, Amicogen (Jining, China) Biopharm Co., Ltd.) by intramuscular injection (single dose of 2 mg/kg). Blood samples were collected with an anticoagulant at 0.083, 0.167, 0.25, 0.5, 0.75, 1, 1.5, 2, 3, 4, 6, 8, 10, 12, and 24 h after administration. The samples were centrifuged at 3500 × g for 10 min and then stored at −20 °C prior to HPLC and PD experiment.

4.6.2. HPLC

Waters 2695 series HPLC and a Waters 2587 UV detector set at a wavelength of 265 nm equipped with ZORBAX SB-Aq column (250 × 4.6 mm i.d., 5 µm; Agilent Technology, Santa Clara, CA, USA) were used. The injection volume was 30 µL and the temperature was maintained at 30 °C. The mobile phase consisted of A (0.1% phosphoric acid) and B (acetonitrile) with gradient elution as follows (0−8 min, 10% B, 8–8.1 min, 15% B; 8.1−15 min, 10% B) at a flow rate of 1 mL/min.
The sample was extracted with 1 mL of acetonitrile. The tubes were vortexed for 2 min and then centrifuged at 10,000× g for 10 min. Following that, 1.5 mL of dichloromethane was added, and the tubes were vortexed for 15 s and centrifuged at 10,000× g for 10 min. The supernatant was filtered through a 0.22 μm nylon Millipore chromatographic syringe filter for HPLC.
The method was validated with reference to the residue guidelines of the Veterinary Pharmacopoeia of the Department of Agriculture and the Pharmacopoeia of the United States (Gad, 2014). The validation of linearity, limit of determination (LOD), limit of quantitation (LOQ), accuracy, and precision of the method were determined by blank serum with CEQ standard solution. The calibration curves were constructed using blank serum with CEQ at six levels as follows: 0.05, 0.1, 0.1, 1, 5, and 10 μg/kg (n = 3). The calibration curve was y = 63065x − 3595.1, (R2 = 0.9996). The LOD value was 0.03 μg/mL which was the lowest detected concentration at the value of the signal to noise ratio (S/N) > 3 in serum. LOQ was 0.05 μg/mL, which was the lowest detected concentration at the value of S/N > 10 in serum. LOD and LOQ were defined three times and, respectively, established by the following steps: 15 blank serum added drugs were analyzed, and the S/N was calculated at the time window in which the analyte was expected. Accuracy and precisions (intraday, interday, and within laboratory) were calculated from the determination of five aliquots of serum at 0.1, 1, and 5 μg/kg. The recovery of CEQ in plasma ranged within 94−99%, with the intraday relative SD less than 13%. The PK data were analyzed with WinNonlin V5.2.1.

4.7. PK/PD Integration Analysis

For the PK/PD model, AUC24 h/MIC, Cmax/MIC, and T>MIC are considered as the standardized PK/PD index. These parameters were determined by combining time–killing curves and the in vivo PK parameters. Using WinNonlin version 5.2.1, the inhibitory sigmoid Emax model was used to evaluate the correlation of index in vitro and the change in the bacterial count following 24 h of incubation. The applicable model equation was described as Equation (1) [58].
E = E m a x ( E m a x E 0 ) · C N C N + E C 50 N
where, E is the PD endpoint, E0 is the change in log10 CFU/mL after 24 h incubation in the control sample as compared to the initial incubation, Emax is the differential effect between the greatest amount of growth and the greatest amount of kill, C is the PK/PD index (AUC24 h/MIC, Cmax/MIC or T > MIC) in the compartment, EC50 is the PK/PD index value producing 50% reduction in the bacterial count from initial inoculum, and N is the Hill coefficient that describes the steepness of the curve.

4.8. Monte-Carlo Analysis and PK/PD Cutoff Calculation

Monte-Carlo simulation (MCS) is a mathematical technique that relies upon repeated random sampling to evaluate the impact of uncertainty when characterizing the probability of an outcome [59]. For PK/PDCO, Crystal Ball software version 7.2.2 was used to perform Monte-Carlo simulation based on the PK/PD target index (AUC24h/MIC, E = −3, bactericidal activity). Simultaneously, it was calculated as the highest MIC for the probability target attainment exceeding 90% according to the CLSI guidelines and other previously described studies [34].

4.9. Clinical Cutoff

The conventional clinical cutoff method, the “eyeball approach”, is inadvertently influenced by subjective assessment. In the mathematical method, WindoW aims to reduce the subjective error associated with COCL assessment by identifying the inflection point of MIC with the rate of clinical therapeutic change. One strain (serotype 5) from MIC50, MIC90, COPD, COWT, and highest MIC of the test population should be selected. In the clinical experiment, 30 pigs were divided into five diseased groups (n = 6), which were infected by the above strains, and the control group (n = 6). The physiological parameters, including body temperature, mental state, and respiratory symptoms, were monitored to adjudicate the administration cefquinome. The cure rate of each group after administration of i.m. cefquinome (2 mg/kg once daily for 3 days) was noted to calculate COCL by WindoW.

Supplementary Materials

The following are available online at https://www.mdpi.com/2076-0817/10/2/105/s1, Figure S1: The anatomy of diseased mice, Table S1: Virulence results of H. parasuis (n = 8) for mice by intraperitoneal infection, Table S2: The scoring system and success criteria for clinical effectiveness study.

Author Contributions

K.M.: Writing—original draft, Conception and Software. D.S.: Data curation and Formal analysis. M.L. and H.H.: Methodology and Investigation. K.Z.: Software. Z.L. and Z.Y.: Supervision. L.H.: Project administration, Resources and writing—review and editing. All authors have read and agreed to the published version of the manuscript.

Funding

This article was supported by the National key research and development program (2018YFD0500301, 2016YFD0501310), and the fundamental research funds for the Central Universities (2662017PY081).

Institutional Review Board Statement

The research was approved by the Eth-ics Committee of the Faculty of Veterinary Medicine of the Huazhong Agricultural Uni-versity (SYXK 2019 0044). All animal experiments were conducted according to the committee guidelines for the Laboratory Animal Use and Care Committee in Hubei Science and Technology Agen-cy. All efforts were used to reduce the pain and adverse effect of the animals. After the ex-periments, all mice were euthanized.

Informed Consent Statement

Not applicable.

Data Availability Statement

The data presented in this study are available on request from the corresponding author.

Conflicts of Interest

The authors declare that the research was conducted in the absence of any commercial or financial relationships that could be construed as a potential conflict of interest.

References

  1. Van Boeckel, T.P.; Pires, J.; Silvester, R.; Zhao, C.; Song, J.; Criscuolo, N.G.; Gilbert, M.; Bonhoeffer, S.; Laxminarayan, R. Global trends in antimicrobial resistance in animals in low- and middle-income countries. Science 2019, 365, eaaw1944. [Google Scholar] [CrossRef] [Green Version]
  2. Tenover, F.C. Mechanisms of Antimicrobial Resistance in Bacteria. Am. J. Med. 2006, 119, S3–S10. [Google Scholar] [CrossRef]
  3. Strasfeld, L.; Chou, S. Antiviral Drug Resistance: Mechanisms and Clinical Implications. Infect. Dis. Clin. 2010, 24, 809–833. [Google Scholar] [CrossRef]
  4. Toutain, P.; Bousquet-Mélou, A.; Damborg, P.; Ferran, A.A.; Mevius, D.; Pelligand, L.; Veldman, K.T.; Lees, P. En Route towards European Clinical Breakpoints for Veterinary Antimicrobial Susceptibility Testing: A Position Paper Explaining the VetCAST Approach. Front. Microbiol. 2017, 8, 2344. [Google Scholar] [CrossRef] [Green Version]
  5. Amano, H.; Shibata, M.; Kajio, N.; Morozumi, T. Pathologic Observations of Pigs Intranasally Inoculated with Serovar 1, 4 and 5 of Haemophilus parasuis Using Immunoperoxidase Method. J. Vet. Med. Sci. 1994, 56, 639–644. [Google Scholar] [CrossRef] [Green Version]
  6. Oliveira, S.; Pijoan, C. Haemophilus parasuis: New trends on diagnosis, epidemiology and control. Vet. Microbiol. 2004, 99, 1–12. [Google Scholar] [CrossRef]
  7. Kielstein, P.; Rappgabrielson, V.J. Designation of 15 Serovars of Haemophilus Parasuis on the Basis of Immunodiffusion Using Heat-Stable Antigen Extracts. J. Clin. Microbiol. 1992, 30, 862–865. [Google Scholar] [CrossRef] [Green Version]
  8. Macedo, N.; Rovira, A.; Torremorell, M. Haemophilus parasuis: Infection, immunity and enrofloxacin. Vet. Res. 2015, 46, 1–6. [Google Scholar] [CrossRef] [Green Version]
  9. EMA. Committe for Veterinary Medicinal Products Cefquinome (Extention to Pigs) Summary Reports (2). Available online: https://www.ema.europa.eu/en/documents/mrl-report/cefquinome-extension-pigs-summary-report-2-committee-veterinary-medicinal-products_en.pdf (accessed on 21 October 1999).
  10. Zhang, L.; Wu, X.; Huang, Z.; Zhang, N.; Wu, Y.; Cai, Q.; Shen, X.; Ding, H. Pharmacokinetic/pharmacodynamic assessment of cefquinome against Actinobacillus Pleuropneumoniae in a piglet tissue cage infection model. Vet. Microbiol. 2018, 219, 100–106. [Google Scholar] [CrossRef]
  11. Guo, C.; Liao, X.; Wang, M.; Wang, F.; Yan, C.; Xiao, X.; Sun, J.; Liu, Y.-H. In VivoPharmacodynamics of Cefquinome in a Neutropenic Mouse Thigh Model of Streptococcus suis Serotype 2 at Varied Initial Inoculum Sizes. Antimicrob. Agents Chemother. 2015, 60, 1114–1120. [Google Scholar] [CrossRef] [Green Version]
  12. Xiao, X.; Sun, J.; Chen, Y.; Huang, R.-J.; Huang, T.; Qiao, G.G.; Zhou, Y.-F.; Liu, Y.-H. In vitro dynamic pharmacokinetic/pharmacodynamic(PK/PD) modeling and PK/PD cutoff of cefquinome against Haemophilus parasuis. BMC Vet. Res. 2015, 11, 33. [Google Scholar] [CrossRef] [Green Version]
  13. Limbert, M.; Isert, D.; Klesel, N.; Markus, A.; Seeger, K.; Seibert, G.; Schrinner, E. Antibacterial activities in vitro and in vivo and pharmacokinetics of cefquinome (HR 111V), a new broad-spectrum cephalosporin. Antimicrob. Agents Chemother. 1991, 35, 14–19. [Google Scholar] [CrossRef] [Green Version]
  14. Zhang, B.; Lu, X.; Gu, X.; Li, X.; Gu, M.; Zhang, N.; Shen, X.; Ding, H.-Z. Pharmacokinetics and ex vivo pharmacodynamics of cefquinome in porcine serum and tissue cage fluids. Vet. J. 2014, 199, 399–405. [Google Scholar] [CrossRef]
  15. Matter, D.; Rossano, A.; Limat, S.; Vorlet-Fawer, L.; Brodard, I.; Perreten, V. Antimicrobial resistance profile of Actinobacillus pleuropneumoniae and Actinobacillus porcitonsillarum. Vet. Microbiol. 2007, 122, 146–156. [Google Scholar] [CrossRef]
  16. Toutain, P.; Sidhu, P.K.; Lees, P.; Rassouli, A.; Pelligand, L. VetCAST Method for Determination of the Pharmacokinetic-Pharmacodynamic Cut-Off Values of a Long-Acting Formulation of Florfenicol to Support Clinical Breakpoints for Florfenicol Antimicrobial Susceptibility Testing in Cattle. Front. Microbiol. 2019, 10, 1310. [Google Scholar] [CrossRef] [Green Version]
  17. Lei, Z.; Liu, Q.; Yang, S.; Yang, B.; Khaliq, H.; Li, K.; Ahmed, S.; Sajid, A.; Zhang, B.; Chen, P.; et al. PK-PD Integration Modeling and Cutoff Value of Florfenicol against Streptococcus suis in Pigs. Front. Pharmacol. 2018, 9, 2. [Google Scholar] [CrossRef] [Green Version]
  18. Schwarz, S.; Böttner, A.; Goosens, L.; Hafez, H.M.; Hartmann, K.; Kaske, M.; Kehrenberg, C.; Kietzmann, M.; Klarmann, D.; Klein, G. A Proposal of Clinical Breakpoints for Amoxicillin Applicable to Porcine Respiratory Tract Pathogens. Vet. Microbiol. 2008, 126, 178–188. [Google Scholar] [CrossRef] [Green Version]
  19. Clinical and Laboratory Standards Institute. Performance Standards for Antimicrobial Disk and Dilution Susceptibility Tests for Bacteria Isolated from Animals. In Approved Standard Vet01-A4; CLSI: Wayne, PA, USA, 2013. [Google Scholar]
  20. Turnidge, D.J.; Martinez, M.N. Proposed Method for Estimating Clinical Cut-Off (Cocl) Values: An Attempt to Address Challenges Encountered When Setting Clinical Breakpoints for Veterinary Antimicrobial Agents. Vet. J. 1997, 228, 33. [Google Scholar] [CrossRef]
  21. Godinho, K.S.; Keane, S.G.; Nanjiani, A.I.; Benchaoui, A.H.; Sunderland, S.J.; Jones, M.A.; Weatherley, A.J.; Gootz, T.D.; Rowan, T.G. Minimum inhibitory concentrations of tulathromycin against respiratory bacterial pathogens isolated from clinical cases in European cattle and swine and variability arising from changes in in vitro methodology. Vet. Ther. Res. Appl. Vet. Med. 2005, 6, 113–121. [Google Scholar]
  22. Toutain, P.; Potter, T.; Pelligand, L.; Lacroix, M.; Illambas, J.; Lees, P. Standard PK/PD concepts can be applied to determine a dosage regimen for a macrolide: The case of tulathromycin in the calf. J. Vet. Pharmacol. Ther. 2016, 40, 16–27. [Google Scholar] [CrossRef]
  23. Toutain, P.-L.; Del Castillo, J.; Bousquet-Mélou, A. The pharmacokinetic–pharmacodynamic approach to a rational dosage regimen for antibiotics. Res. Vet. Sci. 2002, 73, 105–114. [Google Scholar] [CrossRef]
  24. Ahmad, I.; Hao, H.; Huang, L.; Sanders, P.; Wang, X.; Chen, D.; Tao, Y.; Xie, S.; Xiuhua, K.; Li, J.; et al. Integration of PK/PD for dose optimization of Cefquinome against Staphylococcus aureus causing septicemia in cattle. Front. Microbiol. 2015, 6, 588. [Google Scholar] [CrossRef] [Green Version]
  25. Zhao, Y.; Guo, L.; Li, J.; Huang, X.; Fang, B. Characterization of antimicrobial resistance genes inHaemophilus parasuisisolated from pigs in China. PeerJ 2018, 6, e4613. [Google Scholar] [CrossRef] [Green Version]
  26. Zhao, Y.; Wang, Q.; Li, J.; Lin, X.; Huang, X.; Fang, B. Epidemiology of Haemophilus parasuis isolates from pigs in China using serotyping, antimicrobial susceptibility, biofilm formation and ERIC-PCR genotyping. PeerJ 2018, 6, e5040. [Google Scholar] [CrossRef] [Green Version]
  27. Brogden, S.; Pavlović, A.; Tegeler, R.; Kaspar, H.; De Vaan, N.; Kehrenberg, C. Antimicrobial susceptibility of Haemophilus parasuis isolates from Germany by use of a proposed standard method for harmonized testing. Vet. Microbiol. 2018, 217, 32–35. [Google Scholar] [CrossRef]
  28. Aarestrup, F.M.; Seyfarth, A.M.; Angen, Ø. Antimicrobial susceptibility of Haemophilus parasuis and Histophilus somni from pigs and cattle in Denmark. Vet. Microbiol. 2004, 101, 143–146. [Google Scholar] [CrossRef]
  29. De La Fuente, A.M.; Tucker, A.; Navas, J.; Blanco, M.; Morris, S.; Gutiérrez-Martín, C. Antimicrobial susceptibility patterns of Haemophilus parasuis from pigs in the United Kingdom and Spain. Vet. Microbiol. 2007, 120, 184–191. [Google Scholar] [CrossRef] [Green Version]
  30. Lockhart, S.R.; Ghannoum, M.A.; Alexander, B.D. Establishment and Use of Epidemiological Cutoff Values for Molds and Yeasts by Use of the Clinical and Laboratory Standards Institute M57 Standard. J. Clin. Microbiol. 2017, 55, 1262–1268. [Google Scholar] [CrossRef] [Green Version]
  31. Jaspers, S.; Aerts, M.; Verbeke, G.; Beloeil, P.-A. Estimation of the wild-type minimum inhibitory concentration value distribution. Stat. Med. 2013, 33, 289–303. [Google Scholar] [CrossRef]
  32. Kronvall, G. Normalized Resistance Interpretation as a Tool for Establishing Epidemiological MIC Susceptibility Breakpoints. J. Clin. Microbiol. 2010, 48, 4445–4452. [Google Scholar] [CrossRef] [Green Version]
  33. Meletiadis, J.; Curfs-Breuker, I.; Meis, J.F.; Mouton, J.W. In Vitro Antifungal Susceptibility Testing of Candida Isolates with the EUCAST Methodology, a New Method for ECOFF Determination. Antimicrob. Agents Chemother. 2017, 61, e02372-16. [Google Scholar] [CrossRef] [Green Version]
  34. Turnidge, J.; Paterson, D.L. Setting and Revising Antibacterial Susceptibility Breakpoints. Clin. Microbiol. Rev. 2007, 20, 391–408. [Google Scholar] [CrossRef] [Green Version]
  35. Joneberg, J.; Rylander, M.; Marcelo, F.; Galas, M.F.; Carlos, C.; Kronvall, G. Analysis of Parameters and Validation of Method for Normalized Interpretation of Antimicrobial Resistance. Int. J. Antimicrob. Agents 2003, 21, 525–535. [Google Scholar] [CrossRef]
  36. Kronvall, G.; Kahlmeter, G.; Myhre, E.; Galas, M. A new method for normalized interpretation of antimicrobial resistance from disk test results for comparative purposes. Clin. Microbiol. Infect. 2003, 9, 120–132. [Google Scholar] [CrossRef] [Green Version]
  37. Maurer, F.; Pohle, P.; Kernbach, M.; Sievert, D.; Hillemann, D.; Rupp, J.; Hombach, M.; Kranzer, K. Differential drug susceptibility patterns of Mycobacterium chimaera and other members of the Mycobacterium avium-intracellulare complex. Clin. Microbiol. Infect. 2019, 25, 379.e1–379.e7. [Google Scholar] [CrossRef] [Green Version]
  38. Lei, Z.; Liu, Q.; Qi, Y.; Yang, B.; Khaliq, H.; Xiong, J.; Moku, G.K.; Ahmed, S.; Li, K.; Zhang, H.; et al. Optimal Regimens and Cutoff Evaluation of Tildipirosin Against Pasteurella multocida. Front. Pharmacol. 2018, 9, 765. [Google Scholar] [CrossRef]
  39. Smith, P.; Kronvall, G. How many strains are required to set an epidemiological cut-off value for MIC values determined for bacteria isolated from aquatic animals? Aquac. Int. 2014, 23, 465–470. [Google Scholar] [CrossRef]
  40. Clinical and Laboratory Standards Institute. Development of in Vitro Susceptibility Testing Criteria and Quality Control Parameters for Veterinary Antimicrobial Agents; Approved Guideline—Third Edition. CLSI Document (2008): M37-A3; CLSI: Wayne, PA, USA, 2008. [Google Scholar]
  41. El Garch, F.; De Jong, A.; Simjee, S.; Moyaert, H.; Klein, U.; Ludwig, C.; Marion, H.; Haag-Diergarten, S.; Richard-Mazet, A.; Thomas, V. Monitoring of Antimicrobial Susceptibility of Respiratory Tract Pathogens Isolated from Diseased Cattle and Pigs across Europe, 2009–2012: Vetpath Results. Vet. Microbiol. 2016, 194, 11–22. [Google Scholar] [CrossRef]
  42. Burch, D.; Sperling, D. Amoxicillin-current use in swine medicine. J. Vet. Pharmacol. Ther. 2018, 41, 356–368. [Google Scholar] [CrossRef] [Green Version]
  43. Oliveira, S.; Galina, L.; Pijoan, C. Development of a PCR test to diagnose Haemophilus parasuis infections. J. Vet. Diagn. Investig. 2001, 13, 495–501. [Google Scholar] [CrossRef] [Green Version]
  44. Zhang, P.; Hao, H.; Li, J.; Ahmad, I.; Cheng, G.; Chen, D.; Tao, Y.; Huang, L.; Wang, Y.; Dai, M.; et al. The Epidemiologic and Pharmacodynamic Cutoff Values of Tilmicosin against Haemophilus parasuis. Front. Microbiol. 2016, 7, 385. [Google Scholar] [CrossRef] [Green Version]
  45. Craig, W.A. State-of-the-Art Clinical Article: Pharmacokinetic/Pharmacodynamic Parameters: Rationale for Antibacterial Dosing of Mice and Men. Clin. Infect. Dis. 1998, 26, 1–10. [Google Scholar] [CrossRef]
  46. Sidhu, P.; Rassouli, A.; Illambas, J.; Potter, T.; Pelligand, L.; Rycroft, A.; Lees, P. Pharmacokinetic-pharmacodynamic integration and modelling of florfenicol in calves. J. Vet. Pharmacol. Ther. 2013, 37, 231–242. [Google Scholar] [CrossRef]
  47. Pelligand, L.; Lees, P.; Sidhu, P.K.; Toutain, P.-L. Semi-Mechanistic Modeling of Florfenicol Time-Kill Curves and in silico Dose Fractionation for Calf Respiratory Pathogens. Front. Microbiol. 2019, 10, 1237. [Google Scholar] [CrossRef]
  48. Sun, J.; Xiao, X.; Huang, R.J. In Vitro Dynamic Pharmacokinetic/Pharmacodynamic (Pk/Pd) Study and Copd of Marbofloxacin against Haemophilus Parasuis. BMC Vet. Res. 2015, 11, 293. [Google Scholar] [CrossRef]
  49. Moleres, J.; Santos-López, A.; Lázaro, I.; Labairu, J.; Prat, C.; Ardanuy, C.; González-Zorn, B.; Aragon, V.; Garmendia, J. Novel Blarob-1-Bearing Plasmid Conferring Resistance to Β-Lactams in Haemophilus Parasuis Isolates from Healthy Weaning Pigs. Appl. Environ. Microbiol. 2015, 81, 3255–3267. [Google Scholar] [CrossRef] [Green Version]
  50. Zhang, J.; Xu, C.; Shen, H.; Li, J.; Guo, L.; Cao, G.; Feng, S.; Liao, M. Biofilm formation in Haemophilus parasuis: Relationship with antibiotic resistance, serotype and genetic typing. Res. Vet. Sci. 2014, 97, 171–175. [Google Scholar] [CrossRef]
  51. Aarestrup, F.M.; Skov, R.L. Evaluation of ceftiofur and cefquinome for phenotypic detection of methicillin resistance in Staphylococcus aureus using disk diffusion testing and MIC-determinations. Vet. Microbiol. 2010, 140, 176–179. [Google Scholar] [CrossRef]
  52. Damborg, P.; Marskar, P.; Baptiste, K.E.; Guardabassi, L. Faecal shedding of CTX-M-producing Escherichia coli in horses receiving broad-spectrum antimicrobial prophylaxis after hospital admission. Vet. Microbiol. 2012, 154, 298–304. [Google Scholar] [CrossRef]
  53. Papich, M.G.; Lindeman, C. Cephalexin susceptibility breakpoint for veterinary isolates: Clinical Laboratory Standards Institute revision. J. Vet. Diagn. Investig. 2017, 30, 113–120. [Google Scholar] [CrossRef]
  54. EUCAST. European Committee on Antimicrobial Susceptibility Testing Reports. 2019. Available online: http://www.eucast.org/fileadmin/src/media/PDFs/EUCAST_files/Breakpoint_tables/v_9.0_Breakpoint_Tables.pdf (accessed on 12 January 2019).
  55. Zhang, L.; Li, Y.; Wang, Y.; Sajid, A.; Ahmed, S.; Li, X. Integration of pharmacokinetic-pharmacodynamic for dose optimization of doxycycline against Haemophilus parasuis in pigs. J. Vet. Pharmacol. Ther. 2018, 41, 706–718. [Google Scholar] [CrossRef]
  56. Turnidge, J.; Kahlmeter, G.; Kronvall, G. Statistical characterisation of bacterial wild-type MIC value distributions and the determination of epidemiological cut-off values. Clin. Microbiol. Infect. 2006, 12, 418–425. [Google Scholar] [CrossRef]
  57. Yu, J.; Zhang, Y.; Du, Y.; Li, J.; Huang, B.; Sun, W.; Cong, X.; Peng, J.; Ren, S.; Gou, L.; et al. The BALB/c mouse infection model for improving the Haemophilus parasuis serotyping scheme. Res. Vet. Sci. 2016, 109, 166–168. [Google Scholar] [CrossRef]
  58. Toutain, P.-L. Pharmacokinetic/pharmacodynamic integration in drug development and dosage-regimen optimization for veterinary medicine. AAPS PharmSci 2002, 4, 160–188. [Google Scholar] [CrossRef]
  59. Trang, M.; Dudley, M.N.; Bhavnani, S.M. Use of Monte Carlo simulation and considerations for PK-PD targets to support antibacterial dose selection. Curr. Opin. Pharmacol. 2017, 36, 107–113. [Google Scholar] [CrossRef]
Figure 1. Distribution of Minimum Inhibitory Concentration (MIC) of cefquinome against H. parasuis. (A) The number of strains is 131; (B) combined with Xiao’s result [12], the number of strains is 344.
Pathogens 10 00105 g001
Figure 2. The in vitro time–killing curve of cefquinome against HPS42.
Pathogens 10 00105 g002
Figure 3. The ex vivo time–killing curves in serum. (A) Represented curves in healthy group and (B) Represented curves in diseased group. Note: Bacterial number was determined at different time points by a variety of serum samples from the pharmacokinetic (PK) study. Legends represents the cefquinome concentration in the sampling time point.
Pathogens 10 00105 g003aPathogens 10 00105 g003b
Figure 4. The concentration–time curves of cefquinome in serum from the healthy pigs (n = 6) and the diseased pigs (n = 6) after I.M. administration 2mg/kg bodyweight (b.w.).
Pathogens 10 00105 g004
Table 1. Pharmacokinetic parameters of cefquinome after intramuscular (I.M.) administration (2 mg/kg) in healthy and H. parasuis-infected swine (n = 6).
ParametersUnitHealthyInfected
T1/2 H3.52 ± 0.813.19 ± 0.92
TmaxH0.24 ± 0.120.26 ± 0.11
Cmaxμg/mL2.53 ± 0.465.75 ± 0.59
AUC 0–∞hr*μg/mL8.61 ± 2.6815.52 ± 4.07
Vz_FmL/kg1.39 ± 0.740.63 ± 0.27
Cl_FmL/h/kg0.26 ± 0.090.14 ± 0.03
MRTlastH4.61 ± 0.683.59 ± 0.88
Cmax: maximal drug concentration; Tmax: time to reach Cmax; T1/2: the half-life; CL_F = clearance per fraction absorbed; Vz_F = volume of distribution per fraction absorbed; MRT = mean residence time.
Table 2. The ex vivo Pharmacokinetic/Pharmacodynamic (PK/PD) parameters after I.M. administration cefquinome for various antibacterial effects.
ParameterUnitHealthyDiseased
EmaxLog10CFU/mL1.712.10
EC50Log10CFU/mL33.2047.66
E0Log10CFU/mL−4.06−4.34
N_3.613.45
AUC24h/MIC for bacteriostatic (E = 0)H2339
AUC24h/MIC for bactericidal (E = −3)H4170
AUC24h/MIC for eradiction (E = −4)H51110
CFU: count forming unit; EC50: the PK/PD index value producing 50% reduction in the bacterial count from initial inoculum.
Table 3. The result of WindoW by different clinical treatment groups.
MIC (μg/mL)SuccessFailureTotal%Success ≤MIC%Success >MICMaxDiffAUC SuccessAUC
Total
CAR
0.12533650.0062.50−12.500.190.380.50
0.2542658.3366.67−8.330.631.130.56
142661.1166.67−5.563.635.630.64
451666.6750.0016.6717.1323.630.72
833663.33100.00−36.6733.1347.630.70
Publisher’s Note: MDPI stays neutral with regard to jurisdictional claims in published maps and institutional affiliations.

