Abstract
Positional consumption is spending valued mainly for relative standing rather than intrinsic usefulness. A progressive consumption tax can, in principle, reduce the social costs of status-driven spending by taxing consumption rather than saving, but it may face resistance. We examine a behavioral evaluation channel in which status quo bias and loss aversion can sustain positional consumption and reduce support for this reform. We combine a fully specified, reproducible in silico simulation of tax acceptance with a real-participant gain–loss questionnaire that benchmarks positional-choice patterns under matched items. In grouped fractional-response estimates from the simulated data, the post-condition increases predicted acceptance from about 0.11 to about 0.22 and is statistically significant (p < 0.001), while higher status quo and loss-aversion proxy intensity predicts lower acceptance and is statistically significant (p < 0.001). Policy framing increases predicted acceptance relative to the Neutral frame. In the questionnaire, loss framing shifts choices toward absolute outcomes relative to gain framing, consistent with attenuated positional motives. The framework provides a transparent way to stress test how framing and bundled communication and comprehension supports can shift acceptance of progressive consumption taxation under stated assumptions.
1. Introduction
Macroeconomic instability and rising inequality make household economic security, including basic consumption, emergency buffers, and the ability to absorb shocks, a central policy concern. When families face unstable earnings, high living costs, and intensified status competition, spending races can reduce saving, increase financial fragility, and add strain to social policies meant to stabilize well-being. This paper asks why a progressive consumption tax can face resistance, understood here as a transition from income-based taxation toward a progressive tax on annual consumption, even though it has been argued to be Pareto efficient, equitable, and growth-friendly (Frank 2008), and even when it is proposed as a way to curb status-driven spending while preserving incentives to save.
Positional consumption is spending valued mostly for how it ranks relative to others, not for its intrinsic usefulness. It generates an externality problem and can trigger arms-race dynamics in which higher spending does not improve relative rank but can crowd out saving (Solnick and Hemenway 1998; Charles et al. 2009). A progressive consumption tax is often proposed as a way to curb such status-driven spending by taxing consumption rather than saving (Frank 2008), and prior work documents the social costs of positional consumption in related settings (Frank 2008, 2011). The concept is closely related to Veblen’s classic account of conspicuous consumption, but our approach follows the later individual-based microeconomic literature that models relative standing within utility and studies the externalities and policy implications that follow.
Our proposed explanation focuses on a behavioral evaluation channel. We study two specific cognitive biases (Kahneman et al. 1982; Kahneman 2011; Da Silva et al. 2023) that are central to reform appraisal, status quo bias (Samuelson and Zeckhauser 1988) and loss aversion (Kahneman and Tversky 1979). Status quo bias refers to a systematic tendency to favor the current policy baseline and to treat departures from it as disproportionately costly, while loss aversion refers to the tendency for perceived losses to loom larger than commensurate gains. These biases can inflate perceived costs when a reform is framed as a departure from familiar rules or as an immediate sacrifice. People can overweight material consumption when judging well-being and then adapt back toward prior levels, which can sustain status-driven spending (Korteling and Toet 2022). A related bias blind spot can also reinforce persistence of distorted judgments (Korteling and Toet 2022). Our theoretical claim is narrower than a general account of tax reform politics. The core mechanism we study is an individual evaluation channel in which status quo bias and loss aversion can reduce acceptance even when policy mechanics are held constant, while perceived fairness, distributional beliefs, administrative feasibility, and institutional trust remain important background determinants of baseline support.
Competition can generate broad gains when it operates through innovation and cost reduction, but it can also generate mutually offsetting arms races when rewards depend on relative position (Frank 2011). In domains governed by positional evaluation, higher spending by one household raises the reference point for others, so relative rank can remain largely unchanged even as aggregate spending rises. We focus on the case in which rewards depend on relative position and can trigger mutually offsetting arms races, and we therefore treat earnings as exogenous and do not model effort, income growth, or entrepreneurial responses.
Methodologically, we use a fully specified, reproducible in silico simulation of tax acceptance paired with a real-participant gain–loss questionnaire that documents gain–loss differences in positional choice under matched items. In the simulation, acceptance varies with demographic slices, framing conditions, and two bias proxies that are constructed as deterministic functions of generation and income indices. The questionnaire provides an empirical gain–loss contrast that we use as a within-study framing benchmark for interpreting the simulation’s framing mechanism, but it does not directly measure tax reform preferences. Because the bias proxies and their effects are specified inputs rather than quantities estimated from tax-support data, and because the questionnaire does not directly measure support for a progressive consumption tax, the evidence should be read as scenario based and conditional on the stated data-generating process rather than as a direct empirical test of tax-policy resistance.
Our explanation would be weakened by empirical patterns showing that directly measured status quo bias and loss aversion do not predict support for progressive consumption taxation once distributional beliefs, perceived fairness, and institutional trust are accounted for, or that acceptance responds to framing in ways that do not operate through perceived losses, default persistence, or transition concerns. It would also be challenged if observed positional-choice behavior showed no systematic gain–loss asymmetry in settings where the loss domain should shift attention toward absolute outcomes.
The hypotheses guiding this study are as follows.
Hypothesis 1.
Resistance to a progressive consumption tax can be traced to status quo bias and loss aversion that skew how stakeholders weigh policy trade-offs, magnifying perceived personal losses while underestimating broader collective gains.
Hypothesis 2.
Positional consumption persists in part because status quo bias and loss aversion can lead people to place outsized weight on relative gains. Targeted behavioral interventions can blunt these effects by reducing positional cues and shifting attention toward absolute payoffs and longer-term outcomes.
Previewing the results, we show that, within the stated data-generating process, higher status quo and loss-aversion intensity is associated with lower simulated acceptance, and that acceptance shifts under alternative frames and under the pre- and post-condition. Substantively, the framework illustrates one channel through which reforms aimed at strengthening saving incentives and curbing status competition may face political fragility, rather than establishing a full explanation of observed resistance. The remainder of the paper proceeds as follows. Section 2 presents the methodology. Section 3 reports the results. Section 4 discusses implications and limitations. Section 5 concludes, and the appendix provides implementation details for replication.
2. Materials and Methods
2.1. Overview
To test our hypotheses, we use a reproducible simulation-and-survey framework that pairs an in silico policy-acceptance experiment, implemented as a fully specified data-generating process, with an empirical questionnaire analysis based on real participant responses. The simulation allows controlled variation in demographics, policy framing, and a bias-mitigation condition. The questionnaire provides a within-study framing benchmark by comparing positional-choice patterns under gain versus loss framing using matched items.
The simulation is an in silico policy experiment designed to make the mapping from behavioral assumptions to predicted acceptance transparent. The status quo and loss aversion proxies, and their influence on acceptance, are not estimated from tax-support data in this study. As a result, the simulation results should be interpreted as conditional on the specified behavioral structure and parameter choices, and their primary role is to illustrate and stress test scenarios under alternative frames and implementation conditions, rather than to provide independent empirical tests of the behavioral mechanisms.
The questionnaire component anchors the analysis in observed choice patterns under gain and loss framing, but it does not directly measure support for a progressive consumption tax. The link from positional choice patterns to tax-policy resistance is therefore indirect in the current design. In particular, the dataset does not include a direct measure of status quo bias; in the simulation it is represented by a structural proxy used for scenario analysis rather than a measured construct. An important direction for future work is to measure tax reform support directly in real participant data, estimate how loss aversion and status quo bias relate to that support alongside competing correlates such as fairness perceptions and institutional trust, and then use simulation to extend those estimated relationships across policy frames and transition scenarios.
The first research stream examines resistance to a progressive consumption tax. We simulate a synthetic population with demographic attributes (generation, income group, and gender), assign individuals to one of four framing conditions (Neutral, Savings, Fairness, or Environment), and generate tax acceptance as a probabilistic outcome driven by demographics, framing, and two bias proxies (status quo and loss aversion). Bias-mitigation is represented by a pre/post-indicator that captures the average shift in acceptance after exposure to bundled communication and comprehension supports. In the simulation, this post-condition is interpreted as a generic bundle of communication and comprehension supports, such as a plain-language description of the reform, a worked numerical example of how liabilities change, and a brief comprehension check; we abstract from delivery modality and dose and treat the effect as a reduced-form shift.
The second research stream examines positional consumption using matched gain- and loss-domain versions of the same ten decision scenarios. We code each response as positional or non-positional and compare positional-choice rates between domains using paired, item-level tests. In this design, the loss-domain version serves as an internal benchmark that shifts attention toward downside risk and absolute outcomes, letting us assess whether positional tendencies are more pronounced under gain framing.
Robustness checks are assessed using outputs produced by the replication workflow. For the simulation, we report resistance patterns by generation and combined income–gender groups before and after the intervention condition, and we estimate fractional-response models on grouped acceptance shares to summarize how demographics, framing, and the bias proxies relate to acceptance within the stated data-generating process. For the questionnaire, we report paired item-level comparisons and summary visualizations of gain–loss differences, which provide a behavioral benchmark for framing patterns in positional choice rather than a direct measurement of tax reform preferences or bias traits.
2.2. In Silico Experiment
The simulation generates synthetic individuals with demographic attributes and bias proxies, then draws accept/reject outcomes from an explicit probabilistic index model. The data-generating process is a fully specified Python 3.12 routine that assigns demographics and experimental conditions and produces acceptance under a stated decision rule. A fixed random seed ensures exact replication and clean sensitivity checks, while the design still supports controlled variation in framing and the pre/post-intervention condition.
The in silico experiment has two connected purposes. First, it models stakeholder resistance to a progressive consumption tax under alternative communication frames. The replication workflow generates a synthetic population with generation, income group, and gender, randomly assigns each individual to a framing condition and to a pre/post-intervention status, and then draws a binary accept/reject outcome from a logistic choice probability. That probability depends on demographics, frame-specific shifts, and two continuous bias proxies (status quo and loss aversion) constructed as deterministic functions of generation and income indices so that bias intensity varies systematically across demographic slices.
The simulation parameters are not calibrated from tax-support data in this study. The numerical values used to construct the bias proxies and to implement framing and the pre- and post-condition are intended to be illustrative, chosen to be modest on the logit scale and to produce a low baseline acceptance rate so that heterogeneous contrasts are visible and easy to replicate. Because the goal is to stress test the evaluation channel under transparent assumptions rather than to claim precise magnitudes, we interpret results as conditional on these inputs and report a sensitivity analysis that rescales the behavioral-effect strength to show how key contrasts move under weaker and stronger assumptions.
Second, we complement the simulation with an empirical gain–loss questionnaire analysis of positional consumption. The replication workflow treats the gain–loss contrast as the identifying variation: responses are coded as positional versus non-positional choices, and item-level paired comparisons test whether positional-choice rates differ systematically between domains. This empirical pattern serves as an interpretive anchor for the framing mechanism motivating the simulation’s counterfactual exercises.
Of note, the questionnaire benchmark is not used to calibrate the tax-acceptance model or to validate predictions about tax preferences. Instead, it provides a qualitative, within-study pattern about framing and positional motives: whether loss framing shifts choices toward absolute outcomes relative to gain framing. We use this pattern as supporting evidence for the behavioral mechanism that motivates the simulation’s counterfactual exercises on framing and communication supports, while keeping the policy-acceptance results explicitly conditional on the stated data-generating process. In particular, the gain–loss asymmetry is used to motivate the direction of the simulated framing contrasts, without treating the questionnaire as a calibration target for tax-preference magnitudes.
The hybrid design leverages the strengths of controlled simulation and empirical benchmarking. The simulation makes it easy to run counterfactuals (how predicted acceptance shifts under alternative frames or under the post-intervention condition) at a scale that survey-only designs rarely permit. The questionnaire component anchors the study in observed human choice patterns and provides a simple, replicable consistency check for gain–loss differences in positional choice across matched items.
2.3. Data
The study draws on two datasets: a synthetic dataset generated by the replication script for the policy-acceptance experiment and an empirical dataset of questionnaire responses used for the gain–loss contrast in the positional-consumption analysis. The synthetic dataset consists of 20,000 simulated individuals whose demographic attributes are sampled probabilistically to match the replication workflow rather than allocated evenly across cells. Generational cohort is drawn from Boomer, Gen X, Millennial, and Gen Z using fixed probabilities (0.37, 0.22, 0.25, 0.16). Income group is drawn from low-income, middle-income, high-income, and ultra-high-income using probabilities (0.30, 0.50, 0.15, 0.05). Gender is sampled as Female or Male with equal probability. Each simulated individual is then independently randomized to one of four framing conditions (Neutral, Savings, Fairness, Environment) with equal probability and to a pre/post-intervention indicator with probability 0.5.
The empirical component uses two questionnaire datasets, one gain-framed and one loss-framed, each containing ten matched scenarios. To ensure comparability, the replication workflow aligns the datasets by truncating both to the smaller sample size, then compares responses item-by-item using paired tests and reports domain-level summaries and visualizations.
Because the simulation is built for controlled contrasts and exact replication, demographic categories and their sampling probabilities are treated as predefined inputs in the code. Accordingly, the synthetic cohort labels and income bins used in the simulation (four generations and four income groups) follow the operational definitions implemented in the replication workflow rather than an attempt to provide exhaustive population taxonomies.
2.4. Progressive Consumption Tax
In all conditions, the policy object is a progressive consumption tax: a system that taxes annual consumption rather than annual income, where consumption is defined conceptually as gross income minus net additions to saving (with saving deducted when it occurs and withdrawals counted when funds are spent). The key feature for our design is that policy mechanics are held constant across conditions, so any differences in simulated support arise from framing (Tversky and Kahneman 1981) and bias-related evaluation rather than from changes in the underlying policy.
Instead of simulating household tax liabilities from an explicit bracket schedule, the replication workflow treats policy framing as an experimental manipulation that shifts a latent acceptance index on the logit scale, with the Neutral frame as the reference. This keeps the data-generating process auditable while preserving the core identification logic: frames change perceived attractiveness without changing the underlying reform being evaluated. The simulation records support as a binary accept/reject outcome and reports acceptance and resistance rates stratified by demographic group, framing condition, and intervention status.
2.5. Operationalization in the Analysis
At the analysis stage, acceptance is aggregated to the group level defined by generation × gender × income × frame × post. Group-level acceptance rates are then modeled using a binomial GLM with logit link applied to fractional outcomes, weighted by group size. The model includes demographic indicators, the group means of the two bias proxies, the framing indicators, and the pre/post term. Effect sizes are reported through model-based contrasts computed from predicted acceptance (for example, overall pre/post changes, generation-specific contrasts, and acceptance differences between low- and high-bias proxy quartiles).
For positional-choice evidence, the empirical component uses matched gain- and loss-domain questionnaires. The replication workflow aligns the two datasets to a common sample size, converts A/B responses to binary indicators where applicable, and then performs paired t-tests item-by-item, alongside domain means and an item-level visualization comparing gain vs. loss response patterns. This gain–loss contrast functions as an empirical benchmark for whether positional tendencies are stronger under gain framing than under loss framing.
Appendix A gives further details.
2.6. Questionnaire
We reproduce below the full text of the gain- and loss-domain questionnaires used in the empirical analysis, adapted from Da Silva et al. (2022). The replication script and the two corresponding questionnaire datasets used to generate all reported statistics and figures are publicly available on Figshare.
Gain-Domain Questionnaire
- (A) You have a 20% chance of buying a name-brand outfit, while your neighbor has a 10% chance.(B) You have a 40% chance of buying a name-brand outfit, while your neighbor has an 80% chance.
- (A) Your car is worth $30,000, while your neighbor’s is worth $10,000.(B) Your car is worth $50,000, while your neighbor’s is worth $60,000.
- (A) Your annual income is $80,000, while your neighbor’s is $40,000.(B) Your annual income is $100,000, while your neighbor’s is $200,000.
- (A) You have a 20% chance of reducing your weekly workload from 44 h to 36 h, while your coworker has a 10% chance.(B) You have a 40% chance of reducing your weekly workload from 44 h to 36 h, while your coworker has an 80% chance.
- (A) You have a 20% chance of living in a high-end neighborhood, while others have a 10% chance.(B) You have a 40% chance of living in a high-end neighborhood, while others have an 80% chance.
- (A) You save $1500 each month, while your neighbor saves $1000.(B) You save $2000 each month, while your neighbor saves $2500.
- (A) You have a 20% chance of your car insurance covering all damages after a crash, while others have a 10% chance.(B) You have a 40% chance of your car insurance covering all damages after a crash, while others have an 80% chance.
- (A) You have a 20% chance of recovering from a terminal illness, while others have a 10% chance.(B) You have a 40% chance of recovering from a terminal illness, while others have an 80% chance.
- (A) You completed high school, while your neighbor completed elementary school.(B) You have a master’s degree, while your neighbor has a bachelor’s degree.
- (A) You receive compliments from your boss twice a year, while your coworker receives none.(B) You receive compliments from your boss four times a year, while your coworker receives eight.
Loss-Domain Questionnaire
- (A) You and your neighbor order a name-brand outfit, and yours has a 20% chance of being lost in the mail, while your neighbor’s has a 10% chance.(B) You and your neighbor order a name-brand outfit, and yours has a 40% chance of being lost in the mail, while your neighbor’s has an 80% chance.
- (A) Your luxury car has a 20% chance of being stolen, while others have a 10% chance.(B) Your luxury car has a 40% chance of being stolen, while others have an 80% chance.
- (A) You have a 20% risk of losing your annual income, dropping it from $60,000 to $50,000, while your competitor has a 10% chance.(B) You have a 40% risk of losing your annual income, dropping it from $60,000 to $50,000, while your competitor has an 80% chance.
- (A) You have a 20% chance of your weekly workload increasing from 36 to 44 h, while your coworker has a 10% chance.(B) You have a 40% chance of your weekly workload increasing from 36 to 44 h, while your coworker has an 80% chance.
- (A) Your neighborhood has a 20% chance of becoming a drug trafficking hotspot, while others have a 10% chance.(B) Your neighborhood has a 40% chance of becoming a drug trafficking hotspot, while others have an 80% chance.
- (A) You face an unexpected expense of $1500, while everyone else faces $1000.(B) You face an unexpected expense of $2000, while everyone else faces $2500.
- (A) You have a 20% chance of crashing your car and not having insurance that covers damages, while others have a 10% chance.(B) You have a 40% chance of crashing your car and not having insurance that covers damages, while others have an 80% chance.
- (A) You have a 20% chance of developing a terminal illness, while others have a 10% chance.(B) You have a 40% chance of developing a terminal illness, while others have an 80% chance.
- (A) You did not complete high school, while your neighbor did not complete elementary school.(B) You did not obtain a master’s degree, while your neighbor did not obtain a bachelor’s degree.
- (A) You typically receive a reprimand from your boss twice a year, while your coworker receives none.(B) You typically receive a reprimand from your boss four times a year, while your coworker receives eight.
2.7. Fractional-Response Model and Effect Summaries
Acceptance and resistance are analyzed as shares bounded between 0 and 1. In the synthetic-policy experiment, we collapse individual accept/reject draws into group-level acceptance shares defined by generation, gender, income group, framing condition, and intervention status (pre vs. post). For each group we retain the cell size and the corresponding cell means of the status quo and loss-aversion proxies. We then estimate a fractional-response generalized linear model (GLM) with a binomial family and logit link, using cell size as variance weights. The specification includes framing indicators, the pre/post-indicator, demographic indicators, and the two bias proxies.
To report interpretable magnitudes, we translate model estimates into predicted-acceptance contrasts. We compute the pre/post contrast at a reference covariate profile, generation-specific predicted acceptance before and after the intervention condition, and a bias-intensity contrast comparing predictions at the first versus third quartile of the bias proxies. All effects are reported as percentage-point changes in predicted acceptance.
2.8. Heterogeneity Checks and Empirical Benchmarking
We summarize heterogeneity in the synthetic-policy experiment using the descriptive and visual outputs produced by the replication workflow. Resistance rates are reported by generation, by combined gender–income groups, and by framing condition, and we visualize these patterns with pre/post heatmaps. We then use the fitted fractional-response model to quantify the same contrasts reported above (pre/post differences, generation-level predicted acceptance, and interquartile shifts in the bias proxies) as a compact robustness check against the descriptive patterns.
For the positional-consumption component, we benchmark gain- vs. loss-domain responses using the two questionnaire datasets. After aligning both datasets to a common sample size, we compare matched items across domains with paired t-tests, report domain means by item and visualize item-level mean patterns across the two domains.
3. Results
3.1. Overview
Before interventions, simulated resistance is slightly higher for males than for females (about 89.5% vs. 87.7%). In the replication design, this gap is driven by a small gender coefficient in the latent acceptance index; the two bias proxies (status quo and loss aversion) vary with generation and income, not gender. After the post-condition, resistance falls to about 79.1% for males and 76.7% for females.
Resistance differs much more sharply by generation. In the baseline (pre) simulation, resistance is highest among Boomers and declines steadily for younger cohorts (Boomer 92.3%, Gen X 89.2%, Millennials 86.6%, and Gen Z 82.0%). Of note, this pattern reflects how the data-generating process assigns higher proxy intensity to older cohorts; we report it to document the scenario design, not as an empirical measure of cognitive bias. However, in the post-intervention simulation, resistance falls across cohorts but remains highest among Boomers (Boomer 83.8%, Gen X 77.7%, Millennials 76.0%, and Gen Z 67.6%).
Baseline resistance is high across income groups and rises modestly with income: 87.3% (low-income), 89.1% (middle-income), 89.1% (high-income), and 90.2% (ultra-high-income). Under the post-condition, resistance declines for every income group but the gradient remains: 75.6% (low-income), 77.0% (middle-income), 79.9% (high-income), and 83.5% (ultra-high-income).
Overall, the pre-condition simulation produces uniformly high resistance across gender, generation, and income, with only small unconditional gaps; the post-condition shifts acceptance upward broadly, lowering resistance across all demographic strata.
In addition to reporting raw differences in resistance across demographic categories, we emphasize model-based contrasts, especially the pre/post-intervention shift and the marginal effects of the two bias proxies, because these directly summarize how framing and the intervention indicator move acceptance within the stated data-generating process. The pre/post heatmaps (Figure 1) compare resistance under the baseline condition (post = 0) versus the bundled post-condition (post = 1). Averaged over the synthetic population, resistance declines from 88.6% pre to 77.9% post, a reduction of 10.7 percentage points. Reductions are larger for younger cohorts than for older cohorts (for example, Gen Z: −14.4 pp vs. Boomer: −8.5 pp), consistent with how the bias proxies and the post-shift are parameterized in the simulation. These changes should be interpreted as the effect of toggling the post-indicator in the model while holding policy mechanics fixed and maintaining the same random assignment of framing conditions.
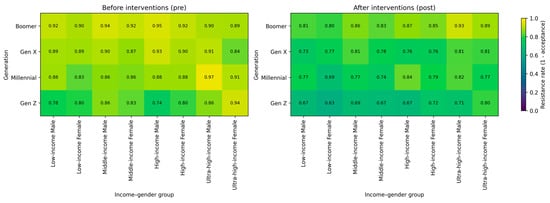
Figure 1.
Resistance rates before (left) and after (right) the intervention condition (post-indicator) in the simulation, shown by generation and combined gender–income groups. In the pre-condition, resistance varies across strata in line with the proxy construction, and it declines broadly in the post-condition.
Thus, the synthetic-policy experiment indicates that acceptance of a progressive consumption tax varies systematically with the two bias proxies (status quo and loss aversion) and with framing, and that the bundled post-condition shifts acceptance in the predicted direction. Using the simulated data, we estimate a fractional-response GLM with a logit link on grouped acceptance shares, with framing indicators, demographics, the two bias proxies, and the pre/post-indicator as covariates. The post-indicator enters positively and is highly statistically significant (β ≈ 0.80, p < 0.001). On the probability scale, predicted acceptance averaged over the synthetic population increases from about 0.11 in the pre-condition to about 0.22 in the post-condition (an increase of roughly 10.6 percentage points). Predicted acceptance also rises monotonically from older to younger cohorts in the pre-condition (from about 0.08 for Boomers to about 0.18 for Gen Z), and the post-shift is larger for younger cohorts than for older cohorts (about 14.7 percentage points for Gen Z vs. about 8.1 percentage points for Boomers). Consistent with the data-generating process, both bias proxies enter with negative coefficients and are statistically significant (status quo β ≈ −1.00, p < 0.001; loss aversion β ≈ −0.84, p < 0.001), implying lower acceptance at higher bias intensity. Moving both proxies jointly from the first to the third quartile lowers predicted acceptance by about 3.7 percentage points. Overall, the fractional-response estimates reinforce the descriptive results: acceptance is systematically lower when status quo and loss-aversion intensity is higher, and it increases under the post-condition and varies across frames, holding policy mechanics constant.
3.2. Sensitivity Analysis
We first summarize baseline (pre) acceptance and resistance by demographic strata and then estimate a grouped fractional-response GLM to quantify how framing, the post-condition, and the two bias proxies are associated with acceptance.
In the baseline (pre) condition, overall acceptance is low (≈0.114), implying high resistance (≈0.886). Acceptance is slightly higher among females than males (≈0.124 vs. ≈0.105). Acceptance rises monotonically across generations from older to younger cohorts (Boomer ≈ 0.077, Gen X ≈ 0.109, Millennial ≈ 0.122, Gen Z ≈ 0.186). Across income groups, acceptance is highest for the low-income group and declines as income increases (low-income ≈ 0.127, middle-income ≈ 0.111, high-income ≈ 0.100, ultra-high-income ≈ 0.098). These descriptive gradients are consistent with the construction of the bias proxies, which assign higher status quo and loss-aversion intensity to older and higher-income profiles.
We then report the model-based contrasts produced by the replication workflow. Toggling the post-indicator from 0 to 1 at the weighted mean covariate profile increases predicted acceptance from ≈0.114 to ≈0.221 (≈+10.6 percentage points). The post-shift is present within each generation and is larger for younger cohorts in the model predictions (Boomer ≈ +8.1 pp; Gen X ≈ +10.7 pp; Millennial ≈ +11.8 pp; Gen Z ≈ +14.7 pp). Higher bias intensity is associated with lower support: moving from the first to the third quartile of the status quo proxy reduces predicted acceptance by ≈2.4 pp, and the same shift in the loss-aversion proxy reduces predicted acceptance by ≈1.3 pp, holding other covariates fixed.
For sensitivity to behavioral-effect strength, we rescaled the behavioral terms in the latent acceptance index by multiplicative factors, holding the demographic sampling, random assignment, and baseline intercept fixed. Under a half-strength setting, the mean-profile pre- and post-acceptance contrast falls from about 10.7 percentage points in the baseline to about 4.6 percentage points, while under a double-strength setting it rises to about 27.1 percentage points. The joint interquartile bias-intensity contrast likewise ranges from about 2.0 percentage points under half strength to about 6.3 percentage points under double strength, compared with about 3.7 percentage points in the baseline. Across these settings, the qualitative conclusions remain unchanged: higher bias intensity is associated with lower acceptance, and both framing and the post-condition increase acceptance within the stated data-generating process.
As an additional sensitivity check, we break the deterministic linkage between demographics and the two bias proxies while holding the rest of the data-generating process fixed. Specifically, we randomly permute the (status quo, loss aversion) proxy pair across individuals and then regenerate accept-reject outcomes using the same covariates and assignments. This eliminates the imposed proxy–demographic correlations, which fall from about −0.90 and 0.44 (generation and income versus status quo) to values near zero, and it reduces dispersion in pre resistance across generation by income cells (the cell-level standard deviation falls from about 0.045 to about 0.024). At the same time, the main counterfactual contrasts remain similar. The average post- versus pre-acceptance shift is about 11.70 percentage points in the baseline design versus about 11.11 percentage points under shuffled proxies, and the framing uplifts relative to the Neutral frame remain close in magnitude. This check clarifies that demographic gradients in the baseline design reflect how the proxies are constructed, while the framing and post contrasts capture scenario responses within the stated acceptance model.
As a further robustness exercise, we assess whether the main counterfactual contrasts depend on cross-sectional variation in the status quo term. We re-ran the replication workflow after holding the status quo proxy constant across individuals (set to its baseline mean) and regenerating accept/reject outcomes under the same covariates and experimental assignments. Under this variant, the average post- versus pre-acceptance shift remains similar, moving from about 10.64 percentage points in the baseline run to about 11.41 percentage points when status quo is held constant. Frame uplifts relative to the Neutral condition also remain of comparable magnitude, with Savings at about +2.21 pp versus +2.69 pp, Fairness at about +3.85 pp versus +3.18 pp, and Environment at about +4.88 pp versus +3.83 pp. This robustness check supports interpreting the framing and post contrasts as features of the stated acceptance model rather than as outcomes that require cross-sectional dispersion in the status quo proxy.
Robustness here should be interpreted as internal to the stated data-generating process. The sensitivity checks vary conditions and effect strength within fixed policy mechanics, and they compare descriptive patterns with grouped fractional-response summaries computed from the same synthetic design. These exercises probe how the reported contrasts behave under controlled perturbations, but they do not represent uncertainty over alternative institutional environments or alternative behavioral models. Different assumptions about trust, perceived fairness, administrative complexity, or endogenous learning could produce different acceptance patterns, which is why we interpret the results as exploratory and motivate field validation.
3.3. Examining the Questionnaire Items in Detail
We analyze the questionnaire evidence item-by-item using the gain- and loss-domain datasets. In the replication workflow, the two domain files are first aligned by truncating both to the smaller sample size. Each response is then represented by a binary indicator that captures the absolute (non-positional) option for that item, so higher values reflect choices driven more by absolute outcomes than by relative standing. We compute the mean of this indicator for each matched question in each domain and summarize the item-level means in a domain-by-item heatmap (Figure 2). To assess whether the gain and loss domains differ systematically, we run paired t-tests for each matched item on the aligned samples. This module is descriptive and comparative: it does not estimate item-specific bias parameters or introduce additional intervention components. Instead, it documents where choices shift toward absolute outcomes under loss framing, consistent with the loss domain serving as a within-study benchmark in which positional motives are attenuated. This within-study benchmark documents a framing pattern in positional choice and is not a direct test of tax reform preferences.
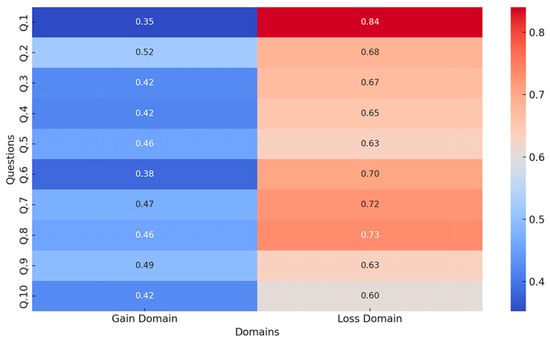
Figure 2.
Heatmap of mean positional-choice rates by item in the gain and loss domains (real-participant data). The loss domain serves as a within-study benchmark. Higher rates in the gain domain indicate items where positional choice is more prevalent under gain framing than under loss framing.
4. Discussion
Resistance to a progressive consumption tax can reflect both evaluation frictions and broader political and institutional concerns. Here, we focus on a behavioral evaluation channel in which status quo bias and loss aversion can impede acceptance even when policy mechanics are held constant, while recognizing that distributional beliefs, administrative feasibility, and institutional trust also shape support.
A neuro-evolutionary perspective helps explain why these patterns persist. Many biases reflect general properties of biological neural systems and evolved heuristics that can misfire in modern settings; similar bias-like regularities also appear in animal behavior and artificial neural networks, pointing to mechanisms rather than purely cultural accounts (Korteling and Toet 2022).
Our findings are consistent with both suggested hypotheses. For Hypothesis 1, the experiment shows pronounced heterogeneity in resistance across demographic profiles. Older cohorts and higher-income groups exhibit higher resistance on average, consistent with higher values of the status quo and loss-aversion proxies, and acceptance shifts systematically under alternative communication frames. In addition, bias-mitigating strategies produce a broad increase in acceptance. When evaluations overweight persistence and perceived losses, support for an efficient reform can remain low even when the policy is described with identical mechanics. For Hypothesis 2, the gain–loss questionnaire shows that positional choices are more common under gain framing than under loss framing, consistent with relative-standing concerns being more salient in gains and weaker in losses.
Frank (2008) asks why higher consumption taxation on top spenders faces resistance even when it could improve efficiency and equity. He also warns that policy arguments grounded in relative standing may be heard as legitimizing envy or resentment. Our results complement this view by showing that opposition can arise from how people process the reform itself (default persistence and loss-focused appraisal) rather than from envy. This distinction matters for implementation: communication and design can target these evaluation mechanisms without appealing to antagonistic emotions.
Frank (2008) also cautions that treating positional externalities as a policy priority can slide into heavy-handed regulation. Our contribution points in the opposite direction: it emphasizes non-coercive design features and communication strategies. In the simulation, framing shifts move acceptance without changing tax mechanics, suggesting that support can respond to how the reform is presented. For example, by making salient its savings-preserving structure or its distributive logic. In practice, the relevant toolkit includes informational feedback, commitment devices, and default-based designs that redirect attention toward long-run outcomes and away from short-run perceived losses. Commitment devices that help align short-run behavior with long-run goals, for instance, are widely used in savings and self-control settings (Ashraf et al. 2006). A nudge (Thaler and Sunstein 2008) could take the form of default enrollment into a tax-favored savings channel under a consumption-tax regime, paralleling successful retirement default programs (Thaler and Benartzi 2004). Framing the reform as rewarding sustainable financial behavior rather than penalizing consumption may also matter; gain-framed messages can increase compliance and perceived legitimacy in tax settings (Kirchler et al. 2008). These are not abstract ideals, but adaptations of empirically tested tools shown to shift behavior in domains such as retirement saving, health, and energy use (Thaler and Benartzi 2004). At the same time, real-world implementation requires care. Nudges that feel manipulative can backfire, especially in low-trust settings; however, cultural attitudes toward taxation may moderate effects, and institutional capacity will shape what is feasible (Sunstein 2016).
In real policy settings, several features can attenuate or reverse the directions suggested by the simulation. Support may fall if a frame is interpreted as moralizing or punitive, if communication is perceived as manipulative, or if the reform is bundled with salient fiscal debates that dominate attention. Distrust in promised rebates, perceived administrative burden, and the spread of regressive narratives can also strengthen default persistence and increase resistance even if the tax base is unchanged. These possibilities suggest that framing effects are context dependent and that communication strategies should be tested in the institutional setting in which the reform would actually be implemented, especially in low-trust environments.
The role of context in shaping consumption decisions, emphasized by Frank (2008), is central here. Positional goods, valued mainly through comparison, create externalities that standard models tend to underweight (Hirsch 1976). The broader well-being literature likewise shows that individuals often prioritize relative position over absolute levels (Easterlin 1974; Clark and Oswald 1996), and that positional concerns vary over the life cycle in ways consistent with demographic heterogeneity (Akay and Martinsson 2019). Kahneman et al. (2006) further argue that people can misjudge the sources of well-being, overemphasizing material consumption relative to other contributors. Together, these perspectives help explain why resistance can persist even when reforms are economically attractive: acceptance depends on how households perceive losses, defaults, and social standing.
Reflecting on the mechanism, a positional consumer can perceive a “nice suit” as one that compares favorably to others in the same environment (Hirsch 1976). More broadly, a positional good derives much of its utility from within-category comparisons (Frank 1991). When some job candidates escalate spending on signaling goods, others may rationally follow to avoid disadvantage, yet total spending rises without improving overall success chances (Frank 2008). These examples show that positional externalities can emerge even under rational behavior. At the same time, human decision-making is not fully rational, and cognitive biases can intensify both the positional arms race itself and resistance to policies designed to curb it.
The animal analogy helps separate the two issues. Positional externalities can arise in sexual selection and signaling without invoking human-like cognitive biases, because behavior is guided by evolved decision rules (Cosmides and Tooby 1994). Cognitive bias is therefore not necessary to explain positional externalities themselves; it is useful for explaining why efficient corrective policies may struggle to gain support. In this sense, bias is not the source of the externality, but a plausible amplifier of resistance to addressing it.
A broader tax reform debate motivates the policy relevance. A growing literature argues that taxing consumption rather than income can improve efficiency and capital accumulation (Aaron and Gale 1996; Gravelle 1991; Hall and Rabushka 1995; Summers 1981). Summers (1981) shows potentially large, long-run gains in life-cycle growth models, while Gravelle (1991) emphasizes that redistributive considerations can substantially shrink those gains. Aaron and Gale (1996) stress that the benefits depend on policy design and transition costs, and Hall and Rabushka (1995) argue that simplicity can reduce compliance burdens. Together, these perspectives underscore both the appeal of consumption-based taxation and the need for empirically grounded assessment of implementation constraints.
Our analysis focuses on feasibility margins and does not estimate how much a progressive consumption tax would raise saving or reduce financial fragility in practice. The size of any stability gain depends on the share of spending that is positional, the extent to which reduced positional spending is redirected toward precautionary saving rather than other consumption, and the distribution of liquidity constraints and shock exposure across households. The acceptance shifts we report are therefore best interpreted as evidence that support can be sensitive to evaluation frictions and presentation, while the practical importance of adoption requires separate calibration using data on household budgets, saving behavior, and vulnerability to shocks.
In that spirit, a progressive consumption tax may also appeal on enforcement and high-end liability grounds. Realization-based income taxes can miss substantial top-end accruals when gains are unrealized or strategically timed (Guyton et al. 2023). A consumption base instead targets high-end spending (the locus of many positional externalities) while avoiding some valuation problems that complicate income- and wealth-based approaches. Administrative designs built on destination-based consumption taxation have also been argued to be more robust to certain forms of base erosion (Grinberg 2006). Recent theory suggests that progressive consumption taxation can deliver redistribution with fewer distortions to intertemporal choices and can fall more heavily on households with persistently high lifetime resources, including inherited wealth (Da Costa and Santos 2023). Empirically, wealth remains highly concentrated, so shifting more of the burden toward very high consumption offers a practical route to reaching households whose taxable income is temporarily low (Smith et al. 2023). In settings with informality, broad-based consumption taxes paired with targeted rebates can still be progressive (Bachas et al. 2024). Taken together, these arguments reinforce why understanding behavioral resistance, and testing communication and implementation strategies in a replicable framework, matters for making consumption-based reform politically and administratively viable.
The evidence in this paper is hypothesis generating and scenario based. The simulation is a transparent in silico policy experiment that shows how acceptance can vary under explicitly stated behavioral assumptions, and the sensitivity exercises vary conditions within that structure rather than estimating those assumptions from tax-support data. The questionnaire component anchors the analysis in observed gain versus loss differences in positional-choice patterns, but it does not directly measure support for a progressive consumption tax. The results therefore illustrate a plausible evaluation channel and motivate targeted empirical tests, rather than providing conclusive estimates of real-world behavioral effects.
Accordingly, we treat the policy implications as exploratory. Real implementation contexts can introduce additional drivers of support, including perceived fairness, administrative burden, trust in institutions, and beliefs about enforcement and redistribution. These factors may interact with framing and default persistence in ways that differ across settings. Future work should measure tax reform support directly and estimate the relevant behavioral relationships in participant data, ideally using field evidence, to assess external validity and quantify practical magnitudes.
The present framework is intended as a replicable way to stress test hypotheses and communication contrasts ahead of field implementation, not as a substitute for piloting and evaluation. Small-scale randomized trials remain essential before broad rollout, and future work should disentangle which components account for the post-condition shift modeled in the simulation. Longitudinal and cross-cultural field evidence would clarify how resistance evolves and how stable gain–loss differences in positional choice are over time. Digital platforms also introduce new forms of status competition through virtual goods and online comparison, which may change both positional dynamics and how reforms are interpreted. Finally, experiments that separately manipulate defaults, framing, information, and commitment mechanisms would help identify what works, for whom, and under which institutional conditions.
5. Conclusions
A progressive consumption tax can, in principle, curb the social costs of status-driven spending by taxing consumption rather than saving and by concentrating the burden on higher levels of discretionary expenditure while protecting basic needs. Whether such a reform is politically viable, however, depends on how households and other stakeholders perceive it. This paper addresses that feasibility margin using a fully reproducible workflow that pairs a simulation of policy acceptance with a real-participant gain–loss questionnaire that benchmarks positional-choice patterns.
The evidence in this study is primarily simulation-based, so the policy implications are best read as exploratory. The simulation encodes behavioral assumptions and parameter choices that are made explicit in the replication workflow, so the results describe what follows if those assumptions approximate how stakeholders evaluate reform. The gain–loss questionnaire anchors the analysis in observed choice patterns, but it does not directly measure support for progressive consumption taxation. Future work should estimate behavioral effects using data on tax reform attitudes and then use simulation to extend those estimates across communication and implementation scenarios.
In the synthetic-policy experiment, acceptance is generated from a transparent probabilistic decision rule that varies systematically with demographics, framing, and a pre/post-condition. Resistance is higher, on average, in older cohorts and higher-income groups, consistent with the way the simulation assigns greater status quo and loss-aversion intensity to those profiles. Framing shifts and the post-condition move acceptance in the expected direction, even with the underlying policy object held constant. Fractional-response estimates on grouped acceptance shares reinforce the same interpretation: greater bias-proxy intensity is associated with lower support, while framing and the post-indicator are associated with higher predicted acceptance.
The questionnaire analysis complements the simulation by documenting a clear gain–loss asymmetry in positional choice. Across matched items, positional-choice rates are consistently lower in the gain domain than in the loss domain, supporting the use of the loss version as a within-study benchmark in which relative-standing cues are attenuated and choices are more likely to track absolute downside risk.
Taken together, the paper contributes a replicable way to study how demographic differences, framing, and bias-related frictions can move support for a reform designed to strengthen saving incentives and reduce wasteful status competition. For social policy and family economic stability, the main implication is practical: implementation and communication choices are part of the policy design problem, and transparent simulation, paired with an empirical benchmark, can help stress-test strategies before field deployment.
Author Contributions
Conceptualization, S.D.S.; methodology, S.D.S., P.B., R.M.; software, R.M.; validation, P.B., R.M.; formal analysis, S.D.S., P.B., R.M.; investigation, S.D.S., P.B.; resources, R.M.; data curation, P.B., R.M.; writing—original draft preparation, S.D.S., P.B.; writing—review and editing, S.D.S.; visualization, S.D.S., R.M.; supervision, R.M.; project administration, S.D.S.; funding acquisition, S.D.S., P.B., R.M. All authors have read and agreed to the published version of the manuscript.
Funding
This research was funded by CNPq [Grant number: PQ 2 301879/2022-2 (S.D.S.) and PQ2 311548/2022-9 (R.M.)] and Capes [Grant number: PPG 001 (S.D.S. and R.M.)]. The APC was funded by CNPq, S.D.S., and R.M.
Institutional Review Board Statement
Not applicable. This study is a secondary analysis of a publicly available, anonymized dataset. No new participants were recruited, and no new data were collected for this manuscript.
Informed Consent Statement
Not applicable. This study is a secondary analysis of a publicly available, anonymized dataset. No new informed consent was required for this manuscript.
Data Availability Statement
The Python code for full replication is available on Figshare: https://doi.org/10.6084/m9.figshare.31098571. The data from real participants is accessible at https://doi.org/10.6084/m9.figshare.14597298.v1.
Acknowledgments
During the preparation of this manuscript, the authors used ChatGPT (v5, OpenAI) for language and style editing (grammar, clarity, and phrasing). All analyses and simulations were conducted offline in Python 3.12 using the publicly available replication script and data files. The authors take full responsibility for the integrity of the methods, results, and final content of the publication.
Conflicts of Interest
The authors declare no conflicts of interest. The funders had no role in the design of the study; in the collection, analyses, or interpretation of data; in the writing of the manuscript; or in the decision to publish the results.
Appendix A. Decision Pipeline and Implementation Details
Here we detail how the synthetic dataset is generated, how acceptance outcomes are produced, how framings and interventions are represented, how group-level models and predicted effects are computed, and how the empirical gain–loss questionnaire is processed for within-study benchmarking. All steps below correspond to the public replication script and can be reproduced directly from it.
Appendix A.1. Synthetic Choice Pipeline
Synthetic choices are generated offline from a fully specified probabilistic model. The replication script draws a synthetic population and assigns each individual a generation, income group, and gender using fixed sampling probabilities. Individuals are then independently randomized to a framing condition and to an intervention-status indicator (pre vs. post), where the post-condition represents exposure to the bundled bias-mitigation package implemented in the simulation.
For clarity, this bundle is intended to capture basic elements that increase understanding and reduce misperception of immediate losses, such as a short plain-language explainer, a worked example tailored to the taxpayer’s situation, and a brief quiz or checklist that confirms comprehension. The model does not assume that different formats are equivalent, and it does not specify dose or mechanism at the component level; the post term is interpreted only as an average shift under this bundled support package.
For each synthetic individual, we compute two bias proxies (status quo bias and loss aversion) as deterministic functions of generational and income indices. These proxies, together with framing and demographic indicators, enter a latent acceptance index (logit scale). The index is converted to an acceptance probability via a logistic link, and the observed acceptance outcome is drawn from a Bernoulli distribution. We define resistance as 1 minus acceptance and summarize resistance rates by generation and combined gender–income groups, separately for pre- and post-intervention conditions.
Appendix A.2. Bias Proxies and Framing Implementation
The simulation uses three pre-specified constructs in the quantitative analysis: status quo bias, loss aversion, and framing. Status quo bias and loss aversion enter as continuous bias proxies, while framing is implemented as an experimental treatment condition.
Generational cohort and income group are coded as ordered indices and then rescaled to the unit interval in the replication script. Specifically, gen_scale ranges from 0 (Boomer) to 1 (Gen Z), and inc_scale ranges from 0 (low-income) to 1 (ultra-high-income). The two bias proxies are deterministic functions of these scaled indices:
Status quo proxy:
status_quo = 0.20 + 0.30 · (1 − gen_scale) + 0.20 · inc_scale
Loss-aversion proxy:
loss_aversion = 0.30 + 0.20 · (1 − gen_scale) + 0.10 · inc_scale
By construction, both proxies are higher for older cohorts and for higher-income groups. This relationship is imposed for the purposes of a transparent scenario design and is not presented as an empirically validated mapping from demographics to measured cognitive bias.
Framing is implemented as a fixed additive shift to the latent acceptance index (on the logit scale), with Neutral as the reference: Savings +0.20, Fairness +0.30, and Environment +0.40. This preserves the experimental logic that policy mechanics are held constant while the emphasis varies across framings.
Appendix A.3. Acceptance Model and Outcome Generation
Acceptance in the simulation is generated from an explicit logistic index model. For each synthetic individual i, the script computes a latent acceptance index Zi as a linear function of demographics (generation, income group, and gender), the two bias proxies (status quo and loss aversion), the assigned framing shift (relative to Neutral), and the post-indicator. This index is mapped into an acceptance probability via the logistic function:
P(Accepti = 1) = 1/[1 + exp(−Zi)].
The observed outcome is then drawn as Accepti ∼ Bernoulli (P(Accepti = 1)). Because the replication script fixes the random seed, the synthetic dataset and all downstream summaries and model estimates are reproducible given the same code and inputs.
Appendix A.4. Aggregation, Estimation, and Predicted Effects
For model-based summaries, the replication workflow aggregates individual outcomes to group-level acceptance rates by generation × gender × income × frame × post. For each group, the script computes the acceptance rate, group size n, and group means of the two bias proxies.
We then estimate a fractional-response generalized linear model using a binomial family with logit link on group-level acceptance shares, weighting each group observation by its size n (variance weights). Effects are reported in terms of predicted acceptance contrasts computed from the fitted model, including: the mean-profile pre/post difference, generation-specific pre/post predicted acceptance, and a bias-intensity contrast comparing predicted acceptance at the first vs. third quartile of the bias proxies.
Appendix A.5. Empirical Questionnaire Processing
As seen, the empirical questionnaire component uses two datasets (gain-domain and loss-domain), each containing ten matched items. The replication script reads both spreadsheets, retains the item-response columns, maps A/B responses to binary values (A = 1, B = 0 where applicable), and drops incomplete rows. To ensure comparability, the script aligns the two datasets to the same sample size by truncating both to the smaller n.
We then compute paired t-tests item-by-item comparing gain- vs. loss-domain responses, report domain means, and visualize item-level mean patterns across the two domains. This empirical comparison is used as a within-study behavioral benchmark for gain–loss differences in positional choice, rather than as a calibration or validation of the tax-acceptance simulation.
Appendix A.6. Behavioral Interventions and Framing as Implemented in the Simulation
In the synthetic-policy experiment, framing and interventions are implemented in a deliberately parsimonious way to preserve full reproducibility. As seen, framing is operationalized through four experimentally assigned conditions. These conditions represent alternative emphases of the same underlying policy and enter the simulation as fixed shifts to the latent acceptance index, with Neutral as the reference. Behavioral interventions are represented by a binary pre/post-indicator post ∈ [0, 1], where post = 1 denotes the post-intervention condition. The post-condition is interpreted as exposure to bias-mitigating communication and comprehension supports, but the replication workflow does not decompose separate intervention components (nudges vs. boosts vs. debiasing) into distinct treatments. Effectiveness is therefore measured as the change in simulated acceptance (or resistance) between post = 0 and post = 1, overall and by demographic subgroup, holding the policy object constant.
Appendix A.7. Flow Diagram of Inputs, Pipeline, and Outputs
Figure A1 outlines the replication workflow, showing how the simulation produces policy-acceptance outcomes under demographic variation, framing, and a pre/post-condition, and how the gain–loss questionnaire analysis provides an empirical benchmark for positional-choice patterns.

Figure A1.
Replication workflow. A simulation generates acceptance/resistance outcomes under demographic assignment, framing, and a pre/post-indicator; a matched gain–loss questionnaire analysis yields item-level positional-choice contrasts that serve as a within-study framing benchmark.
Figure A1.
Replication workflow. A simulation generates acceptance/resistance outcomes under demographic assignment, framing, and a pre/post-indicator; a matched gain–loss questionnaire analysis yields item-level positional-choice contrasts that serve as a within-study framing benchmark.

References
- Aaron, Henry J., and William G. Gale. 1996. Economic Effects of Fundamental Tax Reform. Washington, DC: Brookings Institution Press. [Google Scholar]
- Akay, Ali, and Peter Martinsson. 2019. Positional Concerns through the Life-Cycle. Journal of Behavioral and Experimental Economics 78: 98–103. [Google Scholar] [CrossRef]
- Ashraf, Nava, Dean Karlan, and Wesley Yin. 2006. Tying Odysseus to the Mast: Evidence from a Commitment Savings Product in the Philippines. The Quarterly Journal of Economics 121: 635–72. [Google Scholar] [CrossRef]
- Bachas, Pierre, Lucie Gadenne, and Anders Jensen. 2024. Informality, Consumption Taxes, and Redistribution. The Review of Economic Studies 91: 2604–34. [Google Scholar] [CrossRef]
- Charles, Kerwin Kofi, Erik Hurst, and Nikolai Roussanov. 2009. Conspicuous Consumption and Race. The Quarterly Journal of Economics 124: 425–67. [Google Scholar] [CrossRef]
- Clark, Andrew E., and Andrew J. Oswald. 1996. Satisfaction and Comparison Income. Journal of Public Economics 61: 359–81. [Google Scholar] [CrossRef]
- Cosmides, Leda, and John Tooby. 1994. Better than Rational: Evolutionary Psychology and the Invisible Hand. American Economic Review 84: 327–32. [Google Scholar]
- Da Costa, Carlos E., and Marcelo R. Santos. 2023. Progressive Consumption Taxes. Journal of Public Economics 220: 104854. [Google Scholar] [CrossRef]
- Da Silva, Sergio, Rashmi Gupta, and Dario Monzani, eds. 2023. Highlights in Psychology: Cognitive Bias. Lausanne: Frontiers Media SA. [Google Scholar] [CrossRef]
- Da Silva, Sergio, Raul Matsushita, Vanessa Valcanover, Jessica Campara, and Newton Da Costa, Jr. 2022. Losses Make Choices Nonpositional. SN Business & Economics 2: 182. [Google Scholar] [CrossRef]
- Easterlin, Richard A. 1974. Does Economic Growth Improve the Human Lot? In Nations and Households in Economic Growth: Essays in Honor of Moses Abramovitz. Edited by Paul A. David and Melvin W. Reder. Cambridge, MA: Academic Press, pp. 89–125. [Google Scholar]
- Frank, Robert H. 1991. Positional Externalities. In Strategy and Choice: Essays in Honor of Thomas C. Schelling. Edited by Richard Zeckhauser. Cambridge, MA: MIT Press, pp. 25–47. [Google Scholar]
- Frank, Robert H. 2008. Should Public Policy Respond to Positional Externalities? Journal of Public Economics 92: 1777–86. [Google Scholar] [CrossRef]
- Frank, Robert H. 2011. The Darwin Economy: Liberty, Competition, and the Common Good. Princeton: Princeton University Press. [Google Scholar]
- Gravelle, Jane G. 1991. Income, Consumption, and Wage Taxation in a Life-Cycle Model: Separating Efficiency from Redistribution. American Economic Review 81: 985–95. [Google Scholar]
- Grinberg, Itai. 2006. Implementing a Progressive Consumption Tax: Advantages of Adopting the VAT Credit-Method System. National Tax Journal 59: 929–54. [Google Scholar] [CrossRef]
- Guyton, John, Patrick Langetieg, Daniel Reck, Max Risch, and Gabriel Zucman. 2023. Tax Evasion at the Top of the Income Distribution: Theory and Evidence. NBER Working Paper 28542. Available online: https://www.nber.org/system/files/working_papers/w28542/w28542.pdf (accessed on 15 February 2026).
- Hall, Robert E., and Alvin Rabushka. 1995. The Flat Tax, 2nd ed. Stanford: Hoover Institution Press. [Google Scholar]
- Hirsch, Fred. 1976. Social Limits to Growth. Cambridge, MA: Harvard University Press. [Google Scholar]
- Kahneman, Daniel. 2011. Thinking, Fast and Slow. New York: Farrar, Straus and Giroux. [Google Scholar]
- Kahneman, Daniel, Alan B. Krueger, David Schkade, Norbert Schwarz, and Arthur A. Stone. 2006. Would You Be Happier If You Were Richer? A Focusing Illusion. Science 312: 1908–10. [Google Scholar] [CrossRef] [PubMed]
- Kahneman, Daniel, and Amos Tversky. 1979. Prospect Theory: An Analysis of Decision under Risk. Econometrica 47: 263–91. [Google Scholar] [CrossRef]
- Kahneman, Daniel, Paul Slovic, and Amos Tversky, eds. 1982. Judgment under Uncertainty: Heuristics and Biases. Cambridge, MA: Cambridge University Press. [Google Scholar]
- Kirchler, Erich, Erik Hoelzl, and Ingrid Wahl. 2008. Enforced versus Voluntary Tax Compliance: The ‘Slippery Slope’ Framework. Journal of Economic Psychology 29: 210–25. [Google Scholar] [CrossRef]
- Korteling, J. E. (Hans), and Alexander Toet. 2022. Cognitive Biases. In Encyclopedia of Behavioral Neuroscience, 2nd ed. Amsterdam: Elsevier, pp. 610–19. [Google Scholar] [CrossRef]
- Samuelson, William, and Richard Zeckhauser. 1988. Status Quo Bias in Decision Making. Journal of Risk and Uncertainty 1: 7–59. [Google Scholar] [CrossRef]
- Smith, Matthew, Owen Zidar, and Eric Zwick. 2023. Top Wealth in America: New Estimates Under Heterogeneous Returns. The Quarterly Journal of Economics 138: 515–73. [Google Scholar] [CrossRef]
- Solnick, Sara J., and David Hemenway. 1998. Is More Always Better? A Survey on Positional Concerns. Journal of Economic Behavior & Organization 37: 373–83. [Google Scholar] [CrossRef]
- Summers, Lawrence H. 1981. Capital Taxation and Accumulation in a Life-Cycle Growth Model. American Economic Review 71: 533–44. [Google Scholar]
- Sunstein, Cass R. 2016. People Prefer System 2 Nudges (Kind of). Duke Law Journal 66: 121–68. [Google Scholar] [CrossRef]
- Thaler, Richard H., and Cass R. Sunstein. 2008. Nudge: Improving Decisions About Health, Wealth, and Happiness. New Haven: Yale University Press. [Google Scholar]
- Thaler, Richard H., and Shlomo Benartzi. 2004. Save More Tomorrow™: Using Behavioral Economics to Increase Employee Saving. Journal of Political Economy 112: S164–S187. [Google Scholar] [CrossRef]
- Tversky, Amos, and Daniel Kahneman. 1981. The Framing of Decisions and the Psychology of Choice. Science 211: 453–58. [Google Scholar] [CrossRef] [PubMed]


Disclaimer/Publisher’s Note: The statements, opinions and data contained in all publications are solely those of the individual author(s) and contributor(s) and not of MDPI and/or the editor(s). MDPI and/or the editor(s) disclaim responsibility for any injury to people or property resulting from any ideas, methods, instructions or products referred to in the content. |
© 2026 by the authors. Licensee MDPI, Basel, Switzerland. This article is an open access article distributed under the terms and conditions of the Creative Commons Attribution (CC BY) license.