Abstract
A ducted photovoltaic façade (DPV) unit was studied using experimental prototype and simulated in a full scale computational fluid dynamics (CFD) model. The study comes in two parts; this is Part I, as detailed in the title above, and Part II is titled “A Ducted Photovoltaic Façade Unit with Buoyancy Cooling: Part II CFD Simulation”. The process adopted in the experimental study is replicated in the simulation part. The aim was to optimize the duct width behind the solar cells to allow for a maximum buoyancy-driven cooling for the cells during operation. Duct widths from 5 to 50 cm were tested in a prototype. A duct width of 45 cm had the maximum calculated heat removed from the duct; however, the lowest cell-operating temperature was reported for duct width of 50 cm. It was found that ΔT between ducts’ inlets and outlets range from 5.47 °C to 12.32 °C for duct widths of 5–50 cm, respectively. The ducted system enhanced module efficiency by 12.69% by reducing photovoltaic (PV) temperature by 27 °C from 100 °C to 73 °C. The maximum measured heat recovered from the ducted PV system was 422 W. This is 48.98% from the incident radiation in the test. The total sum of heat recovered and power enhanced by the ducted system was 61.67%.
1. Introduction
One of the very promising renewable energy technologies that has great versatility in providing combined heat and power, architectural image, and aesthetics [1] is building integrated photovoltaic (BIPV). BIPV/thermal [2], on the contrary, is where the photovoltaic (PV) modules are equipped with such additions not only to generate electricity, but also to make use of the accumulated heat from PV as a source for air or water heating, which otherwise may cause the reduction of PV efficiency and deteriorate the structure of the modules.
Many research have been conducted to determine energy and heat balance in PV wall-mounted façades. Yang et al. [3] studied thermal and electrical behavior using governing equations, practical experimentation, and computational fluid dynamics (CFD) simulation. They concluded that PV panel temperature could be reduced by 15 °C and PV efficiency could be increased by 8%.
Sandberg and Moshfegh [4] have undertaken experimental [5] and theoretical [6] investigations on ventilated solar roof and façade airflow and heat transfer with varying duct widths. They concluded that the relationship between the total heat input (q) and the flow rate (Q) in the air gap is a power law relation (Q~qγ), where γ is equal to 1/2 in laminar flow and 1/3 in turbulent flow. In their study, they varied the duct width from 10–90 cm in an attempt to establish a relationship with air velocity.
Peng et al. (2013) [7] have investigated the thermal performance of a PV wall in a multilayer façade in Hong Kong. Their investigation centered on the thermal, electrical, and heat transfer benefits of a PV wall compared to a conventional façade.
Recently, Dupré and Vaillon [8] tried to quantify, by simulation, the potential of reducing internal heat source for PV cells as a function of photon electricity generation, cell thickness, and cell heat exchange to its boundary condition. They concluded that increasing the cell thickness can improve both optical and electrical performances, simultaneously reducing heat as well. Therefore, current and future cells can be designed with this in mind.
Taoma et al. [9] provided a review of an up-to-date research on the passive and active cooling mechanisms for PV modules. They also investigated a phase-change cooling mechanism with some possibilities, but much research is needed for its development.
Parham et al. [10] investigated a BIPV model with a cavity behind the PV under simulated atmosphere with a solar simulator placed inside a wind tunnel. Their focus was on the wind flow around and inside the cavity and its effect of flow nature and characteristics, besides varying the cavity configuration to improve the durability of the system by reducing the ingress of moisture through weak points and interconnections of the PV panels.
Tonui and Tripanagnostopoulos [11] used a prototype system with commercial pc-Si PV modules over air ducts attached behind them in real outdoor testing under clear-sky conditions. They tried to investigate several metal-plate configurations in the duct, which can help to reduce the temperature of the PV modules and to improve the electrical power output besides increasing heat production. They produced a simulation to the heat exchange in Fortran90 and validated it with their experiment. An agreement was found between experimental and simulated models. Their intention was to create a more conducive design of the duct to extract the heat from the PV at low costs. This same approach has been adopted in this research without using additional materials but only inexpensive insulation materials.
Gan (2009) [12,13] analyzed the effect of air gap size on the PV performance in terms of cell temperature for a range of roof pitches and PV panel lengths at different solar heat gain levels. To reduce possible overheating, a minimum air gap of 0.12–0.15 m for multiple-module installations and 0.14–0.16 m for single-module installations were recommended.
Delisle and KummertSolar [14] have undertaken a comparison study between a BIPV/T system and a PV system, that is, a solar thermal system in isolation from each other operationally (PV+T system). They devised a system called useful thermal energy, extracted from each system as a measure for the comparison. They concluded that BIPV/T could be 10% more useful than the traditional PV+T system in summer scenarios. Nevertheless, generally, one has to weigh the cost of the design, the extracted heat, and electricity in favor of simple low-cost design and construction for a high value energy return.
Kazanci et al. [15] experimented with a BIPV/T system compared to a PV of the same type in a house project as part of the Solar Decathlon Europe 2012 competition. The house was later built in Madrid and another one was built in Copenhagen. BIPV/T panels enabled the house to perform as a plus-energy house. PV/T panels also yielded a solar fraction of 63% and 31% for the Madrid and Copenhagen houses, respectively.
Hailu and Fung [16] investigated the influence of airflow velocity and air gap depth, D, between a PV panel and glass wall of PV/T curtain wall on the thermal and electrical efficiencies. They concluded that, for a given air gap, increasing the air velocity increased the PV electrical efficiency. For larger air gaps, the increase in PV efficiency was larger.
This article addresses the lack of a more enhanced yet inexpensive systematic approach of PV integration into building façades, in terms of architecture, power efficiency, heat recovery, and ventilation strategy. This is done through assessing a ducted PV unit system that is designed to allow the PV module to release its heat from its back into adjoining air within an insulated duct. This helps to accumulate half of the heat from the PV module, as the other half is released from the front. Heated air in the duct can be used as preheated ventilation in winter and may be used in suitable designs to enhance air circulation in summer. Heated air utilization may further be investigated in a future research.
2. System Description
A ducted PV panel was instrumented and tested under a solar simulator comprising 8 halogen flood lamps of 500 W each to determine the effects of duct width cooling by buoyancy effect. The PV panel was of model ASE-100-GT-FT by SCHOTT module of 0.644 × 1.282 m (i.e., Table 1), forming a face for the duct (see Figure 1). The other three sides of the duct consisted of a 5-cm-thick polyethylene insulation and a medium density fiberboard (MDF) backing. The duct had equal size openings from the top and bottom, and was raised 50 cm from ground to reduce inlet resistance to airflow as in Figure 1a. The PV panel received an average radiation of 1080 W/m2 measured at 18 fixed-point grid with a pyranometer (ISM400 from RS, UK) of ±5% accuracy on the face of the PV panel (Figure 1b). PV cell temperature was measured by type T thermocouples on 16 locations at the back surface of the module (i.e., at the center of individual cells; Figure 1c). All sensors were connected to DATATAKER 50 in separate instances (initially to determine incident radiation and later to determine cell temperature) with accuracy better than 0.15% of full scale. The duct width was adjusted from 0.05 to 0.5 m by means of a moveable insulation panel at 5 cm steps (Figure 2a). The inlet and outlet temperatures of the air were also recorded by fixed sensors at these locations. Air velocity was measured at the outlet of the duct using a thermal anemometer by TESTO-425 with fixed-flow velocity probe of accuracy ±0.03 m/s (all accuracy percentages are manufacturers’ calibrated and provided figures). Air velocities were averaged from measurements taken at 25 fixed locations at the top of the ducts for large ducts of 30–50 cm width (Figure 2b), and 6 locations for ducts of 5–15 cm width.

Table 1.
PV module ASE-100-GT-FT by SCHOTT module specifications.
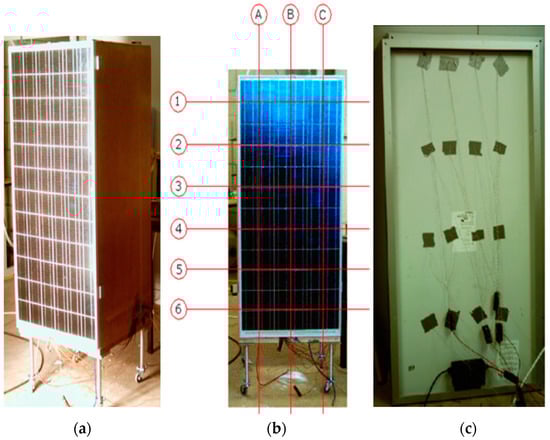
Figure 1.
(a) PV panel fixed to a duct and raised by 50 cm on 4 tubes. (b) Light measured at grid points in front of PV panel. (c) Thermocouples connected to the back of PV panel.
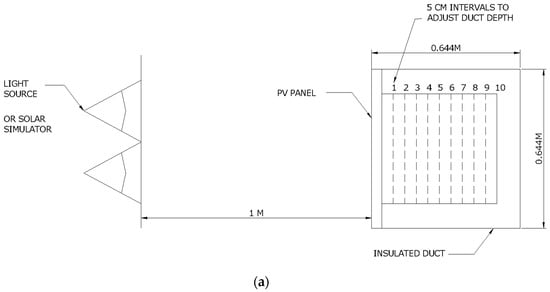
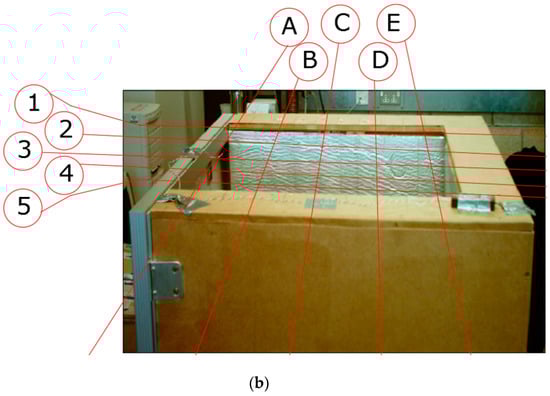
Figure 2.
(a) Schematic of the experimental setting and sequence of duct positions. (b) Locations of hot wire anemometer air velocity measurements ducts of 30–50 cm width.
Light radiation from the simulator faced reflection, absorption (as electricity as well as heat), and heat radiation from the back surface of PV panel. This design configuration of the PV panel with a back duct constituted a prototype modular unit that has an easy replication in building façades either vertically or horizontally. In addition, heat extracted within the duct can feed directly into the building in the heating mode or rejected to the outside in the cooling mode.
One of the factors that influenced the choice of the duct shape and size was to enable multiple ducted units to be stacked up on top of each other. This would boost the buoyancy effect and increase the resulting velocity as explained by Elbakheit (2008) [17]. Such an application would be suited more for high rise buildings. In addition, when ducted PV units are placed side by side, the sides of the ducts would still be insulated to avoid any lateral heat convection transfer. Lateral convections resulting from diurnal cycle (i.e., day and night heat cycle), which could affect the bouncy mechanism and slow down its velocity. Subsequently reduce the cooling effect. Apart from the introduction of a ducted Photovoltaic units in new buildings, it can also be retrofitted to existing building façades provided that enough exposure to solar radiation is present. Some guidance into retrofitting these ducted PV units could be found in Barbaresi et al. (2017) [18].
3. Results
3.1. General Results
The results of the test are illustrated in Figure 3, which were found when operating the PV panel under the prescribed light and duct width from 5 to 50 cm each at a time. Consequently, the recorded ΔT between duct inlet and outlet increased from 5.47 °C to 12.32 °C, which depict some of the temperature reduced from the cells. Furthermore, the mean cell temperature was also reduced from 78–73 °C. The base case with the back of the PV panel resting on the insulation panel (i.e., duct width is zero) was recorded at 100 °C for cell temperature, which is 27% cooling effect by the duct.
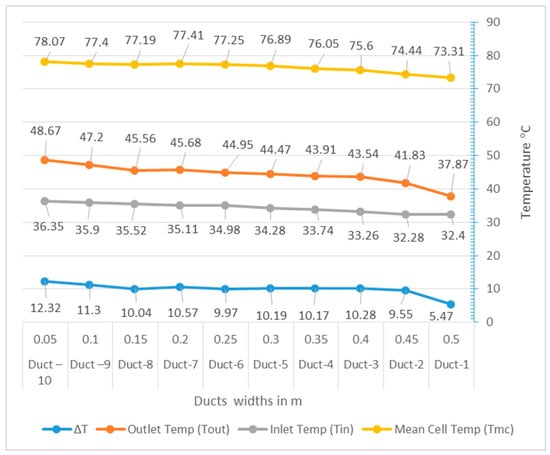
Figure 3.
Experimental results.
3.2. Airflow
Airflow measurements for the outlets of ducts are shown in Figure 4. Air velocity at the outlets of ducts ranged from 0.2 m/s at duct width of 50 cm to 0.5 m/s at duct width of 10 cm, which was the peak air velocity. Duct width of 5 cm has a slightly lower air velocity than duct width of 10 cm. When calculating the total cooling effect by multiplying the airflow rate through the duct with ΔT, we found that duct width of 45 cm had the highest cooling potential with 422 W. Therefore, duct width of 45 cm is the optimum duct width for cooling the PV panel as well as the highest rejected heat quantity from the back of the PV module.
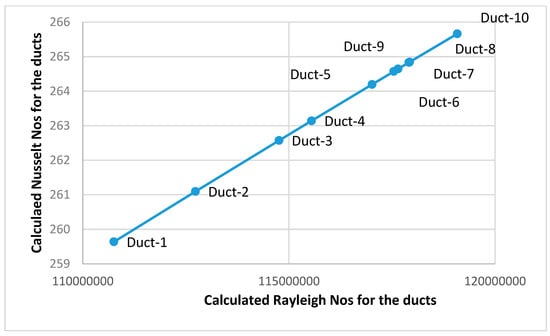
Figure 4.
Nusselt and Rayleigh numbers plots for the studied duct width thermal flow.
3.3. Discussion
This particular result of having the maximum cooling capacity at a duct position that is somewhere between the total range of duct width available can be attributed to the nature of flow behind the duct. This very fact necessitates optimizing the position of the duct. The experimental set-up investigated in this study falls within the scope of Nusselt, Prantel, Rayleigh and Grashof [18] numbers for vertical flat plate under natural convection inside rectangular and square ducts. Grashof number alone represents a ratio of buoyancy to viscous forces, which is more applicable to free stream convection from outside of the PV panel:
where g is gravitational acceleration, α is thermal expansion coefficient, ΔT is temperature difference (i.e., source temperature-quiescent temperature), d is characteristic length (i.e., length of panel), and ν is kinematic viscosity.
The results of calculating Nusselt, Grashof, Prantel and Raleigh numbers are shown in Table 2.
Table 2.
Calculated Nusselt, Grashof, Prantel and Raleigh numbers.
It is clear from this table that Raleigh number, which the product of Grashof and Prantel numbers is mainly influenced by Grashof number. Prantel number is constant for all ducts, which depicts the ratio between momentum and thermal diffusibility being constant due to pragmatic change in duct size.
For this experiment, Nusselt number represent the temperature gradient from the hot surface, and can mark with Rayleigh number the boundary between conduction and convection heat-transfer modes. A plot of Nusselt/Rayleigh graph is depicted on Figure 4 below.
Figure 4 reveals a plot of the calculated Rayleigh and Nusselt numbers for the ten tested ducts. The plotted values followed a linear profile denoting the gradual transition of fluid flow and heat transfer between different duct sizes. In addition Nusselt numbers for the ducts ranged from 259.6396 to 265.663 for duct-1 to duct-10, respectively. These values are well beyond the typical range of Nusselt numbers for laminar flow (i.e., 100). So, the flow is well developed turbulent flow in all ducts (i.e., 100–1000 range). Furthermore, from Table 2 and Figure 4, with the increase in duct width, Raleigh and Nusselt numbers decrease.
4. Energy Output
The measured electricity output from the PV module under a rheostat resistance was 66.61 W, with efficiency of 7.12%. This was the maximum power obtained under the experiment conditions. This generated electricity is less than the values stipulated by the manufacturer at standard test conditions, which states 3.2 A and 42 V with nominal power ranging from 95 to 105 Wp and efficiency of 13.4%.
The short circuit current measured for the PV panel in question was about 1.82 A compared to 3.2 A depicted by the manufacturer. The open circuit voltage was in the region of 36.6 V compared to 42.6 V given by the manufacturer (Table 1). The conditions of the test were inside a lab at the School of Architecture and the built environment, Nottingham University, United Kingdom, (i.e., ambient around the rig, lab temperature at around 10 °C) and incident radiation of 1080 W. One of the reasons for the lower values of the electrical properties is because of the high cell temperatures (i.e., about 60–100 °C). High cell temperatures are attributed to the high level of heat emitted by the light source. The light from flood lamps (solar simulator) has more than 80% infrared electromagnetic waves and less than 20% visible light (i.e., typical specification for tungsten halogen lamps). The data normally supplied by the manufacturer are taken to be under standard test conditions with cells temperature of 25 °C and all spectrum of visible light. Other possible reasons include different properties of the light source from standard spectrum air mass (AM) 1.5 solar radiation.
This makes the remaining wattage equal to 657.7 W from the incident 1080 W; 657.7 W will be absorbed as heat by the panel. Because radiation was right perpendicular on the panel reflection losses can be ignored. The heat will be disbursed between the front and back of the panel depending on the temperature difference of the PV and the air temperature inside and outside the duct, each multiplied by heat transfer coefficient of the outside surface and the inside surface. Therefore,
where G is the total solar radiation absorbed by the PV module, E is the electricity generation rate from the PV module, Tp is PV module temperature, Te is environmental temperature, Ta is the average air temperature in the air duct, ho is the total heat transfer coefficient on the outside surface of the PV panels, and hi is the total heat transfer coefficient on the inside surface of the PV panels.
G = E + ho (Tp − Te) + hi (Tp − Ta)
The main influencing factor on the PV performance here is the heat flux. If we assume that half of the absorbed heat will be fluxed into the duct, this would be about 328.85 W.
Efficiency of the Ducted PV System
According to Table 1, the power output of the PV module is affected by 0.47%/°C. This means that the ducted system enhanced module efficiency by 12.69%, considering the fact that it reduced the PV temperature by 27 °C from 100 °C to 73 °C, as opposed to fixing the PV directly onto the building fabric. The maximum measured heat recovered from the ducted PV system was 422.33 W. This is 39.1% from the incident radiation in the test. Therefore, the total sum of heat recovered and power enhanced by the ducted system is 51.79%.
5. Merits of Ducted System
The ducted PV system provides an effective means to integrate PV panels into buildings. Besides the proven cooling effect for the PV modules, it can save buildings from excessive heat gain/loss, enhance ventilation strategy, and provide further safety from hazardous materials in PV modules in case of emergency or fire.
Ducted PV systems [19] when used in tall buildings can provide further enhancement to the velocity owing to buoyancy because of the term
where H is the height of the duct.
In the buoyancy momentum equation,
This increases the pressure difference between the inlet and outlet of the duct, and therefore increase the flow rate as well as the cooling potential.
On the contrary, the inclined ducted PV system benefits from the buoyancy forces (gravitational acceleration) only by a factor of the cosine of the inclination angle.
6. Conclusions
Although ΔT graph results and mean cell temperature show a plausible cooling effect for the studied ducted PV system at duct width of approximately 10–15 cm, which is line with similar previous research in the literature (i.e., Gan [12,13]), more cooling can still be harvested from deeper ducts such as with duct widths of 40, 45, and 50 cm, which is from the increase in mass flow rate in larger ducts. This conclusion is also in line with the conclusions of Hailu and Fung [16]. This would also reinforce the possibility of reusing such flows into the ventilation of buildings.
The ducted system enhanced module efficiency by 12.69% by reducing PV temperature by 27 °C from 100 °C to 73 °C, as opposed to fixing the PV directly onto the building fabric. The maximum calculated heat recovered from the ducted PV system was 529 W. This is 48.98% from the incident radiation in the test. The total sum of heat recovered and power enhanced by the ducted system is 61.67%.
Author Contributions
The author designed and tested the experimental setup. Fabrication of the setup was done by the lab technical support of the school of Architecture and Built environment at the University of Nottingham, UK.
Funding
The author extends his appreciation to Research & Development Office-Ministry of Education Kingdom of Saudi Arabia for funding this research work, through the High Quality and Impact Research Initiative #HQI-XXX. The author would like to extend his appreciation to the University of Nottingham, UK. for providing test material, equipment, fabrication and lab.
Conflicts of Interest
The Author did not perceive any conflict of interest in this work.
References
- Chehab, O. The intelligent façade: Photovoltaic and architecture. Renew. Energy 1994, 5, 188–204. [Google Scholar] [CrossRef]
- Chow, T.T. A review on photovoltaic/thermal hybrid solar technology. Appl. Energy 2010, 87, 365–379. [Google Scholar] [CrossRef]
- Yang, H.X.; Marshall, R.H.; Brinkworth, B.J. Validated simulation for thermal regulation of photovoltaic wall structures. In Proceedings of the 25th PVSC, Washington, DC, USA, 13–17 May 1996. [Google Scholar]
- Sandberg, M.; Moshfegh, B. Ventilated-solar roof air flow and heat transfer investigation. Renew. Energy 1998, 15, 287–292. [Google Scholar] [CrossRef]
- Moshfegh, B.; Sandberg, M. Flow and heat transfer in the air gap behind photovoltaic panels. Renew. Sustain. Energy Rev. 1998, 2, 287–301. [Google Scholar] [CrossRef]
- Moshfegh, B.; Sandberg, M. Investigation of fluid flow and heat transfer in a vertical channel heated from one side by PV elements. Part I—Numerical study. Renew. Energy 1996, 8, 248–253. [Google Scholar] [CrossRef]
- Peng, J.; Lu, L.; Yang, H.; Han, J. Investigation on the annual thermal performance of a photovoltaic wall mounted on a multi-layer façade. Appl. Energy 2013, 112, 646–656. [Google Scholar] [CrossRef]
- Dupré, O.; Vaillon, R. Optimizations of photovoltaic cells including the minimization of internal heat sources. J. Renew. Sustain. Energy 2014, 6, 011201. [Google Scholar] [CrossRef]
- Ma, T.; Yang, H.; Zhang, Z.; Lu, L.; Wang, X. Using phase change materials in photovoltaic systems for thermal regulation and electrical efficiency improvement: A review and outlook. Renew. Sustain. Energy Rev. 2014, 43, 1273–1284. [Google Scholar] [CrossRef]
- Mirzaei, P.A.; Paterna, E.; Carmeliet, J. Investigation of the role of cavity airflow on the performance of building-integrated photovoltaic panels. Sol. Energy 2014, 107, 510–522. [Google Scholar] [CrossRef]
- Tonui, J.K.; Tripanagnostopoulos, Y. Performance improvement of PV/T solar collectors with natural airflow operation. Sol. Energy 2008, 82, 1–12. [Google Scholar] [CrossRef]
- Gan, G. Numerical determination of adequate air gaps for building-integrated photovoltaics. Sol. Energy 2009, 83, 1253–1273. [Google Scholar] [CrossRef]
- Gan, G. Effect of air gap on the performance of building-integrated photovoltaics. Sol. Energy 2009, 34, 913–921. [Google Scholar] [CrossRef]
- Delisle, V.; Kummert Solar, M. A novel approach to compare building-integrated photovoltaics/thermal air collectors to side-by-side PV modules and solar thermal collectors. Sol. Energy 2014, 100, 50–65. [Google Scholar] [CrossRef]
- Kazanci, O.B.; Skrupskelis, M.; Sevela, P.; Pavlov, G.K.; Olesen, B.W. Sustainable heating, cooling and ventilation of a plus-energy house via photovoltaic/thermal panels. Energy Build. 2014, 83, 122–129. [Google Scholar] [CrossRef]
- Hailu, G.; Fung, A.S. Building Integrated Photovoltaic/Thermal Façade with Forced Ventilation and Natural Convection. Ashrae Trans. 2014, 120, 88–100. [Google Scholar]
- Elbakheit, A.R. Effect of Duct Width in Ducted Photovoltaic Facades. In Proceedings of the CTBUH 8th World Congress, Dubai, UAE, 3–5 March 2008. [Google Scholar]
- Barbaresi, A.; Dallacasa, F.; Torreggiani, D.; Tassinari, P. Retrofit interventions in non-conditioned rooms: Calibration of an assessment method on a farm winery. J. Build. Perform. Simul. 2017, 10, 91–104. [Google Scholar] [CrossRef]
- Jaluria, Y. Natural Convection Heat and Mass Transfer, for Natural Convection; Pergamon Press: New York, NY, USA, 1980. [Google Scholar]


© 2019 by the author. Licensee MDPI, Basel, Switzerland. This article is an open access article distributed under the terms and conditions of the Creative Commons Attribution (CC BY) license (http://creativecommons.org/licenses/by/4.0/).