Abstract
In situ tunnel expansion provides a cost-effective and environmentally sustainable alternative to new tunnel construction. However, staged widening disturbs the lining–rock system, triggering complex, non-monotonic stability responses. This study integrates physical model tests and FLAC3D simulations to investigate the mechanical evolution of a limestone tunnel widened by the Center Diaphragm (CD) method. Seven cross-sections (S1–S7) were fabricated and tested under uniaxial compression with digital image correlation. Results show that the peak load decreases from 385.73 kN in the lined baseline (S1) to 184.14 kN at the first unilateral cut (S3), a 49% reduction, but recovers to 262.28 kN at the left-half closure (S4) before dropping to 128.16 kN at the upper-right excavation (S5). The final relined stage (S7) regains 200.69 kN, a 40% improvement over the unlined enlarged state (S6). Numerical analyses confirm this non-monotonic trajectory in terms of the peak plastic-zone fraction. It reaches at 86.32% in S3, decreases to 74.03% in S4, and rises to 76.43% in S5. The fractions further reach 88.51% in S6 and 87.70% in S7, reflecting the enlarged span and redistributed yielding. Targeted bolting at weak stages S3 and S5 reduced plastic-zone fraction by 14.73 and 4.75 percentage points, and reduced crown settlement by 68% and 41%, respectively. These findings challenge the conventional monotonic degradation assumption, identify S3 and S5 as critical weak links, and validate selective reinforcement for enhancing stability during tunnel expansion.
1. Introduction
The relentless global expansion of transportation networks worldwide necessitates the upgrading of existing infrastructure, particularly tunnels, to accommodate increasing traffic demands [1,2,3,4]. In situ widening has emerged as an economically and environmentally favorable alternative to constructing new parallel tunnels, minimizing land acquisition and ecological footprint [5,6]. However, the excavation and support process in in situ tunnel widening differs fundamentally from new tunnel construction, since it inevitably disturbs the surrounding rock and induces complex stress redistribution within the lining–rock system [7,8,9,10]. These interactions often trigger stability deterioration, excessive deformation, and local failure, posing severe challenges to construction safety and structural reliability.
Previous studies often operate on the assumption that tunnel stability decreases monotonically with the expansion area or excavation stage [11]. Both experimental and numerical investigations consistently suggest that profile enlargement weakens the mechanical integrity of the surrounding rock–support system, leading to progressive strength loss and increased deformation. For instance, Yang et al. [12] performed physical and numerical modeling of tunnels in alternating soft–hard rock strata, and reported a progressive increase in displacement and yield zone extent with excavation advance, suggesting a continuous weakening trend without recovery phases. Similarly, Lin et al. [13] investigated deeply buried tunnels under high in situ stresses, and observed that the surrounding rock exhibited cumulative deformation and failure, which consistently aggravated with increasing excavation depth and stress. Such results reinforce the conventional notion that excavation-induced damage is cumulative and stability monotonically decreases.
Studies on in situ tunnel expansion projects also largely adopt this assumption. Khan et al. [14] analyzed expansion under different in situ stress states and geometries, finding that widening modes (symmetrical vs. asymmetrical) primarily affected the magnitude of deformation, which increased with expansion ratio, again implying monotonic weakening. Similarly, case studies on highway tunnel enlargements emphasize that support load and deformation generally rise with excavation size, and recommend reinforcement strategies based on progressive weakening [15]. Such a monotonic view has informed conventional design strategies, which emphasize uniform reinforcement or linear strengthening of support as excavation advances [16,17,18].
However, systematic, stage-resolved investigations that trace stability evolution across the entire expansion sequence remain scarce. Where evidence exists, it is often piecemeal: mechanistic analyses invoking rock-arching show that face stability can vary non-monotonically with depth—initially decreasing and then increasing—as arching develops, directly challenging a simple degradation paradigm [19]. Complementary model tests under unsymmetrical loading document stage-dependent localization and lining-stress redistribution as excavation bias changes, underscoring the path-dependent nature of tunnel responses [20]. Geological heterogeneity further complicates the picture: weak interlayers alter failure patterns and stress pathways around openings in scaled model tests, amplifying asymmetry and invalidating assumptions of uniform degradation [21]. Even in adjacent underground works, physical model tests of undercrossing demonstrate stage-wise settlement behavior in existing structures as construction proceeds, again pointing to non-uniform, sequence-controlled stability evolution [22]. These findings suggest that stability evolution can be more complex than monotonic degradation, with temporary strengthening arising from stress redistribution, confinement, or support–rock interaction. Despite these scattered observations, systematic investigations that capture stage-by-stage stability evolution in tunnel expansion remain scarce. In particular, there is a lack of integrated experimental and numerical studies that reveal whether specific expansion stages may experience transient strengthening or unique instability modes. This gap hampers evidence-based optimization of excavation sequences, targeted deployment of support, and reliable stability assessment during expansion. Therefore, a systematic, full-process investigation that continuously tracks stability metrics across all expansion stages and triangulates mechanisms with complementary physical modeling and numerical simulation is urgently needed.
Recent tunneling studies increasingly adopt indicator-based performance frameworks to support construction management and risk control [23,24,25]. Following this perspective, we formulate a mechanics-oriented indicator set for stage-wise tunnel expansion, grouping the adopted measures into (i) capacity (peak load/nominal strength), (ii) serviceability-related deformation (crown settlement and wall dilation/opening), and (iii) damage/yield extent (DIC strain localization and the peak plastic-zone fraction). This indicator set enables a transparent, stage-by-stage comparison and supports targeted reinforcement decisions. This study integrates physical model tests with numerical simulations to elucidate the stage-specific stability evolution during in situ tunnel expansion. Here, “stability” is interpreted in the context of displacement-controlled uniaxial loading as the specimen-level resistance to localization-induced loss of load-carrying capacity, and is quantified using the peak load/strength response, post-peak softening (deformation controllability), and the extent of yielding characterized by plastic-zone development. Seven representative cross-sections (S1–S7) were fabricated using limestone, with gypsum linings cast for stages S1 and S7. By combining digital image correlation (DIC) with numerical analysis, we quantify stress–strain response, deformation modes, and plastic-zone development. Our results reveal a distinct non-monotonic trajectory: while stability generally declines with expansion, a significant strength rebound occurs at stage S4, whereas S3 and S5 consistently emerge as critical weak links. These stage-wise trends are intended to provide a comparative vulnerability ranking and mechanistic insight for sequential excavation/support decisions, rather than a direct prediction of absolute in situ safety due to the absence of three-dimensional confinement and excavation-induced stress-path effects. These findings challenge the prevailing monotonic assumption, elucidate the underlying mechanisms, and provide actionable guidance for optimizing excavation sequences and deploying targeted support—particularly at stages S3 and S5—rather than applying uniform reinforcement.
2. Materials and Methods
2.1. Project Context, Geological Setting, and Construction Scheme
This study is grounded in the Jinan Ring Expressway tunnel expansion project (China). The construction site is shown in Figure 1a. According to the project’s geological investigation report, the investigated tunnel span is dominated by slightly to moderately weathered limestone, and the rock mass is relatively intact, with sparse, weakly developed joints and fractures. No significant groundwater influence was observed during the investigated period, and no major faults or folds were identified within the immediate vicinity of the studied section. A Center Diaphragm (CD) method is planned for in situ widening. For analysis and laboratory reproduction, the in situ expansion was simplified into seven discrete configurations S1–S7, as shown in Figure 1b: S1 denotes the lined existing tunnel (baseline); S2–S6 denote the five unlined intermediate expansion states that follow the CD sequence annotated in Figure 1b, involving staged partial demolition and excavation; S7 denotes the widened tunnel with the newly cast lining (final state). It should be noted that S1–S7 denote stage-specific excavation cross-sections (cross-sectional configurations at a reference monitoring section), rather than the longitudinal position of the excavation face. Only S1 and S7 are lined, whereas the intermediate stages are deliberately unlined to isolate the intrinsic rock geometric response of each expansion step.
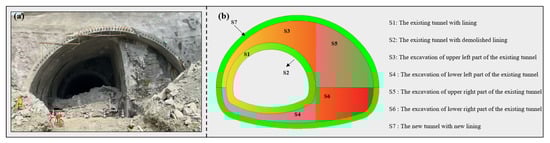
Figure 1.
Project overview and construction sequence for in situ tunnel expansion. (a) Construction site of the Jinan Ring Expressway project. (b) Simplified CD-method sequence and stage definitions S1–S7.
2.2. Physical Models and Material
Based on the simplified cross-sections in Figure 1b, seven physical models (corresponding to S1–S7) were fabricated. The surrounding rock was represented by in situ limestone sampled from the project area in Jinan, Shandong Province, China, exhibiting good integrity and homogeneity.
Before model fabrication, three standard cylindrical cores were drilled from the mother rock, with a diameter of 50 mm and a height of 100 mm, labeled T1, T2 and T3. Uniaxial compression tests were performed to obtain stress–strain behavior. The uniaxial compressive strength (UCS) values for T1, T2 and T3 are shown in Figure 2, and the elastic modulus was obtained from the corrected stress–strain curves as the regression modulus within 30–60% of UCS; averaging the three specimens yields E = 31.98 GPa (see Table 1).
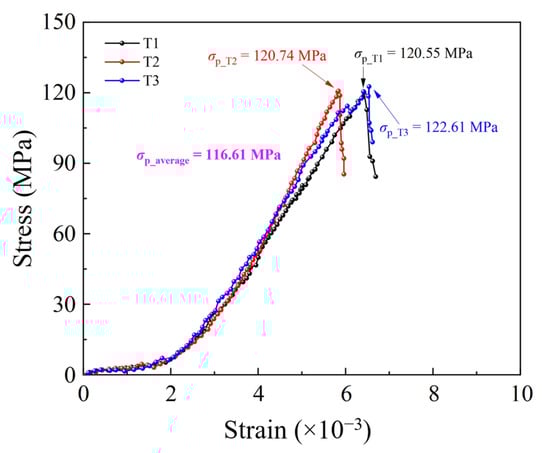
Figure 2.
Uniaxial stress–strain curves of in situ limestone (cores T1–T3).

Table 1.
The results of rock mechanics parameters from in situ limestone core tests.
2.3. Stage-Specific Samples and Machining
All samples were cut from the same limestone block to minimize material variability. For S1–S7, rectangular prisms (100 mm × 100 mm × 50 mm) were prepared, and the internal opening of each prism was wire-cut by the Computer Numerical Control (CNC) method to reproduce the stage-specific tunnel cross-sections defined in Figure 1b at a 1:1000 geometric scale. The geometric reference was defined such that the center of the fully widened cross-section coincides with the specimen center to ensure consistent alignment among stages, and the machining tolerance was ±1 mm. For the lined stages, a two-step molding procedure was used to create the linings, as shown in Figure 3. First, two 3D-printed resin masters were fabricated to cast silicone molds. The samples (S1 and S7) were then seated in the molds, and a gypsum slurry (dental gypsum, Whip Mix Corporation, Louisville, KY, USA) with a water-to-gypsum ratio of 100:25 by mass was poured into the pre-reserved 3 mm gap to form the lining. After demolding, the final samples were prepared, as shown in Figure 4.
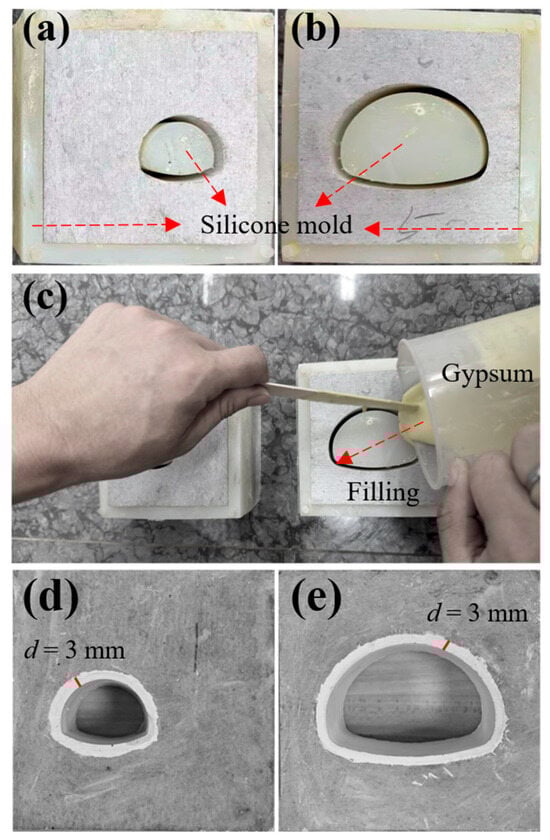
Figure 3.
Lining fabrication workflow by casting using silicone molds. (a,b) Limestone specimens placed in silicone molds. (c) Gypsum slurry injected into the pre-reserved gap to form the lining. (d,e) Demolding to obtain the lined existing tunnel (S1) and the lined widened tunnel (S7).
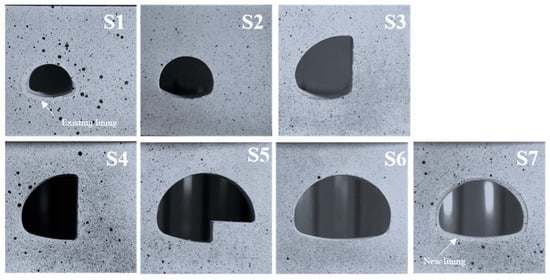
Figure 4.
Physical specimens corresponding to the simplified tunnel cross-sections (stages S1–S7).
2.4. Testing Systems and Loading Method
All tests were carried out in a servo-controlled universal testing machine (SHT4605, MTS Systems Corporation, Shanghai, China) under displacement-controlled uniaxial compression, as shown in Figure 5a. The lower platen was rigidly fixed. After a brief seating preload to ensure full contact, the upper crosshead applied a constant displacement rate of 0.2 mm/min, as shown in Figure 5b. No external lateral pressure was applied during testing; the specimen side faces were left unconfined (traction-free), with only minor end effects associated with platen contact/friction. Axial force and displacement during tests were monitored by built-in sensors, with a sampling frequency of 10 Hz. Two-dimensional digital image correlation recorded full-field kinematics on the face containing the opening. The speckled surface used a matte white base coat with a fine, random black pattern. Image acquisition was synchronized with the force and displacement channels at an adequate sampling rate for peak and post-peak resolution. All signals were time-synchronized. Each test continued well into the softening regime and ended when the load fell to a small fraction of the peak.
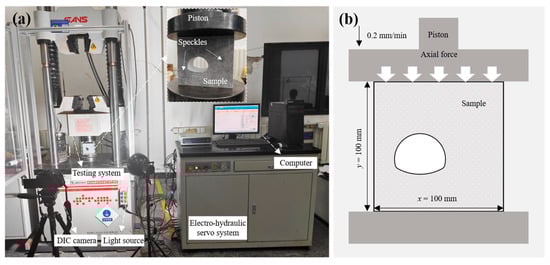
Figure 5.
(a) Displacement-controlled uniaxial compression setup with DIC system. (b) Specimen geometry and loading arrangement.
2.5. Numerical Model Construction
Seven specimens (S1–S7) were reproduced in FLAC3D (version 7.0, Itasca Consulting Group, Minneapolis, MN, USA) with length, width, and height identical to the physical models, as shown in Figure 6. The mesh comprised structured hexahedral zones with quadrilateral faces, with an element size ranging from 0.5 mm (minimum) to 2.0 mm (maximum) near and away from the opening, respectively. A brief mesh-sensitivity check was performed by locally refining the mesh around the opening, and the key response indicators and stage-wise trends were found to be insensitive to the adopted mesh density. The surrounding rock and lining were modeled with the Mohr–Coulomb criterion. Boundary and loading conditions replicated the uniaxial compression tests: the bottom face was fixed vertically; lateral faces were restrained in their outward normal displacement to suppress rigid-body motion while allowing in-plane deformation; a rigid top platen imposed displacement control of 10−6 mm per step to maintain quasi-static conditions. For lined stages, the rock–lining interface is assumed to be perfectly bonded (shared nodes/tie constraint). Numerical damping and solver tolerances were set so that, at each equilibrium step, the global unbalanced force remained below 10−5 of the total applied load. The material and interface parameters used in the simulations are summarized in Table 2. The surrounding rock (limestone) is taken as elastic–perfectly plastic with density ρ = 2500 kg·m−3, Young’s modulus E = 32 GPa, Poisson’s ratio ν = 0.25, cohesion c = 8 MPa, and friction angle φ = 35°. The lining (cast gypsum) is assigned ρ = 1900 kg·m−3, Young’s modulus E = 10 GPa, Poisson’s ratio ν = 0.20, cohesion c = 10 MPa, and friction angle φ = 38°. The limestone elastic modulus was obtained from laboratory uniaxial compression tests on three site cores (T1–T3) (Table 1); the value adopted in Table 2 (E = 32 GPa) is the rounded mean of the test results. The remaining limestone parameters (density, Poisson’s ratio, cohesion and friction angle) were taken from the project geological/geotechnical investigation report for the same lithology and used as representative design (mean) values. The lining (gypsum) parameters were determined from laboratory tests on gypsum specimens prepared with the same mix ratio and curing conditions as the model lining, and the values reported in Table 2 represent the mean/representative values of these tests.
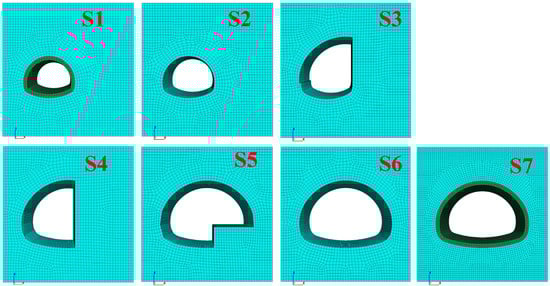
Figure 6.
FLAC3D model configurations for stages S1–S7.
Table 2.
Physical and mechanical properties of materials in the numerical models.
3. Results
3.1. Deformation and Strength Analysis for Physical Model Tests
Figure 7 presents axial force versus axial displacement for S1–S7 under uniaxial compression. The corresponding uniaxial compressive strength values are summarized in Figure 8. S1 (existing tunnel with lining) attains the largest peak load, 385.73 kN, at a failure displacement of 1.44 mm. After the lining is removed (S2), the peak load drops to 363.52 kN—a 5.76% reduction relative to S1, while the failure displacement decreases to 1.05 mm, a 27.08% reduction. This reflects the loss of confinement and hoop action provided by the lining; removal diminishes composite stiffness, reduces lateral restraint, and promotes earlier localization in the surrounding rock. At the first excavation step (S3), the peak load falls sharply to 184.14 kN, a 49.35% reduction relative to S2. The failure displacement is 1.06 mm, essentially unchanged from S2. The pronounced capacity loss at S3 is consistent with the geometric transition from a closed, near-circular section to an irregular partial opening. The loss of ring continuity removes uniform hoop compression, concentrates stress at the expansion notch, increases eccentricity of the load path, and accelerates shear-dominated localization along the sidewalls. When the left half of the expansion is completed (S4), the peak load recovers to 262.28 kN, marking a 42.44% rebound relative to S3. The failure displacement rises to 2.23 mm, an increase of 110.38%. This recovery is attributed to partial ring re-formation on the completed side and the emergence of an arching pathway that redistributes load to stiffer regions. The temporary confinement improves ductility and delays coalescence of localized bands, producing a higher peak. Excavation then advances to the upper-right sector (S5). The peak load drops to 128.16 kN, a 51.14% decrease relative to S4, while the failure displacement reduces to 1.41 mm (−36.77%). The section becomes larger and more irregular; the previously effective arch on the left is disrupted by the new opening on the right, the span increases, and stress paths become more eccentric. These factors weaken the composite response and precipitate earlier instability. With the full expansion completed (S6), the peak load exhibits a modest recovery to 142.70 kN, an 11.35% increase relative to S5. The failure displacement is 1.42 mm, essentially unchanged (+0.71%). The slight improvement is consistent with renewed, albeit weak, symmetry and stress redistribution once the full geometry is established, yet the absence of a lining limits confinement and stiffness. After installing the new secondary lining (S7), the peak load rises to 200.69 kN, an increase of 40.64% relative to S6; the failure displacement increases to 1.73 mm (+21.83%). The lining reintroduces circumferential confinement and raises the global stiffness of the rock–lining system, improving peak capacity and post-peak residual bearing relative to the unlined S6 state.
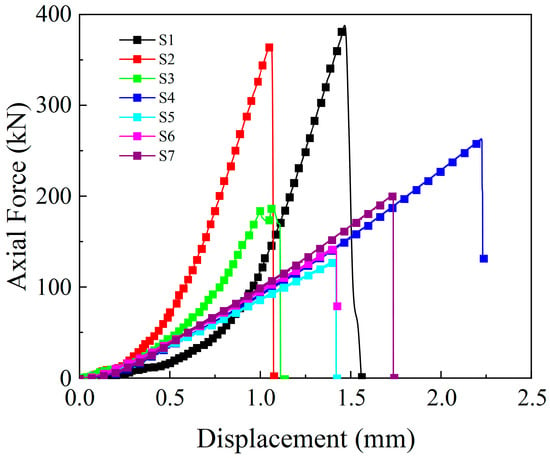
Figure 7.
Axial force–displacement responses for stages S1–S7.
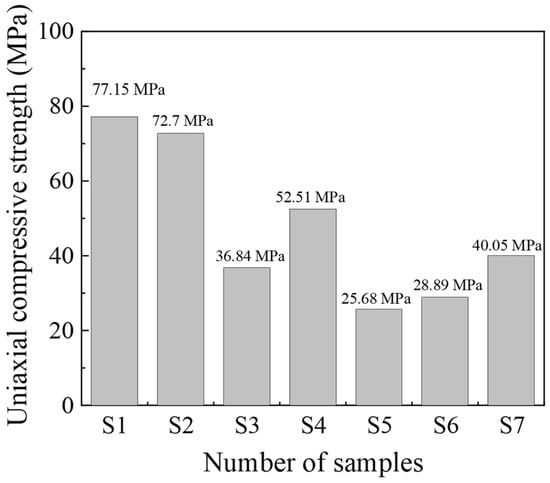
Figure 8.
Uniaxial compressive strength (UCS) by stage (S1–S7).
3.2. Numerical Analysis and Results
To corroborate the physical tests, an equal-geometry FLAC3D analysis was conducted. Figure 9 shows vertical displacement contours at failure. The displacement patterns are stage dependent and consistent with the experiments: crown settlement concentrates above the opening, and, because the in-service cross-section imposes asymmetric boundary conditions, a clear left–right bias appears with larger settlement on the left. In S3, the first unilateral cut produces a skewed settlement trough concentrated from the left haunch to the crown, indicating eccentric load paths after the loss of ring continuity. When the left half is completed (S4), the trough narrows and recenters, and the roof gradients smooth out, consistent with partial ring re-formation and a temporary arch developing on the completed side. Advancing to the upper-right excavation (S5) disrupts this arch: the field tilts rightward, the trough deepens, and the sidewall-to-roof transition zones sharpen. In the fully enlarged but unlined state (S6), the re-established geometric symmetry and a compression arch that anchors in the sidewalls divert vertical load around the cavity. Together with the base support, this suppresses downward movement beneath the invert so that the region below the opening shows little deformation and slight uplift rather than subsidence. With the new lining installed (S7), overall settlement amplitudes decrease, and the uplift below the invert diminishes, yielding a more uniform distribution; this reflects circumferential load sharing and added stiffness from the lining, even though the enlarged span continues to govern the global response.
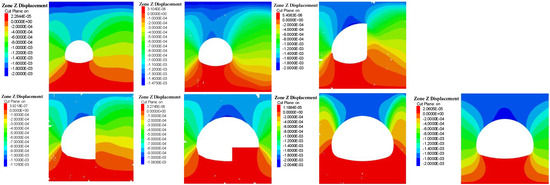
Figure 9.
Vertical displacement contours at failure for stages S1–S7.
Figure 10 maps the spatial distribution of the maximum shear strain increment at failure. Non-blue regions delineate active shear localization, and warmer colors indicate higher local dissipation. With the lining in place (S1), confinement suppresses lateral deformation, and localization remains short and patchy near the springlines/haunches, indicating restrained yielding under compressive support. Removing the lining (S2) releases lateral deformation potential and produces elongated belts along the sidewalls. The first unilateral cut (S3) triggers a dominant oblique band from the left haunch toward the crown, with a secondary branch on the left wall—a Mohr–Coulomb-type mechanism (~45° to the major principal stress) that explains the steep post-peak softening and signals loss of ring continuity. Completing the left half (S4) breaks this band into shorter, weaker segments and shifts activity toward the right shoulder, consistent with partial ring closure and transient arching on the completed side. Advancing the upper-right excavation (S5) re-establishes a continuous, high-intensity band from the shoulder to the crown, yielding a two-sided, symmetric localization pattern that coincides with the capacity minimum. In the fully enlarged but unlined state (S6), localization appears as two thinner, more symmetric belts anchored at shoulders/haunches with reduced peak increments, reflecting limited recovery due to stress redistribution. Installing the new lining (S7) truncates band continuity and lowers intensity, localizing deformation in the rock adjacent to the lining toes; the network becomes fragmented and low-connectivity, indicating that the lining suppresses system-scale instability while concentrating residual deformation in confined zones. Overall, these high-resolution fields confirm the left–right imbalance under asymmetric excavation, provide mechanistic evidence for S3/S5 as control weak links, and support the interpretation of S4 as a transient strengthening state driven by arching and partial ring closure.
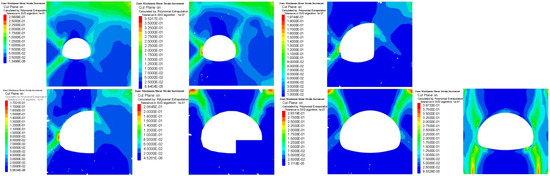
Figure 10.
Maximum shear-strain increment contours at failure for stages S1–S7.
Figure 11 displays the vertical stress at failure. In S1, a continuous compressive arch spans the crown. Peak vertical stress concentrates in the surrounding rock near the springlines and shoulders, while the lining shows a smaller vertical-stress level than the adjacent rock. This is expected: the thin gypsum lining has lower section stiffness than the limestone and mainly carries circumferential (hoop) action, so a large share of the vertical load is transferred into the rock abutments; the lining’s vertical normal stress therefore remains comparatively low, even though it contributes to confinement and ring continuity. Removing the lining in S2 weakens the compressive arch and increases stress nonuniformity. The first unilateral cut in S3 drives vertical-stress concentration toward the excavated side and relieves the opposite side, a signature of eccentric load paths once ring continuity is lost. Completing the left half in S4 partially restores a compressive pathway. Crown stress rises and spreads laterally, and peak gradients at the roof diminish, consistent with temporary arching on the completed side. Advancing the upper-right excavation in S5 disrupts this redistribution. Vertical stress refocuses on the newly weakened shoulder, and the crown again loses support. The fully enlarged but unlined state in S6 exhibits a more symmetric rock stress field, yet the highest vertical stresses migrate toward the shoulders because the increased span reduces crown stiffness and pushes load to the flanks. After installing the new lining in S7, the vertical-stress picture changes character. Crown stress in the rock decreases, and two lateral lobes of higher vertical stress emerge along the shoulders, producing a fork-like (bifurcated) distribution rather than a single crown-centered arch. This bifurcation reflects the enlarged span and the re-established ring action: the lining guides compressive flow circumferentially and encourages side-arch load paths anchored in the shoulders, while its own vertical stress remains lower than that of the surrounding rock due to its hoop-dominated role and smaller section rigidity. Overall, the S7 field evidences more even crown relief, load sharing around the circumference, and shoulder-focused stress corridors.
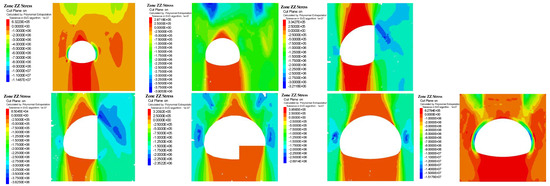
Figure 11.
Vertical stress contours at failure for stages S1–S7.
To clarify the deformation evolution in the simulations, two monitoring points were placed at the geometric crown (the highest point) and the invert (the lowest point) of each cross-section. Figure 12 and Figure 13 trace the histories of invert heave and crown settlement, respectively; positive displacement denotes heave, negative denotes settlement. With lining (S1), the invert initially settles and then, as circumferential ring action develops, the settlement diminishes and reverses to a small heave. The final invert heave is modest, about +0.02 mm, while the crown exhibits a stable settlement at failure of approximately −0.15 mm. This “settlement-then-mild-heave” at the invert indicates that a compressive ring forms, driving thrust toward the shoulders and alleviating stress concentration at the invert. In contrast, all unlined expansion stages (S2–S6) display immediate invert heave from the onset of loading, with stage-dependent rates and amplitudes. The heave rate is highest at S6, consistent with the largest span and the absence of circumferential restraint, which promotes lateral dilation and upward reaction at the base. The lowest heave rate occurs at S4, whose curve is noticeably flatter, reflecting partial ring closure and a transient arching effect on the completed side that suppresses invert uplift. Crown responses show the opposite tendency: S3 and S5 develop the fastest settlement rates and the largest cumulative crown settlements, in line with asymmetric excavation and arch disruption that tilt load paths and accelerate localization at the roof, thereby hastening the loss of bearing capacity. After completion of excavation and installation of the new lining (S7), the invert history is nearly neutral—virtually no heave—while the crown settlement is only moderately controlled. This outcome is expected: the lining restores circumferential stiffness and shares load around the perimeter, but the enlarged span still governs the global flexibility of the crown, so settlement remains appreciable even though base heave is effectively suppressed.
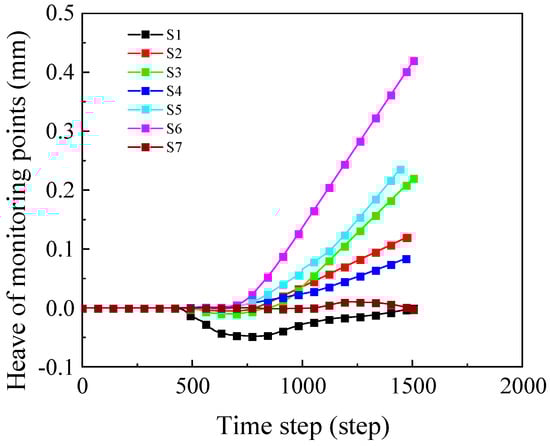
Figure 12.
Evolution of invert heave at the geometric lowest point (monitoring history).
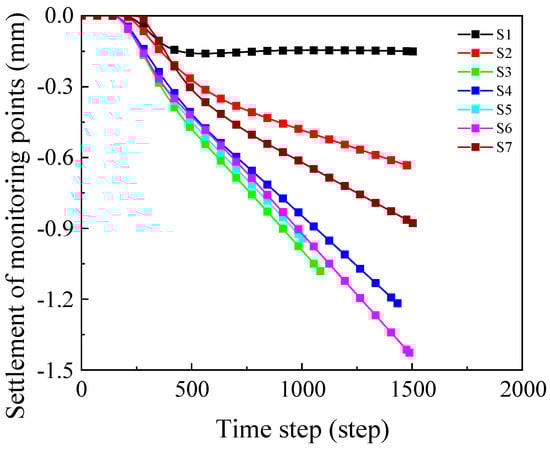
Figure 13.
Evolution of crown settlement at the geometric highest point (monitoring history).
Figure 14 shows the evolution of the volume percentage of the plastic zone versus time step. For S1–S6, the volume percentage follows a common sequence. The fraction increases rapidly at the onset of loading as yielding nucleates around the opening and expands, followed by a gradual adjustment as stress redistributes. Finally, the response approaches a stage-dependent steady value. To ensure consistency of the fraction, the peak volume percentage of the plastic zone for each stage is reported. The peak plastic-zone fractions are 73.22% (S1), 78.29% (S2), 86.32% (S3), 74.03% (S4), 76.43% f(S5), 88.51% (S6), and 87.70% (S7). This ordering remains consistent with the displacement and shear-strain evidence reported earlier: stages S3 and S5 retain broader active yielding at equilibrium, whereas stage S4 stabilizes at the smallest fraction owing to partial ring closure and transient arching on the completed side. Stage S7 departs from this pattern and exhibits two-stage growth. The plastic-zone fraction first rises sharply and then slows under the additional circumferential stiffness introduced by the new lining. When the fraction reaches approximately 70%, a distinct knee point appears, and the growth rate increases again before gradually diminishing toward a final plateau of 87.70%. This behavior reflects a change in the dominant load paths. Early in loading, the lining delays coalescence and keeps plastic activity diffuse. As loading proceeds, bending in the lining and stress channeling toward the shoulders and haunches initiate a second front of plasticization along the side-arches, which produces the temporary acceleration. Once these shoulder corridors are established, further redistribution reduces the driving stresses and the fraction stabilizes. The relatively high peak fraction in S7 should not be interpreted as a loss of benefit from the lining. Rather, the lining broadens the yielded region at lower intensity and shifts activity away from the crown, which reduces peak demand while redistributing deformation. This interpretation is consistent with the vertical stress and shear-strain maps and suggests that, in the lined widened stage, strengthening should be prioritized in the shoulder and haunch regions.
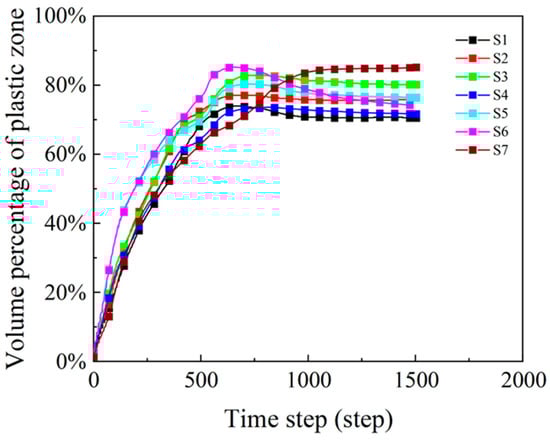
Figure 14.
Evolution of plastic-zone fraction with load step (stages S1–S7).
Figure 15 shows that the expansion sequence produces a clear non-monotonic pattern in both the maximum downward displacement (settlement magnitude) and the peak longitudinal stress in the surrounding rock. Values deteriorate from S1 to S3, recover at S4, drop again to a new minimum at S5, then show a modest improvement in S6, with S7 further moderating settlement and redistributing stress away from the crown toward the shoulders. The S4 rebound—a simultaneous reduction in settlement magnitude and moderation of peak vertical stress relative to S3—corroborates the temporary arching and partial ring-closure formed after the left half is completed; the renewed worsening at S5 follows from breaking that arch during the upper-right excavation, which re-introduces eccentric load paths and continuous shear bands. The lined widened stage, S7, benefits from circumferential restraint that evens the stress field and limits settlement.
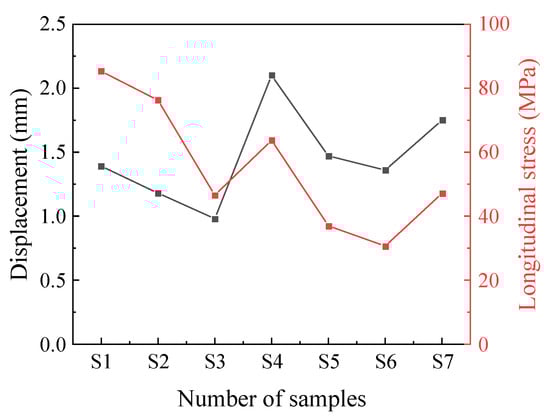
Figure 15.
Stage-wise maxima of vertical displacement and vertical stress.
3.3. Crack Patterns, DIC Strain Fields, and Numerical Plastic-Zone
Figure 16 juxtaposes five diagnostics for seven samples at failure: the photographed crack map, DIC-derived strain fields, and the distribution of plastic zone from FLAC3D. In the crack panels, red dashed lines trace the observed fracture trajectories and their extensions, while white dashed circular frames highlight zones of surface rock spalling immediately visible on the specimen face. These resolve the stage-dependent failure mechanisms and provide cross-validation between surface kinematics and volumetric yielding.
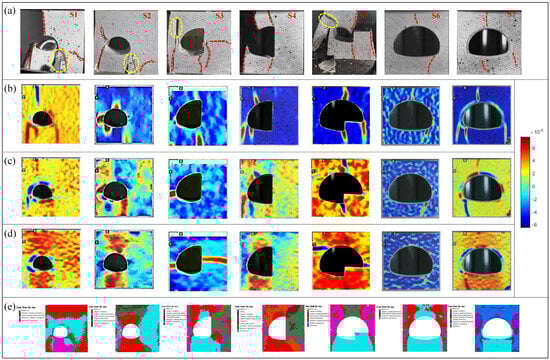
Figure 16.
Surface cracks, DIC strain fields, and numerical plasticity by stage. (a) Surface crack map with red dashed lines tracing crack paths and yellow dashed circles marking spalling zones. (b) DIC horizontal strain. (c) DIC vertical strain. (d) DIC equivalent strain. (e) FLAC3D plastic-zone distribution. Here, the DIC strain fields represent in-plane engineering strain components computed from spatial gradients of the measured surface displacement field. Horizontal strain and vertical strain denote the normal strains along the horizontal and vertical directions on the specimen surface, respectively, and equivalent strain is used to highlight strain localization intensity.
Macrocracks nucleate at geometric stress raisers and then organize along the stage-specific load paths. For S1, the lining exhibits a through-thickness fracture at the haunch, effectively separating the ring into upper and lower segments that remain otherwise relatively intact. Rock spalling is circled near the fracture vicinity and along adjacent intrados patches, indicating local detachment where bending and shear concentrate. The overall crack network in the surrounding rock is short and discontinuous, consistent with the confining action of the lining: localization initiates at the haunch, but ring continuity limits further coalescence.
Under asymmetric excavation, cracking initiates at the active shoulder/haunch and springline and then propagates obliquely toward the crown—on the left in S3 and on the right in S5—consistent with the tilted load paths and the DIC-identified strain hot spots. When the left half closes (S4), the overall network becomes shorter and more dispersed, indicating that transient arching delays the formation of throughgoing connectivity; nevertheless, the dominant failure in S4 is a throughgoing vertical crack along the right sidewall, accompanied by two oblique branches: one emanating from the left shoulder toward the upper-left sector of the surrounding rock, and another from the left springing toward the lower-left corner of the opening. These trajectories (marked by red dashed lines) and the circled surface spalling zones (marked by white dashed rings) are shown in Figure 16a.
Complementing the crack maps, the DIC strain fields and the FLAC3D plasticity provide a stage-by-stage kinematic–volumetric diagnosis for S1–S7. In S1, DIC shows short, toe-adjacent concentrations—horizontal strain indicating restrained wall dilation and vertical strain showing limited intrados tension—while the plastic-zone clusters locally near the haunch/springline, consistent with ring confinement. In S2, sidewall dilation becomes continuous in DIC (positive horizontal strain bands), and the plastic zone elongates vertically along the walls. In S3, DIC reveals a dominant oblique hot band from the left shoulder toward the crown (horizontal strain for tensile splitting; vertical strain for intrados flexure), which aligns with a continuous plastic corridor in the model. When the left half closes (S4), the crack network becomes shorter and more dispersed, indicating that transient arching delays the formation of throughgoing connectivity. Advancing to S5, DIC detects a mirrored oblique band on the right that again co-locates with a continuous plastic corridor. In S6, the DIC fields split into two thinner, more symmetric belts anchored at shoulders/haunches, echoed by a broader but less intense plastic distribution. Finally, in S7, DIC concentrates near the lining’s toes and shoulders with high discontinuity, and the plastic-zone shifts into shoulder-focused lobes, reflecting circumferential load sharing and side-arch stress channels. Across all stages, the co-location of DIC strain concentrations and plastic clusters substantiates the identified failure pathways and their evolution with the excavation sequence.
3.4. Targeted Support via Numerical Simulation for Weak Stages
Building on the documented non-monotonic stability during expansion, we propose a selective countermeasure focused on S3 and S5, which flank the S4 rebound and consistently emerge as weak links in both tests and simulations. Although stability is relatively poor at S6, we do not detail this stage because lining is installed immediately after the full expansion, providing prompt stabilization. Two numerical models were constructed under the same geometry, loading and rock parameters as the baseline S3 and S5 cases. The only change is the introduction of grouted rock-bolt support, configured as in Figure 17a for S3 and Figure 17b for S5. Rock properties remain unchanged; bolt and grout parameters are given in Table 3. The Young’s modulus of 200 GPa and density of 7850 kg·m−3 correspond to the steel bar material, ensuring realistic stiffness and inertial properties. The cross-sectional area A = 1.96 × 10⁻⁴ m2 represents a conventional 16 mm diameter rebar, which is commonly adopted in Chinese tunnel reinforcement practice. The ultimate tensile strength σt = 0.8 GPa, and the grout–rock interaction is described by the normal stiffness kG = 4 × 10¹⁰ N/m/m, cohesion cG = 3 MPa, and friction angle φG = 30°. The effective grout perimeter pG = 0.14 m reflects the circumferential contact length in the model. Monitoring points are placed at the crown (geometric highest point) and invert (geometric lowest point) for displacement histories, and global outputs include the plastic-zone fraction, displacement and contour maps of vertical displacement.
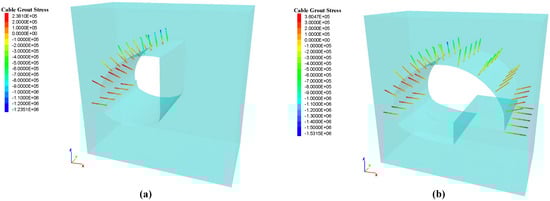
Figure 17.
Axial stress mobilization in grouted bolts at peak load. (a) Bolt grout stress in stage S3 and (b) bolt grout stress in stage S5.
Table 3.
Physical and mechanical properties of bolt in the numerical models.
Figure 17 maps the axial stress in the grouted bolts at the critical load. In S3 (Figure 17a), the crown bolts are in compression, and the axial state transitions to tension toward the haunch/springline: the maximum compressive bolt stress at the crown is 1.24 MPa, whereas the tensile stress near the springline reaches 0.24 MPa. S5 follows the same pattern with higher demand: 1.53 MPa in compression at the crown and 0.36 MPa in tension near the springline. This sign change along the bolt line is mechanically consistent with the stage-dependent load path. Roof bending at the crown drives local shortening of the bolt–grout composite, while lateral dilation and opening along the active sidewall mobilize tension in bolts anchored in the shoulder–haunch corridor. Although compressive peaks at the crown can be numerically larger, the stabilizing contribution is governed by tensile engagement: grouted bolts are tension members, and their primary effect is to bridge potential opening/shear planes, increase normal stress across developing discontinuities, and pin the oblique failure corridor identified by DIC and plasticity. In both S3 and S5, the zones of tensile mobilization coincide with the wall-dilation hot spots, which explains the observed reductions in wall opening, the suppression of invert heave, and the fragmentation of shear bands when bolts are installed. Design-wise, these results emphasize prioritizing tensile capacity and bond strength in the shoulder–haunch region (embedment length and bond shear strength), while recognizing that crown compression in the bolts mainly reflects local bending and provides only a secondary, dowel-like confinement effect.
Figure 18 compares the evolution of the plastic-zone fraction before and after bolt installation at the two weak stages. For S3, the peak plastic-zone fraction decreases from 86.32% (unreinforced) to 71.59% (reinforced), a drop of 14.73 percentage points. For S5, the peak plastic-zone fraction decreases from 76.43% to 71.68%, corresponding to a reduction of 4.75 percentage points. These reductions demonstrate that grouted bolts are effective in confining the active shoulder–haunch corridor, restraining wall dilation and opening, and interrupting the coalescence of plastic bands. In practical terms, a smaller stabilized plastic-zone fraction indicates that yielding is more localized and less connected, the onset of widespread plasticization is delayed, and stress is more efficiently redistributed along side-arches—thereby improving the stability margin during the S3 and S5 steps.
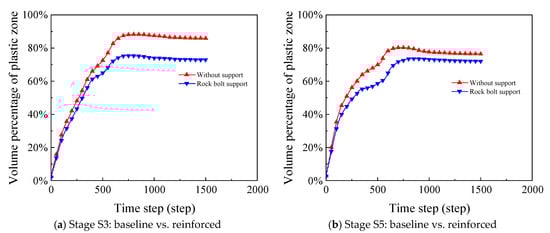
Figure 18.
Plastic-zone fraction with and without grouted bolts. (a) S3 and (b) S5.
Figure 19a,b contrasts S3 and S5 before/after bolting in terms of displacement histories and contours. Bolts deliver a clear settlement-control benefit at the crown. In the displacement maps, the previously continuous settlement basin above the opening is broken into discontinuous patches; the regular “settlement arch” collapses into a smaller, irregular cap confined near the crown. This reflects the way grouted bolts pin the shoulder–haunch corridor, suppress sidewall dilation and opening, and reconstitute partial ring closure on the active side, thereby shortening the settlement influence zone and interrupting the shear-driven flow of vertical deformation. By contrast, the improvement in invert heave is modest, which is consistent with the mechanism: the adopted scheme primarily stiffens the shoulder–haunch–roof path; it does not provide direct thrust or tie action at the invert, so the base responds mainly to the residual lateral dilation produced by the enlarged span.
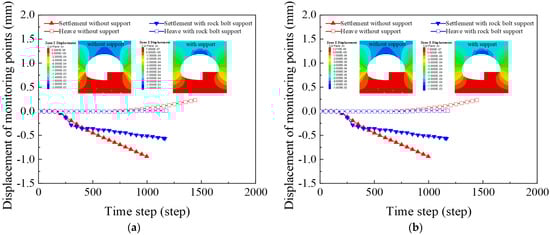
Figure 19.
Displacement response with and without grouted bolts: histories and contours. (a) Crown settlement and heave history with displacement contour at failure for S3 with and without support. (b) Crown settlement and heave history with displacement contour at failure for S5 with and without support.
Quantitatively, the peak crown settlement in S3 decreases from 1.06 mm (no bolts) to 0.34 mm (with bolts), and in S5 from 0.93 mm to 0.54 mm. The peak invert heave reduces from 0.19 mm to 0.11 mm in S3, and from 0.24 mm to 0.16 mm in S5. These reductions are mirrored in the bar chart of Figure 20, which summarizes the percentage gains across three indicators—plastic-zone volume fraction, crown settlement, and invert heave. For S3, the decreases are 17.07%, 68.22%, and 41.87%, respectively; for S5, they are 6.22%, 41.49%, and 34.55%. Taken together, Figure 19 and Figure 20 show that grouted bolts are most effective in confining the crown settlement field and fragmenting the localization corridors, with a secondary but still meaningful effect on limiting invert heave. This pattern is fully consistent with the axial state of bolts (Figure 17), where tensile mobilization near the shoulder–haunch governs the stabilizing action.
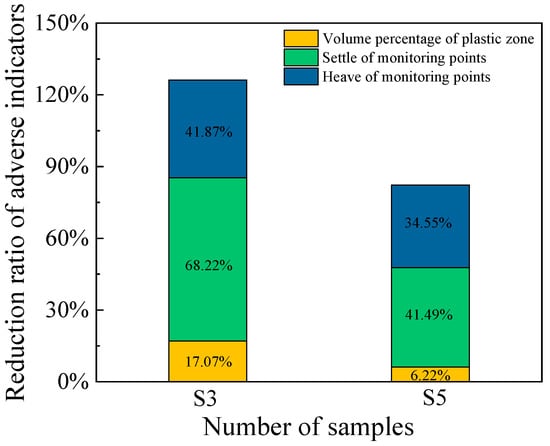
Figure 20.
Aggregated benefit of grouted bolts for stages S3 and S5: percentage reductions in plastic-zone fraction, crown settlement, and invert heave.
4. Conclusions
This study investigates the stage-dependent stability evolution during in situ tunnel expansion by integrating physical model tests and numerical simulations. The results demonstrate that stability does not degrade monotonically with increasing span; instead, it follows a non-monotonic trajectory governed by the excavation sequence, transient arching, and rock–lining interaction. The main conclusions are as follows:
(1) The physical model tests confirm a non-monotonic stability trajectory during staged expansion. The peak load drops markedly at unilateral excavation stages (notably S3 and S5), exhibits a temporary recovery at the left-half closure stage (S4), and partially regains after relining (S7). This pattern challenges the conventional assumption of monotonic weakening during enlargement.
(2) Numerical simulations reproduce the observed stage dependence and clarify the governing mechanisms. In terms of the peak plastic-zone fraction, the yielding extent reaches 86.32% at stage S3, decreases to 74.03% at stage S4, and increases again to 76.43% at stage S5, confirming a non-monotonic evolution. The temporary recovery at S4 is attributed to stress redistribution and transient arching, whereas the deterioration at S3 and S5 is dominated by eccentric load-transfer paths and the activation of a connected shoulder–haunch localization corridor.
(3) Targeted bolt reinforcement applied at the identified weak stages (S3 and S5) effectively improves stability. For S3, the peak plastic-zone fraction decreases by 14.73 percentage points, and crown settlement is reduced by 68%; for S5, reductions of 4.75 percentage points and 41% are achieved. Beyond the specific layouts tested here, these results support a general, decision-oriented implication: reinforcement should be prioritized at stages where localization indicators (e.g., DIC strain hot-spots and the peak plastic-zone fraction) signal the formation and coalescence of dominant plastic/shear bands.
(4) The findings provide mechanistic evidence and practical guidance for tunnel widening projects using staged excavation (e.g., CD/benching sequences). Overall, the stability margin is controlled by stage-specific geometry–load-path coupling rather than span increase alone. Therefore, planning should emphasize stage-based risk screening and support allocation. In practice, reinforcement should be prioritized for unilateral excavation steps that promote eccentric load paths and shoulder–haunch localization (e.g., S3 and S5). Baseline support is typically sufficient for closure/arching-promoting steps (e.g., S4), and integrity-focused relining should be ensured in the finalization stage (e.g., S7). Reinforcement intensity should be calibrated to site-specific geology, stress conditions, and construction constraints.
Author Contributions
Conceptualization, X.H. and M.H.; methodology, X.H., Z.Y. and M.W.; software, X.H., M.H. and Z.Y.; validation, X.H., J.Z. and X.D.; formal analysis, X.H., M.H. and Z.J.; investigation, X.H., M.H. and Z.Y.; resources, X.H., M.H. and M.W.; data curation, X.H., M.H. and Z.Y.; writing—original draft preparation, X.H. and M.H.; writing—review and editing, X.H., M.H. and Z.Y.; project administration, X.H., M.H. and M.W.; funding acquisition, X.H., M.H. and Z.J. All authors have read and agreed to the published version of the manuscript.
Funding
This study has been partially funded by the National Key R&D Program of China (No. 2024YFF0507903) and the National Natural Science Foundation of China (Grant No. 52379114).
Data Availability Statement
The original contributions presented in the study are included in the article; further inquiries can be directed to the corresponding author.
Acknowledgments
The authors thank the National Key R&D Program of China and the National Natural Science Foundation of China for funding the publication.
Conflicts of Interest
Authors Xiaochuan Han, Zhonggang Ji, Meng Wang, Jinpeng Zhu and Xiaoliang Dong were employed by the company Shandong Hi-Speed Infrastructure Construction Co., Ltd. and Shandong Hi-Speed South Ring Expressway Co., Ltd. The remaining authors declare that the research was conducted in the absence of any commercial or financial relationships that could be construed as a potential conflict of interest.
References
- Tu, S.Q.; Li, W.; Zhang, C.P.; Chen, W. Effect of inclined layered soils on face stability in shield tunneling based on limit analysis. Tunn. Undergr. Space Technol. 2022, 131, 104773. [Google Scholar] [CrossRef]
- Li, W.J.; Bai, X.W.; Yang, D.; Hou, Y. Maritime connectivity, transport infrastructure expansion and economic growth: A global perspective. Transp. Res. Part A Policy Pract. 2023, 170, 103609. [Google Scholar] [CrossRef]
- International Transport Forum. ITF Transport Outlook 2023; OECD Publishing: Paris, France, 2023; Available online: https://www.itf-oecd.org/itf-transport-outlook-2023 (accessed on 16 March 2026).
- Anupriya, N.; Bansal, P.; Graham, D.J. Congestion in cities: Can road capacity expansions provide a solution? Transp. Res. Part A Policy Pract. 2023, 174, 103726. [Google Scholar] [CrossRef]
- Huang, L.Z.; Jakobsen, P.D.; Bohne, R.A.; Liu, Y.P.; Bruland, A.; Manquehual, C.J. The environmental impact of rock support for road tunnels: The experience of Norway. Sci. Total Environ. 2020, 712, 136421. [Google Scholar] [CrossRef]
- Lee, J.; Rehman, H.; Naji, A.M.; Kim, J.J.H.; Yoo, H.K. An empirical approach for tunnel support design through Q and RMi systems in fractured rock mass. Appl. Sci. 2018, 8, 2659. [Google Scholar] [CrossRef]
- Li, H.; Lai, Y.M.; Wu, L.Z. Failure mechanism of deep-buried tunnel surrounding rock-lining system: Physical model tests and numerical investigation. Transp. Geotech. 2025, 54, 101615. [Google Scholar] [CrossRef]
- Han, D.Y.; Zhong, X.W.; Liu, L.; Cui, H.; Li, D.; Yan, Z.; Chen, X.; Yan, J. Study on the construction method for in-situ expansion of existing large cross-section tunnels. Discov. Appl. Sci. 2025, 7, 556. [Google Scholar] [CrossRef]
- Chen, C.N.; Huang, W.Y.; Tseng, C.T. Stress redistribution and ground arch development during tunneling. Tunn. Undergr. Space Technol. 2011, 26, 228–235. [Google Scholar] [CrossRef]
- Sun, Y.; Xu, S.; Xu, C.J.; Huang, W.J.; He, J.G.; Rong, Y.; Zheng, F.Q.; Ding, L.L. Study on the stress and deformation of surrounding rock and support structure of super large section tunnels based on different excavation methods. Appl. Sci. 2024, 14, 7025. [Google Scholar] [CrossRef]
- Duan, B.W.; Yang, J. Study on mechanical effect and plastic-zone distribution of tunnel surrounding rock in the presence of various expansion approaches. Adv. Civ. Eng. 2023, 2023, 7974380. [Google Scholar] [CrossRef]
- Yang, S.Q.; Chen, M.; Fang, G.; Wang, Y.C.; Meng, B.; Li, Y.H.; Jing, H.W. Physical experiment and numerical modelling of tunnel excavation in slanted upper-soft and lower-hard strata. Tunn. Undergr. Space Technol. 2018, 82, 248–264. [Google Scholar] [CrossRef]
- Lin, P.; Liu, H.Y.; Zhou, W.Y. Experimental study on failure behaviour of deep tunnels under high in-situ stresses. Tunn. Undergr. Space Technol. 2015, 46, 28–45. [Google Scholar] [CrossRef]
- Khan, B.; Jamil, S.M.; Kim, J.J.; Jafri, T.H.; Akhtar, K. Effects of different empirical tunnel design approaches on rock mass behavior during tunnel widening. Heliyon 2019, 5, e02944. [Google Scholar] [CrossRef] [PubMed]
- Zhang, S.W.; Wang, L.; Han, G.H.; Guo, Z.Y. The effectiveness of route guidance for expressway reconstruction and expansion projects. Int. J. Transp. Sci. Technol. 2024, 18, 193–206. [Google Scholar] [CrossRef]
- Rehman, H.; Naji, A.M.; Kim, J.; Yoo, H. Extension of tunnelling quality index and rock mass rating systems for tunnel support design through back calculations in highly stressed jointed rock mass: An empirical approach based on tunneling data from Himalaya. Tunn. Undergr. Space Technol. 2019, 85, 29–42. [Google Scholar] [CrossRef]
- Lee, C.H.; Chiu, C.H. Tunnel enlarging methods and case study. In Tunnelling into a Sustainable Future—Methods and Technologies; CRC Press: London, UK, 2025; pp. 1579–1586. [Google Scholar] [CrossRef]
- Ziebarth, R.A.; Corkum, A.G. Probabilistic Approach for Q-based Ground Support Design. Comput. Geotech. 2024, 176, 106779. [Google Scholar] [CrossRef]
- Kong, D.; Sen, T.; Jian, S.; Zhao, M.K.; Deng, M.X. Analytical model for tunnel face stability in composite strata considering the arching effect. Int. J. Geomech. 2024, 24, 04024277. [Google Scholar] [CrossRef]
- Lei, M.F.; Peng, L.M.; Shi, C.H. Model test to investigate the failure mechanisms and lining stress characteristics of shallow buried tunnels under unsymmetrical loading. Tunn. Undergr. Space Technol. 2015, 46, 64–75. [Google Scholar] [CrossRef]
- Huang, F.; Zhu, H.H.; Xu, Q.W.; Cai, Y.C.; Zhuang, X.Y. The effect of weak interlayer on the failure pattern of rock mass around tunnel—Scaled model tests and numerical analysis. Tunn. Undergr. Space Technol. 2013, 35, 207–218. [Google Scholar] [CrossRef]
- Liu, Y.; Zhang, Z.S.; Liu, Z.Y.; Xue, J.F. The effects of undercrossing tunnelling on the settlement of footings subjected to cyclic loading. Tunn. Undergr. Space Technol. 2023, 132, 104792. [Google Scholar] [CrossRef]
- Zhou, X.; Chen, H.; Zhou, Y.; Hou, L.; Wang, J.; Du, S. Measured Spatiotemporal Development and Environmental Implications of Ground Settlement and Carbon Emissions Induced by Sequential Twin-Tunnel Shield Excavation. Buildings 2026, 16, 25. [Google Scholar] [CrossRef]
- Zheng, S.; Xie, X.; Zhou, B. Accounting Method and Indicators of Multilevel CO2 Emissions Based on Cost During Construction of Shield Tunnels. Appl. Sci. 2024, 14, 9552. [Google Scholar] [CrossRef]
- Shi, X.; Kou, L.; Liang, H.; Wang, Y.; Li, W. Evaluating Carbon Emissions during Slurry Shield Tunneling for Sustainable Management Utilizing a Hybrid Life-Cycle Assessment Approach. Sustainability 2024, 16, 2702. [Google Scholar] [CrossRef]


Disclaimer/Publisher’s Note: The statements, opinions and data contained in all publications are solely those of the individual author(s) and contributor(s) and not of MDPI and/or the editor(s). MDPI and/or the editor(s) disclaim responsibility for any injury to people or property resulting from any ideas, methods, instructions or products referred to in the content. |
© 2026 by the authors. Licensee MDPI, Basel, Switzerland. This article is an open access article distributed under the terms and conditions of the Creative Commons Attribution (CC BY) license.