Abstract
Squeezed branch piles, originally developed for building and bridge foundations, have been downsized and deployed at larger pile spacing for reinforcing embankments over soft soils. However, the working mechanism of squeezed branch pile-supported embankments remains unclear. In this study, a three-dimensional numerical model of this embankment was established based on field tests. The analyses consider different pile types (squeezed branch piles and straight piles) and pile-head structures (beam-type cap and plate-type cap). These concrete components were modeled utilizing an advanced concrete model, which captures the strain-softening/hardening and yielding behavior. Simulation results show that squeezed branch piles provide better settlement control in the subsoil beneath the embankment than straight piles for the studied cases. The beam-type cap with squeezed branch piles behaves as a pile-beam foundation that reduces maximum settlement by around 38% compared to that of the plate-type cap, while the plate-type cap system functions as a composite foundation that enhances surcharge capacity by about 35–40%. The instability of the embankment is driven by tensile failure in concrete: The beam-type cap leads to a localized failure along the ground beam, and the plate-type cap system induces a progressive failure centered on the squeezed branch piles. Within the plate-type cap, the dimensions of the pile-head plate significantly influence settlement control and the stability of the embankment in soft soil.
1. Introduction
The intensification of economic development in coastal and riverbank regions has led to the construction of numerous embankments on soft soil foundations. Rigid pile-supported embankments (RPSEs), typically incorporating concrete as rigid inclusions, are widely adopted for highways in China [1,2]. The advantages, including rapid construction, high strength and stiffness, and strong adaptability, result in effective control of settlement and stability. However, when deep or multi-layered soft deposits are encountered, conventional straight piles (SPs) often require excessive length to penetrate the soft strata [3]. The increased pile length (l) amplifies the expense and the structural demands on rigid piles. In recent years, incidents involving large deformations and instability of RPSEs have occasionally been reported [2,4], posing ongoing challenges. In response, special-shaped piles, such as X-section pile [5], screw pile [6,7], and nodular pile [8,9], have been introduced as alternatives to SPs to improve the performance of RPSEs in soft soils. The squeezed branch pile (SBP), a cast-in-place special-shaped pile, is formed by hydraulically expanding the pile shaft to create branches and plates [10,11]. Traditionally used for pile foundations in industrial and offshore structures, SBPs have been miniaturized for application in RPSEs, featuring a smaller pile diameter (d = 0.4 to 0.6 m) and larger pile spacing (Sp = 3 to 4 m) [12].
Prior studies have investigated the bearing capacity of SBPs through field tests [13,14], model tests [15,16,17], and numerical simulations [11,18,19]. For instance, Li [18] conducted field measurements and numerical simulations, revealing that the ultimate bearing capacity of SBPs was 9 to 300% higher than that of SPs. The dimensions and number of plates influenced the load capacity of SBPs, as these branches distributed the loads to stiffer and deeper strata [11]. Regarding lateral performance, SBPs also exhibit superior horizontal bearing capacity. Under combined loading conditions, their lateral capacity has been reported to be 12 to 56% greater than that of SPs [16,20]. The presence of plates or branches locally increases the pile diameter d, which enhances its flexural rigidity. As the pile undergoes lateral displacement, the branch or plate rotates integrally with the pile shaft, generating resisting moments.
The load tests highlight the greater bearing capacity of individual SBPs; the responses of SBPs beneath embankments have not been sufficiently explored. Embankment loading is flexible, comprising both vertical and horizontal loads that differ from rigid loading conditions [21]. Moreover, the enlarged branches of SBPs typically necessitate a wider Sp, which in turn demands a properly designed pile-head structure to transfer embankment load across the spaced piles. While the behavior of pile-head structures in conventional RPSEs is generally well-understood [1,2,21], there remains a research gap regarding the pile-head structures (Figure 1) of SBPs, where the distinction between the beam-type cap and the plate-type cap for SBPSEs has not been clearly distinguished. The beam-type cap is a continuous, strip-like concrete element that interconnects a row of piles [2,22,23]. For instance, in full-scale tests on the Chaoshan Ring Expressway, Liu [24] reported that squeezed branch pile-supported embankment (SBPSE) with a beam-type cap, employing a wider spacing (Sp = 4.0 m), outperformed capped pipe piles with tighter spacing (Sp = 2.8 m) in load bearing. The plate-type cap is conceptualized as an enlarged, branch-shaped section formed at the pile head. It functions as a built-in pile cap, and Li [25] observed that SBPSE with a plate-type cap exhibited improved load distribution, with 70% of the load being carried by the piles. In the SBPSEs system, the miniaturized SBPs makes the pile-head structure decisive for raising the replacement ratio. Therefore, clarifying the role of pile-head structure is urgent.
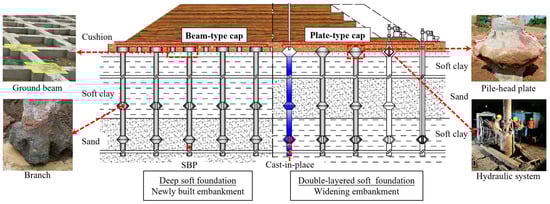
Figure 1.
Application of SBPs in embankment construction.
Numerical modeling is routinely used to analyze RPSEs on soft deposits. In many simulations, concrete has been idealized as an elastic–perfectly plastic material (i.e., Mohr–Coulomb model, MC), a simplification that contradicts the brittle and tension-weak nature of concrete. This idealization may lead to overestimation in considering the failure behavior of the embankment or its overall instability. Recently, several researchers have incorporated failure-aware concrete models for rigid inclusions [26]. Specifically, Zheng [4] and Xia [27] developed a damage–plasticity fracture model that considers the brittle failure and frictional properties of concrete, highlighting the progressive failure of RPSEs triggered by the bending failure of the toe pile. Similarly, Ma [28] proposed an MC-based tension crack model in consideration of the crack-induced stress release in plain concrete pile. For the SBPSEs, the branches along the pile shaft subject the piles to a more complex stress state. The post-cracking behavior of SBPs and the overall instability would be considerably different. An advanced model that can replicate crack propagation and the strain-softening of concrete is essential for evaluating the bearing performance of SBPSEs.
This study employs three-dimensional finite-element analysis in PLAXIS 3D to evaluate the load responses and failure mechanisms of SBPSEs. Two practical pile-head structures are examined: the beam-type cap and the plate-type cap. An advanced concrete model (CM) that permits yielding and strain-softening/hardening is adopted for both SBPs and pile-head structures. The parameters of the CM are calibrated against the three-point bending tests (3PBTs) and uniaxial compression strength tests (UCSTs) from the literature. The SBPSE model is established and validated against the field tests from a full-scale embankment project in a soft soil region. The specific objectives are as follows:
- To compare the settlement uz and load transferring of SBPSEs with two types of pile-head structures in the construction state and the surcharge state;
- To elucidate the internal responses and failure modes of SBPSEs, and identify the trigger points and key members in the instability process;
- To develop recommendations for the diameter ratio (ξ) of the pile-head plate within the plate-type cap. ξ is defined as the ratio of the branch diameter (D) to d.
This work aims to provide insights for the implementation of SBPSEs in soft deposits, with the outcomes expected to clarify their working mechanism and offer effective layout strategies.
2. Constitutive Model for Concrete
2.1. Failure Criterion and Softening/Hardening Mechanisms
The nonlinear concrete model CM, initially developed by Schädlch [29] to simulate the behavior of shotcrete in tunneling, has since been validated for applications in pile foundations and soil reinforcement [30,31]. As an elastoplastic model, the CM simultaneously captures strain-hardening and softening under both compression and tension. Unlike an elastic–perfectly plastic model, the CM effectively represents the complex material responses of concrete under these stress states. A key advantage is its incorporation of tensile failure and post-yielding behavior, which describe the degradation of stiffness and strength after cracking. These features are crucial for simulating the behavior of concrete elements within an RPSE.
For the failure criterion, the CM employed two yield surfaces [29,32]: a Mohr–Coulomb surface for compression (Fc, red line) and a Rankine surface for tension (Ft, blue line), depicted in Figure 2. The activation of these yield surfaces follows a bifurcated stress criterion: when the major principal stress σ1 reaches the tensile strength of concrete (ft). Compressive-shear plastic flow occurs when the minor principal stress (σ3) is sufficiently high so that the stress state (σ1, σ3) satisfies the Mohr–Coulomb yield criterion. The σrot defines the intersection of the MC failure envelope with the x-axis. This intersection point serves as a fixed anchor for the envelope during the isotropic hardening or softening process and is determined by the compressive strength of concrete (fc) and the maximum friction angle (φmax).
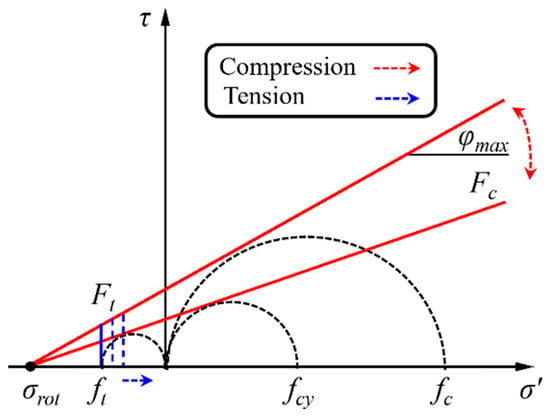
Figure 2.
Yield surfaces of the concrete model CM.
The softening and hardening behavior of the concrete is governed by the evolution of this failure criterion. Specifically, the contraction/expansion of the yield surfaces (Figure 2) lead to hardening/softening variations in normalized stress–strain curves [29,32], as shown in Figure 3. This process is controlled by the normalized compression hardening parameter (Hc) and the normalized tension hardening parameter (Ht). The parameters define as Hc = / and Ht = /, where is the minor (compressive) principal plastic strain and is the plastic peak strain in uniaxial compression, and is the major (tensile) principal plastic strain and is the plastic peak strain in uniaxial tension.
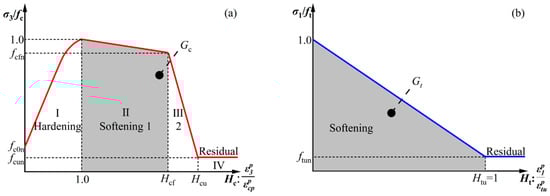
Figure 3.
Normalized stress–strain curves of CM for: (a) compression; (b) tension.
The normalized stress–strain curve [32] for compression is shown in Figure 3, which is characterized by four divisions. Division I (Initial Strain-Hardening): The stress–strain curve follows a quadratic Equation (1) until peak fc is reached, at which point Hc = 1. Divisions II and III (Bilinear Strain-Softening): In Division II, the initial linear descent (Equation (2)) reduces the normalized strength σ3/fc to a normalized failure strength (fcfn) at Hc = Hcf, with the softening process governed by the compressive fracture energy (Gc) of concrete. The subsequent Division III is described by Equation (3), ultimately reaching the normalized residual strength (fcun) when Hc = Hcu. Division IV (Residual Strength): The curve maintains a constant level at fc·ftun with no further softening.
The normalized stress–strain behavior in tension [32] is illustrated in Figure 3b. The tensile behavior of concrete is linear–elastic until the ft is reached. Subsequent linear softening is governed by the parameter Ht, with post-peak tensile strength expressed in Equation (4). Once Ht reaches a value of 1, the degradation of tensile strength concludes, resulting in complete tensile failure of concrete with a constant residual to peak strength ratio ftun.
2.2. Parameter Determination and Calibration
The selection of parameters for the concrete model CM in this study synthesizes recommendations from the existing literature and the guidelines provided in the PLAXIS 3D manual CONNECT Edition V20 [32]. The CM parameters adopted for C30 concrete (C30/37 in Eurocode2 [33] and 4000 psi in the American Concrete Institute (ACI) standard [34]) are summarized in Table 1. This concrete grade is widely used for cast-in-place piles in RPSEs [4,26] and is the focus of the present study.

Table 1.
Parameter determination for C30 concrete in CM.
Based on compressive tests and practical applications [35,41,42], the uniaxial compressive strength (fc,28) of C30 concrete was set at 35.5 MPa. The Young’s modulus (E28) of concrete was calculated as 25.7 GPa using empirical formulas [32,34]. Among the normalized parameters influencing the compression process, the values for fc0n, fcfn and fcun were taken as 0.25, 0.10 and 0.05, respectively. The fracture energy Gc, reflecting initial softening in Division II, was assigned a value of 33 kN/m for C30 concrete. While this value is within the range recommended by the PLAXIS manual [32], it lies at the lower bound. This is because the material state of the fully cured concrete considered here differs from that of the shotcrete for which the PLAXIS recommendations are primarily intended. For tensile strength, existing studies [37] suggest that the uniaxial tensile strength ft,28 typically ranges from 10 to 11% of the uniaxial compressive strength. Accordingly, ft,28 was set to 4460 kPa. The residual to peak tensile strength ftun was set to 0, following the PLAXIS manual [32]. The tensile fracture energy Gt, which is quantitatively related to Gc and ft, was taken as 0.065. Since this study focused on the failure of concrete piles after complete curing, the shrinkage of concrete, while occurring during the early hardening phases, was excluded from the analysis. Although time-dependent effects are relevant for modeling embankment response over time, the impact of creep on concrete was simplified in this analysis. Time-dependent effects such as creep and shrinkage were considered negligible and thus excluded from the analysis. The was calculated based on the Gt and the characteristic element length. For C30 concrete, this value is typically assigned as −0.001 [37,40].
A numerical model was developed using the refined CM parameters from Table 1 to replicate the standard concrete tests: the unconfined compression strength test UCST and the three-point bending test 3PBT. The simulation results were then compared with both the experimental data and predictions from a Mohr–Coulomb model MC considering tension cut-off. For a consistent comparison, only the concrete constitutive model was switched between the two simulations. The cohesion (c) for the MC was calculated using c = fc,28 (1 − sin φmax)/2cos φmax. The experimental benchmarks used for validation comprised a UCST conducted by Lim and Ozbakkaloglu [41] and a notched 3PBT performed by Lehký [35]. The geometries of the corresponding finite-element models are depicted in Figure 4. The meshes for both concrete specimen simulations were uniformly meshed with a medium level of coarseness, resulting in approximately 9000 nodes for each set.
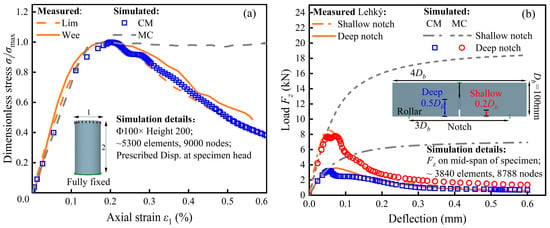
Figure 4.
Numerical calculations against experimental data: (a) UCSTs; (b) 3PBTs [31,41,43].
Figure 4a compares the experimental and the numerical stress–strain curves from the UCSTs. The stress is presented in the dimensionless form σi/σmax, where the σi is the instantaneous stress and σmax is the peak stress obtained from the tests. As shown in Figure 4a, the prediction of the proposed CM agrees well with the experimental strain–stress curves [41,43]. In contrast, the stress–strain curve from the MC plateaus when the axial strain (ε1) exceeds 0.2, indicating that it does not capture the post-peak softening behavior of concrete.
The 3PBT is commonly employed to evaluate the tensile stress and the fracture properties of concrete under bending [4]. Figure 4b compares the mid-span load–deflection curves of notched concrete beams obtained from the CM and MC against experimental data [35]. The y-axis represents the mid-span vertical force (Fz). The validation considered concrete specimens with two notch depths: a long notch of 0.5Db and a short notch of 0.20Db, where Db represents the beam width of 100 mm. The notch width complies with Eurocode 2 [33]. The CM reasonably reproduces both the peak and post-peak load–deflection responses for both specimen types. In contrast, the MC with a tension cut-off fails to replicate the structural deterioration at larger deflections. This deficiency leads to an overestimation of the flexural capacity of concrete piles within the RPSEs at ultimate limit state.
Figure 5a,b display the deformed mesh and the contours of deviatoric strain (γs) from the UCST simulation using both the MC and CM. During uniaxial compression, concrete specimens typically develop a distinct slant shear band. However, the MC fails to adequately capture this shear localization, resulting in a failure pattern that deviates from the physical observations [43]. By accounting for the strain-softening behavior, the CM produces a more pronounced and realistic shear band within the concrete specimens. The contours of γs of notched specimens obtained numerically and experimentally in the 3PBTs are compared in Figure 5c. The proposed CM adequately captures the potential crack path, as both the magnitude of γs and strain localization at the notch closely align with experimental observations [35]. These comparisons confirm that the CM, with its refined parameters for C30 concrete, is capable of simulating the strain-softening behavior and crack development.
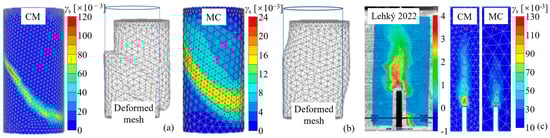
Figure 5.
Comparison of γs contours: (a) CM in UCSTs; (b) MC in UCSTs; (c) shallow notched 3PBTs [35].
3. Numerical Modeling of Squeezed Branch Pile-Supported Embankment SBPSE
3.1. Test Site
The numerical model of embankment in this study is grounded in full-scale field tests of SBPSEs conducted at the Xilu [44] and Hexi [24] interchanges along the Chaoshan Ring Expressway in Guangdong Province, China, as shown in Figure 6. The test sites were originally riverside paddy fields with a dense river network and a high groundwater table. Borehole data indicate that the subsurface profile, down to a depth of 35 m, primarily consists of soft deposits, with no bedrock encountered within this range. This foundation clay is interlayered with sandy strata, forming a multi-layered soft soil profile. This stratified condition provides favorable layers for the formation of the branches.
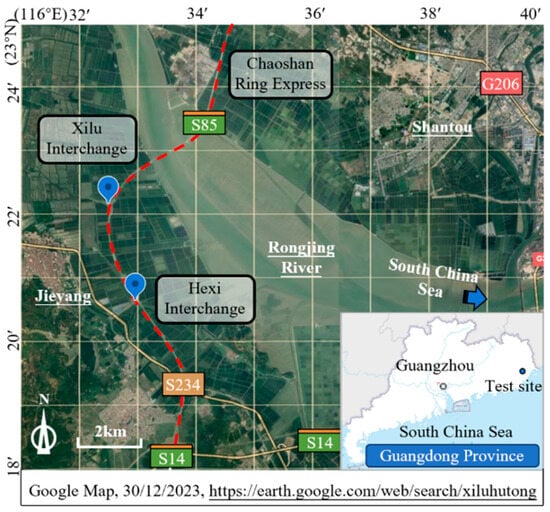
Figure 6.
Location of SBPSE test sites in Guangdong Province, China.
The soil stratification and properties are illustrated in Figure 7. The tip resistance (qc) and sleeve friction (fs) were obtained from the in-situ cone penetration test (CPT). The initial void ratio (e0) and water content (w) were referenced from previous studies [24,44]. The compression index Cc for the foundation clay was calibrated using empirical correlations based on e0, w and qc [45,46,47], supplementing the limited number of oedometer tests conducted on site. The in situ SBPSE utilized SBPs integrated with the beam-type caps to support the embankment [24,44]. The fill height (He) of the SBPSEs within the test section of these two interchanges ranged between 4.0 m and 6.0 m. The SBPs had a total length of 32.8 m, with a shaft diameter d of 0.6 m and branch diameter D of 1.4 m. These piles were arranged in an equilateral triangular pattern with a wider pile spacing Sp of 4.0 m. A ‘one-branch–three-plate’ configuration was adopted for SBPs: The center elevation of the 6-star branch was −20.0 m, and the lower plates were embedded in sand and clay strata. For the beam-type cap, the connecting beam had a rectangular cross-section of 0.6 m × 0.6 m and was locally enlarged to form a circular cap with a diameter of 2.0 m at the pile head. A 0.6 m thick cushion layer was placed in the gaps between adjacent beams as well as on top of them.
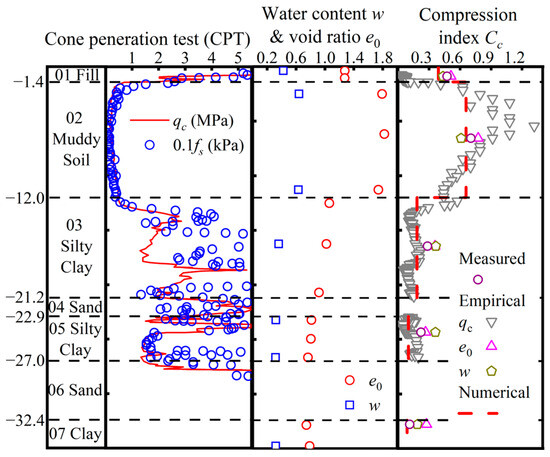
Figure 7.
Typical soil profile and properties.
3.2. Model Setup, Geometry, Boundaries, and Mesh
A three-dimensional, time-dependent, undrained effective analysis was conducted using the finite-element method in PLAXIS 3D CONNECT Edition V20 [32]. The established model replicates a well-instrumented section of the interchanges [24], with the geometry condition of the SBPSE illustrated in Figure 8. The geometric complexity of branches necessitates a fully three-dimensional model with solid elements for SBPs. To reduce computational costs, a half-model was adopted by exploiting symmetry. This model explicitly comprises a grid of SBPs in three rows and five columns. These piles are numbered #1 through #5 sequentially from the innermost side of embankment toward its toe. The model dimensions are as follows: the x-axis spans 59.25 m, equivalent to three times the width of the embankment base; the y-axis ranges from −3.464 to +3.464 m; the z-axis extends from the +5.1 to −42.4 m, consisting of embankment and foundation. The embankment of the well-instrumented section was defined with a height of 5.1 m, a crest width of 13.0 m, and a slope of 1:1.5. The foundation was modeled based on the stratigraphy shown in Figure 7.
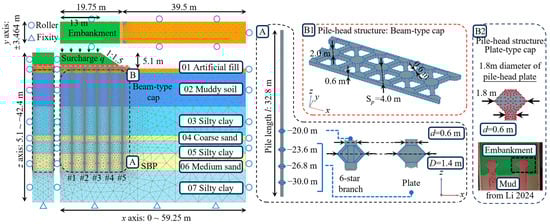
Figure 8.
Geometry of SBPSE numerical model [25].
For boundary conditions, the bottom of the model was fixed, and roller boundaries were assigned for the lateral sides of the model. The groundwater table was assumed to be a depth of 0.7 m below the ground. The top and bottom surfaces were prescribed to be permeable, and the lateral boundaries were not allowed water to drainage out. Two simulation states were considered in the analysis. The construction state replicates the in situ sequence of filling the cushion and embankment, which lasted approximately 430.5 days. Following the completion of embankment construction, the surcharge state was introduced. In this state, a surcharge (q) was applied at the crest of the embankment after its construction was completed. The q was then increased in 1 kPa increments until non-convergence occurred. The corresponding load was defined as the ultimate surcharge (qu).
The SBPs and beam-type cap in the numerical model closely replicated the in situ scheme, as shown in Figure 7. Both the SBPs and pile-head structures were modeled as solid volumes using the concrete constitutive model with the refined parameters tabulated in Table 1. Interface elements were incorporated along the periphery of pile shaft and branches to simulate pile–soil interaction. An elastoplastic interface model was adopted, where the strength and stiffness were scaled by a reduction factor (Rinter) [32,48]. For the beam-type cap, a rigid connection to the pile was assumed, and thus there was no dedicated interface for the pile-head structure. The plate-type cap—another pile-head structure in this study—is displayed on the right side of Figure 8. This structure, formed by hydraulically expanding the pile shaft at the top to create a plate, serves as a pile cap [25], and was assumed to have a diameter of 1.8 m in this simulation. A two-layer biaxial geogrid reinforcement was installed above both pile-head structures [24,44] (at elevations of 0.3 m and 0.6 m), with an isotropic axial stiffness (EA) of 1500 kN/m. The piles, pile-head structures, and soil volumes were meshed using 10-node tetrahedral elements. Then, 12-node joint elements were employed for the pile–soil interfaces, and 6-node triangular surface elements were used for geogrids. A graded meshing scheme was adopted, wherein the mesh was coarsened with increasing distance from the reinforced foundation zone. The mesh coarseness factors were set as follows: 0.30 for the SBPs, interfaces, and the immediate surrounding soil; 0.50 for the embankment fill; 0.75 for the soft clay within the foundation; and 1.50 for the bottom silt clay.
3.3. Constitute Model and Parameter of Soil
The study utilized the Hardening Soil (HS) model to simulate the behavior of foundation soils. This model is capable of accurately representing the nonlinear behavior of both soft and stiff soils [32,49,50]. Based on the theory of plasticity, the HS model has superseded the conventional hyperbolic model of Duncan–Chang. The failure criteria are satisfied, with perfectly plastic yielding occurring as described by the Mohr–Coulomb failure criterion. The yield surface introduces a cap and can extend due to the plastic strains.
The stress-dependent stiffness in the Hardening Soil (HS) model is characterized by four key parameters: the secant stiffness (), the tangent stiffness (), the reloading stiffness (), and the power of stress level (m). The well-established equation [32] = 2.3 · (1 + e0) · pref/Cc was used to determine the tangent stiffness. The reference load (pref) was set at 100 kPa and the calibrated compression index Cc was obtained from Figure 7. The other two stiffness parameters were then estimated using empirical ratios for clays, adopting :: = 1:0.5–1.0:3–8 [11,50]. The exponent m varies from 0.5 to 1.0, increasing with soil softness. The effective strength parameters (effective cohesion c′, effective friction angle φ′) and the over-consolidation ratio (OCR) were selected based on a synthesis of local engineering practice [11,24,51] and the PLAXIS manual [32]. A strength reduction factor (Rinter) of 0.67 was adopted for the interfaces involving the 01 Fill and 02 Muddy Soil, and 0.8 for all other soil–concrete interfaces [11,32]. The cushion layer is composed of gravels, with a drainage type classified as Drained. For all other soil materials, the drainage type is assigned as Undrained (A). All parameters of soil layers are summarized in Table 2.
Table 2.
Soil parameters of the Hardening Soil HS model.
3.4. Model Validation and Mesh Convergence Analysis
The field-measured [24,44] and numerically simulated embankment filling sequences (time t—fill height He) for the two interchanges are shown in Figure 9, represented by the black and blue solid lines. Accordingly, the SBPSE model was validated by comparing the simulated and measured settlement uz and pile-head load.
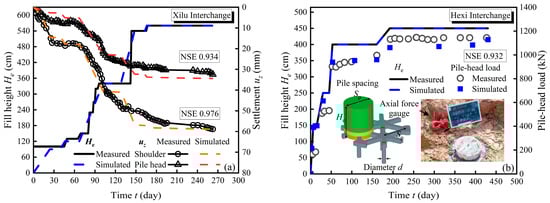
Figure 9.
Model validation of SBPSE for: (a) settlement; (b) pile-head load.
The calculation results of the numerical model fit well with field monitoring data, as indicated by a Nash–Sutcliffe Efficiency coefficient (NSE) greater than 0.9 for both settlement uz and pile-head load (Figure 9). The NSE, calculated by comparing simulated against measured values, approaches 1.0 for a perfect prediction [52]. This matches in the evolution of both pile-head load and settlement uz, which provide reasonable agreement for the adopted material parameters and model geometry against the monitored conditions.
To enhance the precision of the numerical simulation, five different mesh relative element sizes (RESs) were tested. Mesh sensitivity is critical when dealing with intricate geometries. The mesh convergence analysis concerning uz and pile-head load confirmed that the mesh size optimization had no impact on the results, as shown in Figure 10. These two fundamental variables are directly related to the subsequent analysis and are based on field measurements. Based on a range of RESs from very coarse to very fine, a medium mesh size was selected for simulations under various conditions. This ensures that the simulation remains both accurate and computationally efficient, with the overall model containing approximately 159,963 elements and 278,913 nodes.
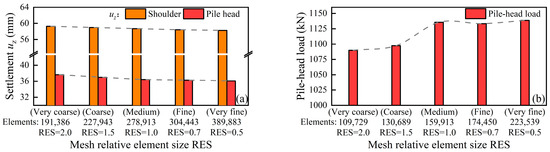
Figure 10.
Model convergence analysis for mesh size selection: (a) settlement uz; (b) pile-head load.
4. Comparison of Embankment Performances with Pile Types and Pile-Head Structures
This section compares the settlement and load-transfer behaviors of the pile-supported embankments during both construction and surcharge states. Three reinforcement systems were considered, formed by two piles types (SBP and SP) and two pile-head structures (beam-type cap and plate-type cap). These three systems include SBPSE with beam-type cap (SBP-beam), RPSE with beam-type cap (SP-beam), and SBPSE with plate-type cap (SBP-plate).
Figure 11 illustrates settlement uz contours for three embankment systems at the end of the construction state (t = 430.5 days, He = 4.5 m). The maximum uz occurs at the crest of these embankments, with values of 58.5 mm (SBP-beam), 62.0 mm (SP-beam), and 93.3 mm (SBP-plate). The use of a beam-type cap substantially reduces the maximum settlement, achieving around 38% reduction compared to the plate-type cap, which demonstrates the advantage of the beam-type cap in controlling embankment settlement. The 20 mm and 60 mm settlement contour lines are marked in Figure 11. For the SP-beam, the 20 mm contour lines penetrate to a depth of approximately 15 m below the embankment center. In comparison, the 20 mm settlement contours for the SBP-beam system merely extend into the shallow foundation. Further, the SBP-plate system, despite producing significant settlement uz within the embankment ranges, exhibits a large settlement gradient. This concentrates the deformation within this region, which limits the downward propagation of the 20 mm settlement contour lines. It may imply that the SBP-plate system requires greater relative displacement to mobilize an equal magnitude of shaft resistance. Thus, based on these settlement contours, both the SBPs are more effective at controlling uz in the underlying soft foundation.
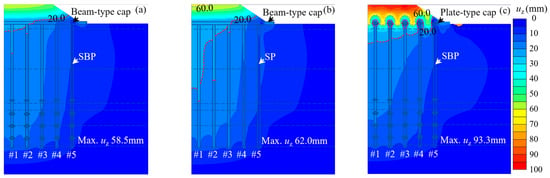
Figure 11.
Settlement contours at the end of construction state (He = 4.5 m): (a) SBP-beam, (b) SP-beam, (c) SBP-plate.
Figure 12 illustrates the variation in pile efficacy (E) [53] at the pile head of the central pile #1 with time t and surcharge q. Notably, the plate-type cap significantly enhances the ultimate surcharge capacity qu, with the corresponding SBPSE sustaining a qu of 58.6 kPa, which is approximately 36% higher than that of the beam-type cap systems in the studied case. This magnitude of the ultimate surcharge qu differs from the settlement patterns revealed in Figure 11. The efficacy E represents the percentage of total embankment load within a replacement area that is carried by the pile. The E curves for all three systems show an initial phase of exponential increase, which transitions to a stabilized plateau after the fill height He reaches approximately 2.0 m. The curves for SBP-beam and SP-beam follow comparable trends and reach similar magnitudes. Upon completion of construction, the efficacy E for both beam-type cap systems reaches 84%, which is approximately 13% higher than that of the plate-type cap. In stark contrast, the E curve for the SBP-plate exhibits a distinct behavior during the surcharge stage, rising gradually from 60 to 73%, which underscores the qualitatively different load-transfer mechanism.
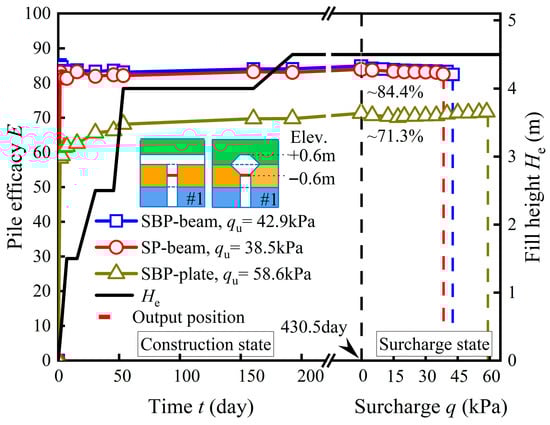
Figure 12.
Pile efficacy E versus time t and surcharge q.
The layout of effective principal stress (EPS) clusters within the embankments for both the beam-type cap and the plate-type cap is shown in Figure 13. The EPS refers to the various stress measures based on the effective stresses in the soil elements, all of which reflect the stress state of soil [11,32]. The top portion of Figure 13 illustrates the EPS distribution at the end of the construction state. It can be observed that the EPS clusters in the beam-type cap are evenly distributed across the ground beam and foundation, while those in the beam-type cap exhibit a significant arching effect, with the clusters primarily concentrated around the pile-head plates and shaped by their inclined surface. The lower part of Figure 13 presents cross-sectional views (longitudinal Section A and transverse Section B) at three loading stages. A divergence in EPS distribution emerges even during initial filling. For the beam-type cap, EPS is sparsely distributed above the ground beam. In contrast, for the plate-type cap, stress clusters begin to accumulate around the pile-head plate, with the maximum EPS reaching –1269 kPa—four times greater than that in the beam-type cap system.
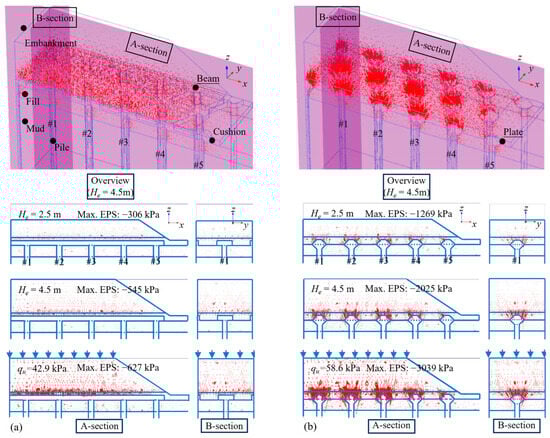
Figure 13.
Distribution of effective principal stress EPS surrounding two pile-head structures: (a) beam-type cap; (b) plate-type cap.
As the filling and surcharge progress, the concentration of EPS around the pile-head plate becomes increasingly pronounced, indicating the development of a robust stress arch. This phenomenon correlates well with the settlement uz contours in Figure 11. The steep settlement gradients around the pile-head plate signify substantial differential settlement, providing direct evidence for the activation of soil arching and the consequent redistribution of stresses. The simulated response indicates a less pronounced soil-arching effect in the beam-type cap system than conventionally expected [21], with a weaker correlation between the mobilization of load and the development of soil arching. This is attributed to the specific configuration of SBPs, notably the pile spacing Sp and the presence of ground beams. Consequently, this system can be interpreted as behaving like a pile-beam foundation, transferring the embankment load primarily through the concrete structure. In contrast, the plate-type cap system provides evidence of significant plate–embankment interaction. This interaction appears to engage the plate cap, the underlying SBPs, and the surrounding soil, suggesting an integrated composite foundation.
5. Mechanical Response of Concrete in SBPSEs
This section investigates the mechanical responses of concrete elements within the SBPSEs across three distinct scales: (1) the localized stress paths at critical points; (2) the evolution of yielding and forces in structural components; (3) the global stability of the embankment. These multi-scale analyses provide insights into the failure mechanisms governed by beam-type and plate-type cap systems.
5.1. Stress Paths
The stress path of the typical location provides an intuitive reflection of the failure patterns in concrete elements beneath the embankment and surcharge. Figure 14 plots the variation in mean effective stress (p′) versus deviator stress (qs) at representative points for the SBP-beam and SBP-plate systems. Point A is located at the top of central pile #1, primarily under compression, whereas Point B is at the mid-height of the toe pile #5, where tensile stress is dominant [4,28]. Solid lines and symbol lines denote construction and surcharge state, respectively. As shown, the two stress paths for the beam-type cap reach peak qs values of 2500 kPa at p′ of 1800 kPa and −1000 kPa, consistently exceeding the stress magnitudes observed for the plate-type cap. This observation can be attributed to the fact that the beam-type cap transfers the embankment load almost directly to the piles, with the soil carrying a negligible share. This pattern aligns with the load-transfer behavior of the beam-type cap in Figure 12 and Figure 13.
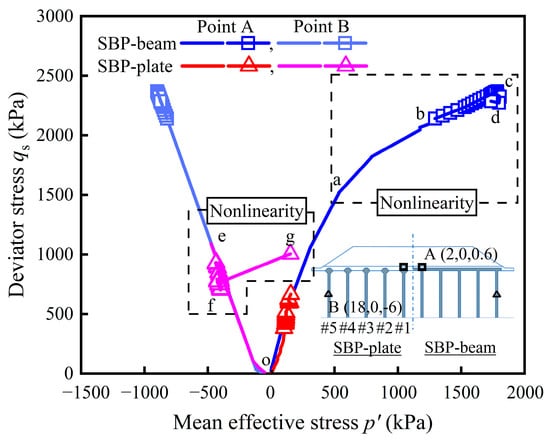
Figure 14.
Effective stress paths for representative Point A and Point B.
The nonlinear variation in the stress paths reveals the complex mechanical behavior within the structures. In Figure 14, the stress paths of these two representative points display distinct nonlinear characteristics. For Point A in the beam-type cap, the nonlinear evolution occurs in three successive stages: (1) initial compressive hardening (a–b): The stress path curve transitions from linear to nonlinear during the construction state; (2) progressive plastic flow (b–c): The curve gradually flattens, approaching a yield plateau in the surcharge state; (3) post-peak strain-softening (c–d): The stress path begins to drop sharply as the concrete undergoes failure and loss of strength. For Point B in the SBPs beneath the plate-type cap, the development of nonlinear behavior follows a different pattern: (1) tensile softening (e–f): The path descends with a steeper slope, indicating a rapid loss of tensile strength and the initiation of internal damage in the surcharge state; (2) stress redistribution and compressive mobilization (f–g): The stress path subsequently exhibits a V-shaped reversal, likely due to extensive cracking that redistributes forces and engages the concrete in compression. These contrasting stress paths clearly illustrate the differing progression of yielding at these representative points in compressive and tensile behaviors.
5.2. Failure Evolution and Internal Forces
The failure evolution of the SBPs and pile-head structures beneath the embankment is examined through a comprehensive analysis of internal force indicators, including hardening parameters, axial force (N), and bending moment (M).
Figure 15 illustrates the contours of normalized tension hardening parameter Ht at varying surcharge q within the SBPSEs. In these contours, regions where Ht > 1 are shaded gray, indicating that the concrete is undergoing softening (Figure 3b) and enters a state of tensile yielding. For the SBP-plate (Figure 15b), the tensile yield zone initially emerges at the mid-height of the toe pile #5 when q = 0 kPa. This phenomenon suggests that, during the construction state, tensile yielding begins at the toe pile #5, revealing that the embankment system has already experienced degradation. Such construction-induced effects are typically overlooked in previous numerical studies [4,28,31] of embankment stability. As q increases, this yield zone propagates inward to the adjacent pile #4. Upon reaching qu, the tensile yield zones in piles #4 and #5 coalesce, forming a continuous band within the Mud layer. Concurrently, extensive tensile yielding develops in the lower sections of the SBPs.
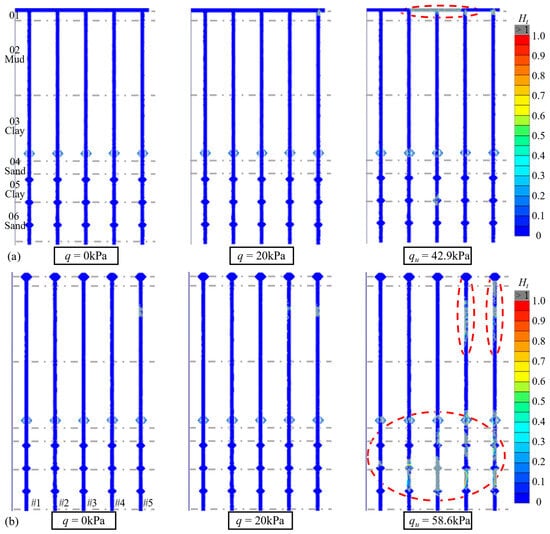
Figure 15.
Contour of Ht at varying q for the SBPSEs: (a) SBP-beam; (b) SBP-plate.
In contrast to the plate-type cap system, the SBP-beam system (Figure 15a) exhibits a more localized failure pattern. The tensile yield zones first appear at the junction between the toe pile (#5) and the ground beam. With increasing q, yield regions progressively develop at the mid-span of the ground beam until failure. A comparison of the Ht contours reveals a distinct difference in the tensile failure evolution between SBPSEs with different pile-head structures. Specifically, the potential instability is triggered at different locations within the toe pile #5. Furthermore, the failure in the SBP-beam is more localized, concentrating in the ground beam, whereas in the SBP-plate system, it develops progressively with greater mobilization of the capacity of SBPs.
The contours of normalized compressive hardening parameter Hc for the SBPSEs under qu are presented in Figure 16. In these contours, regions where Hc > 1 are shaded gray, signifying the onset of compressive strength softening (Figure 3a). Overall, in both SBPSE systems, compressive softening zones develop only at the ultimate limit state and are sparse and localized. This characteristic is more pronounced in the beam-type cap system. The limited extent of Hc development is attributed to the sufficient compressive strength fc of the C30 concrete to withstand the vertical load transfer from the embankment. In conjunction with Figure 15 and Figure 16, the failure evolution of the SBPSEs is therefore governed by tensile failure in the concrete.
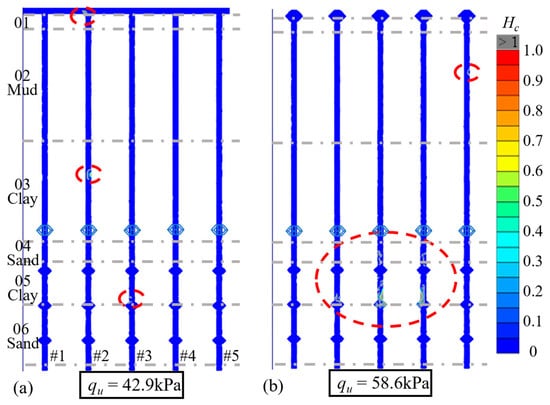
Figure 16.
Contour of Hc at varying q for the SBPSEs: (a) SBP-beam; (b) SBP-plate.
The distribution of bending moment M and axial force N along the SBPs at the onset of surcharge and the ultimate state are presented in Figure 17 and Figure 18. The sign convention defines negative M for clockwise bending and positive N for compression. To correlate with damage initiation, contours of Ht and Hc are superimposed on the diagrams.
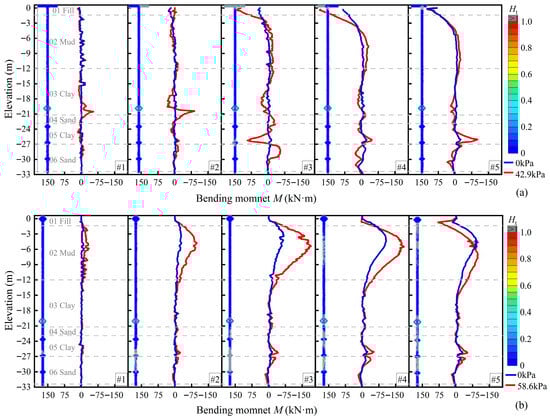
Figure 17.
Bending moment M along the pile shaft: (a) SBP-plate; (b) SBP-beam.
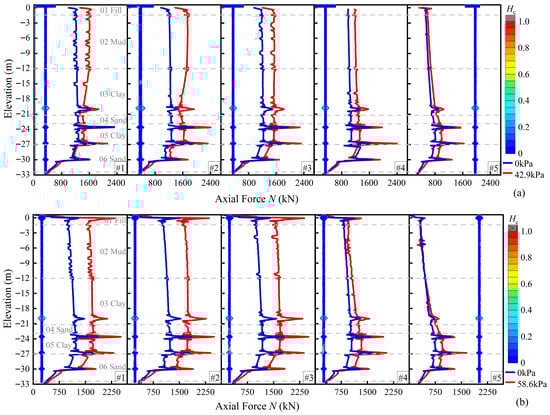
Figure 18.
Axial force N along the pile shaft: (a) SBP-beam; (b) SBP-plate.
Figure 17 clearly shows that the development of M in the SBPs is closely related to pile location. For the plate-type cap system, at q = 0 kPa, the maximum M among the SBPs occurs at the mid-height of the toe pile #5, reaching 93 kN·m; at qu = 58.6 kPa, the maximum shifts to shoulder pile #4, with a value of 187 kN·m. Pronounced bending is confined to the shallow soft stratum traversed by the piles #3 to #5, whereas piles #1 to #2 develop considerably smaller moments. In comparison, the beam-type cap system concentrates M at the beam–pile junctions of the piles #3 to #5, and mobilizing larger M in the deeper foundation than the plate-type cap. The regions of high M in Figure 17 generally align with the regions of high Ht in Figure 15. This correspondence confirms that the failure evolution of the SBPSEs is an instability process driven by bending-induced tensile yielding. Furthermore, Figure 17 indicates that the branches and plates along the pile shaft provide limited resistance to M, with the bottom plate being comparatively more effective. For instance, in toe pile #5 beneath the plate-type cap, the peak M decreases from −50 to −40 kN·m as it passes the bottom plate. This limited effectiveness stems from the branches being positioned away from the region of M susceptibility.
Figure 18 presents the distribution of axial force N in individual SBPs beneath the two pile-head structures. A consistent trend of decreasing N from the central pile #1 toward toe pile #5 is observed in both systems. In the plate-type cap, the N in pile #3 is significantly higher than in piles #4 and #5, for these two piles are located outside the footprint of the applied q. At the location of maximum bending moment M, pile #3 experiences an N of 1640 kN, while pile #4 only reaches 464 kN. The higher axial force mitigates tensile yielding by counteracting the bending-induced tensile stress, which correlates with the less pronounced Ht regions in pile #3 (Figure 15b). In the beam-type cap, the presence of the ground beam results in a more uniform distribution of N among the SBPs. The N in piles #4 and #5 is significantly higher than their counterparts beneath the plate-type cap.
For the individual plate, there is a significant depth-wise variation in N. The axial force N increases in the upper portion of the plates and decreases in the lower portion. The difference between these forces is transferred to the surrounding soil around that plate, with the most pronounced differential observed at the bottom plate. For example, in the central pile #1 of the plate-type cap system, the N drops from 1171 to 708 kN across the bottom plate. This change is consistent with the vertical bearing capacity of SBPs established in previous studies [11,13].
5.3. Instability Model
A generalized factor of safety (FoS) is introduced to evaluate the overall stability of the embankments. The FoS is defined as the ratio of the ultimate surcharge qu to the total weight of the embankment (W) [28,54], as expressed in Equation (5):
This ratio quantifies the safety margin of the embankments. Compared to the strength reduction method, this approach focuses on increasing the sliding driving force of the embankment system. Table 3 tabulates the FoS for three pile-supported embankments. The SBP-plate system exhibits a factor of safety FoS of 1.517, representing an increase of 13.3% and 10.0% over the two beam-type cap systems. This improvement in FoS is directly reflected in the contrasting deformed shapes between the two systems (Figure 19).
Table 3.
Comparison of factor of safety FoS among three types of embankments.
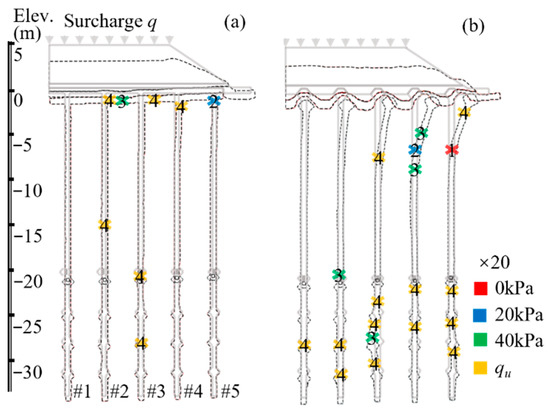
Figure 19.
Failure sequence and position in SBPSEs: (a) SBP-beam; (b) SBP-plate.
As shown in Figure 19, the SBPs in the plate-type cap system exhibit lateral deformation, with the upper sections of piles #3 to #5 inclined toward the embankment toe. In contrast, the SBPs in the beam-type cap system retain a relatively straight profile, restrained by the ground beam. Regarding the failure sequence, bending failure in the toe pile #5 of the plate-type cap system does not directly induce global instability of the embankments. However, once significant bending occurs in the shoulder pile #4, the shear resistance of the composite foundation is substantially compromised. This leads to a stress redistribution between the SBPs and the inter-pile soil, increasing the load on adjacent piles and eventually causing complete yielding in the lower sections of the SBPs (Figure 15).
6. Optimization of Pile-Head Plate Diameter in Plate-Type Cap Structure
The SBP-plate systems demonstrate favorable overall stability. Nevertheless, substantial settlement occurs during the initial phase of surcharge loading, triggering bending failure in the toe pile #5. To mitigate this vulnerability, optimizing the diameter of the pile-head plate—a key component governing load distribution—is proposed as an effective strategy.
To systematically investigate the influence of the pile-head plate diameter, a dimensionless parameter termed diameter ratio ξ (the ratio of the plate diameter D to the pile shaft diameter d) was introduced. In preceding simulation, the plate-head diameter, where the D and the d were fixed at 1.8 m and 0.6 m, was assigned ξ = 3; the other branches along the pile shaft were assigned ξ = 2.5. A practical range for parametric study was established from the ξ values in Figure 20, which compiles the diameter data of SBPs from 23 engineering cases of SBPs; the recommended ξ values from the specifications JTG 3363-2019 [55] and IS: 2911 (Part III)-1980 [56] are included as reference. The collected data reveal a considerable scatter in the ξ values, as shown in Figure 20. For embankment applications, the diameter d is typically constrained between 0.4 m and 0.6 m. As the pile-head plate functions similarly to a pile cap, a relatively high ξ is warranted to ensure effective load spreading. Consequently, six levels of ξ (2.5, 2.75, 3, 3.25, 3.5 and 3.75) for the pile-head plate were selected for comparative analysis; the shaft diameter d and the diameter of lower branches D were fixed at 0.6 m and 1.4 m, respectively, while the pile spacing Sp was maintained at 4.0 m.
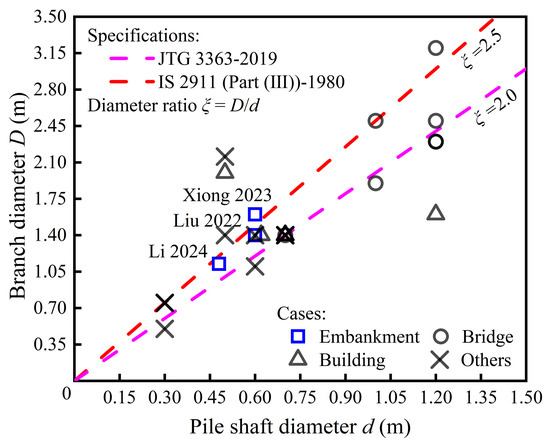
Figure 20.
Distribution of pile shaft diameter d and branch diameter D in the reported cases [15,24,25,55,56].
Figure 21 illustrates the variation in settlement uz at the shoulder and FoS with ξ of the pile-head plate. The bar chart shows that the total uz in both construction and surcharge states increases with ξ, but no substantial additional benefit is observed when ξ exceeds 3.0 in this model. Furthermore, the uz during the construction state decreases continuously as ξ increases, ultimately reaching 69.6 mm at ξ = 3.75. From the line chart, the FoS exhibits a gradually increasing trend with ξ, though the rate of this increase gradually slows down, particularly at ξ = 3.0, highlighting a critical point within the context of this study. Specifically, when ξ is reduced to 2.5, the FoS drops sharply to 1.18. These two phenomena indicate that the pile-head plate diameter is a governing factor for the stiffness of the SBPSE during the construction state. Beyond a certain threshold (ξ > 3.0), however, its contribution to enhancing the ultimate surcharge resistance becomes limited.
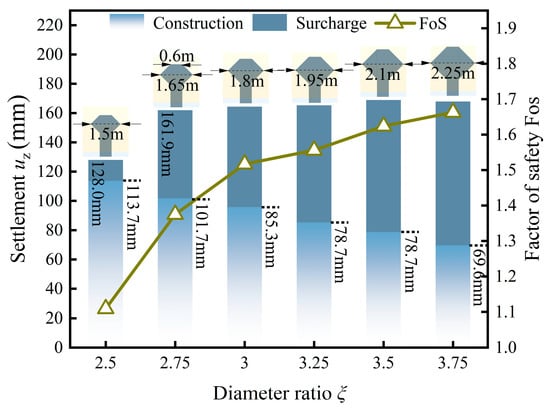
Figure 21.
Influence of pile-head plate diameter on settlement uz and factor of safety FoS.
Figure 22 presents the contours of the normalized tensile hardening parameter Ht for pile-head plate ξ values of 2.5 and 3.75. Under the initial load condition (q = 0 kPa), the tensile yielding zone at the trigger point (toe pile #5) diminishes with increasing ξ. Notably, this zone vanishes entirely at ξ = 3.75. This finding confirms that excessive settlement during the construction state can initiate bending failure in the toe pile #5, and enlarging the pile-head plate effectively mitigates this risk. Under the ultimate surcharge qu, the tensile yielding in SBPs with ξ = 2.5 remains less developed compared to the more extensive and pronounced yielding observed at ξ = 3.75. This failure pattern observed with a smaller ξ appears to transition to a more localized failure mode, contrasting with the progressive bending failure along the SBPs that characterizes systems with larger pile-head plates. In summary, adopting a pile-head plate ξ in the range of 2.0 to 2.5, as suggested by the specifications JTG 3363-2019 [55] and IS: 2911 (Part III)-1980 [56], may be insufficient to mitigate early bending damage for SBPSEs in the soft soil area. This is because these specifications are primarily developed for bearing capacity-oriented applications, such as building and bridge foundations, where SBPs typically have larger shaft diameters d and are subjected to predominantly rigid loading conditions. Beneath an embankment, the pile-head plate can facilitate load distribution and improve the replacement ratio. For the construction of SBPSEs in soft soil areas, a diameter ratio of at least ξ = 3.0 is recommended for the pile-head plate.
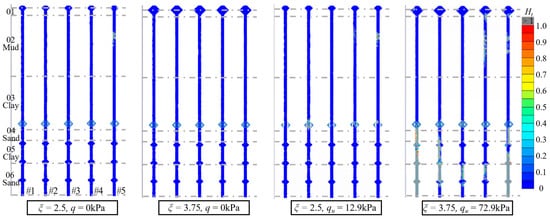
Figure 22.
Contours of the Ht for SBPs with different ξ of pile-head plate.
7. Conclusions
This study numerically investigated the settlement behavior, load transfer, and failure evolution of the squeezed branch pile-supported embankment SBPSEs on soft deposits. A three-dimensional model of the embankment was established, and its validity was confirmed through comparison with the field measurements. The internal responses of the pile types and the pile-head structures were clarified, and these concrete components utilize an advanced concrete model CM incorporating stress yielding. The main conclusions can be drawn:
- An advanced concrete model CM was applied to account for strain-softening/hardening in C30 (C30/37 in Eurocode 2 [33] and 4000 psi in ACI 318-14 [34]) concretes within SBPSEs. The accuracy of the model and its parameters for this concrete grade were verified through comparison with results from standard UCSTs and 3PBTs.
- Based on the comparative embankment performances in this study, SBPs provide more effective settlement control in the underlying foundation than SPs; regarding the two pile-head structures, the plate-type cap system increases the ultimate surcharge qu, while the beam-type cap reduces the maximum settlement uz by around 38%, and exhibits slightly higher pile efficacy E.
- The SBPSE with a beam-type cap SBP-beam behaves as a pile-beam foundation that directly carries the embankment, although it may yield a more localized structural failure; the SBP-plate system functions as a composite foundation in which the inter-pile soil is fully mobilized to bear the load synergistically.
- The failure evolution of SBPSEs is influenced by the pile-head structure type. The SBP-plate systems exhibit a progressive failure around the SBPs, triggered by bending yield at the mid-section of the toe pile #5, with the shoulder pile #4 being the key member; the SBP-beam systems undergo a localized failure, initiated by tensile rupture at the junction between the toe pile #5 and ground beam, with the mid-span of the beam acting as the key member.
- Increasing the diameter ratio ξ of the pile-head plate in SBPSEs with a plate-type cap is beneficial for settlement control and overall stability. For the studied cases, a ξ of at least 3.0 is suggested for the pile-head plate, as it exhibited better performance than the range of ξ = 2.0 to 2.5 recommended by the specifications. Future works are needed to validate these findings before recommending broader design guidelines for SBPSEs in soft soil.
Author Contributions
Conceptualization, K.Z. and Y.C.; methodology, K.Z., Y.W. and Y.C.; validation, K.Z., Y.C., H.W. and W.H.; formal analysis, K.Z., Y.C. and J.Y.; investigation, K.Z., Y.C., H.W. and W.H.; resources, Y.W., Q.L. and J.Y.; data curation, K.Z., Q.L. and J.Y.; writing—original draft preparation, K.Z., Y.C. and H.W.; writing—review and editing, K.Z., Y.W., H.W. and J.Y.; visualization, K.Z., Y.C. and Q.L.; supervision, Y.W., Q.L. and W.H.; project administration, Y.C. and Y.W.; funding acquisition, Y.W. and Q.L. All authors have read and agreed to the published version of the manuscript.
Funding
This research was jointly funded by the Scientific and Technological Key Projects in Transportation Industry 2021 (Grant No. 2021-MS1-022) and the Guangdong Basic and Applied Basic Research Foundation (Grant No. 2025A1515011187).
Data Availability Statement
All data used in this study are available from the corresponding author upon request.
Conflicts of Interest
The authors declare no conflicts of interest.
References
- Gu, S.; Liu, W.; Ge, M. Failure and remediation of an embankment on rigid column-improved soft soil: Case study. Adv. Civ. Eng. 2020, 2020, 2637651. [Google Scholar] [CrossRef]
- Shen, L.; Han, X.; Fei, L.; Ding, R. Case study on feasibility and performance of embankment over soft soils with beam-type capped piles. KSCE J. Civ. Eng. 2025, 29, 100208. [Google Scholar] [CrossRef]
- Bian, X.; Liang, Y.; Zhao, C.; Dong, L.; Cai, D. Centrifuge testing and numerical modeling of single pile and long-pile groups adjacent to surcharge loads in silt soil. Transp. Geotech. 2020, 25, 100399. [Google Scholar] [CrossRef]
- Zheng, G.; Yang, X.; Zhou, H.; Chai, J. Numerical modeling of progressive failure of rigid piles under embankment load. Can. Geotech. J. 2019, 56, 23–34. [Google Scholar] [CrossRef]
- Ding, X.; Luan, L.; Liu, H.; Zheng, C.; Zhou, H.; Qin, H. Performance of X-section cast-in-place concrete piles for highway constructions over soft clays. Transp. Geotech. 2020, 22, 100310. [Google Scholar] [CrossRef]
- Wheeler, L.N.; Hendry, M.T.; Take, W.A.; Hoult, N.A. Field performance of a peat railway subgrade reinforced with helical screw piles. Can. Geotech. J. 2018, 55, 1888–1899. [Google Scholar] [CrossRef]
- Deng, Y.; Zhao, H.; Liu, J.; Zhuang, Z.; Wu, A.; Chen, Z. Experimental investigation on load transfer characteristics of screw groove pile–geogrid composite foundation. Chin. J. Geotech. Eng. 2025, 47, 1987–1994. [Google Scholar]
- Yu, J.; Zhou, J.; Zhang, R.; Gong, X. Installation effects and behavior of a driven prestressed high-strength concrete nodular pile in deep saturated soft clay. Int. J. Geomech. 2023, 23, 05022007. [Google Scholar] [CrossRef]
- Zhou, J.; Zhang, R.; Yu, J.; Gong, X.; Ming, W. Field study on the shaft capacity of pre-bored grouted planted pile embedded in deep soft soil. Acta Geotech. 2025, 20, 1935–1946. [Google Scholar] [CrossRef]
- Majumder, M.; Chakraborty, D. Under-reamed pile-soil interaction in sand under lateral loading: A three-dimensional numerical study. Ocean Eng. 2022, 263, 112398. [Google Scholar] [CrossRef]
- Zhang, K.; Wang, Y.; Chen, Y.; Qiu, S.; Yi, H.; Yang, J. Investigation of the axial-bearing mechanism of single and group squeezed branch piles in soft soil combining field measurements and numerical modeling. Int. J. Geomech. 2025, 25, 04025225. [Google Scholar] [CrossRef]
- Wang, A.; Zhang, G. Bearing performance and application prospect of pile with expanded branches and plates. Guangdong Highw. Commun. 2019, 45, 35–41. [Google Scholar]
- Zhang, M.; Xu, P.; Cui, W.; Gao, Y. Bearing behavior and failure mechanism of squeezed branch piles. J. Rock Mech. Geotech. Eng. 2018, 10, 935–946. [Google Scholar] [CrossRef]
- Pandya, A.; Desai, A.K. Full-scale field study of instrumented under-reamed piles in clay. Indian Geotech. J. 2025, 55, 1357–1372. [Google Scholar] [CrossRef]
- Xiong, L.; Li, G.; Zhou, Y.; He, G. Experimental and analytical investigation of the bearing capacity of bulbs for squeezed branch piles. Int. J. Geomech. 2023, 23, 04023045. [Google Scholar] [CrossRef]
- Deng, T.; Peng, K.; Li, H.; Hu, Z. Model test study on bearing performance of squeezed branch pile under combined loads. Buildings 2025, 15, 3817. [Google Scholar] [CrossRef]
- Ma, H.; Zhang, W.; Ma, G. Prediction method for uplift capacity of squeezed branch pile based on load transfer method. Ocean Eng. 2025, 334, 121603. [Google Scholar] [CrossRef]
- Li, T.; Xu, P.; Yang, G. Investigation into bearing performance of concrete expanded-plates piles: Field test and numerical modelling. Eng. Struct. 2022, 271, 114954. [Google Scholar] [CrossRef]
- Saleh, H.; Jebur, M.; Mohammed, A.; Karkush, M. Numerical investigation of pullout capacity of under-reamed piles in clayey soils. Transp. Infrastruct. Geotechnol. 2025, 12, 217. [Google Scholar] [CrossRef]
- Deng, T.; Peng, K.; He, P.; Hu, Z. Investigation of squeezed branch pile capacity under combined horizontal–uplift loading. Buildings 2025, 15, 3906. [Google Scholar] [CrossRef]
- Wang, T.; Qu, S.; Huang, K.; Liu, K.; Connolly, D.P.; Luo, Q. Performance comparison of capped pile and piled beam support systems for embankments on soft soils. Transp. Geotech. 2025, 55, 101703. [Google Scholar] [CrossRef]
- Li, X.; Liang, H.; Luo, W.; Guo, W.; Zou, C. Vibro-acoustic coupling characteristic of railway-adjacent building: From out-of-plane vibrations of wall and floor to structure-borne noise. Measurement 2026, 269, 120732. [Google Scholar] [CrossRef]
- Tao, Z.; Cen, Y.; Wu, H.; Li, Q.; Wang, Y.; Lyu, H.; Liu, J.; Shang, L. Experimental investigation of train-induced vibration transmission to the high-rise building during different train operations. Buildings 2025, 15, 4524. [Google Scholar] [CrossRef]
- Liu, G.; Xiong, L.; Li, G.; Zhao, X.; Zhou, Y. Field experimental study on beam-type capped squeezed branch pile under fill loading. J. Highw. Transp. Res. Dev. (Chin. Ed.) 2022, 39, 66–72. [Google Scholar]
- Li, G.; Zhao, X.; Zhang, L.; Zhou, Y.; Xiong, L.; He, X. Model tests on deep soft ground improvement of existing sand-filled subgrade with squeezed branch piles. Chin. J. Geotech. Eng. 2024, 46, 1768–1775. [Google Scholar]
- Wang, T.; Ma, H.; Liu, K.; Luo, Q.; Xiao, S. Load transfer and performance evaluation of piled beam-supported embankments. Acta Geotech. 2022, 17, 4145–4171. [Google Scholar] [CrossRef]
- Xia, B.; Zheng, G.; Zhou, H.; Yu, X.; Zhao, J.; Diao, Y. Stability analysis and optimization of concrete column-supported embankments in soft soil. Acta Geotech. 2024, 19, 2515–2531. [Google Scholar] [CrossRef]
- Ma, H.; Luo, Q.; Wang, T.; Jiang, H.; Lu, Q. Numerical stability analysis of piled embankments reinforced with ground beams. Transp. Geotech. 2021, 26, 100427. [Google Scholar] [CrossRef]
- Schädlich, B.; Schweiger, H.F. A new constitutive model for shotcrete. In Proceedings of the 8th European Conference on Numerical Methods in Geotechnical Engineering, Delft, The Netherlands, 18–20 June 2014. [Google Scholar]
- Zhao, L.; Chen, Y.; Chen, W.; Wang, J.; Ren, C. The performance of T-shaped deep mixed soil cement column-supported embankments on soft ground. Constr. Build. Mater. 2023, 369, 130578. [Google Scholar] [CrossRef]
- Wang, H.; Chen, F.; Shiau, J.; Dias, D.; Lai, F.; Huang, J. Progressive failure mechanisms of geosynthetic-reinforced column-supported embankments over soft soil: Numerical analyses considering the cracks-induced softening. Eng. Struct. 2024, 302, 117425. [Google Scholar] [CrossRef]
- Brinkgreve, R.; Zampich, L.M.; Ragi Manoj, N.; Waterman, D.; Chesaru, A.; Bonnier, P.G. PLAXIS CONNECT Edition V20; PLAXIS bv: Delft, The Netherlands, 2019. [Google Scholar]
- European Committee for Standardization. Eurocode 2: Design of Concrete Structures—Part 1-1: General Rules and Rules for Buildings; British Standard Institution: London, UK, 2004. [Google Scholar]
- ACI 318-14; Building Code Requirements for Structural Concrete. American Concrete Institute: Farmington Hills, MI, USA, 2014.
- Lehký, D.; Kucharczyková, B.; Šimonová, H.; Daněk, P. Comprehensive fracture tests of concrete for the determination of mechanical fracture parameters. Struct. Concr. 2022, 23, 505–520. [Google Scholar] [CrossRef]
- Nakamura, H.; Higai, T. Compressive fracture energy and fracture zone length of concrete. In Modeling of Inelastic Behavior of RC Structures Under Seismic Loads; ASCE Publications: Reston, VA, USA, 2001. [Google Scholar]
- El-Sakhawy, N.R.; Mahdi, H.A.; Elsokary, H.H.; Nabil, M. Numerical investigation of concrete cracking effect on lateral load response of piles in rock mass. Int. J. Geomech. 2024, 24, 04024172. [Google Scholar] [CrossRef]
- Hossain, A.B.; Weiss, J. Assessing residual stress development and stress relaxation in restrained concrete ring specimens. Cem. Concr. Compos. 2004, 26, 531–540. [Google Scholar] [CrossRef]
- Vos, E. Influence of Loading Rate and Radial Pressure on Bond in Reinforced Concrete. Ph.D. Thesis, Delft University of Technology, Delft, The Netherlands, 1983. [Google Scholar]
- Mubarak, A.; Knappett, J.; Brown, M. Evaluation of continuum modelling approaches for reinforced concrete in geotechnical applications. In Proceedings of the 10th European Conference on Numerical Methods in Geotechnical Engineering, London, UK, 2023; International Society for Soil Mechanics and Geotechnical Engineering: London, UK, 2023. [Google Scholar]
- Lim, J.C.; Ozbakkaloglu, T. Stress–strain model for normal- and light-weight concretes under uniaxial and triaxial compression. Constr. Build. Mater. 2014, 71, 492–509. [Google Scholar] [CrossRef]
- Yankelevsky, D.Z. The uniaxial compressive strength of concrete: Revisited. Mater. Struct. 2024, 57, 144. [Google Scholar] [CrossRef]
- Wee, T.H.; Chin, M.S.; Mansur, M.A. Stress-strain relationship of high-strength concrete in compression. J. Mater. Civ. Eng. 1996, 8, 70–76. [Google Scholar] [CrossRef]
- Wu, X.; Sun, K.; Lin, Z. Application of squeezed branch pile in soft soil foundation treatment of expressway bridge head. Guangdong Highw. Commun. 2020, 46, 57–60+66. [Google Scholar]
- Yoon, G.L.; Kim, B.T.; Jeon, S.S. Empirical correlations of compression index for marine clay from regression analysis. Can. Geotech. J. 2004, 41, 1213–1221. [Google Scholar] [CrossRef]
- Mayne, P.W. Interpretation of geotechnical parameters from seismic piezocone tests. In Proceedings of the 3rd International Symposium on Cone Penetration Testing, Las Vegas, NV, USA, 2014; International Society for Soil Mechanics and Geotechnical Engineering: Las Vegas, NV, USA, 2014. [Google Scholar]
- Gao, Y.; Chen, Z.; Airey, D. Compression index versus natural water content relationships for China’s coastal soft clays. KSCE J. Civ. Eng. 2019, 23, 4611–4620. [Google Scholar] [CrossRef]
- Yu, Y.; Damians, I.P.; Bathurst, R.J. Influence of choice of FLAC and PLAXIS interface models on reinforced soil–structure interactions. Comput. Geotech. 2015, 65, 164–174. [Google Scholar] [CrossRef]
- Schanz, T.; Vermeer, P.A.; Bonnier, P.G. The hardening soil model: Formulation and verification. In Beyond 2000 in Computational Geotechnics; Routledge: London, UK, 1999; pp. 281–296. [Google Scholar]
- Surarak, C.; Likitlersuang, S.; Wanatowski, D.; Balasubramaniam, A.; Oh, E.; Guan, H. Stiffness and strength parameters for hardening soil model of soft and stiff Bangkok clays. Soils Found. 2012, 52, 682–697. [Google Scholar] [CrossRef]
- Liu, G.; Geng, P.; Wang, T.; Meng, Q.; Huo, F.; Wang, X.; Wang, J. Seismic vulnerability of shield tunnels in interbedded soil deposits: Case study of submarine tunnel in Shantou Bay. Ocean Eng. 2023, 286, 115500. [Google Scholar] [CrossRef]
- Mukherjee, S.; Sivakumar Babu, G.L. Probabilistic evaluation of the uplift capacity of transmission tower foundations using reinforced anchors. Int. J. Geomech. 2023, 23, 04023203. [Google Scholar] [CrossRef]
- Hewlett, W.J.; Randolph, M.F. Analysis of piled embankments. Int. J. Rock Mech. Min. Sci. 1988, 25, 297–298. [Google Scholar]
- Zhang, Z.; Xiao, Y.; Ye, G.; Han, J.; Wang, M. Numerical investigation on slope stability of deep mixed column-supported embankments over soft clay induced by strength reduction and load increase. In Proceedings of the GeoShanghai 2018 International Conference, Shanghai, China, 27–30 May 2018. [Google Scholar]
- JTG 3363-2019; Specifications for Design of Foundation of Highway Bridges and Culverts. Ministry of Transport of the People’s Republic of China: Beijing, China, 2019.
- IS 2911 (Part III)-1980; Code of Practice for Design and Construction of Pile Foundation Part III: Under-Reamed Piles. Bureau of Indian Standards: New Delhi, India, 2006.


Disclaimer/Publisher’s Note: The statements, opinions and data contained in all publications are solely those of the individual author(s) and contributor(s) and not of MDPI and/or the editor(s). MDPI and/or the editor(s) disclaim responsibility for any injury to people or property resulting from any ideas, methods, instructions or products referred to in the content. |
© 2026 by the authors. Licensee MDPI, Basel, Switzerland. This article is an open access article distributed under the terms and conditions of the Creative Commons Attribution (CC BY) license.