Abstract
The construction sector in developing countries continues to face persistent challenges related to cost overruns, projects delays, and compromised quality performance. In Oman, these concerns have hindered the ability of construction industry to achieve sustainable project success. This study aimed to empirically assess the effect of value management (VM) implementation on overall project success (OPS) in building projects in Oman using the partial least squares structural equation modelling (PLS-SEM). The questionnaire content was validated by 30 construction management experts using the content validity index (CVI). Data from 272 professionals across the construction sector in Oman were collected using a structured questionnaire to assess VM activities and OPS. The results indicated that VM implementation has a significant positive effect on OPS, with all phases except the creativity phase showing statistically significant relationships. The analysis showed a high coefficient of determination (R2 = 0.803) and a large effect size (f2 = 0.793), indicating that VM implementation explains over 80% of the variance in project success. Cost (β = 0.945) was the most significant success measure, followed by time (β = 0.883) and quality (β = 0.843). These results highlighted that the application of VM improves the performance of construction projects through the optimization of cost efficiency, improving scheduling reliability, and ensuring quality compliance. This study provided empirical evidence on the role of VM implementation in improving the overall project success by quantitatively linking VM phases to cost, time, and quality performance in developing countries. The findings offered practical guidance for policymakers and practitioners to integrate VM early in construction projects.
1. Introduction
In developing countries, the construction industry has undergone significant transformations to meet its national economic goals [1]. Consequently, the construction sector has had a negative effect on the overall economic crisis as well as the suspension or slowing down of many private sector-owned development projects [2]. Many of the developers in places like the Middle East have withdrawn because oil prices have stabilized. However, several policymakers in developing nations have sought to diversify their resources by spending on infrastructure and manufacturing [2]. The sales from contracts in the Middle East area of the top 225 contractors grew by 0.1% from 77.46 billion US$ to 77.56 billion US$ [3]. In the UAE, the building sector has been faced with delays due to lack of availability in manpower, resources, etc. [4], and foreign businesses investing in the UAE have been benefiting from cost efficiencies in electricity, gas, and water [2]. The demand for developing nations is also somewhat different in its climate from that of developed countries, but it is a wide market. Even so, the construction industry in these countries is not competitive, largely due to its limited capacity to satisfy international quality criteria [5]. Construction projects in these cultures usually face many challenges, including non-completion, time delays, budget overruns, low efficiency, and a high probability of failing to fulfil the required targets [6,7]. In view of the small expenditure scale in this field, several schemes are consequently subject to suspension or cancellation [8].
Building projects have been increased rapidly due to the increase number of population in developing countries [9]. These projects play a vital role in providing the main living conditions for people [10]. As a consequence, many developing countries struggle to achieve sustainable growth targets within the construction sector [9]. These persistent challenges, widely reported in developing-country construction projects [11], further constrain the sector’s ability to deliver projects efficiently and sustainably. In addition, several challenges, including low incomes, high unemployment rates, currency fluctuations, restricted financial models, and a lack of well-informed business possibilities, developing nations are particularly exposed to market risk [12]. Because of this, these countries find it difficult to produce enough building and residential projects to satisfy the population’s increasing needs [13]. Therefore, projects that encounter these difficulties may be put on hold or cancelled due to the small investment in this industry. At the end of the day, the building sector lags substantially behind other industries and their equivalents in developing countries, failing to satisfy the needs of their governments, consumers, and society [14].
Oman has shown a remarkable growth in the construction industry, especially in building projects, due to the oil presence which has supported the development in various industries and sectors [15]. In general, the construction projects in Oman face the delay problem which is common in several developing countries. Umar [16] reported that primary causes of construction project delays in Oman include labour, materials, contractual concerns, coordination between construction parties, and external variables. These issues have emphasized the development building projects’ success through increasing value, lowering cost, and improving quality [17]. The sequence of the building project life cycle, starting from initiation and planning, going through execution, monitoring, and then finishing with closure, presents a structure of project management from the beginning, through to the end [18]. By utilizing value management (VM) throughout the entire cycle, the process of discovering value and improving it becomes systematic and continuous, and a process ‘pushing’ value in the right direction in all the phases to maximize project outcomes [19]. Therefore, it is essential to apply continuous improvements to building projects to succeed in achieving high quality, low cost, and high value.
Value management (VM) is considered as an organized and multidisciplinary method which aims to optimize the value of any activity in field, such as process, project, and product, that results in a balance in performance, cost, and quality to achieve client needs [20,21]. Value as a concept can be easily defined as the relation between the profit gained from multiple activities and the price or work required to accomplish it [22]. This vision is general, but it can be clearly seen in the conditions and construction of project plans both significant and insignificant. VM is a powerful and successful approach that is recommended as a method to enhance the success value of projects [23,24]. The request to increase the productivity of building projects is highly needed to reduce the expenses for building projects. By applying VM in building projects, it is expected VM will be valuable for all stakeholders involved in construction sectors, including clients, contractors, owners, consultants and others [25].
During the last few decades, VM appears to have been recognized as a cost-effective and productive method in the global building industry [7]. This acceptance is supported by prior data showing that VM reduced construction project costs by 5–10% [26]. According to Ellis et al. [27], if VM were properly implemented early in the project, the cost of capital in construction projects may be lowered by 10–25%. In addition, Atabay and Galipogullari [28] used VM to decrease the cost of building motorways. It is interesting to note that the VM saved over $43,000,000 and 12 months, which helped the project achieve 6% financial advantages and a 17% reduction in operational time. While these previous studies confirmed the effectiveness of VM in improving individual projects, its integrated effect on overall project success (OPS), encompassing cost, time, and quality, remains insufficiently examined.
As a part of Oman Vision 2040, Oman has entered a stage of major infrastructure construction in which smart cities, urban planning, and sustainable infrastructure, are emphasized [29]. In order to achieve and add to high-value projects that meet stakeholder expectations while also keeping within budget and time [30], VM implementation is needed.
Although prior studies have demonstrated the effectiveness of VM in improving construction project outcomes, most research has treated VM as a single holistic construct or focused on qualitative or descriptive assessments. Limited studies have empirically examined how specific VM implementation phases, such as information, function, evaluation, development, and creativity, influence OPS, particularly as a multi-dimensional construct encompassing cost, time, and quality. In addition, advanced quantitative techniques, such as partial least squares structural equation modelling (PLS-SEM), remain underutilized for modelling these complex relationships. This study addresses these gaps by quantitatively assessing the impact of distinct VM phases on OPS in Omani building projects. Beyond the geographic context, the findings provide methodologically rigourous insights that are more broadly relevant to developing-country construction projects, offering both theoretical and practical contributions to the field.
The main objective of this paper is to investigate the effect of VM implementation on the OPS in building projects in Oman using PLS-SEM. Through removing unnecessary costs and improving quality through the application of VM, this research can help decision-makers as a guide to ensure the success of their construction projects. This study is significant for the Omani construction sector, where the value of VM is not well understood. Despite the high interest in VM, empirical studies examining its impact on OPS using advanced multivariate techniques such as PLS-SEM, particularly in the Omani construction industry, are still limited. The study will also focus on its key role in improving decision-making in the construction industry of Oman to find a better understanding of how the implementation of VM can help in reducing unnecessary costs, improving the OPS through effective decision-making, and, at the same time, fostering innovation.
2. Development of Research Model
2.1. VM Implementation
VM is an organized set of approaches and procedures that are introduced to improve the function of designs, services, facilities, or systems at the lowest possible total cost of beneficial ownership, and to understand the value system of the consumer for efficiency, reliability, efficiency, performance, esthetics, time, and costs [31]. This method is examined as structural/organized through functional testing and transdisciplinary analysis [32]. According to Abidin and Pasquire [33], VM subsequently enhanced the money, pricing, competitiveness, and great market pictures. The primary stages of VM include information, function analysis, creation, evaluation, development, and presentation phases [24]. The five stages of the VM workshop coordination process and related activities are displayed in Table 1.

Table 1.
Main activities of value management in consultation sector.
The specific VM activities included in each phase were selected not only based on established VM frameworks [20,21,25], but we also considered their relevance to the Omani construction case. The construction sector in Oman has faced several challenges such as cost overruns, project delays, and limited resource optimization [16,17]. The chosen activities, spanning information gathering, functional analysis, creative solution development, evaluation, and implementation planning, can address these local challenges by promoting systematic planning, efficient resource allocation, enhanced stakeholder collaboration, and cost-effective decision-making. This selection can ensure that the study’s findings provide practical guidance tailored to the needs of Omani construction projects and similar developing-country contexts.
2.2. OPS Identification and Measurement
The most crucial issue for the construction sector is the project’s success, as this is very essential to stakeholders, including clients, developers, and consultants in understanding what constitutes a successful project. According to a hierarchical model created by Chua et al. [42], time, quality, and cost were essential goals for successful building projects. The interposition of a measure of success factor as the primary objective for a successful building project can be explained by the hierarchical model. The main target of a successful construction project is the highest hierarchical level of costs, time, and quality, and the project life cycle’s costs, quality, and time are also important goals in construction projects [42]. The main factors leading to project success are summarized in Table 2 [42,43,44].
Table 2.
Projects success factors [42,43,44].
2.3. Relationship Between OPS and VM Implementation
According to Tabish and Jha [45], achieving project success can be extremely difficult and challenging, particularly in public construction, because of the high levels of accountability, fairness, efficiency, economy, and quality that need to be satisfied. While project success can include other factors such as stakeholder satisfaction, sustainability, safety, and long-term strategic outcomes [6,7,30], this paper focused on the traditional iron triangle of cost, time, and quality. These three factors have remained the most used and objectively measurable indicators in the Omani construction context, providing a robust foundation for assessing overall project success. Other dimensions, although important, were frequently more subjective or context-specific and were therefore excluded to ensure analytical rigour and comparability with prior empirical studies. Future studies may extend this analysis to incorporate additional success dimensions relevant to local and international construction practices [31,46]. The project’s success is widely determined by the extent to which these three aspects can be managed during a project [47]. It is generally agreed that time, cost, and quality are the benchmark measure of success for construction projects at any stage [48].
VM is an instrument that contributes to the project’s success. According to Kelly and Male [49], VM has achieved a maturity level where the workshop results’ substance and style are acceptable. In addition, Fong [50] reported that the dynamic character of projects in recent years have needed original and creative concepts that rely on participant actions to collaborate and increase project value. In order to prevent conflicts and improve these project innovations, VM can assess and oversee interactions between the individual, the organization, and others [23]. In terms of performance and project accomplishment, VM’s effects on employees or companies were different from those of the previous study. Specifically, by identifying optimal value, VM can have a systematic impact on an organization’s efficiency [51]. Thus, studying the relationship between VM implementation and OPS is crucial as the study contributes to the knowledge on a subject within a context that has previously not been investigated. According to Brown and Dant [52], one method to explain the relevance of a study’s contribution was to provide further theoretical insight into the phenomenon being studied, such as the application of VM in a new country context like Oman.
Each VM phase is expected to have a different impact on OPS, even though all VM phases are supposed to positively contribute to OPS. By ensuring thorough and accurate data collection, the information phase reduced uncertainty and promotes improved planning. The function phase optimized resource allocation and functionality by identifying the fundamental project requirements. The creativity phase generated alternative solutions, fostering inventive ways that may boost efficiency and value. To reduce risks and guarantee cost-effective choices, the evaluation phase methodically evaluated options. Lastly, the development stage put selected ideas into practice, turning plans into observable project results. These phase-specific processes justified studying each VM phase individually, allowing the study to analyze both the unique and combined contributions of VM to OPS. Based on this theoretical and empirical background, the main hypotheses in this study are proposed in Figure 1. These hypotheses can also be summarized as follows:
H1.
A significant positive relationship exists between creativity phase of VM implementation and OPS.
H2.
A significant positive relationship exists between development and presentation phase of VM implementation and OPS.
H3.
A significant positive relationship exists between evaluation phase of VM implementation and OPS.
H4.
A significant positive relationship exists between function phase of VM implementation and OPS.
H5.
A significant positive relationship exists between information phase of VM implementation and OPS.

Figure 1.
The proposed hypotheses of the study addressing the effects of VM phases on OPS.
Figure 1.
The proposed hypotheses of the study addressing the effects of VM phases on OPS.

Guided by decision-making and value optimization theories, the study hypothesizes that each VM phase can positively contribute to overall project success through distinct yet complementary mechanisms.
3. Research Method
3.1. Sampling Procedures
In this study, a multi-stage, structured sampling procedure was followed. Firstly, previous studies related to VM activities were reviewed and then refined using the content validity index (CVI) in an expert evaluation involving 30 experts. Secondly, to improve the questionnaire and measuring scale, a pilot survey was carried out. Lastly, the questionnaire was distributed to Omani construction professionals, including clients, consultants, and contractors. The final dataset for the PLS-SEM analysis was made up of these responses.
3.2. Data Collection and Analysis (Questionnaire 1)
In this study, data were collected through developing an extensive questionnaire by critically reviewing the previous studies in order to determine the main VM activities in building projects as summarized in Table 1. These factors were also adjusted from definitions used in the previous projects for clarity and relevance. The research design of this study is shown in Figure 2. The first questionnaire contained four main sections as follows: demographic information of the experts; VM implementation in building projects in Oman; impacts of success projects indicators (cost, quality, and time); and open-ended questions to add any comments on how to improve the questionnaire. These sections were necessary to obtain rich and relevant data related to the study. In addition, they can profile the respondents, analyze the VM practices in the locality, evaluate the impact of VM on project performance, and obtain expert opinions to enhance the questionnaire. The questionnaire adopted the Likert 4-point scale (where 4 = very relevant, 3 = relevant, 2 = slightly relevant, and 1 = not relevant). The 4-point scale was suitable for expert-based surveys, as respondents typically possessed sufficient knowledge to provide definitive assessments of the measured activities.
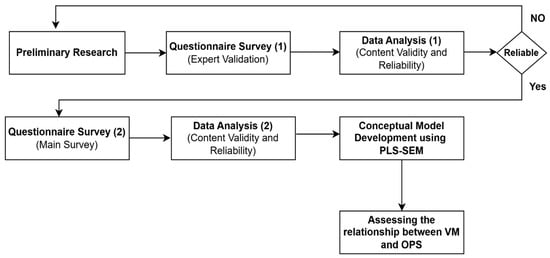
Figure 2.
Research methodology.
According to Yun and Ulrich [53] criteria, the experts groups were usually selected based on experience, related job title, and their capacity to respond to the questionnaire within the determined time schedule. The target group of the first questionnaire included the expert individuals who have more than 10 years of experience in the field of construction engineering/management in Oman to validate the content of the questionnaire survey. The questionnaire was distributed to several experts, and the target number of responses was 30 experts. Selecting a high number of experts resulted in high reliability since it reduced the influence of outliers. The feedback from the interviewers was helpful in fine-tuning the questionnaire and in also making sure that the context applicability of the factors in the Omani construction projects was included, as well as that the language was clear and simple.
3.3. Content Validity Index
Content validity index (CVI) is a statistical tool used to assess the reliability of the content from different research tools, such as surveys, questionnaires, and scales. It can evaluate how well a tool’s items reflect the concept or area under study. The instrument’s comprehensiveness and relevance are guaranteed by the CVI [54]. CVI has two components known as the item level (I-CVI) and the scale level (S-CVI). I-CVI can measure the reliability of the individual items of the research tool, while S-CVI can assess the validity of the entire research tool [55]. In this study, CVI was used to evaluate the response of interviewers from the first questionnaire. The aim of using CVI was to ensure that each question or item was relevant and representative of the hypotheses under study. Subsequently, the CVI was computed to reflect the consensus among experts. Overall content validity of the test was described using S-CVI, while I-CVI demonstrated how many experts selected each item (as relevant). Typically, a CVI score of ≥0.78 was deemed acceptable when the number of experts was nine or more [56]. In cases where the results were below 0.78, then the questions that had a low reply level should be modified.
The majority of experts agreed that VM was applicable at various stages of a project. It was strongly applicable in the information phase, which included site visits, background data collection, and engaging stakeholders in the early stages of the project which was evidenced through the high I-CVI value. The outcome also showed that the importance of VM for improving time, cost, and quality in projects was strengthening. For instance, improved communication, cost reduction, and higher-quality work were three core aspects that many experts felt would greatly benefit from VM. The I-CVI, which indicated the level of consensus among all experts regarding each item, was relatively high for the majority of factors (S-CVI between 0.786 and 0.876). As such, most experts rated most items in the questionnaire as important or very relevant. The CVI results indicated that VM was considered in most of the building projects as an effective tool to achieve project success in the construction industry in Oman. Table 3 summarizes the CVI analysis.
Table 3.
CVI analysis.
3.4. Main Survey (Questionnaire 2)
A comprehensive cross-sectional questionnaire was developed based on the main activities summarized from the literature. In addition, according to the CVI analysis of Questionnaire 1, these results were used to make the necessary adjustments and classify the activities. Several potential building sector participants were asked to complete Questionnaire 2 to assess the impact of VM activities and OPS queries. The second questionnaire consisted of four main parts as follows: demographic information of the respondents; VM activities (shown in Table 1); OPS elements (shown in Table 2); and open-ended questions to allow respondents to comment on or add any activities that they felt were crucial to include. Informed consent was obtained from all participants involved in the study. At the beginning of the questionnaire, a clear statement clarifying the purpose of the questionnaire and the participation in the survey was voluntary. In addition, no personal or identifiable information was collected, and all responses were treated anonymously.
The questionnaire applied the Likert 5-point scale where (5 = strongly agree, 4 = agree, 3 = neutral, 2 = disagree, and 1 = strongly disagree), which has been widely utilized in numerous previous VM research [36]. This was implemented in order to provide participants with a variety of responses based on their experience with building projects. In addition, Likert 5-point scales have been widely accepted in PLS-SEM applications and can provide sufficient variance for reliable parameter estimation [57].
The questionnaire was designed using the English language and, after validation, it was distributed using Google Form through WhatsApp, LinkedIn, and other social media platforms. It was noted that the response was relatively low (76 responses) after 3 months of distributing the questionnaire via Google Form; thus, it was decided to reach out to respondents in their work by distributing hard copies of the questionnaire. A total of 350 questionnaires were distributed as hard copies, with 196 returned questionnaire responses and feedback were received at a 56% response rate, which was considered acceptable in this field [58]. Thus, the total responses received was 272, which satisfied the required sample size. Usually, the sample size can be suggested by the analysis’s goal as stated by Badewi [59]. For example, in studies reliant on descriptive analysis, up to 30 samples can be enough to find the median, mode, and mean for a normal distribution curve [60]. In a previous study using SEM, researchers used a sample size of 200 and claimed that this number achieved significant SEM [61]. While Yin [62] suggested that the sample size should be over 100 but preferably above 200, Kline [63] stated that a particularly complex route model can require a sample size of 200 or more. Zaid Alkilani [64] applied a structured questionnaire in the Jordanian construction industry where 231 responses were received and analyzed using PLS-SEM. Kineber [36] used 226 samples for their study using SEM. In this study, the sample size was calculated using Cochran’s formula [65] as shown in Equation (1):
where n is the sample size, N is the population size, e is the acceptable sampling error, Z corresponds to z value at reliability level or significance level, and p is the population proportion.
Following Al Aamri [18], the population size (N) which was related to the number of engineers who were working in the construction field in Oman was 14,891. The acceptable sampling error (e) was 5% [66] and the confidence level was 90%, thus Z was equal to 1.645. Also, p was assumed to be 0.5. By applying these values in Equation (1), the target number of responses needed was 266 to achieve a 90% confidence level with a 5% margin of error. In addition, to analyze the data using PLS-SEM, the minimum sample size should be calculated. In this study, (G*Power 3.1.9.7) online software has been used to investigate if the sample size utilized was adequate for generating a stable model. This software offered insight into the minimum sample size needed to achieve adequate statistical precision to identify the effects of population interest [67]. Previous studies, such as Memon and Rahman [68] and Taofeeq et al. [69], have applied this software to determine the minimum sample size in construction studies. Using input parameters for example effect size f2 = 0.15, α err prob = 0.05, and power = 95%, the minimum sample size was 138 respondents after calculation.
3.5. PLS-SEM Approach
In this study, four modelling approaches, including multiple linear regression (MLR), structural equation modelling (SEM), system dynamics (SD), and artificial neural networks (ANN), that have been frequently reported in the literature were assessed to determine the optimum approach for creating an implementation-based success model to investigate how VM affected the success of building projects. Because the study included latent (unobserved) characteristics, which can be a major drawback of regression-based modelling in such situations, MLR was deemed inappropriate [70]. Since the current dataset was not organized as a time series, SD was also disregarded because it was primarily intended for time-dependent behaviour. Although ANN can offer strong predictive capability, the central aim of this study was not to prediction but rather to explain how VM was implemented and how its activities related to OPS. Since SEM allows for the simultaneous analysis of correlations between latent variables and observed indicators, it was selected because it fit well with the conceptual framework of OPS and VM implementation. According to earlier research, SEM was useful for managing measurement error and enhancing the strength of connections calculated between constructs [71]. Additionally, SEM is still often used for social science dataset analysis and has established itself as a non-experimental method for testing hypotheses in management- and construction-related research [72]. As a result, this study employed PLS-SEM, a method that is widely used in construction research to assess VM phase activities and measure their impact on OPS. The measurement model in PLS-SEM described how the latent construct (VM implementation) can be represented by its observable indicators (the VM activities).
The data analysis followed a structured two-stage PLS-SEM procedure in accordance with established methodological guidelines. In the first stage, the measurement model was evaluated to assess construct reliability and validity using indicator loadings, Cronbach’s alpha, composite reliability, and average variance extracted (AVE). Discriminant validity was subsequently examined using the Fornell–Larcker criterion, cross-loadings, and the Heterotrait–Monotrait ratio of correlations (HTMT) criterion.
In the second stage, the structural model was assessed to test the hypothesized relationships. This included evaluating collinearity using variance inflation factors (VIF), estimating path coefficients and their significance through bootstrapping, and examining the coefficient of determination (R2) and effect sizes (f2). This sequential approach ensured that the measurement properties of these constructs were satisfactory before interpreting the structural relationships.
4. Results and Discussion
4.1. Descriptive Analysis
Table 4 summarizes the demographic information of the 30 experts who participated in Questionnaire 1. Most of the experts were from the civil engineering sector. In addition, the majority of experts had Bachelor’s and Master’s degrees with a percentage of 43.33%, and 33.33%, respectively.
Table 4.
Main demographic information for experts.
Table 5 summarizes the demographic and professional characteristics of the 272 participants of the study. The majority of respondents (63.24%) had a Bachelor’s degree, followed by those with a Master’s degree (26.10%). PhD holders made up a lesser percentage of participants (8.82%), while diploma holders were minimally represented (1.84%). In terms of occupation, managers made up the largest percentage of respondents (31.62%), followed by 22.79% of quantity surveyors and 20.59% design engineers. On the other hand, directors made up the smallest group (9.56%), while senior managers accounted for 15.44%. With respect to professional discipline, civil engineers formed the largest category (46.32%). Quantity surveying (22.79%) and architecture (18.75%) were also strongly represented, whereas electrical engineering accounted for a smaller proportion (9.19%). Participants from other disciplines comprised only 2.94% of the sample. Finally, the experience distribution indicated that the sample was dominated by mid-career respondents. Those with 5–10 years of experience constituted the largest group (33.82%), closely followed by 31.62% of participants with 10–15 years. Respondents reporting 15–20 years (16.18%) and more than 20 years (15.81%) were also well represented. By comparison, only seven participants (2.57%) had less than 5 years of experience, indicating limited representation from early-career professionals. The experience level of respondents may influence the perceptions of VM techniques and their role in project management. The impact of VM applications on cost optimization, functional performance, and decision-making quality may be more familiar to practitioners with more expertise. On the other hand, respondents with less expertise can view VM more as a tool for reducing costs than as a comprehensive process for value optimization. The results were more robust because of the respondents’ varied professional backgrounds, even though experience-based disparities were not specifically modelled in this study.
Table 5.
Demographic information for respondents.
4.2. Assessment of Measurement Model
Prior to evaluating the structural model, it is important to assess the validity of the measurement model which was considered as the first step of analysis. In this study, the measurement model assessment, including the factor loadings, Cronbach’s alpha, composite reliability (CR), and average variance extracted (AVE) for all latent constructs (VM phases and OPS) were applied in order to assess the validity of the constructs’ convergent and internal consistency, as well as their reliability.
Factor loadings analysis of each item helped evaluate the reliability of the survey’s indicators. According to Sarstedt et al. [73], indicator reliability was the most crucial evaluation criteria for a reflective measurement model. In addition, the authors have summarized that all items that have loading levels higher than (0.708) can be considered as reliable. Moreover, any factor loading with a value between 0.70 and 0.90 has a better degree of reliability [74]. Furthermore, when the factor loadings were higher than 0.708 and the AVE was higher than 0.50, the measurement model was considered as a high quality model [73]. However, if the factor loadings were within 0.60 and 0.708 and the AVE was below 0.50, the items in the question should be deleted. The value of the factor loadings were summarized in Table 6. Values of factor loadings fell within 0.613 and 0.852, reflecting that the majority of indicators had significant factor loadings on their corresponding constructs. The lowest loading (0.613) under the cost construct still fell within the acceptable range, implying that the retained items adequately represented the underlying dimensions. Since all loading factors were higher than the threshold value (0.60), the indicators can be considered as reliable.
Table 6.
Reliability and convergent validity results.
Cronbach’s alpha and CR were also calculated to evaluate the internal consistency, as well as the measurement model’s reliability during the analysis, as shown in Table 6. Results showed that the internal consistency reliability was confirmed by Cronbach’s alpha values for all constructs, which ranged from 0.877 to 0.904 and exceeded the threshold value of 0.70 [73]. The items reliably measured their related constructs, as evidenced by the CR values ranging from 0.878 to 0.910, which were higher than the suggested cutoff of 0.70. These findings support that the measurement model showed acceptable construct reliability. The convergent validity of constructs were evaluated using AVE. As stated by Wong [75], AVE values higher than 0.50 can indicate acceptable convergent values. Results of AVE showed that the values of AVE ranged from 0.540 to 0.583, which were higher than the acceptable threshold, thereby confirming that more than 50% of the variance in the indicators was captured by their respective latent constructs. This supported the convergent validity of the measurement model. Constructs such as creativity (AVE = 0.583) and evaluation (AVE = 0.579) demonstrated particularly strong convergence among their items, reflecting coherence and conceptual homogeneity. Overall, the results of the measurement model showed that all constructs satisfied the suggested standards for convergent validity and reliability. Each construct has a well-established internal consistency, and the observed AVE values verified that the latent variables adequately explained their indicators. As a result, the model provided a strong basis for further structural analysis and testing of hypothesis.
The last test to make sure the measurement model was valid and reliable was discriminant validity. Discriminant validity can be investigated at both the indicator [73] and construct levels. Three methods have been generally used to assess discriminant validity: cross-loading criterion, the Heterotrait–Monotrait ratio of correlations (HTMT) criterion, and the Fornell and Larcker [76] criterion. To assess the discriminating validity, the square root of the AVE for each construct was compared to the correlations of one construct with any other construct. According to the Fornell and Larcker [76] criteria, the square root of the AVE should be greater than the correlation between the latent variables. Table 7 demonstrates that the outcome validates the discriminant validity of the measurement model.
Table 7.
Fornell–Larcker values.
Next, the HTMT was calculated in order to evaluate the discriminatory validity as summarized in Table 8. As shown in the table, it can be noted that all constructs have correlation values less than 0.90; thus, it can be claimed that each construct has a strong correlation with the indicators corresponding to it. As a result, it can be summarized that the constructions have shown enough discrimination and the results were acceptable. The last test to assess the discriminant validity was to check the cross loading. The objective of this test was to determine whether the loading of indicators on a certain latent construct should be greater than the loading on every other construct by row. In other words, one construct’s indicators (items) should have a higher loading than another. Table 9 shows a summary of cross-loading tests. Each loading of an indicator of a specific construct was higher than its loading on other construct. From the results, it can be concluded that discriminant validity was achieved and acknowledged.
Table 8.
Heteriotrait–Monotrait ratio (HTMT).
Table 9.
Cross-loadings.
4.3. Higher Order Construct of the Measurement Model
The PLS-SEM analysis was carried out using SmartPLS (version 4.0). The path weighting scheme was used with up to 300 iterations. Bootstrapping was performed using 5000 iterations with no sign changes to evaluate the importance of path coefficients. These settings followed recommended practices for structural equation modelling using PLS-SEM. The bootstrap method from SmartPLS was used to assess the significant contribution of all first-order latent variables because the primary variables (independent and dependent variables) were second-order latent variables. Usually, high correlations between the formative measurement models’ indicators were not predicted. Additionally, collinearity, which was regarded as undesirable, was suggested by the strong correlation between formative elements [77]. Through analyzing the value of the variable inflation factor (VIF), the collinearity among the formative elements of the construct was investigated. For this purpose, internal VIF values were employed to assess issues of collinearity when we interacted with reflective–formative types of second-order construct. OPS was a formative second-order construct in this model and results for OPS with three subscales, indicated that all three components, including cost (β = 0.945, p < 0.001), time (β = 0.883, p < 0.001), and quality (β = 0.843, p < 0.001) were satisfied. OPS was represented as a formative construct rather than a reflective one because of the conceptual nature of their dimensions. Any variation in one dimension (e.g., time factor) does not necessarily results in a corresponding variation in the other factors (e.g., cost or quality), and omitting any dimension would change the meaning of the OPS construct. Since the combined indicators produced the construct and do not necessarily need to be highly correlated, the formative definition was theoretically valid.
Based on these results, as shown in Table 10, it can be noted that all VIF values were less than 5, ranging from 2.353 for cost to 2.896 for time, which indicated that these subdomains contributed independently to the higher order construct [78]. In addition, all p-values were less than 0.001, as well as the outer loadings values which were higher than 0.70, suggesting that their relationships were statistically significant and indicated that cost, time, and quality were crucial in explaining the OPS.
Table 10.
Test of second-order models using bootstrapping for formative construct.
As a result, amongst the three factors, cost has the highest outer loading with a value of 0.945, highlighting that the cost was the highest significant indicator of OPS in the current model. This could imply that controlling building costs, optimizing project value, and effectively managing financial resources are critical factors in determining OPS. These results agree with previous studies [27,49], which highlighted that VM practices can significantly lower capital and operational costs when effectively executed during the early phases of project planning. The strong loading on cost showed that VM contributed directly to financial efficiency, thereby ensuring better value for money outcomes and enhanced client satisfaction.
Time was the second factor with an outer loading of 0.883. This value also indicated a significant contribution to OPS. This emphasized the view that timely delivery of projects was an essential performance metric within construction project sector. Effective project scheduling, delay minimization, and control of variation orders were the main factors on project time. These results agreed with findings by Atabay and Galipogullari [27], who showed that incorporating VM can lower project durations by up to 17% and thus increase the reliability of delivery schedules. The third dimension (quality) achieved an outer loading of 0.843, which was slightly lower than cost and time, but still represented a strong contribution to project success. This reinforced that adherence to quality standards, compliance with specifications, and achieving client expectations remained important outcomes of successful project execution. The findings were consistent with Tang and Bittner [79], who highlighted that VM improved quality during project design and implementation phases through methodical review and innovative problem solving.
As a conclusion, the strong outer loadings in each of the three dimensions (time, quality, and cost) demonstrated the conceptual validity and statistical reliability of the project success measurement. While the significant contributions of time and quality supported the multi-dimensional nature of project performance, the dominance of the cost dimension indicated that economic efficiency was essential to achieving effective outcomes in building projects. Together, these results demonstrated that the implementation of VM highly improved all important project success factors, including timely delivery, cost effectiveness, and quality compliance; thus, this validated and supported the robustness of the suggested structural model.
4.4. Structural Model Measurement (Path Analysis)
PLS-SEM method was employed in this study where all suggested relationships were evaluated using a bootstrapping approach. Path analysis was considered as one of the statistical tools for linear regression. It is a popular method for simultaneously analyzing all complex interactions [80]. The structural equation model was used in the primary stage of the SEM analysis. The relationship between the study’s constructs can be evaluated using the structural model. The structural equation model was the second major step in the SEM analysis once the model had been fitted. The structural model can be used by identifying the connections between variables. The evaluation of the structural model was performed mainly according to the total model fit with hypothesized parameter estimates followed by size, direction, and importance [67]. The final step in the analysis was confirming the suggested relationships in the study based on its hypotheses as shown in Figure 1. Table 11 and Figure 3 show the results of the bootstrapping.
Table 11.
Structural model result.
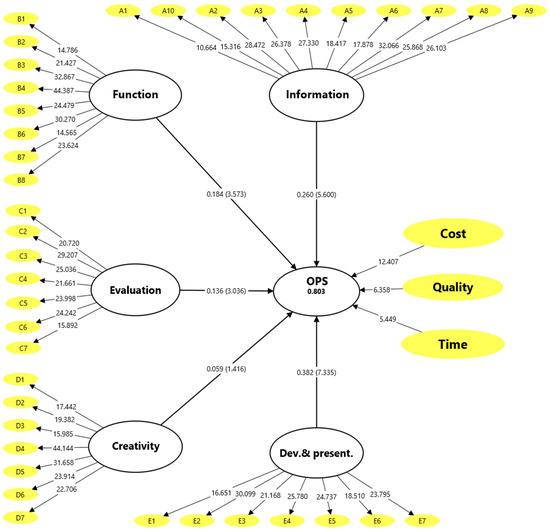
Figure 3.
Structural model after performing bootstrapping analysis (t-values are illustrated on arrows in outer model and arrows between brackets in the inner model, and path coefficient are illustrated on arrows in inner model, and R2 is shown for OPS).
Based on the results, it can be summarized that there was a significant correlation between OPS and VM phases, except for the creativity phase H1 (β = 0.059, p > 0.001); therefore, H1 was not supported, meaning that the effect of creativity phase was not significant on OPS. However, other hypotheses from H2 to H5 were found to be supported and significant, which in turn supported the importance of these phases on project success. Figure 3 shows the values of β for each hypothesis.
4.5. Coefficient of Determination (R2) and Model Predictive Strength
The explanatory power of the structural model was evaluated by assessing the variance in the endogenous construction (OPS) and explained by the exogenous latent construct, or VM phases. Using the PLS algorithm, the coefficient of determination (R2) and the adjusted R2 values were calculated. These values tested the model’s predictive accuracy and explanatory capacity [81]. When R2 values were higher, this revealed stronger explanatory ability of the model in predicting the endogenous variable. As shown in Figure 3, R2 value for OPS was 0.803, while the adjusted R2 was 0.800 as calculated by SmartPLS. This finding suggested that almost 80.3% of the variance in OPS can be described by the implementation of the VM phases. According to Chin [82] criteria, R2 values of 0.67, 0.33, and 0.19 correspond to substantial, moderate, and weak explanatory power.
The result of R2 in the current study (0.803) exhibited a substantial level of explanatory and predictive strength. The results thus verified that the structural model exhibited excellent predictive performance and strong theoretical validity. Furthermore, the effect size (f2) was calculated to identify the significance of VM phases effect on project success. f2 was measured using the change in R2 when the exogenous construct was both included and excluded from the model [82]. An f2 value that was found to be 0.793 implied a very large effect size based on Cohen [83]. This substantial f2 value supported the critical influence of VM phases implementation in the success of building projects, highlighting its strong practical and theoretical significance. In addition, the model’s predictive relevance (Q2) was measured using the blindfolding tool from SmartPLS version 4.0 software. The Q2 value was 0.794, which was more than 0, indicated that the independent construct has predictive significance [84].
The results of this study have several conclusions which can be useful for Oman’s construction sector stakeholders, as well as those in other developing countries. VM should be institutionalized as a formal management approach rather than being used on an ad hoc basis, as evidenced by the strong correlation between its application and OPS. Early VM integration during the planning and design phases can help project owners and clients make better decisions, cut down unnecessary costs, and improve functional performance without compromising quality. In addition, the findings emphasized the significance of implementing interdisciplinary VM workshops for consultants and designers to enhance value-based design options and match technical solutions with stakeholder expectations. By increasing collaboration, maximizing resource use, and minimizing rework during project execution, VM can help contractors. Furthermore, the results supported the creation of national guidelines and training programmes to encourage VM adoption in public and private building projects from a legislative and regulatory standpoint, especially in line with Oman Vision 2040 objectives.
5. Limitations and Future Research Directions
Despite the study’s contributions, a number of limitations should be noted. First, the study depended mainly on cross-sectional survey data which may limit its capacity to infer causal links between the implementation of VM and the OPS. Longitudinal studies could provide better insights into how VM practices can influence project outcomes over different project phases. Second, the study’s emphasis on construction projects within the Omani construction industry may restrict its findings’ applicability to other infrastructure projects or other national settings. Future studies could expand the model to include comparable regional settings and other building industries.
Third, the traditional dimensions of cost, time, and quality were used to measure the overall success of the project. Although these dimensions were commonly recognized and objectively quantifiable, more comprehensive success criteria including sustainability, safety, and stakeholder satisfaction will need further research.
Lastly, the moderating effects of respondent characteristics, like professional role and experience level, were not specifically examined in the study. Future research may use mixed methods approaches or multi-group analysis to investigate how these elements affect project success and value management perceptions.
6. Conclusions
Although value management (VM) is widely applied in building projects in several countries, its implementation remains limited in many developing contexts. This study investigated the influence of VM implementation on the overall success of building projects (OPS) in Oman using PLS-SEM. The results showed that VM phases together exhibited a significant relationship with project success, confirming the proposed hypothesis. The model demonstrated strong predictive accuracy, explaining 80.3% of the variance in project performance. The large effect size (f2 = 0.793) further underscored the substantial effect of VM implementation on project performance. Among the dimensions of OPS, cost emerged as the most dominant factor (outer loading = 0.945), followed by time (0.883) and quality (0.843). This indicated that cost optimization was the primary concern in Omani construction projects, while time and quality contributed in significant supporting roles. These results highlighted the significance of incorporating VM phases and activities throughout the project phases to ensure effective allocation of resources, minimize waste, and improve value for clients. From a theoretical perspective, the study enhanced the understanding of VM by analytically verifying its function as a critical factor of OPS in developing countries. In addition, the results demonstrated the ability of VM to deliver extensive benefits when systematically applied across the information, function, evaluation, and development phases.
From a practical perspective, the results have proposed actionable perceptions for industry stakeholders as well as policy makers. Construction sectors should apply formal VM frameworks and conduct workshops during early project stages to align stakeholder objectives and optimize functional performance. Policymakers and clients should be encouraged to mandate VM integration within public and private sector projects to enhance cost efficiency and long-term project sustainability. Overall, the study has provided robust evidence that effective implementation of value management is a decisive enabler of project success, positioning it as a cornerstone for advancing Oman’s construction sector toward achieving the objectives of Vision 2040.
Author Contributions
Software, N.A. and T.A.M.; Validation, T.A.M.; Formal analysis, N.A.; Data curation, N.A.; Writing—original draft, N.A.; Writing—review and editing, M.Z.R., T.A.M. and D.M.; Supervision, M.Z.R.; Project administration, D.M. All authors have read and agreed to the published version of the manuscript.
Funding
This research received no external funding.
Institutional Review Board Statement
The study was conducted in accordance with the Declaration of Helsinki, and approved by the Institutional Review Board of the Research Ethics and Biosafety Committee (UREBC) of A’Sharqiyah University (protocol code ASU/UREBC/26/10 and 10 June 2025).
Informed Consent Statement
Informed consent was obtained from all participants involved in the study. At the beginning of the questionnaire, a clear statement clarifying the purpose of the questionnaire and the participation in the survey was voluntary. In addition, no personal or identifiable information was collected, and all responses were treated anonymously.
Data Availability Statement
The original contributions presented in this study are included in the article. Further inquiries can be directed to the corresponding authors.
Conflicts of Interest
The authors declare no conflicts of interest.
References
- Mousa, A. A Business approach for transformation to sustainable construction: An implementation on a developing country. Resour. Conserv. Recycl. 2015, 101, 9–19. [Google Scholar] [CrossRef]
- Soliman, M.M.A.I. Risk Management in International Construction Joint Ventures in Egypt. Ph.D. Thesis, University of Leeds, Leeds, UK, 2014. [Google Scholar]
- Lu, W. Reliability of Engineering News-Record international construction data. Constr. Manag. Econ. 2014, 32, 968–982. [Google Scholar] [CrossRef]
- Kenley, R. Productivity improvement in the construction process. Constr. Manag. Econ. 2014, 32, 489–494. [Google Scholar] [CrossRef]
- Kineber, A.F.; Othman, I.; Oke, A.E.; Chileshe, N.; Zayed, T. Exploring the value management critical success factors for sustainable residential building—A structural equation modelling approach. J. Clean. Prod. 2021, 293, 126115. [Google Scholar] [CrossRef]
- Barakat, M.S.; Naayem, J.H.; Baba, S.S.; Kanso, F.A.; Borgi, S.F.; Arabian, G.H.; Nahlawi, F.N. Egypt economic report: Between the recovery of the domestic economy and the burden of external sector challenges. Economics 2016, 25, 1–19. [Google Scholar]
- Kolo, B.A.; Ibrahim, A.D. Value management: How adoptable is it in the Nigerian construction industry. In Proceedings of the West Africa Built Environment Research Conference, Accra, Ghana, 27–28 July 2010; pp. 653–663. [Google Scholar]
- Shen, Q.; Liu, G. Critical success factors for value management studies in construction. J. Constr. Eng. Manag. 2003, 129, 485–491. [Google Scholar] [CrossRef]
- Kineber, A.F.; Othman, I.; Oke, A.E.; Chileshe, N.; Zayed, T. Value management implementation barriers for sustainable building: A bibliometric analysis and partial least square structural equation modeling. Constr. Innov. 2023, 23, 38–73. [Google Scholar] [CrossRef]
- Aripin, Z.; Mulyani, S.R.; Haryaman, A. Marketing strategy in project sustainability managment efforts in extractive industries: Building a reciprocity framework for community engagement. KRIEZ Acad. J. Dev. Community Serv. 2023, 1, 25–38. [Google Scholar]
- Aboelmagd, Y.M.R.; Eskander, R.F.A. Integrated Time Schedule Delays Forecasting Model In Egyptian Construction Sites. Oper. Res. Eng. Sci. Theory Appl. 2023, 6, 220–245. [Google Scholar]
- Luo, P.; Sun, Y.; Wang, S.; Wang, S.; Lyu, J.; Zhou, M.; Nakagami, K.; Takara, K.; Nover, D. Historical assessment and future sustainability challenges of Egyptian water resources management. J. Clean. Prod. 2020, 263, 121154. [Google Scholar] [CrossRef]
- Alnuaimi, A.S.; Al Balushi, I.A.; Fathoni, U. Value engineering in construction industry. Int. J. Appl. Innov. Eng. Manag. IJAIEM 2017, 2, 18–26. [Google Scholar]
- Kim, S.-Y.; Lee, Y.-S.; Nguyen, V.T. Barriers to applying value management in the Vietnamese construction industry. J. Constr. Dev. Ctries. 2016, 21, 55. [Google Scholar] [CrossRef]
- Alshubiri, F.N.; Tawfik, O.I.; Jamil, S.A. Impact of petroleum and non-petroleum indices on financial development in Oman. Financ. Innov. 2020, 6, 15. [Google Scholar] [CrossRef]
- Umar, T. Causes of delay in construction projects in Oman. Middle East J. Manag. 2018, 5, 121–136. [Google Scholar] [CrossRef]
- Shaukat, M.B.; Latif, K.F.; Sajjad, A.; Eweje, G. Revisiting the relationship between sustainable project management and project success: The moderating role of stakeholder engagement and team building. Sustain. Dev. 2022, 30, 58–75. [Google Scholar] [CrossRef]
- Al Aamri, A.M.S.; Evdorides, H.; Baniotopoulos, C. Barriers and Opportunities for the Adoption of Building Information Modelling in the Design of Buildings: Case Study of Oman. Sustainability 2018, 17, 3510. [Google Scholar] [CrossRef]
- Brissaud, D.; Sakao, T.; Riel, A.; Erkoyuncu, J.A. Designing value-driven solutions: The evolution of industrial product-service systems. CIRP Ann. 2019, 71, 553–575. [Google Scholar] [CrossRef]
- Ojo, L.D.; Ogunsemi, D.R.; Elyamany, A.; Oke, A.E. Profound barriers to value management adoption on construction projects in a developing nation. J. Eng. Des. Technol. 2025, 23, 264–286. [Google Scholar] [CrossRef]
- Pervin, M.S. Integration of Value Management (VM) Process in Bangladesh: Disaster Management (DM) Projects; International Institute for Science, Technology and Education (IISTE): New York, NY, USA, 2018; pp. 1–33. [Google Scholar]
- Jensen, M.C. Value maximization, stakeholder theory, and the corporate objective function. Bus. Ethics Q. 2002, 235–256. [Google Scholar] [CrossRef]
- Venkataraman, R.R.; Pinto, J.K. Cost and Value Management in Projects; John Wiley & Sons: Hoboken, NJ, USA, 2023. [Google Scholar]
- SAVE International. Value Methodology Standard; SAVE International: Jersey City, NJ, USA, 2015. [Google Scholar]
- Yanita, R.; Mochtar, K. Legal aspect of value engineering implementation in Jakarta (Indonesia) construction projects. Int. J. Constr. Manag. 2021, 21, 131–139. [Google Scholar] [CrossRef]
- Kelly, J.; Male, S.; Graham, D. Value Management of Construction Projects; Blackwell Science Ltd.: Oxford, UK, 2002; pp. 77–99. [Google Scholar] [CrossRef]
- Ellis, R.C.T.; Wood, G.D.; Keel, D.A. Value management practices of leading UK cost consultants. Constr. Manag. Econ. 2005, 23, 483–493. [Google Scholar] [CrossRef]
- Atabay, S.; Galipogullari, N. Application of value engineering in construction projects. In Proceedings of the 10th International Congress on Advances in Civil Engineering, 17–19 October 2012; Middle East Technical University: Ankara, Turkey, 2013; Volume 1. [Google Scholar]
- Sameer, N.; Alalouch, C.; Saleh, M.S.; Al-Saadi, S.; Saleem, A. Towards sustainable smart cities: A study on digital participatory planning in Oman. Proc. Inst. Civ. Eng. Des. Plan. 2022, 175, 72–90. [Google Scholar] [CrossRef]
- Zainul Abidin, N.; Powmya, A. Identifying barriers in constructing green buildings in Oman: A study on project contractors’ experience. Built Environ. Proj. Asset Manag. 2024, 15, 67–84. [Google Scholar] [CrossRef]
- Aigbavboa, C.; Oke, A.; Mojele, S. Contribution of value management to construction projects in South Africa. In Proceedings of the 5th Construction Management Conference, Budapest, Hungary, 25–28 June 2016; pp. 226–234. [Google Scholar]
- Alan Short, C.; Barrett, P.; Dye, A.; Sutrisna, M. Impacts of value engineering on five Capital Arts projects. Build. Res. Inf. 2007, 35, 287–315. [Google Scholar] [CrossRef]
- Abidin, N.Z.; Pasquire, C.L. Revolutionize value management: A mode towards sustainability. Int. J. Proj. Manag. 2007, 25, 275–282. [Google Scholar] [CrossRef]
- SAVE. Value Methodology Standard; SAVE International: Mount Royal, NJ, USA, 2008. [Google Scholar]
- Khudzari, F.; Haron, A.T.; Ayer, S.K.; Rahman, R.A. Transformative Trajectories: PLS-SEM Analysis of Factors Influencing Emerging Technologies in Construction Adoption in Malaysia. J. Inf. Technol. Constr. 2025, 30, 45–64. [Google Scholar] [CrossRef]
- Kineber, A.F.; Othman, I.; Oke, A.E.; Chileshe, N.; Buniya, M.K. Impact of value management on building projects success: Structural equation modeling approach. J. Constr. Eng. Manag. 2021, 147, 4021011. [Google Scholar] [CrossRef]
- Hwang, B.-G.; Zhao, X.; Toh, L.P. Risk management in small construction projects in Singapore: Status, barriers and impact. Int. J. Proj. Manag. 2014, 32, 116–124. [Google Scholar] [CrossRef]
- Mohamad Ramly, Z.; Shen, G.Q.; Yu, A.T.W. Critical success factors for value management workshops in Malaysia. J. Manag. Eng. 2015, 31, 5014015. [Google Scholar] [CrossRef]
- Kineber, A.F.; Othman, I.; Oke, A.E.; Chileshe, N.; Alsolami, B. Critical value management activities in building projects: A case of Egypt. Buildings 2020, 10, 239. [Google Scholar] [CrossRef]
- Shen, Q. Value management in Hong Kong’s construction industry: Lessons learned. In Proceedings of the Save International Conference Proceeding, Hong Kong, 16 December 1997; pp. 260–265. [Google Scholar]
- Jaapar, A.; Endut, I.R.; Bari, N.A.A.; Takim, R. The impact of value management implementation in Malaysia. J. Sustain. Dev. 2009, 2, 210–219. [Google Scholar] [CrossRef]
- Chua, D.K.H.; Kog, Y.-C.; Loh, P.K. Critical success factors for different project objectives. J. Constr. Eng. Manag. 1999, 125, 142–150. [Google Scholar] [CrossRef]
- Othman, I.; Kineber, A.F.; Oke, A.E.; Khalil, N.; Buniya, M.K. Drivers of value management implementation in building projects in developing countries. J. Phys. Conf. Ser. 2020, 1529, 042083. [Google Scholar] [CrossRef]
- Batra, S. Exploring the application of PLS-SEM in construction management research: A bibliometric and meta-analysis approach. Eng. Constr. Archit. Manag. 2025, 32, 2697–2727. [Google Scholar] [CrossRef]
- Tabish, S.Z.S.; Jha, K.N. Identification and evaluation of success factors for public construction projects. Constr. Manag. Econ. 2011, 29, 809–823. [Google Scholar] [CrossRef]
- De Wit, A. Measurement of project success. Int. J. Proj. Manag. 1988, 6, 164–170. [Google Scholar] [CrossRef]
- Kaming, P.F.; Olomolaiye, P.O.; Holt, G.D.; Harris, F.C. Factors influencing construction time and cost overruns on high-rise projects in Indonesia. Constr. Manag. Econ. 1997, 15, 83–94. [Google Scholar] [CrossRef]
- Oke, A.E.; Tech, B.; Qs, M. Evaluation of the Administration of Construction Bonds in Lagos and Ondo States. Nigeria. Ph.D. Thesis, Federal University of Technology Akure, Gaga, Nigeria, 2015. [Google Scholar]
- Kelly, J.; Male, S. Value Management in Design and Construction; Routledge: Abingdon, UK, 2003. [Google Scholar]
- Fong, C.Y. An Exploratory Study on the Implementation of Value Management Among Engineering Professionals in the Klang Valley/Fong Chong Yit. Master’s Thesis, University of Malaya, Kuala Lumpur, Malaysia, 2012. [Google Scholar]
- Jaapar, A.; Maznan, N.A.; Zawawi, M. Implementation of value management in public projects. Procedia-Social. Behav. Sci. 2012, 68, 77–86. [Google Scholar] [CrossRef]
- Brown, J.R.; Dant, R.P. On what makes a significant contribution to the retailing literature. J. Retail. 2008, 84, 131–135. [Google Scholar] [CrossRef]
- Yun, J.; Ulrich, D.A. Estimating measurement validity: A tutorial. Adapt. Phys. Act. Q. 2002, 19, 32–47. [Google Scholar] [CrossRef]
- Polit, D.F.; Beck, C.T.; Owen, S.V. Is the CVI an acceptable indicator of content validity? Appraisal and recommendations. Res. Nurs. Health 2007, 30, 459–467. [Google Scholar] [CrossRef] [PubMed]
- Wang, F.; Sahid, S. Content validation and content validity index calculation for entrepreneurial behavior instruments among vocational college students in China. Multidiscip. Rev. 2024, 7, 2024187. [Google Scholar] [CrossRef]
- Lynn, M.R. Determination and quantification of content validity. Nurs. Res. 1986, 35, 382–386. [Google Scholar] [CrossRef]
- Gorai, J.; Kumar, A.; Angadi, G.R. Smart PLS-SEM modeling: Developing an administrators’ perception and attitude scale for apprenticeship programme. Multidiscip. Sci. J. 2024, 6, 2024260. [Google Scholar] [CrossRef]
- Wahyuni, D. The research design maze: Understanding paradigms, cases, methods and methodologies. J. Appl. Manag. Account. Res. 2012, 10, 69–80. [Google Scholar]
- Badewi, A. Investigating Benefits Realisation Process for Enterprise Resource Planning Systems. Ph.D. Thesis, Cranfield University, Cranfield, UK, 2016. [Google Scholar]
- Field, A. Discovering Statistics Using IBM SPSS Statistics; Sage Publishing: Thousand Oaks, CA, USA, 2013. [Google Scholar]
- Harris, M.M.; Schaubroeck, J. Confirmatory modeling in organizational behavior/human resource management: Issues and applications. J. Manag. 1990, 16, 337–360. [Google Scholar] [CrossRef]
- Yin, R.K. Case Study Research Design and Methods, 3rd ed.; Applied Social Research methods Series; Sage Publications, Inc.: Thousand Oaks, CA, USA, 2009; Volume 5. [Google Scholar]
- Kline, R.B. Principles and Practice of Structural Equation Modeling; Guilford Publications: New York, NY, USA, 2023. [Google Scholar]
- Zaid Alkilani, S. Performance Measurement and Improvement Model for Small and Medium Contractors in Developing Countries. Ph.D. Thesis, The University of New South Wales, Sydney, Australia, 2018. [Google Scholar]
- Cochran, W.G. Double sampling. In Sampling Techniques, 3rd ed.; John Wiley Sons, Inc.: New York, NY, USA, 1977; pp. 327–358. [Google Scholar]
- Dillman, D.A. Moving survey methodology forward in our rapidly changing world: A commentary. J. Rural Soc. Sci. 2016, 31, 8. [Google Scholar]
- Hair, J.F., Jr.; Hult, G.T.M.; Ringle, C.M.; Sarstedt, M.; Danks, N.P.; Ray, S. Partial Least Squares Structural Equation Modeling (PLS-SEM) Using R: A Workbook; Springer Nature: Berlin/Heidelberg, Germany, 2021. [Google Scholar]
- Memon, A.H.; Rahman, I.A. SEM-PLS analysis of inhibiting factors of cost performance for large construction projects in Malaysia: Perspective of clients and consultants. Sci. World J. 2014, 2014, 165158. [Google Scholar] [CrossRef]
- Taofeeq, D.M.; Adeleke, A.Q.; Ajibike, W.A. Human factors influencing contractors’ risk attitudes: A case study of the Malaysian construction industry. Constr. Econ. Build. 2020, 20, 96–116. [Google Scholar] [CrossRef]
- Oke, A.E.; Aigbavboa, C.O. Sustainable Value Management. In Sustainable Value Management for Construction Projects; Springer: Berlin/Heidelberg, Germany, 2017; pp. 129–152. [Google Scholar]
- Purwanto, A.; Sudargini, Y. Partial least squares structural squation modeling (PLS-SEM) analysis for social and management research: A literature review. J. Ind. Eng. Manag. Res. 2021, 2, 114–123. [Google Scholar]
- Kineber, A.F.; Othman, I.; Famakin, I.O.; Oke, A.E.; Hamed, M.M.; Olayemi, T.M. Challenges to the implementation of building information modeling (BIM) for sustainable construction projects. Appl. Sci. 2023, 13, 3426. [Google Scholar] [CrossRef]
- Sarstedt, M.; Ringle, C.M.; Hair, J.F. Partial least squares structural equation modeling. In Handbook of Market Research; Springer: Berlin/Heidelberg, Germany, 2021; pp. 587–632. [Google Scholar]
- Haji-Othman, Y.; Yusuff, M.S.S. Assessing reliability and validity of attitude construct using partial least squares structural equation modeling. Int. J. Acad. Res. Bus. Soc. Sci. 2022, 12, 378–385. [Google Scholar] [CrossRef]
- Wong, K.K.-K. Partial least squares structural equation modeling (PLS-SEM) techniques using SmartPLS. Mark. Bull. 2013, 24, 1–32. [Google Scholar]
- Fornell, C.; Larcker, D.F. Evaluating structural equation models with unobservable variables and measurement error. J. Mark. Res. 1981, 18, 39–50. [Google Scholar] [CrossRef]
- Hair, J.F., Jr.; Matthews, L.M.; Matthews, R.L.; Sarstedt, M. PLS-SEM or CB-SEM: Updated guidelines on which method to use. Int. J. Multivar. Data Anal. 2017, 1, 107–123. [Google Scholar] [CrossRef]
- Alrawhani, E.M.; Romli, A.B.; Al-Sharafi, M.A.; Alkawsi, G. Integrating Information Security Culture and Protection Motivation to Enhance Compliance with Information Security Policies in Banking: Evidence from PLS-SEM and fsQCA. Int. J. Hum. Comput. Interact. 2025, 41, 12728–12749. [Google Scholar] [CrossRef]
- Tang, P.; Bittner, R.B. Use of value engineering to develop creative design solutions for marine construction projects. Pract. Period. Struct. Des. Constr. 2014, 19, 129–136. [Google Scholar] [CrossRef]
- Tabachnick, B.G.; Fidell, L.S.; Ullman, J.B. Using Multivariate Statistics; Pearson: Boston, MA, USA, 2007; Volume 5. [Google Scholar]
- Kineber, A.F.; Ali, A.H.; Elshaboury, N.; Oke, A.E.; Arashpour, M. A multi-criteria evaluation and stationary analysis of value management implementation barriers for sustainable residential building projects. Int. J. Constr. Manag. 2024, 24, 199–212. [Google Scholar] [CrossRef]
- Chin, W.W. Commentary: Issues and opinion on structural equation modeling. MIS Q. 1998, 22, 7–16. [Google Scholar]
- Cohen, J. Statistical Power for the Behavioural Sciences; Lawrence Erlbaum: Hilsdale, NY, USA, 1988; Volume 58, pp. 7–19. [Google Scholar]
- Hair, J.F.; Ringle, C.M.; Sarstedt, M. Partial least squares structural equation modeling: Rigorous applications, better results and higher acceptance. Long Range Plan. 2013, 46, 1–12. [Google Scholar] [CrossRef]


Disclaimer/Publisher’s Note: The statements, opinions and data contained in all publications are solely those of the individual author(s) and contributor(s) and not of MDPI and/or the editor(s). MDPI and/or the editor(s) disclaim responsibility for any injury to people or property resulting from any ideas, methods, instructions or products referred to in the content. |
© 2026 by the authors. Licensee MDPI, Basel, Switzerland. This article is an open access article distributed under the terms and conditions of the Creative Commons Attribution (CC BY) license.