Abstract
School buildings are important in terms of energy performance, and their energy demand varies significantly across different climates. Early design decisions strongly influence this demand; however, building energy simulations are computationally intensive and limit rapid evaluation of alternative design options at scale. This study proposes a machine learning-based surrogate modeling framework to support early design energy assessment of school buildings across Türkiye’s six TS 825 climatic regions. A comprehensive design space is defined by varying key parameters, including building shape, orientation, window-to-wall ratio, shading, glazing systems, and insulation alternatives. Representative design configurations are generated using stratified random sampling, and then simulated in EnergyPlus, resulting in a dataset of 30,000 samples. Random Forest, Support Vector Regression, and Multilayer Perceptron models are developed within a multi-output regression framework to predict annual heating and cooling energy demand across climatic regions. The models achieve high predictive accuracy and consistent generalization, with test R2 values exceeding 0.93, while exhibiting performance differences among the evaluated algorithms. Feature importance analysis identifies window-to-wall ratio and glazing-related parameters as the most influential early design variables. Overall, the results demonstrate that machine learning-based surrogate models can substantially reduce computational effort while providing reliable, climate-responsive support for early design decision-making.
1. Introduction
Buildings account for a substantial share of global energy consumption and associated greenhouse gas emissions, making energy-efficient building design a key component of climate change mitigation strategies [1]. To achieve energy-efficient buildings, evaluating the impact of architectural and envelope-related design variables on building energy performance is fundamental. Both building energy simulation (BES) tools and data-driven approaches, such as machine learning models, are commonly employed to predict building energy performance [2,3].
Conventional BES tools, many of which are validated according to established standards, such as EnergyPlus, TRNSYS, and IES-VE, as well as software platforms built upon these engines (e.g., DesignBuilder and OpenStudio), provide detailed and physically accurate predictions for buildings at the design stage and for existing buildings calibrated with measured data [4,5]. However, these tools require substantial modeling effort and computational time, particularly when evaluating a large number of design alternatives [6,7]. As a result, exhaustive simulation-based design exploration often becomes impractical within typical project timelines [8,9].
To address these limitations, data-driven surrogate modeling approaches, particularly those based on machine learning, have emerged as a promising alternative for early-stage energy assessment. By learning the relationships between design parameters and energy performance from a limited number of simulations, machine learning models can provide rapid and reasonably accurate predictions, enabling iterative design exploration during early design stages [10]. Machine learning models are often described as black-box approaches, as the underlying factors driving prediction outcomes may not be directly interpretable, and models developed for specific cases can exhibit limited transferability to other design contexts [8,11]. Accordingly, this study focuses on the effective application and systematic evaluation of surrogate modeling within an early-design energy assessment framework across multiple climatic contexts.
Regarding data sources for machine learning-based energy prediction, two primary alternatives are commonly used: real operational data and simulation-based data. While operational datasets obtained from smart meters or building management systems can provide valuable insights, they typically require extensive data collection, preprocessing, and cleaning efforts [12,13]. In contrast, simulation-based datasets derived from transparent, physics-based models enable well-controlled and structured input–output relationships, making them particularly suitable for supervised machine learning applications that support early design stage exploration [10,14,15]. In practice, operational data are often used to calibrate or validate physics-based simulation models, and the resulting simulation outputs are subsequently employed to train surrogate models for energy analysis.
Unlike many machine learning applications in the building domain that rely on operational data for short-term or real-time energy forecasting [16], surrogate models trained on simulation-based datasets are specifically suited to design-stage decision-making, when operational data are not yet available. In this context, the representativeness and coverage of the training dataset play a critical role in determining surrogate model reliability, as models trained on narrowly defined or insufficiently sampled design spaces may exhibit limited generalization capability. Moreover, modeling decisions are sometimes made without fully understanding their potential impact on prediction performance, which can lead to unstable or suboptimal modeling workflows [11]. In this regard, Kömürcü and Edis (2025) [11] reported that key factors influencing prediction accuracy include the choice of machine learning algorithm, the selection of input variables, and the definition of the sampling range.
Among public buildings, schools constitute an important building category in Türkiye in terms of energy consumption, due to their long operating hours, high occupancy densities, and intensive daily use patterns. According to national statistics, school buildings account for a considerable share of non-residential energy consumption in Türkiye, with their contribution estimated at approximately 23% of the total non-residential sector energy use [17]. In this context, the fact that their heating and cooling energy demand is highly sensitive to architectural and envelope-related design decisions is particularly important [18]. Early-stage choices regarding building geometry, orientation, window-to-wall ratio (WWR), shading configuration, and envelope properties directly influence the building’s long-term heating and cooling energy demand during operation [19]. At the conceptual design stage, design flexibility is high and modifications can be implemented at relatively low cost; however, reliable feedback on energy performance is often limited at this phase [20].
Beyond its technical importance, energy efficiency in buildings has increasingly become a regulatory requirement at both international and national levels. Many countries are strengthening their legal frameworks to reduce building energy consumption, often by updating national standards and climate classifications to reflect local conditions. In this context, Türkiye continues to revise its building energy regulations in alignment with European Union directives [21] while adapting them to its own climatic and regional characteristics [22]. The Second National Energy Efficiency Action Plan (2024–2030) [23] identifies the building sector as a priority for reducing energy consumption and greenhouse gas emissions, promoting higher energy performance standards and increased integration of renewable energy systems. In parallel, the 2024 revision of the national thermal insulation standard TS 825 [24] introduced stricter envelope performance requirements and expanded the national climate classification from four to six regions [25]. These regulatory developments emphasize the necessity of climate-responsive early-stage architectural and envelope-related design decisions to achieve energy efficiency and regulatory compliance across diverse climatic conditions.
1.1. Research Gap and Objectives
Despite the growing body of research on machine learning-based approaches for building energy prediction, several limitations persist with respect to early design-stage decision support. Existing studies are often constrained by a limited set of design parameters, focus on a single building type, or are restricted to specific climatic contexts, thereby reducing their applicability for comprehensive early-stage design exploration and generalization [8,14,26,27,28]. Multiple review studies consistently report that data-driven models are predominantly developed for case-specific scenarios, with limited attention given to transferability across building typologies or climatic conditions [8,14,28].
In particular, prediction frameworks that explicitly align with national or regulatory climate zoning schemes remain limited. While climatic conditions are commonly included as input variables in machine learning models, they are typically incorporated implicitly through weather files rather than organized according to regulatory climate classifications. As a result, many existing models offer limited direct support for policy and regulation-compliant design decision-making [27,28,29].
Furthermore, while simulation-driven machine learning studies increasingly investigate large parametric design spaces, training datasets are frequently generated using heuristic or non-systematic sampling strategies. Existing reviews highlight substantial variation in dataset construction, feature selection, and data preprocessing, often without explicit consideration of how representativeness and computational efficiency are balanced [11,12,14,28]. This lack of systematic dataset design can limit surrogate model robustness and reduce generalization to new or unexplored design configurations.
Another persistent limitation concerns the interpretability of machine learning outputs in architectural decision-making, particularly at early design stages. Although many studies report high predictive accuracy, they often provide limited clarification of how model outputs can inform specific architectural decisions, such as envelope configuration or design option comparison [8,28,29]. Recent reviews further highlight that black-box modeling approaches and insufficiently transparent workflows restrict integration of machine learning tools into design practice [11,30].
These limitations are particularly critical for school buildings, where heating and cooling energy demand is highly sensitive to early-stage architectural and envelope-related design decisions, and where compliance with climate-responsive national regulations is essential. In Türkiye, recent studies have demonstrated the feasibility of simulation-based and data-driven approaches for assessing building energy performance under specific climatic conditions or through individual building case studies.
Despite these efforts, review studies consistently indicate that early-stage machine learning-based energy prediction approaches remain focused on isolated cases and specific contexts, with limited integration of building typology and climatic diversity within a unified modeling structure. As a result, comprehensive early-stage energy prediction frameworks that systematically address school building typologies, representative design-space sampling, and multiple climatic regions at a national scale remain scarce [9,14,28,31].
Accordingly, this study aims to develop a machine learning-based early-stage energy prediction framework to estimate annual heating and cooling energy demand of school buildings across Türkiye’s six climatic regions defined by TS 825, the “TS 825 Thermal Insulation Requirements for Buildings” standard, which serves as Türkiye’s principal regulation for thermal insulation and building envelope performance (TS 825:2024) [24,25]. The framework is based on a simulation-generated dataset obtained by systematically varying key architectural and envelope-related design parameters, enabling rapid energy performance prediction without reliance on time-intensive simulations. In addition, the proposed approach supports identification of influential design parameters to inform climate-responsive early-stage design decisions for educational buildings. The specific objectives of the study are to:
- Define a comprehensive early-stage parametric design space based on architectural and envelope-related variables relevant to school buildings;
- Generate a representative multi-climate simulation dataset using a strategic sampling approach that balances design space coverage and computational efficiency [11,14,28];
- Develop and evaluate machine learning models capable of predicting annual heating and cooling energy demand of school buildings across multiple climatic regions within a unified framework;
- Analyze the relative influence of key design parameters to support climate-responsive early-stage decision-making.
1.2. Contributions of the Study
This study contributes to research on early-stage building energy prediction and climate-responsive design in several important ways. First, it proposes a machine learning-based surrogate modeling framework developed to support early-stage energy assessment of school buildings across diverse climatic regions. While previous studies in Türkiye have demonstrated the feasibility of data-driven energy prediction for individual building cases or selected climatic contexts, the proposed framework extends this body of work by explicitly incorporating Türkiye’s six national climate zones within a unified predictive structure.
Second, the study defines and systematically explores an early-stage parametric design space encompassing building geometry, envelope properties, glazing characteristics, orientation, and shading strategies relevant to school buildings. By adopting a structured sampling strategy based on simulation-generated data, the proposed approach addresses limitations observed in both international and national studies related to dataset representativeness, scalability, and robustness.
Third, supervised machine learning models are developed and evaluated to predict annual heating and cooling energy demand of school buildings under multiple climatic conditions within a single modeling framework. This enables efficient and consistent performance evaluation across regions, substantially reducing reliance on repetitive and time-intensive simulation workflows reported in prior studies.
Finally, the study examines the relative importance of key architectural and envelope-related design parameters through feature importance analysis, enhancing interpretability and decision relevance of machine learning predictions for early-stage architectural design. To further demonstrate practical applicability, a graphical user interface is developed, enabling designers and practitioners to obtain rapid energy predictions for school buildings during the early design phase.
2. Background: Machine Learning-Based Energy Prediction in Early Design
2.1. Early-Stage Building Energy Prediction and Design Challenges
Early-stage architectural decisions strongly influence long-term building energy performance. Key parameters such as geometry, orientation, window ratio, shading, and envelope properties are set during the conceptual design phase, when design flexibility is high, and modifications are relatively low-cost. However, these early phases also involve uncertainty due to limited information on systems, schedules, and materials.
Physics-based building energy simulation tools can predict building energy demand with high physical accuracy. However, their use at the early design stage is limited, as they require detailed input data, substantial modeling effort, and long computation times. When designers need to compare many design alternatives, running detailed simulations for each option becomes impractical within typical project schedules. Several review studies have therefore identified a persistent gap between the need for fast performance feedback in early design and the complexity of detailed simulation workflows [14,19,28].
To address these limitations, designers often rely on simplified calculations, rule-of-thumb methods, or simplified energy models when detailed physics-based simulations or data-driven approaches are not yet practical. These approaches reduce computation time, but they cannot fully represent the complex interactions between architectural design variables, climate conditions, and building energy performance. As a result, early design decisions are often made with limited quantitative feedback, which increasing the risk of later-stage design revisions.
Previous research has emphasized the importance of explicit design space exploration and rapid performance feedback in overcoming these limitations. Simulation-based design space exploration, particularly when combined with metamodeling techniques, has been shown to improve designers’ understanding of the relationships between architectural parameters and energy performance, while enabling interactive evaluation of alternative design solutions [32]. These studies highlight the value of fast and interpretable feedback during early design stages, rather than relying solely on detailed simulation at later phases.
Climatic variability further complicates early-stage energy prediction. Building energy demand strongly depends on local climate conditions, and design strategies that work well in one climate may be ineffective in another. However, many early-stage evaluation methods assume a single climatic context or rely on broad climate descriptors, limiting their ability to support climate-responsive design across regions [27,28].
This issue is particularly important for educational buildings. Simulation-based studies on school buildings in Türkiye show that heating and cooling energy demand is strongly affected by early-stage architectural decisions, such as building massing and orientation, and that identical school typologies can perform very differently across climatic regions defined by national regulations [17]. These findings highlight the need for early-stage evaluation frameworks that jointly account for architectural variation and climatic diversity.
Recent data-driven methods provide a promising way to address these challenges. Using simulation-generated or measured datasets, machine learning models can estimate building energy performance quickly, without the need to run detailed simulations repeatedly. Review studies report that these approaches can balance computational speed and predictive accuracy, especially during early design stages when designers need to evaluate many design options [8,26]. However, to be effective in practice, such methods require careful selection of model inputs, well-structured datasets, and explicit links to design decisions. These requirements have increased interest in surrogate modeling approaches that specifically support early-stage architectural decision-making.
2.2. Machine Learning-Based Surrogate Models for Early-Stage Building Energy Prediction
Machine learning-based surrogate models, also referred to as metamodels, are designed to approximate the input–output behavior of physics-based building energy simulations. By learning the relationships between design variables and simulation outputs, surrogate models substantially reduce computational cost and enable rapid evaluation of large parametric design spaces. As a result, they have become an increasingly attractive alternative to repeated dynamic simulation when early-stage design exploration involves numerous design alternatives [33,34].
Early key studies on surrogate modeling for building performance simulation demonstrated that techniques such as random forest, support vector regression, artificial neural networks, and Gaussian process regression can accurately emulate simulation outputs while enabling efficient exploration of high-dimensional design spaces [35]. These studies established the methodological feasibility of surrogate models as effective approximations of physics-based simulations for comparative design assessment.
More recent research has confirmed the applicability of machine learning-based surrogate models to early-stage building design contexts using simulation-generated datasets. For example, Shirzadi et al. (2025) [36] compared multiple surrogate modeling techniques against simulations and reported substantial reductions in computational time while maintaining high predictive accuracy for early-stage energy and cost evaluation. Such findings demonstrate that surrogate models can provide reliable performance estimates within the time constraints of conceptual design.
Studies have applied a wide range of machine learning algorithms, including tree-based models, support vector machines, and multilayer perceptron neural networks. Some studies also use multi-output learning to predict several performance indicators at the same time. However, many of these models focus on time-scale consistency or operational forecasting, rather than on the specific needs of early-stage architectural design decision-making [37].
Several studies have specifically investigated surrogate models for early-stage energy prediction by progressively incorporating design information as it becomes available. Incremental learning frameworks trained on simulation-generated datasets have been shown to provide reliable energy performance estimates during conceptual design while significantly reducing dependence on repeated simulation runs [31]. These approaches highlight the potential of surrogate models to support evolving design workflows in early project phases.
Surrogate models have also been integrated into optimization frameworks to further improve computational efficiency [38]. For instance, an SVR-based surrogate trained on EnergyPlus simulation data was embedded within a Bayesian optimization workflow to identify energy-optimal envelope design parameters for an office building, achieving substantial reductions in computational effort while maintaining predictive accuracy [39]. Similar surrogate-assisted optimization approaches have been applied in the Turkish context to support envelope design under national regulatory constraints, demonstrating the feasibility of combining simulation-driven machine learning with regulation-informed design variables [40].
Recent studies in Türkiye have additionally demonstrated the applicability of simulation-trained machine learning models for early-stage energy performance estimation under specific climatic conditions. Surrogate models trained on parametric simulation datasets have been used to predict cooling energy demand for residential buildings within a single climatic zone, confirming the methodological viability of early-stage machine learning prediction in the local context [41]. While such studies provide valuable evidence of feasibility, their scope is typically limited to specific building types and climatic contexts.
Artificial neural networks, particularly multilayer perceptron architectures, remain among the most widely adopted surrogate modeling techniques due to their capacity to approximate complex nonlinear relationships between design variables and energy performance indicators. These models offer strong predictive capabilities but are commonly regarded as black-box approaches, which motivates the use of sensitivity analysis or variable-importance techniques to enhance interpretability and support design decision-making [42].
Overall, existing research demonstrates that machine learning-based surrogate models can effectively emulate simulation-based building energy evaluation and substantially reduce computational burden during early design stages. However, most applications remain focused on specific building configurations, single climatic contexts, or optimization-oriented tasks. As a result, important limitations persist in terms of design stage coverage, building type generalization, and climatic scope, highlighting the need for more comprehensive surrogate modeling frameworks tailored to early-stage architectural design exploration.
2.3. Limitations of Existing Machine Learning-Based Energy Prediction Studies
Although machine learning is widely used in building energy research, important limitations remain for early-stage architectural design decision-making. Many existing studies focus on operational performance, system control, or post-occupancy analysis rather than on conceptual design support. As a result, many machine learning models predict operational indicators such as short-term energy demand or indoor environmental conditions, which are less relevant for early-stage design when architectural and envelope-related decisions are still flexible [43].
Many data-driven energy prediction models are developed for single buildings or for operational forecasting, and they often rely on measured energy consumption data from existing buildings. Because these models are based on fixed building characteristics and usage patterns, they are difficult to transfer to new design alternatives or conceptual design scenarios [44]. Similar patterns appear in studies of public buildings, where machine learning is commonly used for operational diagnosis or performance benchmarking rather than for early-stage design exploration [45].
Support vector regression (SVR)-based models illustrate these limitations clearly. Many SVR studies rely on sensor or meter data from existing buildings to predict operational energy use, rather than to evaluate parametric design alternatives during the early design stage [16]. As a result, these models are usually developed for existing buildings, which limits their use in early-stage architectural contexts where design variables are not yet defined [46]. Even more advanced SVR formulations mainly aim to improve prediction accuracy for specific buildings and give limited attention to multi-climate generalization or design-oriented decision support [47]. In addition, SVR-based approaches are often applied to the operational energy management of specific building types, such as hotels, rather than to early-stage architectural design evaluation across different building typologies [48].
Some studies also use machine learning models as supporting tools within optimization workflows. In such cases, machine learning is trained on a limited subset of simulation results to accelerate optimization, rather than serving as a general surrogate model for comprehensive early-stage design exploration. While effective for targeted optimization tasks, these approaches typically do not support broad parametric exploration or climate-responsive design analysis [49].
Early applications of artificial neural networks further highlight the historical evolution of data-driven energy prediction. Although early ANN studies demonstrated the potential of data-driven models for estimating building heating loads using limited input information, they were primarily based on empirical room-level datasets and simplified representations of envelope properties. These studies lacked integration with dynamic building energy simulation tools and did not consider climatic diversity or architectural variability, limiting their relevance for contemporary early-stage design workflows [50].
The limitations of existing machine learning approaches are particularly evident in studies focusing on educational buildings. Several investigations on school buildings apply machine learning primarily to retrofit analysis or climate-change impact assessment of existing facilities, rather than to early-stage architectural design exploration [51]. Similarly, large-scale machine learning studies on school buildings often rely on operational energy consumption data to support facility management or cost estimation. While valuable for operational decision-making, such models are typically based on fixed building characteristics and single-climate conditions, and therefore do not explicitly support parametric early-stage design evaluation [52].
Collectively, these limitations indicate that although machine learning-based energy prediction methods are well established, existing studies remain fragmented with respect to design stage, building type, and climatic scope [33]. In particular, early-stage surrogate modeling frameworks that systematically integrate representative design inputs, multiple climatic regions aligned with national regulations, and interpretable outputs designed to support architectural decision-making, especially for school buildings, remain limited. This motivates the development of unified, simulation-trained machine learning frameworks capable of supporting rapid, climate-responsive early-stage design exploration across diverse climatic contexts.
3. Materials and Methods
3.1. Overview of the Research Framework
As illustrated in Figure 1, the research framework integrates building energy simulation with machine learning to enable rapid prediction of building energy performance and to quantify the relationship between key design and envelope parameters and annual energy demand during the early design stage. The methodology begins with the systematic definition of key design parameters, including climate, building typologies representing different plan-layout configurations, envelope constructions, glazing systems, orientation, window-to-wall ratio (WWR), and shading options. These parameters are combined to represent a comprehensive set of early-stage design configurations relevant to climate-responsive building design.
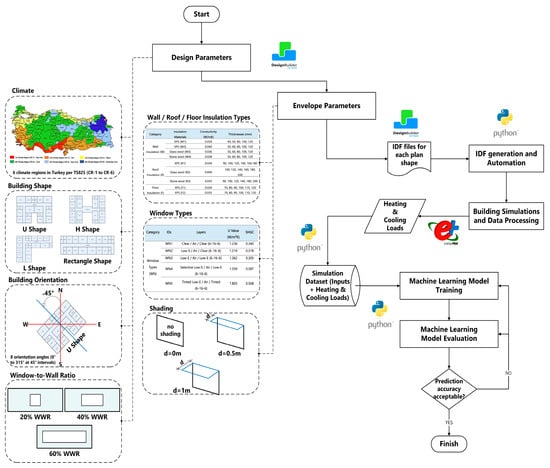
Figure 1.
Research framework illustrating systematic definition of design configurations, strategic sampling, multi-climate energy simulation, and machine learning-based surrogate modeling for building energy prediction. The arrows indicate the workflow and data flow between sequential methodological steps. (figure generated using Microsoft Visio 2021).
Dynamic building energy simulations are conducted using DesignBuilder v7.3 [53], with EnergyPlus 9.4.0 [54] as the simulation engine. For each design configuration, annual heating and cooling energy demands are calculated. The resulting dataset, consisting of design inputs and corresponding annual heating and cooling energy consumptions, is then used to train and validate machine learning models. Once trained, the models serve as surrogate predictors, estimating energy demand without computationally intensive simulations.
The framework is specifically intended to support climate-responsive and energy-efficient decision-making during early design phases, where limited information is available and rapid evaluation of multiple design alternatives is essential. To this end, the design space is structured hierarchically across three main parameter groups: geometry, window systems, and envelope insulation.
At the geometric level, building plan layout is represented using four plan typologies (rectangular, L-shaped, U-shaped, and H-shaped), which are combined with eight orientation angles, resulting in 32 distinct geometric configurations. Window-related parameters include three WWR levels, five glazing system types, and three shading depths, yielding 45 unique window configurations through combinatorial interaction. Envelope insulation parameters introduce the highest level of complexity, comprising 12 ground-floor insulation alternatives, 18 roof insulation options, and 20 exterior wall insulation configurations, which together generate 4320 envelope combinations.
The full design space is obtained by combining geometric, window, and envelope parameters (32 × 45 × 4320), resulting in 6,220,800 unique building configurations. When these configurations are evaluated across six representative Turkish climate regions, Antalya, Ankara, Erzurum, Hakkari, Istanbul, and İzmir, the total number of required EnergyPlus simulations increases to 37,324,800.
The computational feasibility of exhaustively simulating this design space was assessed. With an average simulation time of approximately 30 s per EnergyPlus run, completing all simulations sequentially would require nearly 18.7 million minutes, corresponding to several decades of continuous computation on a single processor. Even under optimistic parallel computing assumptions, such as distributing simulations across 100 processing cores, the total runtime would still extend over several months, excluding additional overheads related to data handling, job scheduling, and system availability. Given these constraints, exhaustive simulation of the entire design space is impractical in typical academic research environments. This limitation necessitates a strategic sampling approach, which significantly reduces the number of required simulations while maintaining representative coverage of the design space. The sampling methodology employed in this study is described in the following sections.
3.2. Definition of Design Parameters
A set of building design and envelope parameters, typically established during the early stages, is identified as having a significant impact on building energy performance. The design space includes all possible combinations of these parameters, as illustrated in Figure 1, and is defined based on Turkish building energy performance regulations [24] and standard architectural practices for school buildings in Türkiye. The following subsections provide detailed descriptions of each parameter.
3.2.1. Climatic Regions
Climate strongly influences building energy demand and envelope design requirements. In Türkiye, climate classification for building energy calculations is defined by TS 825. In its 2024 revision [24,25], TS 825 expanded the national climate categories from four to six climatic regions (CR-1 to CR-6), revised the energy calculation methodology to require both heating and cooling energy demand assessments instead of heating demand only, and introduced stricter U-value limits for exterior walls, roofs, and ground floors, reinforcing the need for climate-responsive building design.
In this study, one representative city was selected from each TS 825 climatic region, Antalya (CR-1), İzmir (CR-2), İstanbul (CR-3), Ankara (CR-4), Hakkari (CR-5), and Erzurum (CR-6), to ensure full coverage of the updated regulatory framework while maintaining computational feasibility. Since TS 825 defines identical envelope performance limits for all cities within the same climatic region, the selected cities serve as reference locations for implementing region-specific requirements, rather than representing local microclimatic variability. The full list of cities assigned to each climatic region is provided in Appendix A.
This approach enables consistent comparison of building energy performance across all six climatic regions defined in TS 825 (2024), ensures regulatory relevance, and remains aligned with common practice in previous building energy simulation studies conducted in Türkiye.
3.2.2. Building Plan Typologies
Four building plan typologies, rectangular, L-shaped, H-shaped, and U-shaped, were considered in this study. These forms were selected as representative school building plan types that have been widely used in previous building energy and geometry-related studies to examine the influence of plan configuration on energy performance [55]. Prior research indicates that such basic plan types effectively capture key geometric characteristics, including variations in compactness, façade articulation, and wing-based layouts, which directly influence solar exposure and heat transfer in educational buildings [55].
The selection of these typologies was not intended to represent the full diversity of real-world school layouts, but rather to enable a controlled and systematic comparison of plan layout-level effects. By focusing on simplified and clearly distinguishable forms, the analysis isolates the impact of plan configuration while avoiding additional complexity introduced by irregular or highly articulated geometries. Similar archetype-based approaches have been successfully employed in previous studies to evaluate the effect of plan geometry under different climatic and design conditions [35,56].
This approach is further supported by recent research on school buildings in Türkiye [57,58] which reports a high degree of typological similarity across primary, secondary, and high schools, with overlap ratios ranging from 69% to 92% and limited variation across climate zones. These findings suggest that school buildings in Türkiye generally follow a limited number of recurring geometric patterns, supporting the suitability of archetype-based modeling for energy performance analysis.
Rather than replicating specific real-world layouts, the plan typologies were intentionally constructed using a modular design approach. Each plan was generated by combining the same functional units on each floor: eight classrooms (5 × 5 m, 25 m2 each), four administrative spaces (5 × 7.5 m, 37.5 m2 each), and six service units (2.5 × 5 m, 12.5 m2 each). These modules were arranged into different spatial configurations to form the four plan typologies, while maintaining identical functional composition across all cases. To isolate the effect of plan geometry on energy performance, all typologies were designed with the same total floor area (562.5 m2) and total building volume (1968.8 m3). By holding these parameters constant, differences in annual heating and cooling energy demand can be attributed primarily to plan configuration, rather than building size. A base-case WWR of 30% was initially defined to ensure consistent geometric comparison. WWR was subsequently treated as an independent design variable and systematically varied, along with glazing type and shading depth, during machine learning model development. This separation allows the influence of plan geometry to be evaluated independently from fenestration effects. The key geometric characteristics of the four plan typologies are summarized in Table 1.

Table 1.
Building plan typologies considered in this study.
Overall, the selected plan typologies provide a methodologically robust and transparent framework for evaluating the impact of representative plan layouts on school building energy performance within a controlled early design context. The use of modular, size-controlled archetypes supports systematic comparison across climates while remaining suitable for large-scale parametric simulation and machine learning-based analysis.
3.2.3. Building Orientation
Building orientation was examined by rotating each plan in 45° increments from a north-facing reference defined as 0°, resulting in eight orientations (0°, 45°, 90°, 135°, 180°, 225°, 270°, and 315°). The same orientation set was applied to all plan typologies to ensure a consistent assessment of orientation effects on energy performance. Table 2 presents these orientation alternatives, illustrated using the H-shaped plan as a representative example.
Table 2.
Orientation angles applied to building plan typologies.
3.2.4. Window to Wall Ratio
The WWR was defined as the ratio of the total glazed area to the gross exterior wall area of the building envelope. In this study, three discrete WWR levels (20%, 40%, and 60%) were considered to represent low, medium, and high glazing scenarios in the base-case school buildings.
The selected WWR levels were applied consistently across all building plan typologies and orientations to isolate the impact of glazing ratio on heating and cooling energy demand. Table 3 shows the façade configurations for each WWR level. Window distribution was maintained uniformly along the façades to avoid localized solar concentration effects and ensure comparability between scenarios.
Table 3.
Window to wall ratio levels applied to all building plan typologies and orientations.
3.3. Definition of Envelope Parameters
The building materials for each envelope component and their thermophysical properties are summarized in Table 4. Exterior walls, interior walls, ground floors, and roofs were modeled using standard layered constructions commonly used in educational buildings. Structural layers, finishes, and membranes were held constant across all cases, while insulation layers were treated as variable parameters and examined in detail in the following sections.
Table 4.
Building envelope materials and their thermophysical properties.
3.3.1. Wall, Roof and Floor Insulation Types
Under TS 825 (2024), the maximum allowable U-values for exterior walls, roofs, and ground floors vary by climatic region across Türkiye. As summarized in Table 5, these limits become progressively more stringent from hot and mild regions (CR-1 to CR-3) to cold and very cold regions (CR-4 to CR-6), reflecting increased heating demand in colder climates. The TS 825 U-value thresholds serve as reference constraints to ensure that all opaque envelope configurations evaluated in this study comply with national thermal insulation requirements.
Table 5.
Maximum allowable U values for opaque envelope components according to TS 825 (2024).
For each envelope component, insulation material types were defined with discrete thickness levels, and the total number of variants was controlled to ensure a structured and computationally manageable parametric space. Table 6 summarizes the insulation materials, thickness ranges, thermal conductivities, and the number of variants considered for exterior walls, roofs, and ground floors.
Table 6.
Insulation material types, thickness levels, and number of variants considered in the parametric analysis.
Wall insulation options include XPS, EPS, glass wool, and stone wool, represented by market-available conductivity values and a controlled set of thicknesses. These thickness options were screened against the TS 825 (2024) maximum allowable wall U-value requirements. Accordingly, a 40 mm thickness was retained only for XPS due to its compliance in CR-1, while other wall insulation materials start at 50 mm to ensure compliance across the selected climatic regions.
Roof insulation alternatives were defined using XPS, glass wool, and stone wool with market-representative thickness ranges. These options were evaluated against the TS 825 maximum allowable roof U-value limits. The final selection includes the minimum compliant thicknesses for each climatic region, complemented by intermediate values to improve dataset resolution and support machine learning model training.
Floor insulation options include XPS and EPS, with thicknesses ranging from 70 to 120 mm. These values were selected to satisfy TS 825 maximum allowable floor U-value limits across all climatic regions, while additional intermediate thicknesses were included to enhance parametric coverage.
Overall, this systematic definition of insulation materials and thickness ranges ensures regulatory compliance, realistic construction representation, and sufficient variability for robust machine learning model development, while avoiding unnecessary expansion of the design space.
3.3.2. Window Types
According to TS 825 (2024), while the maximum window U-value is uniformly limited to 1.80 W/m2K for all climatic regions, the g-value requirement varies by climate. For hot and warm regions (CR-1 to CR-3), lower g-values (≤0.45) are prescribed to limit solar heat gains and reduce cooling demand. In contrast, for cold and very cold regions (CR-4 to CR-6), higher g-values (≥0.55) are required to promote passive solar gains and support heating demand. The g-value in TS 825 corresponds to the solar heat gain coefficient (SHGC) used in EnergyPlus (Table 7). Although TS 825 regulates window performance based on U value and g-value, visible transmittance (VT) is not regulated; however, VT values are required for glazing definition in EnergyPlus and were therefore included as input parameters during dataset generation and machine learning model development.
Table 7.
Maximum allowable U and g values for windows according to TS 825 (2024).
Common double-glazing systems widely used in Türkiye were selected from the DesignBuilder library in accordance with TS 825 window performance requirements. The analyzed 6–16–6 mm glazing configurations include clear, low-E, spectrally selective low-E, and tinted glass options. All selected systems comply with the maximum allowable window U-value specified in TS 825 and collectively span the full range of g-value limits prescribed for different climatic regions (Table 8). This combination of thermal and solar properties enables systematic assessment of window–climate interactions within the machine learning framework.
Table 8.
Window glazing types and thermal–solar properties considered in the parametric analysis.
3.3.3. Shading Configuration
External horizontal shading devices were included as a façade-related parameter in the parametric analysis. As shown in Table 9, three shading depth alternatives were defined: no shading (d = 0 m), moderate shading (d = 0.5 m), and deep shading (d = 1.0 m). These values were selected to provide a systematic and comparable assessment of shading depth on solar gains and building energy performance.
Table 9.
Shading options considered in the parametric analysis.
3.4. Dataset Creation, Preprocessing, and Sampling Strategy
This section describes the process of generating the simulation-based dataset, including automated model input generation, extraction of annual heating and cooling loads, and data preparation for machine learning. The dataset was created by systematically varying the design and envelope parameters defined in Section 3.2 and Section 3.3.
3.4.1. Input File Generation and IDF Automation
Base-case building models for each plan typology were first created in DesignBuilder and then exported as EnergyPlus input files (IDF). A Python 3.10 based automation workflow was used to modify these IDF files by systematically assigning the defined design and envelope parameters.
This automated process enabled the efficient generation of a large number of simulation cases while reducing manual effort and potential modeling errors. Each IDF file corresponds to a unique combination of input parameters within the predefined design space. The simulation process was further automated in Python 3.10 to link each IDF file with the appropriate EPW weather file(s) and to control batch execution settings, such as output management and file storage.
3.4.2. Building Energy Simulations and Output Data Extraction
All generated IDF files were simulated using the EnergyPlus engine through a Python-controlled batch workflow. Annual simulations were performed for each building configuration using Typical Meteorological Year (TMY) weather files in EPW format for İzmir, Ankara, Hakkari, İstanbul, Antalya, and Erzurum, obtained from the OneBuilding climate database [59], and selected as representative climates for the six climatic regions defined by TS 825. The entire simulation process was automated in Python 3.10, enabling the systematic execution of EnergyPlus runs for each IDF–weather file pair. Parallel processing was used to improve computational efficiency and make the large simulation campaign feasible. In total, 30,000 annual simulations were completed, with each sampled building configuration evaluated across six distinct climatic regions.
The simulations focused on annual heating and cooling energy demand. After each run, the required output variables were automatically extracted from EnergyPlus result files and combined with the corresponding design and envelope parameters to form a structured dataset. The extracted outputs were directly linked to their corresponding input parameters in the dataset. The resulting dataset was then used for data preprocessing and machine learning model development, as described in the following subsection.
3.4.3. Data Preprocessing and Sampling Strategy
Simulation outputs were combined with their corresponding design and envelope parameters to create the dataset used for machine learning model development. Each dataset entry represents a unique building configuration and includes the associated annual heating and cooling energy demands.
Instead of exhaustively testing all parameter combinations, a stratified random sampling approach was used to efficiently explore the design space while limiting computational effort. Using a Python-based implementation, 5000 unique building configurations were generated from the discrete parameter sets defined in Section 3.2 and Section 3.3. Stratification was applied to the building plan typology and orientation to ensure a balanced representation of key early design decisions, while window and envelope parameters were sampled randomly to enable flexible, performance-oriented variation. Each configuration was simulated across six climatic regions corresponding to the TS 825 climate zones, resulting in a total of 30,000 input–output samples. This sample size provides sufficient coverage of the high-dimensional design space to support machine learning model development without high computational cost.
Before developing the model, the dataset was preprocessed to support effective learning. The final input space included 22 features: 18 numerical variables and 4 categorical variables, all defined by discrete design levels that reflect typical architectural decisions rather than continuous ranges. Categorical variables such as plan typology, orientation, glazing type, and climatic region were converted to numerical representations, while discrete numerical variables (e.g., window-to-wall ratio, shading depth, and envelope U-values) were used directly. The target output variables were annual heating and cooling energy demands.
3.5. Machine Learning Model Development and Evaluation
This section outlines the development, training, and validation of the machine learning model that predicts annual heating and cooling energy loads from building design and envelope parameters.
3.5.1. Input–Output Definition
The prediction task was formulated as a supervised multi-output regression problem, in which a single machine learning model simultaneously predicts annual building energy demand across multiple climatic regions. The input space consists exclusively of building design and envelope parameters, which are assumed to be identical across all climatic conditions. The output variables consist of annual heating and cooling energy demands for six cities in Türkiye, resulting in 12 output variables in total. Heating and cooling demands were treated as separate outputs because they are influenced by different design parameters and respond differently to climatic conditions. Total annual energy demand was calculated as the sum of predicted heating and cooling values for benchmarking and interpretation purposes.
In this formulation, climatic region is implicitly represented through separate output variables rather than as an explicit categorical input feature. This multi-output formulation enables the model to learn shared relationships between design parameters and energy performance while also accounting for climate-specific response patterns. Compared to training separate models for each city or energy end-use, this approach improves learning efficiency and reduces computational overhead without increasing model complexity.
3.5.2. Algorithm Selection
Three supervised regression algorithms were selected to evaluate their suitability for predicting annual building energy demand across multiple climatic regions: Random Forest (RF), Support Vector Regression (SVR), and a Multi-Layer Perceptron (MLP), a feed-forward artificial neural network (ANN).
Random Forest is an ensemble-based, non-parametric learning method that combines multiple decision trees to capture complex and nonlinear relationships between input features and target variables [60]. It is well-suited to tabular building performance data due to its robustness to noise, ability to model interactions among design parameters, and limited sensitivity to feature scaling, which reduces preprocessing requirements. In addition, RF provides intrinsic feature importance measures, supporting interpretability and post hoc analysis of model behavior.
Support Vector Regression with a radial basis function (RBF) kernel was selected as a complementary algorithm because of its strong generalization capability in high-dimensional feature spaces [61]. SVR models nonlinear relationships through kernel-based transformations and has been widely used in building energy prediction studies. Unlike RF, SVR requires feature standardization to ensure numerical stability and optimal performance.
The Multi-Layer Perceptron is a feed-forward artificial neural network composed of multiple hidden layers and trained using back-propagation [42]. MLP is capable of learning highly nonlinear relationships and complex interaction effects among design parameters. Feature standardization was applied to ensure stable and efficient training, and early stopping was used to mitigate overfitting. The layered structure enables automatic feature representation learning, allowing the model to capture subtle patterns that may not be fully represented by tree-based or kernel-based methods.
All three algorithms were implemented using the MultiOutputRegressor wrapper from the Scikit-Learn library [62], which trains one regression model per output variable within a unified framework. This approach enables simultaneous prediction of heating and cooling energy demands across all six climatic regions, ensuring consistent training and evaluation while avoiding the need to develop separate model for each city or load type.
3.5.3. Model Training, Validation and Data Partitioning
The final dataset comprising 5000 unique building configurations was divided into training and testing subsets to support robust model development and unbiased performance evaluation. An 80/20 split was adopted, with 4000 samples used for model training and hyperparameter optimization and 1000 samples reserved exclusively for final testing. Stratified random sampling was applied during data partitioning to preserve representative distributions of key categorical variables in both subsets. A fixed random seed (42) was used to ensure full reproducibility.
All model development procedures, including feature preprocessing and hyperparameter tuning, were conducted using only the training dataset. The testing dataset was withheld until final evaluation to prevent data leakage and to ensure an unbiased assessment of model generalization to unseen building configurations.
Feature preprocessing requirements differed between the evaluated algorithms. The RF model was trained directly on the original feature set, as its tree-based structure is insensitive to feature scaling. For the SVR and MLP models, input features were standardized using z-score scaling (zero mean and unit variance) based on statistics computed from the training datasets.
Hyperparameter optimization was performed using RandomizedSearchCV with five-fold cross-validation on the training dataset, enabling systematic exploration of model configurations while controlling computational cost [62,63]. The number of search iterations was set to 30 for Random Forest, 15 for SVR, and 20 for MLP. Optimization focused on ensemble size and tree structure for RF, kernel and regularization parameters for SVR, and network architecture, learning rate, and L2 regularization for MLP. Early stopping with a fixed validation fraction was applied to the MLP to reduce overfitting. The evaluated hyperparameter ranges are summarized in Appendix A Table A2, Table A3 and Table A4.
To assess overfitting and generalization behavior, model performance was monitored on both training and validation folds during cross-validation. The difference between training and validation coefficient of determination values was used as an indicator of generalization quality, with smaller gaps indicating more robust performance on unseen data. This evaluation complemented the adopted overfitting mitigation strategies, including constrained hyperparameter ranges, cross-validation-based model selection, regularization, and ensemble averaging for the RF model.
3.5.4. Model Performance Evaluation
Model performance was evaluated using three complementary statistical metrics: the coefficient of determination (R2), root mean square error (RMSE), and mean absolute error (MAE). Together, these metrics provide a comprehensive assessment of predictive accuracy, error magnitude, and robustness.
The coefficient of determination (R2) measures the proportion of variance in simulated energy demand explained by the model and is defined as:
where yact denotes the EnergyPlus simulated energy demand, ypred is the model-prediction, is the mean of observed values, and n is the number of samples. R2 values range from negative infinity to 1, with higher values indicating stronger explanatory performance.
Root mean square error (RMSE) measures the square root of the mean squared prediction error and is expressed as:
RMSE places greater emphasis on larger errors due to the squaring of residuals, making it particularly sensitive to substantial deviations between predicted and simulated values. Lower RMSE values indicate improved predictive accuracy.
Mean absolute error (MAE) represents the average absolute difference between predicted and observed values, and is calculated as:
Unlike RMSE, MAE treats all errors equally and is less sensitive to outliers, providing an intuitive measure of typical prediction error. All performance metrics were computed separately for each climatic region and for each type of energy use. Accordingly, model performance was evaluated for annual heating and cooling energy demand across six cities, resulting in a total of twelve output-specific evaluations. This climate and energy type evaluation enables detailed comparison of model behavior across distinct thermal conditions and supports assessment of model generalization under different climatic contexts.
4. Results
This section presents the performance evaluation of the developed machine learning models. Overall predictive performance across the six climatic regions is first assessed using standard statistical metrics. This is followed by a comparative analysis of the three algorithms, highlighting trade-offs between prediction accuracy, generalization behavior, and interpretability.
4.1. Machine Learning Model Performance Comparison
Table 10 summarizes the average training and testing performance of the Random Forest, SVR, and MLP models across all 12 output variables, corresponding to annual heating and cooling energy demands for the six climatic regions. All models were trained and evaluated using absolute annual energy demand values (kWh). Model performance was evaluated using the R2, RMSE, and MAE, calculated on an independent test dataset consisting of 1000 samples. The reported values represent aggregated performance across all climate-specific and energy load-specific outputs, enabling direct comparison of overall predictive accuracy and generalization capability among the evaluated algorithms.
Table 10.
Average training and testing performance of RF, SVR, and MLP models across 12 output variables (6 cities × heating and cooling energy demands).
As shown in Table 10, the MLP model achieved the highest predictive accuracy across the 12 output dimensions, demonstrating a strong ability to capture complex nonlinear relationships governing building energy performance. On the test dataset, MLP attained an average R2 value of 0.9560, outperforming RF (R2 = 0.9345) and SVR (R2 = 0.9484). The relatively small differences between training and testing R2 values for all three models indicate limited overfitting and strong generalization to unseen building configurations.
SVR ranked second, achieving an average test R2 of 0.9484, indicating that kernel-based learning effectively represents non-linear thermal behavior, albeit with slightly lower flexibility compared to the neural network approach. While MLP achieved the highest overall R2, SVR exhibited slightly lower MAE on the test dataset, highlighting a trade-off between variance explanation and average error magnitude. RF achieved an average test R2 of 0.9345, explaining over 93% of the variance in annual heating and cooling energy demand, and exhibited stable and consistent performance across all climatic regions.
Although MLP delivered the highest predictive accuracy, RF was selected as the primary reference model for subsequent analyses due to its superior interpretability, minimal preprocessing requirements, faster inference time, and robust generalization behavior. These results highlight the inherent trade-off between predictive accuracy and model transparency, an important consideration for early design stage decision-making, where explainability and reliability are often as critical as absolute accuracy. While the metrics in Table 10 are aggregated across all climates and load types, climate-specific results are presented in the following section to verify consistent model performance under distinct thermal conditions.
4.2. Climate-Specific Performance
Table 11 presents the climate-specific test performance of the RF, SVR, and MLP models for predicting total annual building energy demand across the six climatic regions. All three algorithms achieved consistently strong predictive performance, with test R2 values exceeding 0.93 in every climate zone. This high level of accuracy confirms the effectiveness of the proposed multi-output learning framework under diverse climatic conditions and indicates that the models successfully learned generalizable relationships between building design parameters and energy demand.
Table 11.
Comparative performance of RF, SVR, and MLP models on the test dataset for total annual building energy demand prediction.
MLP exhibited the highest and most stable performance across climates, with R2 values ranging from 0.9502 (Hakkari) to 0.9606 (Istanbul), a narrow spread of approximately one percentage point. High accuracy was observed in both cooling-dominated coastal cities, such as Antalya (R2 = 0.9562) and İzmir (R2 = 0.9545), and in heating-dominated regions, including Erzurum (R2 = 0.9594). This consistency indicates robust performance across contrasting thermal regimes.
The SVR model performed particularly well in Istanbul (R2 = 0.9586) and Erzurum (R2 = 0.9491), and it produced the lowest MAE among all algorithms in Erzurum (1013 kWh). This result indicates strong error control in cold, heating-dominated climates and suggests that kernel-based learning effectively captures nonlinear thermal response patterns across diverse climatic contexts.
The RF model showed slightly lower but highly consistent performance, with R2 values ranging from 0.9313 (Ankara) to 0.9377 (Erzurum). While RF exhibited higher RMSE values in warmer regions such as Antalya and İzmir, its stable behavior across all climates confirms its robustness and reliability, supporting its suitability for applications where interpretability and predictable performance are prioritized.
Overall, none of the climatic regions showed a noticeable degradation in model performance, including very cold regions. These results indicate that the selected input features, stratified sampling strategy, and multi-output formulation are appropriate for representing both cooling-dominated and heating-dominated energy behavior across Türkiye’s climatic conditions.
4.3. Prediction Error Analysis
The absolute prediction errors, measured using MAE, indicate consistently high predictive accuracy across all three algorithms. For RF, MAE values range from 1098 kWh (Erzurum) to 1665 kWh (Antalya), with an average MAE of 1222 kWh. SVR exhibits MAE values between 1013 kWh (Erzurum) and 1946 kWh (Antalya), yielding an average MAE of 1431 kWh. MLP demonstrates MAE values ranging from 955 kWh (Erzurum) to 2020 kWh (Antalya), with an average MAE of 1478 kWh.
When compared with the typical annual energy consumption of the investigated school buildings (approximately 20,000–40,000 kWh), these error magnitudes correspond to relative deviations of approximately 3–8% across all models and climate zones. This level of accuracy is appropriate for early design stage applications, where the primary objectives are rapid energy prediction, comparative evaluation of alternative design options, and preliminary assessment under limited information.
However, the proposed models are not intended for certification-level applications, such as final energy performance certification, contractual energy performance guarantees, detailed HVAC system sizing, or precise utility cost forecasting. Such applications typically require higher prediction accuracy and detailed operational inputs, including actual occupancy schedules, system control strategies, and measured performance data.
4.4. Generalization Performance
All three algorithms exhibited strong generalization with minimal overfitting, indicating that the adopted overfitting mitigation strategies were effective. The overfitting gap (difference between training and test R2) was 0.0102 for SVR, 0.0111 for MLP, and 0.0143 for RF, with all values well below the 0.05 threshold commonly associated with strong generalization.
These small performance gaps indicate that the models learned generalizable relationships rather than memorizing training data. The use of cross-validation, regularization, and ensemble learning successfully controlled model complexity, while the dataset of 4000 training configurations provided sufficient diversity for robust training.
4.5. Evaluation of Model Predictions
Figure 2 presents scatter plots comparing simulated and predicted annual heating and cooling energy demand for six representative cities using the Random Forest model. Blue points represent training samples (4000 configurations), while red points correspond to test samples (1000 configurations). The black diagonal line indicates perfect agreement between predicted and simulated values.
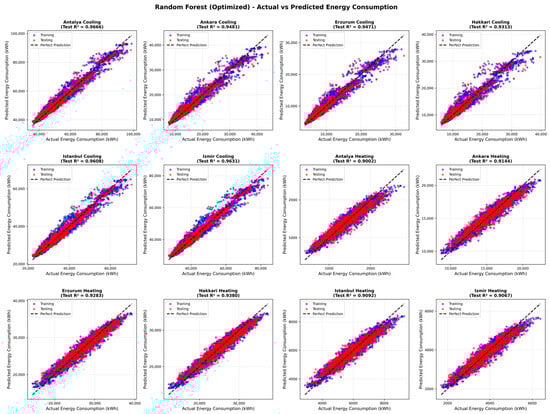
Figure 2.
Actual versus predicted annual heating and cooling energy demand for six cities in Türkiye using the Random Forest model. Blue points denote training samples (4000 configurations), red points indicate test samples (1000 configurations), and the black diagonal line represents perfect agreement. Reported R2 values correspond to test-set performance for each city and load type.
As shown in Figure 2, the RF model demonstrates strong and consistent predictive performance across all climatic regions. For all cities and both load types, data points cluster closely around the diagonal line, with test-set R2 values exceeding 0.93, indicating high agreement between predicted and simulated results. Training and test samples follow similar distributions, supporting the strong generalization behavior discussed in Section 4.4.
In very hot and hot climatic regions represented by Antalya (CR-1) and İzmir (CR-2), the model accurately captures cooling-dominated energy demand across the full range of consumption values, indicating strong performance under high solar and cooling loads. In the mild climatic region represented by İstanbul (CR-3), predictions remain equally stable, reflecting the model’s ability to represent balanced heating and cooling behavior typical of temperate coastal climates.
For Ankara (CR-4), classified as a cold climate under TS 825, the model maintains consistent accuracy (R2 = 0.9313), successfully capturing mixed heating–cooling characteristics associated with continental conditions. In very cold and extremely cold climatic regions represented by Hakkari (CR-5) and Erzurum (CR-6), strong clustering around the diagonal is observed (R2 = 0.9346 and 0.9377, respectively), indicating reliable prediction of heating-dominated energy demand.
Across all climatic regions, no systematic underestimation or overestimation is observed, and prediction errors remain symmetrically distributed across the full range of energy demand values. These results confirm robust and climate-consistent model behavior across Türkiye’s diverse climatic regions.
Figure 3 illustrates the predictive performance of the SVR model across all six climatic regions. Compared to the RF results, SVR predictions show similarly strong alignment with the ideal agreement line, with test R2 values exceeding 0.90 for both heating and cooling energy demand in all climates. The model performs particularly well in heating-dominated regions such as Erzurum and Hakkari, where predictions cluster tightly around the diagonal, indicating accurate representation of heating demand. In cooling-dominated climates, including Antalya and İzmir, SVR maintains high accuracy, although slightly increased scatter is observed, reflecting the higher variability of cooling loads. Overall, the absence of systematic over- or under-prediction across climates confirms that SVR provides stable and climate-consistent performance, reinforcing its suitability as a complementary model for early-stage building energy prediction.
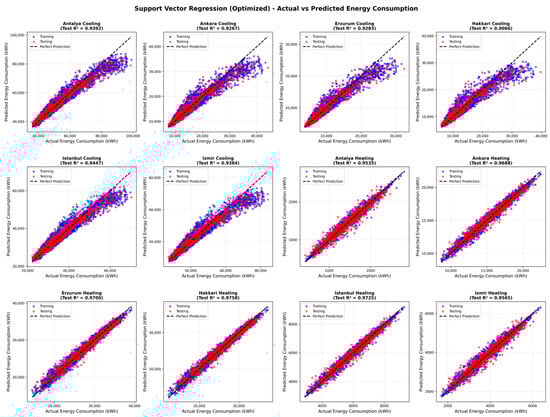
Figure 3.
Actual versus predicted annual heating and cooling energy consumption for six cities in Türkiye using the Support Vector Regression model.
Figure 4 illustrates the predictive performance of the MLP model across all six climatic regions. The MLP demonstrates consistently strong agreement between predicted and simulated annual energy consumption values, with data points tightly clustered around the ideal agreement line for both heating and cooling loads. Compared to RF and SVR, the MLP exhibits slightly higher predictive accuracy across most climates, reflected in its higher test-set R2 values and reduced scatter, particularly at higher energy demand levels. The model performs robustly in cooling-dominated regions such as Antalya, İzmir, and İstanbul, while also maintaining excellent accuracy in heating-dominated climates, including Erzurum and Hakkari. This indicates that the MLP effectively captures complex nonlinear relationships between design parameters and energy demand under diverse thermal conditions. No systematic bias or climate-dependent performance degradation is observed, as prediction errors remain symmetrically distributed across the full range of energy consumption values. These results confirm the strong representational capacity of the MLP model and explain its superior aggregated performance reported in Table 10 and Table 11, while also highlighting its suitability for high-accuracy energy demand prediction within the proposed early-stage design framework.
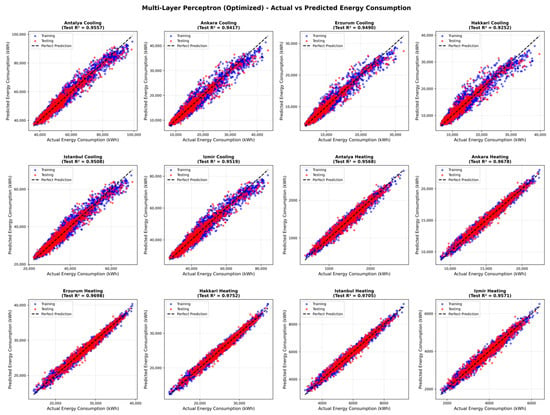
Figure 4.
Actual versus predicted annual heating and cooling energy consumption for six cities in Türkiye using the Multi-Layer Perceptron model.
Figure 5 provides a consolidated visual comparison of the three machine learning models across multiple performance metrics and climatic regions. The figure enables a direct and intuitive assessment of model accuracy, error magnitude, and robustness for both heating and cooling energy demand prediction.
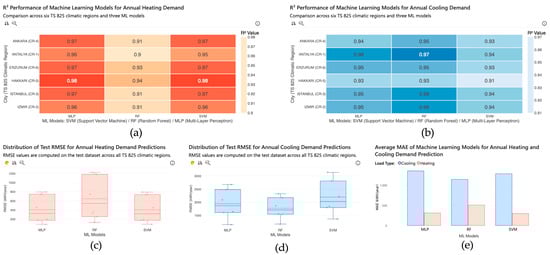
Figure 5.
Comparative performance of Random Forest, Support Vector Regression, and Multi-Layer Perceptron models for predicting annual heating and cooling energy demand across six climatic regions. Model performance is evaluated using test-set R2 heatmaps: (a) for heating, and (b) for cooling RMSE distributions: (c) for heating, (d) for cooling, and (e) average MAE values for both load types. Color gradients in the heatmaps represent the magnitude of R2 values, with darker tones indicating higher predictive performance. Distinct colors in the RMSE and MAE plots differentiate machine learning models and load types. (Figures were generated using Microsoft Power BI Service (web-based version) and PBI VizEdit).
Figure 5a,b present heatmaps of test-set R2 values for annual heating and cooling demand, respectively. These heatmaps show consistently high predictive accuracy across all six cities for all three models, with MLP generally achieving the highest R2 values, followed by SVR and RF. The limited variation across climates indicates stable model behavior under diverse thermal conditions. Figure 5c,d show boxplots of test-set RMSE distributions for heating and cooling demand. These plots highlight differences in error dispersion among the models. SVR exhibits relatively compact error distributions, indicating strong error control and robustness, while MLP shows slightly wider spreads but lower median errors in most cases. Random Forest displays stable but moderately higher error ranges, consistent with its slightly lower overall accuracy. Figure 5e summarizes the average MAE values across all heating and cooling outputs. MLP achieves the highest overall predictive accuracy, SVR yields the lowest average absolute errors, and Random Forest maintains competitive performance with balanced error levels.
Overall, Figure 5 once again confirms that all three models deliver reliable and climate-consistent predictions suitable for early design stage applications. While MLP provides the highest accuracy, SVR demonstrates strong robustness in terms of error magnitude, and Random Forest offers a favorable balance between predictive performance, stability, and interpretability.
4.6. Feature Importance Analysis
Random Forest feature importance analysis was conducted using the mean decrease in impurity metric and averaged across all six climatic regions (Table 12).
Table 12.
The first 10 Most Important Features for Energy Prediction.
Table 12 shows that the WWR is the dominant parameter, accounting for approximately 42% of total feature importance. This result highlights the critical role of façade transparency at the early design stage, as WWR simultaneously governs solar heat gains affecting cooling demand and conductive heat losses influencing heating demand. The consistently high importance of WWR across all climatic regions confirms its robust influence on both heating and cooling demand.
The second most influential group of parameters consists primarily of envelope and glazing-related variables, with individual importance values ranging from approximately 8% to 10%. Roof insulation thickness ranks second overall (9.7%), reflecting its strong effect on both heating and cooling loads due to high solar exposure and temperature gradients at roof level. Glazing U-value (9.2%), shading depth (8.3%), glazing solar heat gain coefficient (SHGC, 8.1%), and visible transmittance (VT, 7.6%) also exhibit substantial influence. When considered together, glazing-related parameters (U-value, SHGC, and VT) account for approximately 26% of total importance, indicating that window performance characteristics are nearly as influential as window area itself.
In contrast, geometric and orientation-related parameters exhibit lower but still measurable influence. Building plan layout contributes modestly, with the L-shaped configuration showing the highest importance within this group (≈3.0%), primarily through changes in surface-to-volume ratio. Building orientation accounts for approximately 2.6% of total importance, suggesting a limited effect within the examined design space. This reduced influence can be attributed to the balanced sampling of orientations and the mitigating effects of shading devices and façade related design variables.
Among insulation-related parameters, a clear hierarchy is observed. Roof insulation is substantially more influential than wall insulation (2.6%) and ground floor insulation (1.7%). This ranking aligns with building physics principles, as roof assemblies experience greater thermal and solar exposure, while ground-contact elements benefit from soil thermal buffering.
Overall, the feature importance results provide clear guidance for early-stage, climate-responsive design. WWR emerges as the primary decision variable, followed by glazing system properties, roof insulation thickness, and shading depth. Parameters such as orientation, plan layout, and detailed material properties play secondary roles and can be refined after primary façade and envelope decisions are established. These findings confirm that early design efforts should prioritize façade transparency, glazing selection, and roof insulation to achieve meaningful reductions in building energy demand.
It should be noted that the relative importance of orientation and plan layout is conditional on the adopted modeling assumptions. In this study, building forms were represented using simplified archetypal plan typologies with evenly distributed façades and without geometry optimization for passive solar gains or passive cooling strategies. As a result, orientation-related effects are intentionally moderated within the defined design space. Consequently, the reported parameter sensitivities should be interpreted as valid within the domain of the selected archetypes and early-stage assumptions, rather than as universally transferable rankings across all possible school building geometries.
5. Discussion
This section discusses the implications of the proposed machine learning-based framework for early-stage building energy assessment, focusing on model selection, sampling strategy effectiveness, climate-specific behavior, and feature importance insights, followed by practical considerations, limitations, and future research directions.
5.1. Model Selection and Justification
Although all three algorithms demonstrated strong predictive capability (test R2 > 0.93), the RF model was selected as the primary model for deployment based on factors extending beyond predictive accuracy. Among the evaluated models, MLP achieved the highest test performance (R2 = 0.9560, MAE = 838 kWh, RMSE = 1175 kWh), followed by SVR (R2 = 0.9484, MAE = 797 kWh, RMSE = 1300 kWh) and RF (R2 = 0.9345, MAE = 832 kWh, RMSE = 1209 kWh). The performance difference between MLP and RF (2.15 percentage points in R2) represents a modest gain within the accuracy requirements of early design stage assessment.
RF offers clear advantages in interpretability, which is critical for design support. Its built-in feature-importance measures (mean decrease in impurity) provide direct insight into the influence of design parameters on energy demand, and the tree-based structure supports qualitative inspection of decision behavior. In contrast, MLP operates as a black-box model, and the kernel-based formulation of SVR limits transparency.
From an implementation perspective, RF simplifies deployment because it is insensitive to feature scaling, eliminating the need for normalization or additional preprocessing pipelines. This reduces system complexity and improves robustness in user-facing applications. RF also achieved the fastest inference time (below 10 ms), compared with approximately 15 ms for MLP and 13 ms for SVR, which is advantageous for interactive workflows and large parametric evaluations.
All three models exhibited strong generalization, with small differences between training and test R2 values (SVR: 0.0102, MLP: 0.0111, RF: 0.0143), indicating limited overfitting. Overall, RF was selected as the primary deployed model due to its balanced combination of interpretability, computational efficiency, operational simplicity, and competitive accuracy. Nevertheless, all three models are retained within the interface, allowing users to prioritize maximum accuracy (MLP), lower average error (SVR), or interpretability and design insight (RF), depending on application needs.
5.2. Sampling Strategy Effectiveness
The adopted stratified random sampling strategy substantially reduced computational demand while preserving model reliability. The full design space of approximately 6.2 million possible configurations was reduced to 5000 representative samples, corresponding to a 99.92% reduction, while retaining sufficient diversity for machine learning model development and evaluation.
Sampling coverage checks confirm that the reduced dataset provides a balanced representation of the predefined parameter space. Each building plan typology was equally represented by 1250 samples, ensuring geometric balance, and all eight orientation angles were included within each typology to capture directional effects on solar exposure. Key design variables, including WWR, envelope insulation, and glazing systems, were sampled across their full predefined ranges, with no systematic bias toward specific parameter values.
The adequacy of the sampling strategy is further supported by the consistently high predictive performance observed across all models and climatic regions (Section 4). The small gaps between training and test results indicate that the dataset is sufficiently large to support generalizable learning without overfitting. Moreover, the absence of climate-specific performance degradation suggests that the sampling approach provides a balanced representation of diverse thermal conditions.
Despite these strengths, certain limitations should be acknowledged. Due to the probabilistic nature of stratified random sampling, extreme design combinations, such as very high WWRs paired with minimal insulation, may be underrepresented compared to moderate configurations. In addition, model behavior between the selected discrete parameter levels was not specifically evaluated.
Future studies could further improve the sampling approach. Active learning methods may be used to focus on design cases that provide the most useful information for model improvement. Adaptive sampling could also assign more samples to climates with higher prediction uncertainty, such as cold and very cold regions. Alternatively, Latin hypercube sampling may be applied to achieve more uniform coverage of the design space while keeping computational demands manageable.
5.3. Climate-Specific Performance Analysis
Strong predictive performance was achieved across all six climatic regions, with test R2 values exceeding 0.93 for all three algorithms. This consistency confirms that the proposed multi-output framework effectively captures variations in building energy demand under diverse climatic conditions and generalizes well across regions.
Among the evaluated models, MLP showed the most uniform accuracy across climates, with R2 values ranging from 0.9502 in Hakkari to 0.9606 in Istanbul. SVR also performed reliably, achieving its highest accuracy in Istanbul (R2 = 0.9586) and maintaining R2 values above 0.94 in all cities. Random Forest exhibited slightly lower but stable performance, with R2 values ranging from 0.9313 (Ankara) to 0.9377 (Erzurum), indicating consistent behavior across different climate types.
Small differences in performance among cities reflect variations in climatic characteristics rather than model weakness. Cooling-dominated regions showed marginally higher accuracy for MLP, while heating-dominated regions achieved comparable results across all models. This balance indicates that the models successfully learned both cooling-driven and heating-driven energy demand patterns.
Overall, the consistently high accuracy across all climates demonstrates that a single unified model can reliably predict building energy demand in different climatic regions, eliminating the need for separate climate-specific models and supporting efficient early design stage assessment.
5.4. Feature Importance Insights
WWR is the most influential design parameter, accounting for approximately 42% of total feature importance. It affects energy performance through increased solar gains, higher cooling demand, and greater conductive heat losses, as glazing has substantially higher thermal transmittance than insulated opaque walls. As a result, its influence exceeds that of individual material-related parameters.
The importance ranking, starting with WWR, followed by glazing, insulation, and building geometry, is consistent with basic building physics and common design experience, which supports the reliability of the model. However, the strong influence of WWR indicates that window size is often not given enough attention in early design stages and offers a clear opportunity to improve energy performance through better façade design.
Several secondary findings help clarify the results. Building orientation shows a relatively low influence (about 2.6%), even though it is often emphasized in architectural design guidelines. This finding is consistent with simulation-based studies on school buildings in Türkiye, which report that while orientation affects energy use, its relative impact is smaller in Mediterranean climates than in colder and continental regions [17]. Similarly, ground floor insulation has the smallest impact (around 1.7%) compared to roof and wall insulation. Among insulation-related variables, insulation thickness is consistently more influential than material thermal conductivity, indicating that increasing thickness is generally more effective at the early design stage than choosing materials with slightly better conductivity values.
These results are linked to the characteristics of the studied design space. Because multiple climatic regions are included, the effect of orientation is reduced, as optimal orientations differ by climate. Ground-contact floors benefit from the thermal buffering effect of the soil, which limits temperature variation and reduces the role of floor insulation. In addition, improvements in material conductivity show diminishing returns, explaining why insulation thickness has a stronger impact. Overall, the analysis highlights façade transparency and roof insulation as the most important priorities for early-stage energy-efficient design.
5.5. Practical Application and Limitations
The surrogate model is well suited for early design stage decisions, where rapid evaluation of many alternatives is required. Its fast prediction capability enables interactive design exploration, early optimization, and efficient comparison of design options before detailed simulation. The model is particularly useful for parametric studies, sensitivity analysis, and teaching and learning environments in architecture, where relative performance trends are more important than exact energy values.
However, the model has several limitations. Its applicability is restricted to the parameter ranges used during training, and predictions outside these ranges may be unreliable. The model employs an ideal loads approach rather than detailed HVAC system modeling and predicts only annual heating and cooling energy demand, excluding lighting, plug loads, ventilation energy, and hourly load profiles. Occupancy behavior, control strategies, and construction quality are simplified, and fixed setpoints and standardized internal gains may differ from real operation. Climate applicability is limited to Turkish climate zones represented by typical meteorological year data, without accounting for extreme events or local microclimates.
Beyond the defined design space, additional validation is recommended. Predictions should be compared with EnergyPlus simulations for representative cases and, where possible, with measured annual energy data. Sensitivity checks near parameter boundaries and comparisons with alternative simulation tools can further support confidence in model reliability.
5.6. Practical Deployment and User Interface
To demonstrate the practical usability and real-world deployment potential of the presented surrogate modeling approach, the three trained machine learning models were implemented through a simple graphical user interface developed in Python 3.10. The interface allows users to access model predictions through three main components: input selection, prediction workflow, and output visualization. The input panel includes dropdown menus for all design parameters used during model training (see Section 3.5.3). All options are populated from a configuration file to ensure consistency with the trained parameter ranges.
The prediction workflow follows five steps. First, the user loads a trained model (Random Forest, SVR, or MLP). Second, design parameters are selected via dropdown menus, with real-time U-value updates displayed. Third, the interface constructs a 22-dimensional feature vector using appropriate one-hot encoding for categorical variables. Fourth, model inference is executed with a response time below 10 ms. Finally, predicted annual heating and cooling energy consumption is displayed for all six cities in terms of absolute annual energy demand (kWh).
The output panel presents results in a two-column layout, separating cooling and heating demands for each city. For visualization and comparison purposes, the predicted annual energy demands are normalized by the conditioned floor area to obtain energy intensity values (kWh/m2/year). Results are color-coded based on total annual energy demand to provide immediate visual feedback on overall performance. The interface includes input validation and consistency checks to ensure reliable predictions.
Figure 6 shows the interface in use, highlighting a clear and intuitive layout that allows users to obtain instant energy predictions without machine learning expertise. The interface workflow, from parameter selection to result display, emphasizes usability and accessibility. This deployment serves as a proof-of-concept demonstration, ensuring that the proposed modeling framework is directly transferable to practical early-stage building design applications.
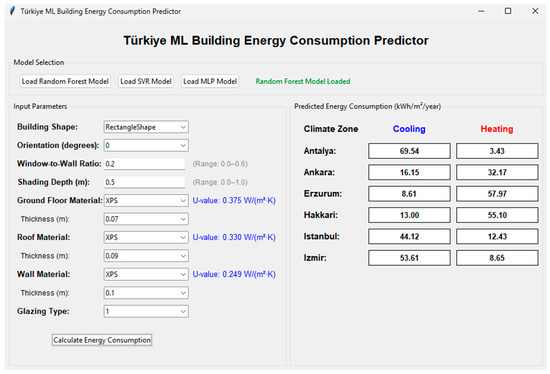
Figure 6.
Graphical user interface for building energy prediction, showing (left) design parameter selection, (center) model selection and prediction execution, and (right) predicted annual heating and cooling energy demand for six Turkish cities in normalized (kWh/m2/year) form.
5.7. Comparison with Literature
This study contributes to simulation-trained building energy prediction research through methodological integration, multi-climate modeling, and practical deployment. Unlike many studies focusing on a single climate or a single output, the proposed framework predicts heating and cooling energy demand across six climatic regions using a unified multi-output structure, representing both shared relationships and climate-specific response patterns.
A key contribution is the stratified random sampling strategy, which reduced the design space from 6.2 million to 5000 configurations (99.92% reduction) while maintaining representative coverage. This provides a practical response to high-dimensional parametric modeling challenges frequently highlighted in the literature [8,28]. In addition, systematic validation and explicit overfitting assessment strengthen model reliability, addressing a common limitation in prior machine learning studies where generalization performance is insufficiently evaluated. The deployment of the trained models through a graphical user interface further differentiates this work from much of the literature, which often stops at model development without addressing practical usability.
The achieved predictive performance exceeds or matches the upper range reported in related studies. All three algorithms demonstrate high accuracy (MLP R2 = 0.9560, SVR R2 = 0.9484, RF R2 = 0.9345), compared to typical R2 values of 0.75–0.95 for single-climate studies and 0.70–0.85 for multi-climate applications [8,14,26,34]. The consistently strong performance across all climates, including cold and heating-dominated regions, indicates that multi-climate prediction can be achieved without loss of accuracy when supported by comprehensive sampling and robust model design.
Feature importance analysis further supports the physical credibility of the framework. The dominance of the WWR (42%) and the substantial contribution of glazing properties (26%) highlight the primary role of facade-related parameters in determining building energy performance. These findings align with established building physics principles and are consistent with trends reported in prior sensitivity analyses [26,28,64,65]. This consistency indicates that the model captures meaningful energy drivers rather than dataset-specific correlations, reinforcing its suitability for early-stage, energy-informed design decision-making.
5.8. Future Research Directions
Several extensions can enhance the proposed framework and broaden its applicability. First, advances in machine learning methods offer opportunities to improve predictive performance and uncertainty awareness. Deep neural networks may capture complex non-linear interactions among design parameters more effectively, while gradient boosting models such as XGBoost and LightGBM provide alternative ensemble strategies with different bias–variance trade-offs. Bayesian learning approaches could explicitly quantify prediction uncertainty, enabling confidence intervals that support risk-aware design decisions. Multi-fidelity modeling, combining simplified analytical models, reduced-order simulations, and high-fidelity physics-based tools, could further optimize the balance between computational efficiency and accuracy across different design stages.
Second, extending the scope of model outputs would increase practical value. Higher temporal resolution outputs (e.g., monthly or hourly) would support load profiling, equipment sizing, and energy pricing analysis beyond annual energy totals. Disaggregation of end uses, including heating, cooling, lighting, and equipment loads, would enable more targeted efficiency strategies and detailed energy assessments. Expanding model training and validation to additional climate regions beyond Türkiye would improve transferability and reveal climate-specific patterns requiring localized adaptation. Incorporating more complex building geometries, such as irregular plans or curved façades, would further extend the applicability of the framework beyond simplified templates.
Finally, practical enhancements could strengthen integration with design workflows. Direct coupling with Building Information Modeling platforms (e.g., Revit or Rhino) would enable real-time energy feedback within commonly used design tools. Multi-objective optimization frameworks jointly considering energy performance, cost, thermal comfort, and daylighting would support more holistic decision-making. In this context, integrating daylight availability and glare constraints with energy objectives, particularly in relation to glazing visible transmittance, represents an important direction for future studies, as highlighted by Alsukkar et al. (2026) [66]. Automated reporting could support communication during design decision-making, while web or mobile-based deployment would improve accessibility in early design process.
6. Conclusions
This study presents a machine learning-based building energy prediction framework that addresses computational limitations of conventional simulation-driven early-stage design evaluation. By integrating strategic sampling, multi-output model development, and practical deployment, the framework supports accurate and computationally efficient energy assessment for informed design decision-making.
A key methodological contribution is the use of stratified random sampling to reduce the simulation space from 6.2 million to 5000 representative building configurations, corresponding to a 99.92% reduction in computational effort. This reduction converted an impractical simulation task into a feasible workflow while preserving balanced coverage across selected building typologies, envelope options, and six climatic regions of Türkiye. The resulting dataset of 30,000 EnergyPlus simulations, with separate heating and cooling outputs, provided a robust basis for learning climate-specific energy response patterns for the defined design space.
Three machine learning models (Random Forest, Support Vector Regression, and Multi-Layer Perceptron) were trained using a multi-output regression framework to predict annual heating and cooling energy demand across the considered climatic regions. All models achieved strong predictive performance (test R2 > 0.93), indicating consistent generalization under the modeled conditions. The Multi-Layer Perceptron delivered the highest accuracy (R2 = 0.9560), Support Vector Regression achieved the lowest prediction error (MAE = 797 kWh), while Random Forest provided competitive accuracy (R2 = 0.9345) with higher interpretability and minimal preprocessing requirements. Based on these practical considerations, Random Forest was selected as the primary deployed model, while the remaining models are retained for comparative analysis. Prediction times below 10 ms represent substantial speed advantage relative to EnergyPlus, supporting interactive early-stage design evaluation.
The unified multi-output formulation captured shared physical relationships and climate-specific characteristics without requiring separate models for individual locations. Consistently high performance across all climate regions supports the robustness of this approach for comparative national-scale evaluation under the adopted modeling assumptions.
Feature importance analysis provided clear insight into early-stage design priorities. Window-to-wall ratio emerged as the dominant parameter (42% importance), followed by glazing properties and roof insulation thickness, highlighting the central role of facade-related decisions in energy performance. These findings align with building physics while offering quantitative guidance for prioritizing key early design variables.
To support practical use, the framework was implemented through an intuitive graphical user interface that allows designers to obtain instant heating and cooling predictions without simulation or machine learning expertise. Climate-specific outputs, physically consistent U-value calculations, and clear result visualization support informed decision-making during conceptual design.
Overall, the results show that machine learning surrogate models, when combined with structured sampling and physics-informed inputs, can achieve high predictive accuracy while significantly reducing computational cost. Within the defined early-stage assumptions and archetype-based design space, the proposed framework enables rapid design evaluation and comparative energy performance assessment that would be difficult to achieve using traditional simulation workflows alone.
Funding
This research received no external funding.
Data Availability Statement
The data presented in this study are available on request from the author.
Acknowledgments
During the preparation of this manuscript, the author used Grammarly 1.151.1.0 and ChatGPT 5.2 for the purposes of improving language, readability, and writing style. The author has reviewed and edited the output and takes full responsibility for the content of this publication.
Conflicts of Interest
The author declares no conflicts of interest.
Abbreviations
The following abbreviations are used in this manuscript:
| ANN | Artificial Neural Network |
| BES | Building Energy Simulation |
| CR | Climate Region |
| EPW | Energy Plus Weather File |
| MLP | Multi-Layer Perceptron |
| MAE | Mean Absolute Error |
| RMSE | Root Mean Square Error |
| SVR | Support Vector Regression |
| RF | Random Forest |
| R2 | Coefficient of Determination |
| SHGC | Solar Heat Gain Coefficient |
| TS 825 | Thermal Insulation Requirements for Buildings (Türkiye) |
| TMY | Typical Meteorological Year |
| WWR | Window to wall ratio |
| VT | Visible Transmittance |
Appendix A
Table A1.
Climatic regions and representative cities in Türkiye according to TS 825:2024 [24].
Table A1.
Climatic regions and representative cities in Türkiye according to TS 825:2024 [24].
| Climatic Regions * | Climatic Definition | Cities |
|---|---|---|
| CR-1 | Very hot | Adana, Antalya, Mersin |
| CR-2 | Hot | Adıyaman, Gaziantep, Kilis, Siirt, Aydın, Hatay, Manisa, Şanlıurfa, Batman, İzmir, Mardin, Denizli, Kahramanmaraş, Osmaniye |
| CR-3 | Mild | Balıkesir, İstanbul, Rize, Tekirdağ, Bursa, Kocaeli, Sakarya, Trabzon, Çanakkale, Muğla, Samsun, Yalova, Giresun, Ordu, Sinop, Zonguldak |
| CR-4 | Cold | Afyon, Artvin, Bolu, Düzce, Diyarbakır, Eskişehir, Karaman, Kırşehir, Nevşehir, Tunceli, Amasya, Bartın, Burdur, Edirne, Iğdır, Kayseri, Konya, Niğde, Uşak, Aksaray, Bilecik, Çankırı, Elâzığ, Isparta, Kırıkkale, Kütahya, Şırnak, Ankara, Bingöl, Çorum, Erzincan, Karabük, Kırklareli, Malatya, Tokat |
| CR-5 | Very cold | Bayburt, Kastamonu, Yozgat, Bitlis, Muş, Gümüşhane, Sivas, Hakkâri, Van |
| CR-6 | Extremely cold | Ağrı, Ardahan, Erzurum, Kars |
* Climatic Regions (CR) per TS-825 (2024).
Table A2.
Random Forest Hyperparameter Search Space.
Table A2.
Random Forest Hyperparameter Search Space.
| Parameter | Search Range | Purpose |
|---|---|---|
| n_estimators | [100, 300] | Ensemble size for stability |
| max_depth | [5, 8, 10, 12, 15, 20] | Limit tree complexity |
| min_samples_split | [10, 50] | Samples before split |
| min_samples_leaf | [5, 20] | Minimum leaf samples |
| max_features | [sqrt, log2, 0.5, 0.7] | Feature subset per split |
| max_leaf_nodes | [None, 50, 100, 150, 200] | Direct complexity limit |
| min_impurity_decrease | [0.0, 0.01] | Meaningful splits only |
| max_samples | [0.7, 1.0] | Bootstrap fraction |
Table A3.
SVR Hyperparameter Search Space.
Table A3.
SVR Hyperparameter Search Space.
| Parameter | Search Range | Purpose |
|---|---|---|
| C | [1, 1000] | Regularization strength |
| gamma | [scale, auto, 0.001–1.0] | RBF kernel bandwidth |
| epsilon | [0.01, 0.5] | ε-tube width |
| kernel | rbf (fixed) | Radial basis function |
Table A4.
MLP Hyperparameter Search Space.
Table A4.
MLP Hyperparameter Search Space.
| Parameter | Search Range | Purpose |
|---|---|---|
| hidden_layer_sizes | [(50), (100), (50, 50), (100, 50), (100, 100)] | Network architecture depth and width configuration |
| activation | [relu, tanh] | Non-linear activation |
| alpha | [0.0001, 0.001, 0.01] | L2 regularization strength |
| learning_rate_init | [0.001, 0.01] | Initial learning rate |
| max_iter | [500, 1000] | Training iterations |
| early_stopping | True (fixed) | Prevent overfitting |
| validation_fraction | 0.1 (fixed) | Hold-out for early stopping |
| n_iter_no_change | 20 (fixed) | Patience for early stopping |
References
- International Energy Agency (IEA). Buildings—Tracking Clean Energy Progress; IEA: Paris, France, 2023. [Google Scholar]
- Sadeghi, A.; Sinaki, R.Y.; Weckman, G.R.; Young, W.A. An intelligent model to predict energy performances of residential buildings based on deep neural networks. Energies 2020, 13, 571. [Google Scholar] [CrossRef]
- Geyer, P.; Singaravel, S. Component-based machine learning for performance prediction in building design. Appl. Energy 2018, 228, 1439–1453. [Google Scholar] [CrossRef]
- Clarke, J. Energy Simulation in Building Design, 2nd ed.; Routledge: London, UK, 2001. [Google Scholar]
- Hensen, J.L.M.; Lamberts, R. (Eds.) Building Performance Simulation for Design and Operation, 2nd ed.; Routledge: London, UK, 2019. [Google Scholar]
- O’Neill, Z.; Pang, X.; Shashanka, M.; Haves, P.; Bailey, T. Model-based real-time whole building energy performance monitoring and diagnostics. J. Build. Perform. Simul. 2014, 7, 83–99. [Google Scholar] [CrossRef]
- Zhao, H.-X.; Magoulès, F. A review on the prediction of building energy consumption. Renew. Sustain. Energy Rev. 2012, 16, 3586–3592. [Google Scholar] [CrossRef]
- Seyedzadeh, S.; Rahimian, F.; Glesk, I.; Roper, M. Machine learning for estimation of building energy consumption and performance: A review. Vis. Eng. 2018, 6, 5. [Google Scholar] [CrossRef]
- Singh, M.M.; Singaravel, S.; Klein, R.; Geyer, P. Quick energy prediction and comparison of options at the early design stage. Adv. Eng. Inform. 2020, 46, 101185. [Google Scholar] [CrossRef]
- Barbaresi, A.; Ceccarelli, M.; Torreggiani, D.; Tassinari, P.; Bovo, M.; Menichetti, G. Application of Machine Learning Models for Fast and Accurate Predictions of Building Energy Need. Energies 2022, 15, 1266. [Google Scholar] [CrossRef]
- Kömürcü, D.; Edis, E. Machine learning modeling for building energy performance prediction based on simulation data: A systematic review of the processes, performances, and correlation of process-related variables. Buildings 2025, 15, 1301. [Google Scholar] [CrossRef]
- Ahmad, T.; Chen, H.; Guo, Y.; Wang, J. A comprehensive overview on the data-driven and large-scale based approaches for forecasting building energy demand: A review. Energy Build. 2018, 165, 301–320. [Google Scholar] [CrossRef]
- Sarker, I.H. Machine Learning: Algorithms, Real-World Applications and Research Directions. SN Comput. Sci. 2021, 2, 160. [Google Scholar] [CrossRef]
- Amasyali, K.; El-Gohary, N.M. A review of data-driven building energy consumption prediction studies. Renew. Sustain. Energy Rev. 2018, 81, 1192–1205. [Google Scholar] [CrossRef]
- Seyedzadeh, S.; Rahimian, F.P.; Rastogi, P.; Glesk, I. Tuning machine learning models for prediction of building energy loads. Sustain. Cities Soc. 2019, 47, 101484. [Google Scholar] [CrossRef]
- Jain, R.K.; Smith, K.M.; Culligan, P.J.; Taylor, J.E. Forecasting energy consumption of multi-family residential buildings using support vector regression: Investigating the impact of temporal and spatial monitoring granularity on performance accuracy. Appl. Energy 2014, 123, 168–178. [Google Scholar] [CrossRef]
- Afacan, Y. Impact of climate zone and orientation angle on the recurring massing school typologies in Turkey. In Sustainability in Energy and Buildings 2021; Littlewood, J.R., Howlett, R.J., Jain, L.C., Eds.; Smart Innovation, Systems and Technologies; Springer: Singapore, 2021; Volume 263, pp. 17–31. [Google Scholar]
- Grigorovitch, M.; Vlad, G.; Yulzary, S.; Gal, E. Advancing Energy Efficiency in Educational Buildings: A Case Study on Sustainable Retrofitting and Management Strategies. Appl. Sci. 2025, 15, 10867. [Google Scholar] [CrossRef]
- Alghamdi, S.; Tang, W.; Kanjanabootra, S.; Alterman, D. Effect of Architectural Building Design Parameters on Thermal Comfort and Energy Consumption in Higher Education Buildings. Buildings 2022, 12, 329. [Google Scholar] [CrossRef]
- Attia, S.; Gratia, E.; De Herde, A.; Hensen, J.L.M. Simulation-based decision support tool for early stages of zero-energy building design. Energy Build. 2012, 49, 2–15. [Google Scholar] [CrossRef]
- Directive 2002/91/EC of the European Parliament and of the Council of 16 December 2002 on the Energy Performance of Buildings. 2002. Available online: https://eur-lex.europa.eu/eli/dir/2002/91/oj/eng (accessed on 2 January 2026).
- Aydın, M.A.; Koçlar Oral, G. Environmental impact assessment of building envelope insulation standards for decarbonization efforts in a developing country: A case study for Türkiye. Energy Build. 2025, 349, 116537. [Google Scholar] [CrossRef]
- Republic of Türkiye Ministry of Energy and Natural Resources. Energy Efficiency 2030 Strategy and Second National Energy Efficiency Action Plan (2024–2030); Ministry of Energy and Natural Resources: Ankara, Türkiye, 2024. Available online: https://enerji.gov.tr/Media/Dizin/BHIM/tr/Duyurular/T%C3%BCrkiyeninEnerjiVerimlili%C4%9Fi2030StratejisiveIIUlusalEnerjiVerimlili%C4%9FiEylemPlan%C4%B1_202401161407.pdf (accessed on 2 January 2026).
- Turkish Standards Institution (TSE). TS 825: Thermal Insulation Requirements for Buildings; TSE: Ankara, Türkiye, 2024. [Google Scholar]
- Diz, T. New TS 825 Standard and Its Impacts on Our Sector; İZODER: İstanbul, Türkiye, 2025; Available online: https://www.izoder.org.tr/dosyalar/IZODER%20TS%20825%20Sektorel%20Bilgilendirme.pdf (accessed on 2 January 2026).
- Deb, C.; Zhang, F.; Yang, J.; Lee, S.E.; Shah, K.W. A review on time series forecasting techniques for building energy consumption. Renew. Sustain. Energy Rev. 2017, 74, 902–924. [Google Scholar] [CrossRef]
- Wei, Y.; Zhang, X.; Shi, Y.; Xia, L.; Pan, S.; Wu, J.; Han, M.; Zhao, X. A review of data-driven approaches for prediction and classification of building energy consumption. Renew. Sustain. Energy Rev. 2018, 82, 1027–1047. [Google Scholar] [CrossRef]
- Bourdeau, M.; Zhai, X.Q.; Nefzaoui, E.; Guo, X.; Chatellier, P. Modeling and forecasting building energy consumption: A review of data-driven techniques. Sustain. Cities Soc. 2019, 48, 101533. [Google Scholar] [CrossRef]
- Chen, Y.; Gong, W.; Obrecht, C.; Kuznik, F. A review of machine learning techniques for building electrical energy consumption prediction. Energy AI 2025, 21, 100518. [Google Scholar] [CrossRef]
- Tien, P.W.; Wei, S.; Darkwa, J.; Wood, C.; Calautit, J.K. Machine learning and deep learning methods for enhancing building energy efficiency and indoor environmental quality: A review. Energy AI 2022, 10, 100198. [Google Scholar] [CrossRef]
- Singh, M.M.; Singaravel, S.; Geyer, P. Machine learning for early-stage building energy prediction: Increment and enrichment. Appl. Energy 2021, 304, 117787. [Google Scholar] [CrossRef]
- Ritter, F.; Geyer, P.; Borrmann, A. Simulation-based decision-making in early design stages. In Proceedings of the 32nd CIB W78 Conference, Eindhoven, The Netherlands, 26–29 October 2015; pp. 27–29. [Google Scholar]
- Westermann, P.; Evins, R. Surrogate modelling for sustainable building design: A review. Energy Build. 2019, 198, 170–186. [Google Scholar] [CrossRef]
- Ali, A.; Jayaraman, R.; Mayyas, A.; Alaifan, B.; Azar, E. Machine learning as a surrogate to building performance simulation: Predicting energy consumption under different operational settings. Energy Build. 2023, 286, 112940. [Google Scholar] [CrossRef]
- Østergård, T.; Jensen, R.L.; Maagaard, S.E. A comparison of six metamodeling techniques applied to building performance simulations. Appl. Energy 2018, 211, 89–103. [Google Scholar] [CrossRef]
- Shirzadi, N.; Lau, D.; Stylianou, M. Surrogate Modeling for Building Design: Energy and Cost Prediction Compared to Simulation-Based Methods. Buildings 2025, 15, 2361. [Google Scholar] [CrossRef]
- Li, G.; Tian, W.; Zhang, H.; Chen, B. Building Energy Models at Different Time Scales Based on Multi-Output Machine Learning. Buildings 2022, 12, 2109. [Google Scholar] [CrossRef]
- Asadi, E.; Gameiro da Silva, M.; Henggeler Antunes, C.; Dias, L.; Glicksman, L. Multi-objective optimization for building retrofit: A model using genetic algorithm and artificial neural network and an application. Energy Build. 2014, 81, 444–456. [Google Scholar] [CrossRef]
- Solmaz, A.S. Machine learning based optimization approach for building energy performance. In Proceedings of the 2020 Building Performance Analysis Conference and SimBuild, ASHRAE/IBPSA-USA, Virtual Conference, 29 September–1 October 2020; Volume 9, pp. 69–76. Available online: https://publications.ibpsa.org/conference/paper/?id=simbuild2020_C009 (accessed on 2 January 2026).
- Yigit, S. A machine-learning-based method for thermal design optimization of residential buildings in highly urbanized areas of Turkey. J. Build. Eng. 2021, 38, 102225. [Google Scholar] [CrossRef]
- Ertosun Yıldız, M.; Beyhan, F. Prediction of cooling load via machine learning on building envelope design parameters. J. Build. Eng. 2025, 100, 111724. [Google Scholar] [CrossRef]
- Park, Y.S.; Lek, S. Artificial neural networks: Multilayer perceptron for ecological modeling. Dev. Environ. Model. 2016, 28, 123–140. [Google Scholar]
- Aparicio-Ruiz, P.; Barbadilla-Martín, E.; Guadix, J.; Nevado, J. Analysis of Variables Affecting Indoor Thermal Comfort in Mediterranean Climates Using Machine Learning. Buildings 2023, 13, 2215. [Google Scholar] [CrossRef]
- Qin, H.; Yu, Z.; Li, Z.; Li, H.; Zhang, Y. Nearly Zero-Energy Building Load Forecasts through the Competition of Four Machine Learning Techniques. Buildings 2024, 14, 147. [Google Scholar] [CrossRef]
- Liu, Y.; Chen, H.; Zhang, L.; Wu, X.; Wang, X.-J. Energy consumption prediction and diagnosis of public buildings based on support vector machine learning: A case study in China. J. Clean. Prod. 2020, 272, 122542. [Google Scholar] [CrossRef]
- Paudel, S.; Elmitri, M.; Couturier, S.; Nguyen, P.H.; Kamphuis, R.; Lacarrière, B.; Le Corre, O. A relevant data selection method for energy consumption prediction of low energy building based on support vector machine. Energy Build. 2017, 138, 240–256. [Google Scholar] [CrossRef]
- Zhong, H.; Wang, J.; Jia, H.; Mu, Y.; Lv, S. Vector field-based support vector regression for building energy consumption prediction. Appl. Energy 2019, 242, 403–414. [Google Scholar] [CrossRef]
- Shao, M.; Wang, X.; Bu, Z.; Chen, X.; Wang, Y. Prediction of energy consumption in hotel buildings via support vector machines. Sustain. Cities Soc. 2020, 57, 102128. [Google Scholar] [CrossRef]
- Khalil, A.; Lila, A.M.H.; Ashraf, N. Optimization and Prediction of Different Building Forms for Thermal Energy Performance in the Hot Climate of Cairo Using Genetic Algorithm and Machine Learning. Computation 2023, 11, 192. [Google Scholar] [CrossRef]
- Kalogirou, S.A.; Neocleous, C.; Schizas, C. Building heating load estimation using artificial neural networks. In Proceedings of the Clima 2000 Conference, Brussels, Belgium, 30 August–02 September 1997. [Google Scholar]
- Akköse, G.; Duran, A.; Gürsel Dino, İ.; Akgül, Ç. Machine learning based evaluation of window parameters on building energy performance and occupant thermal comfort under climate change. Gazi Univ. J. Sci. Part C Des. Technol. 2023, 38, 2069–2084. [Google Scholar] [CrossRef]
- Alshibani, A. Prediction of the Energy Consumption of School Buildings. Appl. Sci. 2020, 10, 5885. [Google Scholar] [CrossRef]
- DesignBuilder Software Ltd. DesignBuilder Energy Simulation Software, Version 7.3; DesignBuilder Software Ltd.: Stroud, UK, 2025. Available online: https://www.designbuilder.co.uk (accessed on 2 January 2025).
- U.S. Department of Energy. EnergyPlus Energy Simulation Software, Version 9.4.0; U.S. Department of Energy: Washington, DC, USA, 2020. Available online: https://energyplus.net (accessed on 2 January 2025).
- Zhang, A.; Bokel, R.; van den Dobbelsteen, A.; Sun, Y.; Huang, Q.; Zhang, Q. The effect of geometry parameters on energy and thermal performance of school buildings in cold climates of China. Sustainability 2017, 9, 1708. [Google Scholar] [CrossRef]
- Ivanova, E. School Building Planning: Main Types of Systems (Plans) of School Buildings. 2019. Available online: https://api.semanticscholar.org/CorpusID:218902982 (accessed on 10 September 2025).
- Akkose, G.; Meral Akgul, C.; Gursel Dino, I. Educational building retrofit under climate change and urban heat island effect. J. Build. Eng. 2021, 40, 102294. [Google Scholar] [CrossRef]
- Kuranlıoğlu, D.; İzmir Tunahan, G. Designing climate-responsive learning environments: Rethinking educational buildings across Türkiye’s diverse climatic zones. Erciyes Univ. J. Inst. Sci. Technol. 2025, 41, 282–317. [Google Scholar]
- OneBuilding. Climate Data for Building Performance Simulation—Türkiye (WMO Region 6). Available online: https://climate.onebuilding.org/WMO_Region_6_Europe/TUR_Turkiye/index.html (accessed on 10 September 2025).
- Breiman, L. Random forests. Mach. Learn. 2001, 45, 5–32. [Google Scholar] [CrossRef]
- Smola, A.J.; Schölkopf, B. A tutorial on support vector regression. Stat. Comput. 2004, 14, 199–222. [Google Scholar] [CrossRef]
- Pedregosa, F.; Varoquaux, G.; Gramfort, A.; Michel, V.; Thirion, B.; Grisel, O.; Blondel, M.; Prettenhofer, P.; Weiss, R.; Dubourg, V.; et al. Scikit-learn: Machine learning in Python. J. Mach. Learn. Res. 2011, 12, 2825–2830. [Google Scholar]
- Kohavi, R. A study of cross-validation and bootstrap for accuracy estimation and model selection. In Proceedings of the 14th International Joint Conference on Artificial Intelligence (IJCAI), Montreal, QC, Canada, 20–25 August 1995; pp. 1137–1145. [Google Scholar]
- Senel Solmaz, A.; Halicioglu, F.H.; Gunhan, S. An approach for making optimal decisions in building energy efficiency retrofit projects. Indoor Built Environ. 2016, 27, 348–368. [Google Scholar] [CrossRef]
- Gerçek, M.; Durmuş Arsan, Z. Energy and environmental performance based decision support process for early design stages of residential buildings under climate change. Sustain. Cities Soc. 2019, 48, 101580. [Google Scholar] [CrossRef]
- Alsukkar, M.; Ibrahim, A.; Eltaweel, A. Multi-objective optimization of daylighting systems for energy efficiency and thermal–visual comfort in buildings: A review. Build. Environ. 2026, 288, 113921. [Google Scholar] [CrossRef]


Disclaimer/Publisher’s Note: The statements, opinions and data contained in all publications are solely those of the individual author(s) and contributor(s) and not of MDPI and/or the editor(s). MDPI and/or the editor(s) disclaim responsibility for any injury to people or property resulting from any ideas, methods, instructions or products referred to in the content. |
© 2026 by the author. Licensee MDPI, Basel, Switzerland. This article is an open access article distributed under the terms and conditions of the Creative Commons Attribution (CC BY) license.