Abstract
Driven by the combined effects of global warming and the urban heat island (UHI) effect, building energy consumption has been rising steadily in recent years. The photovoltaic-cool roof (PVCR) system has emerged as an effective solution for urban energy conservation and carbon reduction. However, existing research on the energy-saving benefits of PVCR remains relatively limited, and none of these studies have considered the interaction between photovoltaic modules and high-reflectivity roofs (also called cool roof, CR). Therefore, field experiments were conducted to compare the thermal performance of the PVCR system against that of three conventional roof configurations, including photovoltaic roof (PVR), asphalt roof (AR), and CR. The results demonstrate that the PVCR system achieves a remarkable daytime cooling effect, with a maximum temperature reduction of 29 °C compared to the AR system, and maintains lower temperature fluctuations throughout the entire day. In addition, the findings reveal that the photovoltaic modules exhibit a lower average temperature when installed on the cool roof, with a temperature decrease of 0.15 °C relative to the asphalt roof. A numerical model incorporating the photothermal interaction between a high-reflectivity surface and PV modules was developed and validated with experimental data. The numerical model considers the interactions between the photovoltaic (PV) modules and the high reflectivity surface, including shortwave radiation reflection, longwave radiative exchange, and convective heat transfer. The sensitivity analysis indicates that a change in the spacing and height of the PV arrays from 0.3 m to 0.5 m increases the relative energy-saving efficiency of the system. The conclusions drawn in this paper can provide a reference for the application of the PVCR system in hot-summer and cold-winter areas.
1. Introduction
Against the backdrop of accelerating urbanization, high-rise building clusters have become a dominant feature of contemporary urban morphology. While such compact development patterns enable efficient land utilization and enhance urban operational efficiency and residential convenience, they have simultaneously led to a substantial increase in building energy consumption and persistently high levels of carbon dioxide emissions. The intensification of these challenges not only exacerbates global warming, resulting in a higher frequency, broader spatial extent, and greater severity of extreme climate events, but also interacts synergistically with the urban heat island effect. Consequently, the energy intensity of the building sector has exhibited a continuous upward trend in recent years [1,2]. As a key component of the building envelope, the roof plays a critical role in thermal insulation and heat mitigation, thereby offering significant potential for reducing building energy consumption [3]. Photovoltaic roofs and cool roofs have become widely adopted strategies for energy conservation and carbon emission reduction in urban buildings. A substantial body of existing research has investigated their thermal performance and energy-saving potential under various climatic conditions. For example, Park et al. [4] conducted a one-year field study on cool roofs in Seoul, Republic of Korea, and reported that, compared with conventional asphalt roofs, cool roofs reduced the average external surface temperature of the roof structure by 5.6 °C, with a maximum temperature reduction of up to 21.4 °C. Meanwhile, Zhang et al. [5] investigated the impact of cool roofs on building energy consumption in Hefei, China, using a combined approach of field experiments and numerical simulations. The results indicated that, during the summer period, the daily average indoor air temperature in buildings equipped with cool roofs was 1.8 °C lower than that of a reference building, accompanied by a 29.1% reduction in cooling load. However, an increase of 4.1% in heating load was observed during the winter season. Chen et al. [6] and Tzempelikos and Lee [7] also conducted studies across cities in different climatic areas by developing models and performing numerical simulations, demonstrating the energy efficiency, economic feasibility, and carbon-neutral potential of applying cool roofs in buildings. With regard to photovoltaic roofs, in addition to their electricity generation capability, the shading effect provided by PV modules plays an important role in reducing building energy demand and enhancing overall energy saving performance. Kapsalis and Karamanis [8] investigated the impact of roof-mounted photovoltaic systems on building energy demand using a university building in western Greece as a case study. Their results showed that, for top-floor spaces, the seasonal heating load increased by 6.7%, while the cooling load decreased by 17.8%, leading to an overall annual air conditioning load reduction of 3.2%. Wang et al. [9] developed a simplified physical and mathematical model of photovoltaic roofs to analyze the synergistic effects of photovoltaic power generation and shading. The results indicated that photovoltaic roofs can substantially attenuate solar heat gains and cooling loads, while slightly increasing heating loads. In addition, the presence of PV modules alters the thermal storage characteristics of the roof, resulting in a delay of approximately 2 h in the peak cooling load and about 1 h in the peak heating load. Meanwhile, an increasing number of studies have investigated photovoltaic roofs and cool roofs across different climatic regions and building types, as summarized in Table 1.

Table 1.
A summary of the thermal-electric performance of PVR or CR under different climate conditions.
However, in high-density urban areas where land resources are limited, photovoltaic roofs and cool roofs usually compete with each other for limited roof space. To address this challenge, an integrated design approach that combines rooftop photovoltaic arrays with a high reflectivity surface has been increasingly adopted. This integrated design is also called the photovoltaic-cool roof system (hereafter referred to as PVCR), as illustrated in Figure 1. Existing studies indicate that, compared with standalone photovoltaic roofs or cool roofs, the interaction between photovoltaic arrays and high reflectivity surfaces can generate synergistic effects that significantly enhance overall system performance [21]. Specifically, the reflective properties of a high reflectivity surface can reduce the operating temperature of PV modules, thereby improving electricity generation efficiency. Meanwhile, the shading effect of PV modules helps enhance the cooling performance of the underlying cool roof. However, some studies have also pointed out that the magnitude and even the presence of such synergistic effects remain uncertain. Ma et al. [22] focused on the Wuhan region and analyzed the shading effect and energy saving potential of rooftop photovoltaic arrays by developing a coupled thermo-optical-fluid heat transfer model, which was further validated through experimental measurements. The results showed that, at the annual optimal tilt angle of 18° for Wuhan, and under conditions where photovoltaic arrays were installed on both roof types, conventional low reflectivity asphalt roofs exhibited superior energy saving performance compared with cool roofs. These findings suggest that the thermo-electric performance of PVCR systems can vary substantially under different scenarios, and a clear consensus has yet to be established.
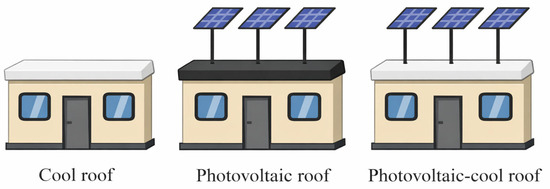
Figure 1.
Schematic diagram of cool roof, photovoltaic roof, and photovoltaic-cool roof.
Given the potential energy-saving benefits of PVCR, a number of experimental and modeling studies have been conducted to investigate their thermal behavior and energy performance. However, most existing studies have relied on fixed parameter settings and have been limited to single climatic regions, resulting in a relatively insufficient understanding of the overall thermal performance of these systems and their implications for carbon emission reduction. Moreover, optimization strategies for PVCR systems across distinct climate areas have not yet been systematically explored. As summarized in Table 2, owing to variations in building characteristics, high reflectivity surface, photovoltaic configurations, and climatic conditions, the energy saving performance of PVCR reported for specific regions is difficult to directly extrapolate to other climate areas.
Table 2.
A summary of the thermal-electric performance of PVCR under different climate conditions.
To evaluate the energy-saving performance of PVCR systems, several models have been developed based on existing heat transfer models for cool roofs or photovoltaic roofs, and there are four modeling approaches. The first approach of studies is based on building energy simulation using Ladybug Tools in combination with Honeybee and the EnergyPlus engine [29]. In these studies, a typical low-rise residential building model is constructed within the Grasshopper parametric environment, where rooftop photovoltaic arrays are coupled with roof materials of varying solar reflectance to simulate the coupled thermo-electric processes associated with photovoltaic shading and cool roof effects. This approach enables the assessment of the impact of photovoltaic shading on building energy consumption across different climatic regions. However, in this modeling framework, the role of PV modules is simplified to a shading effect only. Longwave radiative heat exchange, convective heat transfer, and thermal coupling between the PV modules and the roof are not explicitly considered. In addition, the impact of the operating temperature variation of photovoltaic equipment on power generation efficiency has been overlooked. The second approach of studies employs a coupled simulation framework that integrates regional climate models with building energy models [30]. In this approach, a comprehensive parametric model of urban-scale cool roofs and rooftop photovoltaic systems is developed to evaluate the impacts of large-scale deployment of photovoltaic arrays and high reflectivity roofs on near-surface air temperature and urban cooling energy demand. This modeling framework incorporates an energy-balance-based physical parameterization of PV modules, accounting for the attenuation of shortwave solar radiation by PV modules, longwave radiative exchange between the modules and the roof surface, and the impact of temperature-dependent photovoltaic power conversion efficiency. As a result, dynamic interactions among photovoltaic systems, buildings, and the urban atmosphere are explicitly represented. However, the model treats shaded and unshaded roof areas using a single equivalent roof temperature, which limits its ability to capture the spatial heterogeneity of the local thermal environment beneath photovoltaic arrays. The third approach of studies is based on the System Advisor Model (SAM) photovoltaic simulation platform [31]. In this approach, a rooftop energy balance model is developed and coupled with a modified SAM framework to simulate the power generation performance of photovoltaic systems under different roof configurations. Specifically, the roof surface temperature was first calculated using nonlinear energy balance equations and subsequently introduced as an input parameter to the photovoltaic model, thereby accounting for the influence of the rooftop thermal environment on PV module temperature and power conversion efficiency. However, this method does not capture the bidirectional thermal impact processes between PV modules and the roof. Moreover, the model has been validated only under a single climatic condition and for a single photovoltaic system configuration, and its applicability to other climate areas, PV module types, and installation configurations remains to be further examined. The fourth approach of studies adopts a hybrid research framework that combines physics-based photovoltaic system modeling with data-driven approaches [32]. In this framework, the PVsyst photovoltaic simulation platform is integrated with artificial neural network models to evaluate the power generation performance of bifacial photovoltaic systems coupled with high reflectivity roofs and to achieve power output prediction. Specifically, PVsyst is employed to establish an opto-electrical model of bifacial photovoltaic systems, enabling the quantification of power gains resulting from enhanced roof reflectance. In parallel, an artificial neural network based on the nonlinear autoregressive with exogenous inputs architecture is developed to accurately predict photovoltaic power output under different roof reflectance conditions. However, the accuracy of this approach is strongly dependent on the quality and availability of measured data. At present, experimental measurements of PVCR systems remain limited both domestically and internationally, resulting in relatively scarce data sources and thereby constraining the broader applicability of this method.
As one of the key regions driving China’s economic development, the hot summer and cold winter (HSCW) area is characterized by substantial heating and cooling demands and faces significant challenges under the “dual-carbon” targets [33]. Despite the growing body of research on PVCR systems, existing studies have mainly focused on fixed design parameters or single climatic conditions, and the coupled thermo-radiative interactions between photovoltaic modules and high-reflectivity surfaces have not yet been fully clarified. Moreover, reported conclusions regarding the synergistic energy-saving effects of PVCR remain inconsistent across different regions and installation configurations. These results indicate a clear research gap in terms of experimentally validated and parametric optimization of PVCR systems, particularly in the HSCW climate area. This restriction has hindered its further promotion, large-scale deployment, and industrial development in the area. Therefore, this study selected the HSCW area as the research region and conducted a field comparative experiment. The aim was to study the temperature distribution and energy balance of PVCR, and to develop a new heat transfer model for the photovoltaic cooling system. This model can explicitly consider the interaction of solar radiation between the cold roof and the photovoltaic modules. In addition, a systematic assessment was conducted on the thermal performance and energy-saving potential of PVCR in HSCW areas, providing a scientific basis for the application and promotion of PVCR in this area.
2. Materials and Methods
To investigate the coupled thermal and energy saving benefit of PVCR systems, a long-term field measurement campaign was conducted on the rooftop of an office building in Shanghai, China (121.22° E, 31.06° N). This location is representative of the northern subtropical monsoon climate (Köppen classification: Cfa), which is characterized by high solar availability and pronounced seasonal thermal contrasts. The local climate exhibits an annual precipitation of approximately 1173 mm [34] and an average annual global solar radiation of 4688.69 MJm−2 [35]. During summer months (June–September), outdoor air temperatures frequently exceed 35 °C, whereas winter temperatures may drop below 0 °C [13]. Seasonal prevailing winds are predominantly southeasterly in summer and northwesterly in winter [36], with an annual mean relative humidity of about 75% [37].
2.1. Field Experiment
Four types of roofs were constructed for comparative analysis of thermal performance: photovoltaic-cool roof (PVCR), photovoltaic roof (PVR), cool roof (CR), and asphalt roof (AR), as shown in Figure 2. For the PVCR and PVR configurations, south-facing photovoltaic arrays composed of monocrystalline silicon modules (35 cm × 290 cm) were installed above the roof surface. The modules were elevated 0.30 m from the roof plane, arranged with a row spacing of 0.45 m, and inclined at an angle of 25°. In the PVCR system, a cool roofing layer was applied beneath the photovoltaic arrays to enhance shortwave solar reflection, whereas the PVR system retained a conventional asphalt substrate. The CR and AR systems, without PV modules, served as reference cases for evaluating the individual and combined thermal effects of reflectivity and shading. Two sets of thermocouples were installed on both the upper and lower surfaces of the central PV module of the PVCR and PVR roof types to record the temperature changes at the central position of the solar PV modules. In addition, five thermocouples were evenly arranged on the upper and lower surfaces of the high reflectivity surface of PVCR and CR, as well as on the surfaces of PVR and AR roofs, to analyze the temperature changes of the four types of roofs. Detailed specifications of the instruments are provided in Table 3.
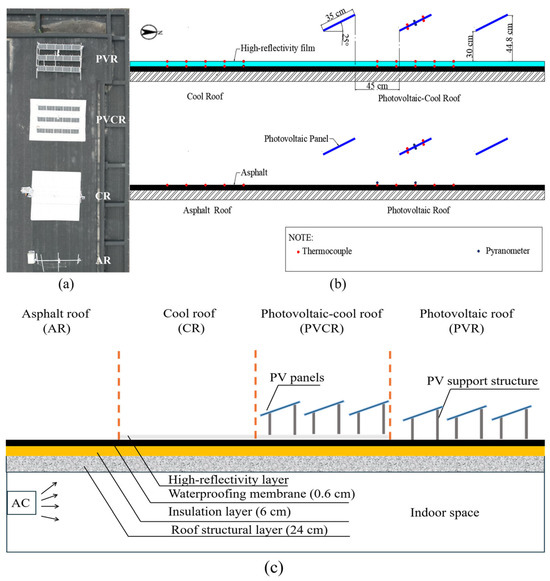
Figure 2.
Thermal behavior testing platform of PVCR and the other three types of roofs: (a) Top view of the field experiment; (b) Schematic diagram of the experimental setup; (c) Cross-sectional schematic diagram of the test roofs.
Table 3.
Specification of instruments used during the experiment.
2.2. Heat Transfer Model Development for PVCR System
To investigate the thermal performance and energy saving potential of the PVCR system, a coupled numerical heat transfer model was developed by integrating an established photovoltaic roof thermal model [31] with a cool roof heat transfer model. The proposed model systematically characterizes the coupled interactions between the PV modules and the cool roof. The model incorporates several key physical processes, including the shading effect of PV modules on the surface of cool roof, wind resistance effect of PV Modules on roof airflow [38], multiple shortwave radiation reflections among the PV modules and roof surfaces, longwave radiative exchange among the PV modules, the cool roof, and the sky, as well as the regulation of the thermal environment of the PV modules by the high solar reflectance of the cool roof. The numerical calculation procedure is illustrated schematically in Figure 3. Firstly, the turbulent heat transfer coefficients for each component of the PVCR system are estimated using empirical correlations as functions of wind speed, air properties, and geometric characteristics of the photovoltaic arrays under given boundary meteorological conditions. Subsequently, a photon-tracking method is employed to simulate the distribution of shortwave and longwave radiation within the PVCR system, explicitly accounting for surface optical properties, including albedo and emissivity of both the photovoltaic modules and the high-reflectivity roof. Finally, based on these radiative fluxes, the coupled energy balance equations are solved iteratively under quasi-steady thermal assumptions until convergence is achieved, thereby determining the temperature distributions of the photovoltaic modules and the high-reflectivity roof.
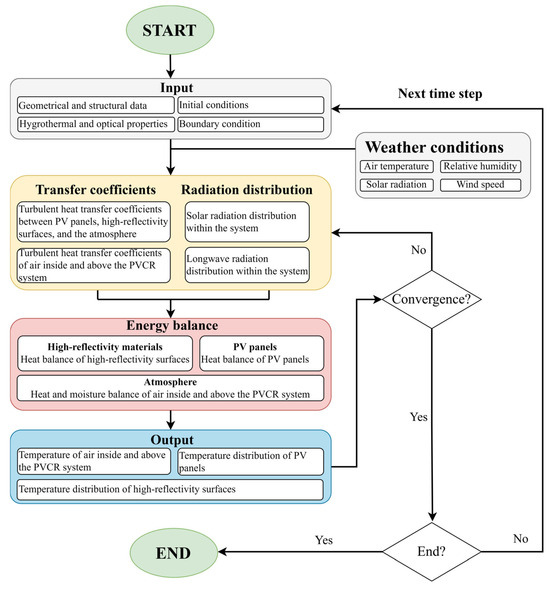
Figure 3.
Simulation flowchart of the PVCR model.
2.2.1. Energy Balance of PV Module
In addition to the heating and power generation process driven by solar radiation, the PV modules exchange heat with the environment through convection and long-wave radiation. The energy balance equations of the PV cover, PV absorber, and PV back are presented below.
where, , , are the surface temperature of PV cover, PV absorber and PV back, respectively. is the thermal resistance between PV cover and PV absorber, while is the thermal resistance between PV back and PV absorber. is the convective heat transfer coefficient of PV modules. is the temperature of the air layer close to the PV modules. , and are net shortwave radiation of the PV cover, PV absorber, and PV back, respectively. , and are net longwave radiation of the PV cover, PV absorber, and PV back, respectively. and are the volumetric heat capacity and thickness of PV absorber, respectively. refers to the heat emission from power generation, and equals 0 W/m2 due to the non-connection of PV modules in this study. refers to time (s).
2.2.2. Heat Transfer of Roof Deck Layer
The energy balance of the roof deck is shown in the following equations, including the internal, external surface, and the middle layer.
where, refers to temperature of roof deck layer. and are volumetric heat capacity (J/m3 K) and heat conductivity (W/m K) of the roof deck layer, respectively. and are indoor convective heat transfer coefficient (W/m2) and indoor temperature (°C), is outdoor convective heat transfer coefficient, respectively. and are the net solar radiation and longwave radiation of the external surface for the roof deck, respectively. and are the net solar radiation and longwave radiation of the internal surface for the roof deck, respectively.
2.2.3. Energy Balance of Air Within PVCR System
For the air layer at PV canopy, the energy balance equations are shown as below:
where, refers to the spatial step of air (m). is the volumetric heat capacity (J/m3 K) of the air layer, respectively. and are the thickness and PV modules per unit area, respectively. is the temperature of the air node at PV height, respectively. is the turbulent heat transfer from other air nodes to the air node at PV height. and are the aerodynamic resistance below and above the air node at PV height, which are based on the authors’ previous study [39].
2.2.4. Aerodynamic Resistance of Heat Transfer
The convective heat transfer coefficient of PV modules is based on the empirical model of:
where is the wind speed of the air node closest to PV modules.
3. Results
3.1. Comparison of Thermal Performance Between the PVCR System and Other Roofs
To clarify the thermal characteristics of the PVCR system, this study selected five consecutive typical clear days in both summer and winter for experimental investigation, as illustrated in Figure 4. The temporal variations in the external surface temperature of the roof structural layers for the four roof types are also presented in Figure 5.
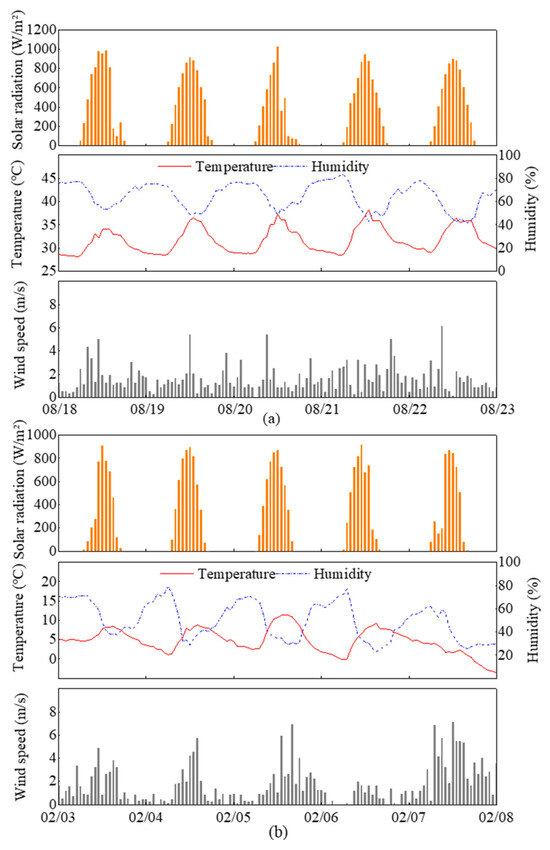
Figure 4.
Weather conditions of five consecutive clear days: (a) In summer; (b) In winter.
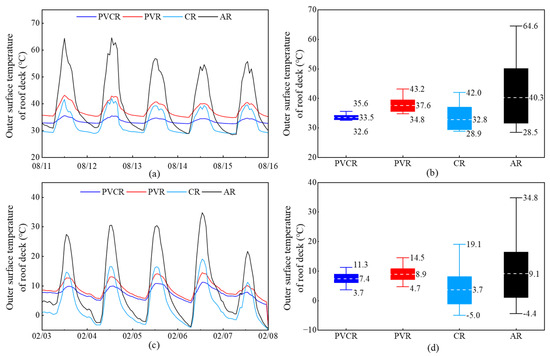
Figure 5.
Outer surface temperature comparison of the roof deck among PVCR, CR, PVR, and AR: (a) Line graph in Summer; (b) Box plot in Summer; (c) Line graph in winter; (d) Box plot in winter.
Firstly, from the perspective of the shading effect of PV modules, both roof systems equipped with photovoltaic arrays exhibit a reduction in daytime roof surface temperature compared with the AR and CR systems. Among them, the PVR system shows a particularly pronounced cooling effect relative to the AR system, with a maximum daytime temperature reduction of up to 21.4 °C during the summer. However, when compared with the CR system, the additional cooling provided by PVCR is relatively limited, with a maximum summer temperature difference of only about 7.6 °C.
Secondly, owing to the strong reflection of shortwave solar radiation by the cool roof layer, the average roof temperature of the PVCR system is significantly lower than that of the PVR system. Moreover, as indicated in Figure 5, the diurnal temperature difference of the PVCR system is much smaller than that of the PVR system, which contributes to extending the service life of the roof structural layers. During nighttime, the differences in the external surface temperature of the roof structural layers among the four roof systems are smaller than those observed during daytime. In particular, the maximum temperature difference between the PVCR and AR systems is only about 4 °C.
During winter daytime, the variation patterns of temperature differences among the four roof systems are similar to those observed in summer. However, around noon, the roof temperature of the CR system is higher than that of the PVR system. This can be attributed to the lower solar radiation intensity in winter, under which the shading effect of PV modules is more effective in reducing roof temperature than the reflective effect of a high reflectivity surface. At night, the temperatures of the PVR and PVCR systems are noticeably higher than those of the CR and AR systems, indicating that PV modules obstruct longwave radiative heat exchange between the roof surface and the sky.
In summary, the temperature distributions of the external surface of the roof structural layers for the four roof systems indicate that the PVCR system achieves a pronounced cooling effect during daytime, while exhibiting smaller temperature fluctuations at night. Moreover, the cool roof layer plays a more dominant role in enhancing the roof's thermal performance than the PV modules alone.
3.2. The Impact of Cool Roof Surface on PV Modules
As illustrated in Figure 6, a comparison of the front and back surface temperatures of the photovoltaic modules between the PVCR and PVR systems is presented. On a typical clear summer day, the PV modules in the PVCR system exhibit higher temperatures around noon than those in the PVR system, while remaining cooler during all other periods. Overall, experimental results indicate that, in summer, the PVCR system shows slightly lower average temperatures on both the front and back surfaces, with reductions of 0.2 °C and 0.1 °C, respectively. The minimum temperatures are more significantly reduced by 1.3 °C on the front surface and 1.0 °C on the back surface. In contrast, the maximum temperatures increase by 2.2 °C and 2.5 °C for the front and back surfaces, respectively. In winter, the cooling effect of the PVCR system on photovoltaic modules becomes more pronounced. Compared with the PVR system, the average temperatures of the front and back surfaces decrease by 0.6 °C and 0.8 °C, respectively. Meanwhile, both the minimum and maximum temperatures exhibit consistent reductions, with decreases of 0.6 °C and 0.7 °C in minimum temperature, and 1.5 °C and 1.6 °C in maximum temperature for the front and back surfaces, respectively.
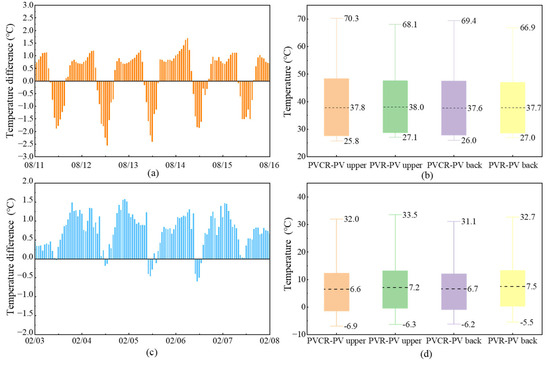
Figure 6.
Temperature comparison of PV modules between PVR and PVCR: (a) Hourly average temperature difference of PV modules in summer; (b) Box plot of PV surface temperature for PVR and PVCR in summer; (c) Hourly average temperature difference of PV modules in winter; (d) Box plot of PV surface temperature for PVR and PVCR in winter.
As illustrated in Figure 7, A comparison was conducted between the two roof systems to analyze the distributions of solar radiation incident on the front and back surfaces of the photovoltaic modules. Both in summer and winter, the solar radiation received by the front surfaces of the PV modules in the two systems is almost identical, whereas a substantial discrepancy is observed in the radiation received by their back surfaces. The solar radiation incident on the back surfaces of the PV modules in both systems increases initially, reaches a maximum around solar noon, and then gradually decreases. However, the solar radiation received by the back surfaces of the PV modules in the PVCR system is dozens of times higher than that in the PVR system. This can be attributed to the high reflectivity of the surface beneath the PV modules, which reflects the solar radiation passing through the module gaps onto the back surfaces of the PV modules. In contrast, the conventional asphalt roof has a high absorptivity, absorbing the majority of the incoming radiation.
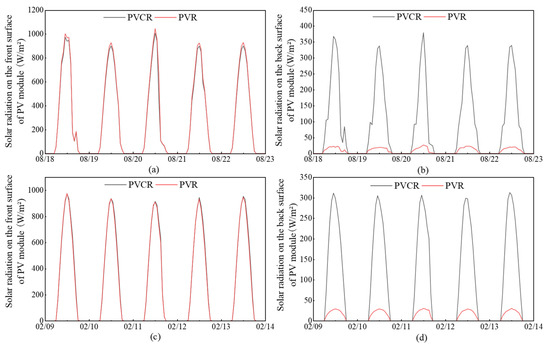
Figure 7.
Comparison of Surface Radiation of PV Modules between PVCR and PVR: (a) Front surface of PV module in summer; (b) Back surface of PV module in summer; (c) Front surface of PV module in winter; (d) Back surface of PV module in winter.
As shown in Figure 6 and Figure 7, it can be observed that at solar noon, both solar irradiance and solar altitude angle reach their maxima, which substantially enhances the reflection of shortwave solar radiation from the cool roof. A large fraction of the reflected solar radiation was reflected to the back surfaces of the PV modules, thereby increasing the total radiative energy received by the modules. During this period, the increased solar radiation leads to greater heat accumulation on the back surface of the PV modules, resulting in higher PV module temperatures above the cool roof than those above the asphalt roof. In contrast, during non-noon periods, solar irradiance decreases, and the contribution of reflected shortwave radiation from the roof to the PV modules becomes much weaker. Under this condition, the cool roof shows a relatively low surface temperature due to reduced absorption of solar radiation. Compared with the heating effect from reflected solar radiation, longwave radiation between the PV modules and the cool roof is greater, thus enhancing the heat dissipation from the PV modules and leading to lower module temperature than that observed above the asphalt roof.
3.3. Model Validation and Energy Saving Benefit Evaluation
Based on the PVCR heat transfer processes described in Section 2.2, a numerical model for the PVCR system was developed. To verify the validity of the proposed model, a comparative analysis was conducted between simulated results and experimental measurements. The evaluated parameters include the front and back surface temperatures of the PV module, the roof temperature of the PVCR system, and the roof temperature of the CR system. During the experimental measurement period, the indoor temperature was maintained at around 26 °C in summer and 20 °C in winter under the effect of air conditioning. Based on the input parameters of PVCR in Table 4, the temperature distribution can be simulated. The comparison between simulated and measured values is presented in Figure 8 and Figure 9, while the model evaluation metrics are summarized in Table 5. The results demonstrate that the proposed model is capable of reproducing the temporal variations of the measured parameters and accurately capturing the thermal response characteristics of the PVCR system. Furthermore, the RMSE and R2 values reported in Table 5 provide quantitative evidence of the model’s reliability and applicability.
Table 4.
Parameters in thermal performance simulation of PVCR.
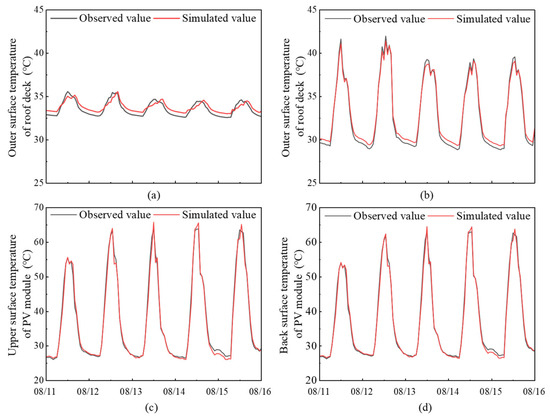
Figure 8.
Temperature comparison between simulated and observed results in summer: (a) Outer surface temperature of roof deck for PVCR; (b) Outer surface temperature of roof deck for CR; (c) Upper surface temperature of PV module; (d) Back surface temperature of PV module.
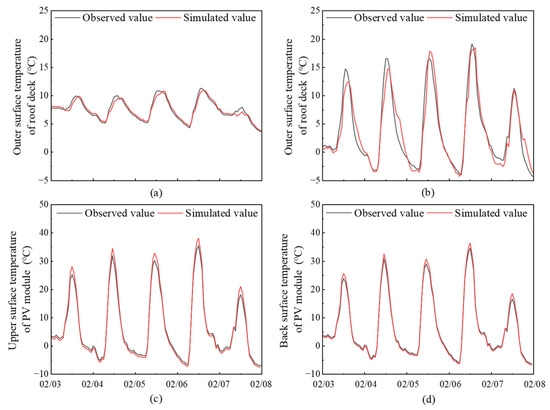
Figure 9.
Temperature comparison between simulated and observed results in winter: (a) Outer surface temperature of roof deck for PVCR; (b) Outer surface temperature of roof deck for CR; (c) Upper surface temperature of PV module; (d) Back surface temperature of PV module.
Table 5.
Evaluation of simulation results for the PVCR model.
In order to assess the thermal and energy performance of PVCR, the above PVCR model was coupled with the building energy simulation platform THERB by the method proposed by He et al. [13]. The building model adopted in this simulation is shown in Figure 10, which is a typical commercial office building. The main thermal properties of the building and related building service data meet the design standard for energy efficiency of public buildings of China (GB50189-2015 [40]), which are presented in Table 6 and Table 7.
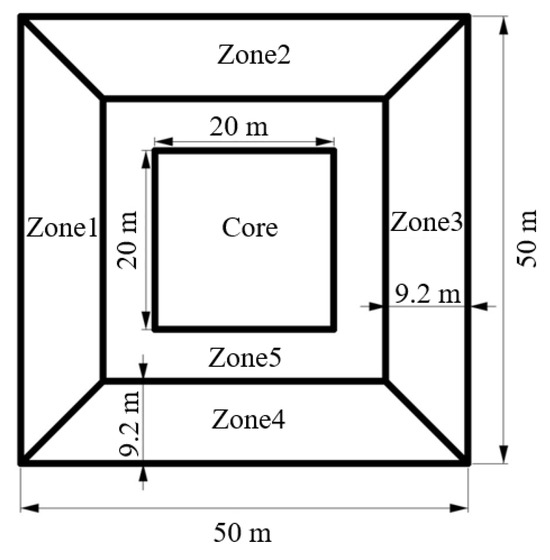
Figure 10.
Plan view of a typical office building.
Table 6.
Thermal properties of building envelope settings.
Table 7.
Thermal properties of building service settings.
Annual simulations were conducted using the validated model, and sensitivity analyses were performed. It can be seen from Figure 11 that, compared to the asphalt roof, the PVR roof saves 1683.97 kWh of electricity annually, while the PVCR roof saves 3005.34 kWh. Additionally, the annual PV production of the PVCR roof is 1244.55 kWh higher than that of the PVR roof. It can be observed that the PVCR system has lower AC demand and higher photovoltaic power output. Therefore, among the four roof systems, the PVCR system represents a solution with superior performance for promoting urban sustainability.
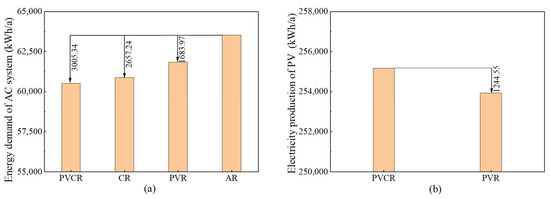
Figure 11.
Comparison of annual energy demand of AC system and electricity production among four types of roofs: (a) Energy demand of AC system; (b) Electricity production of PV.
3.4. Sensitivity Analysis
Furthermore, sensitivity analysis based on simulation reveals the impact of photovoltaic array spacing (Figure 12) and PV installation height (Figure 13) on air conditioning energy consumption, photovoltaic power generation, and total energy savings. As the spacing of the solar photovoltaic array increases from 0.3 m to 0.5 m, the air conditioning energy consumption rises gradually, while the solar power generation and the total energy savings increase steadily. Within the same range, with the increase in installation height, the air conditioning energy consumption decreases, and the solar power generation and total energy savings also show a gradual upward trend. This indicates that both photovoltaic array spacing and installation height have a notable impact on the PVCR system. By optimizing these two parameters, the overall performance and energy saving effectiveness of the system can be significantly improved.
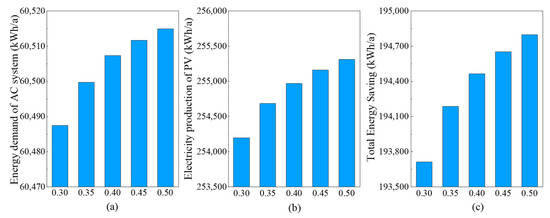
Figure 12.
Effects of PV module array spacing on the relative energy saving performance and electricity production of PVCR: (a) Energy demand of AC system; (b) Electricity production of PV; (c) Total energy saving.
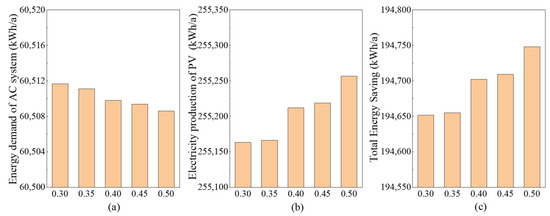
Figure 13.
Effects of PV module height on the relative energy saving performance and electricity production of PVCR: (a) Energy demand of AC system; (b) Electricity production of PV; (c) Total energy saving.
4. Discussion and Limitations
From the temperatures of the photovoltaic modules installed on the cool roof and the asphalt roof, it can be observed that the observed increase in PV module temperature over the cool roof, reaching approximately 2.2–2.5 °C around solar noon in summer, represents a short-term peak effect occurring under high solar irradiance conditions. This transient temperature rise is primarily associated with enhanced reflected shortwave radiation from the high-reflectivity roof and does not persist over extended periods of time. When the thermal performance is evaluated on daily or seasonal time scales, the PVCR system exhibits an overall cooling effect on the photovoltaic modules, as evidenced by lower daily average module temperatures. Therefore, the short-term peak temperature increase around solar noon should be distinguished from long-term averaged thermal behavior.
With the continuous advancement of photovoltaic module technologies, bifacial photovoltaic systems, owing to their distinct power generation advantages, have gradually emerged as a research focus in both industry and academia. To investigate the differences between bifacial and monofacial photovoltaic systems, the developed PVCR numerical model was adopted to evaluate three aspects: building energy consumption, photovoltaic electricity generation, and relative energy saving performance. As shown in Figure 14, the bifacial and monofacial photovoltaic systems exhibit very similar AC energy consumption, with an annual difference of only 139 kWh, indicating that the PV module type has a limited influence on AC demand. In contrast, a significant difference is observed in the annual photovoltaic electricity generation between the two systems, resulting in significantly higher overall energy saving performance for the bifacial photovoltaic system. This can be attributed to the high reflectivity roof, which reflects a considerable portion of incident solar radiation. Bifacial PV modules are able to capture this reflected radiation and convert it into electricity, whereas monofacial photovoltaic systems rely solely on front-side solar irradiation. Moreover, the radiation reflected onto the back of the PV modules accumulates and is converted into heat, which may further hinder their electrical energy conversion efficiency.
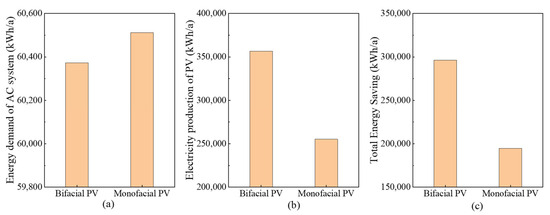
Figure 14.
The relative energy-saving performance and electricity production of the bifacial PV system and the monofacial PV system: (a) Energy demand of the AC system; (b) Electricity production of the PV; (c) Total energy saving.
In addition, sensitivity analyses were performed on the PV module tilt angle and roof reflectance to examine their effects on the energy consumption, photovoltaic electricity generation, and relative energy saving performance of bifacial photovoltaic systems. As illustrated in Figure 15, AC energy consumption increases with increasing PV module tilt angle. This indicates that, as the tilt angle increases, the shaded area on the roof gradually decreases, allowing the roof to absorb more solar radiation and consequently leading to higher cooling energy demand. Meanwhile, the electricity generation of the photovoltaic system decreases as the module tilt angle increases, due to the amount of solar radiation received on the back side of bifacial modules being progressively reduced, thereby limiting additional electricity conversion. As shown in Figure 16, with increasing roof reflectance, indoor AC energy consumption continuously decreases, while photovoltaic electricity generation increases, resulting in a corresponding enhancement in relative energy saving performance. Some scholars have conducted research and found that for every 0.1 increase in roof reflectivity, the output of monofacial photovoltaic systems energy increases by an average of 0.7%, and the output of bifacial photovoltaic systems energy increases by an average of 4.55% [21]. This trend can be attributed to the fact that higher roof reflectance leads to greater amounts of reflected solar radiation incident on the back side of bifacial PV modules, thereby improving both electricity generation and overall energy saving performance. Based on the numerical simulation results, bifacial photovoltaic systems exhibit superior comprehensive energy saving performance compared with monofacial systems. Meanwhile, different roof systems exhibit distinct economic performance. A major challenge lies in the relatively high initial installation cost, as the integration of photovoltaic modules with high-reflectivity surfaces requires specialized materials and installation techniques. A case study conducted in Xiamen showed that only 12% of CR retrofit projects achieved a payback period shorter than 10 years [41]. Although PVR systems demonstrate significantly higher annual energy-saving intensity than CR, CR exhibits clear advantages in terms of economic payback period, energy payback period, and environmental payback period [42]. In contrast, the PVCR combines the benefits of passive cooling and PV power generation, enabling superior cooling-related energy savings while maintaining more stable economic performance compared with conventional PVR and CR systems [43].
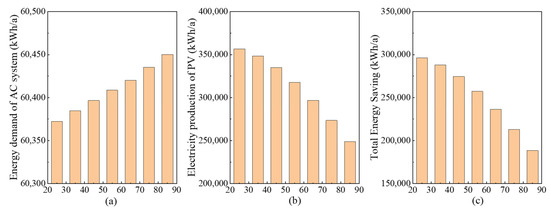
Figure 15.
Effects of PV module tilt angle on the relative energy saving performance and electricity production of a bifacial PV system: (a) Energy demand of the AC system; (b) Electricity production of the PV; (c) Total energy saving.
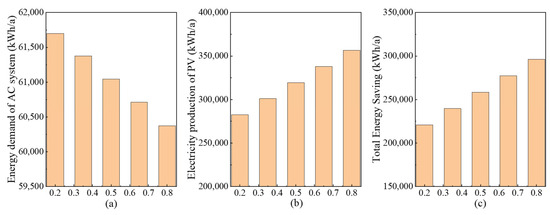
Figure 16.
Effects of roof reflectance on the relative energy saving performance and electricity production of a bifacial PV system: (a) Energy demand of the AC system; (b) Electricity production of the PV; (c) Total energy saving.
This study employed a combined experimental and numerical simulation approach to evaluate the energy-saving performance of PVCR systems. Nevertheless, several limitations should be acknowledged. Firstly, the experimental test was conducted on the rooftop of an office building, representing a low-rise building scenario. High-rise buildings in dense urban environments, as well as commercial and industrial buildings, were not considered. Differences in roof structure, ventilation conditions, and load constraints among these building types may influence the optimal installation parameters and actual performance of PVCR systems. Secondly, the selection of cool roof surface was limited to a single option. The effects of a high-reflectivity surface with different reflection mechanisms on the thermal regulation performance and power generation of PVCR systems have not yet been systematically investigated, and the influence of surface durability on long-term performance was not addressed. Thirdly, the power generation efficiency of PV modules is also affected by surface cleanliness. This factor was not considered in the present study. Further research is therefore required to quantify the influence of a high reflectivity roof surface on rooftop cleanliness, enabling more accurate predictions of photovoltaic electricity generation. Finally, the study was conducted exclusively in Shanghai, focusing on the hot summer and cold winter climate zone, without covering other climatic types. Given the substantial variation in meteorological conditions across different climate zones, the energy-saving performance of PVCR systems may differ fundamentally, limiting the direct applicability of the findings to global climatic contexts. But the proposed PVCR numerical model is not site-specific and can be readily applied to other climatic regions. The governing energy balance equations, radiative exchange formulations, and photon-tracking framework are based on fundamental physical principles and remain valid across different locations. To adapt the model to other regions, only region-dependent inputs and assumptions need to be modified, including local meteorological conditions, roof material properties, and photovoltaic installation parameters. Therefore, the model provides a transferable framework for evaluating PVCR performance under diverse climatic conditions.
5. Conclusions
Taking Shanghai as an example, this study aims to experimentally evaluate the thermal behavior of PVCR systems, develop and validate a coupled heat transfer model that accounts for photothermal interactions, and assess the energy-saving potential and key design parameters of PVCR. The extent to which the proposed research objectives were achieved can be summarized as follows, based on the experimental observations and numerical simulation results. Firstly, field measurements demonstrate that PVCR achieves a pronounced daytime cooling effect while maintaining smaller diurnal temperature fluctuations than the other roof types. The combination of photovoltaic shading and high roof reflectivity effectively suppresses solar heat gains during summer daytime, while the presence of PV modules reduces nocturnal radiative heat loss, resulting in a more stable roof thermal environment. Secondly, field measurements also demonstrate that the average temperature of photovoltaic modules in the PVCR system is lower than that in the PVR system. However, under conditions of high solar radiation intensity, the temperature of PV modules in the PVCR system is slightly higher than that of the PV modules in the PVR system. Thirdly, A numerical model incorporating multiple shortwave reflections, longwave radiative exchange, convective heat transfer, and aerodynamic effects was developed and validated against experimental data. Based on the annual simulation results, the PVCR system reduces the air-conditioning energy consumption by 1321.37 kWh compared with the PVR system, while simultaneously increasing annual photovoltaic electricity generation by 1244.55 kWh. These absolute values provide a clearer indication of the actual energy-saving potential of PVCR systems at the building scale. Finally, Sensitivity analysis reveals that increasing PV array spacing and installation height leads to higher photovoltaic electricity generation and greater total energy savings, although excessively large spacing may increase AC demand. Proper optimization of these parameters can significantly improve the overall energy-saving effectiveness of PVCR systems. Furthermore, bifacial PV modules demonstrate substantially higher energy saving potential than monofacial modules when combined with cool roofs. The simulation results indicate that the electricity generation of the bifacial PV system decreases significantly as the tilt angle of the PV modules increases.
This paper conducts a preliminary exploration of the performance of PVCR in hot summer and cold winter regions. Due to the diversity of factors such as climate, materials, and design, more field experiments should be carried out in the future to expand the performance database and further validate the accuracy of the PVCR model, so that PVCR can be applied and evaluated on a larger scale. Meanwhile, due to the limitations in article length, this study does not provide a systematic analysis of the applicability of the PVCR system across different building types and diverse climatic regions. Future research will build upon and validate the numerical model established in this paper, and further expand to conduct comparative studies on different building functional types and typical climate zones, in order to evaluate the thermal performance and energy-saving potential of PVCR under different climate conditions and building application scenarios, thereby enhancing the universality and engineering reference value of the research conclusions.
Author Contributions
Conceptualization, Q.Y.; Software, Y.H.; Validation, Y.H.; Resources, Y.H.; Data curation, Y.H., C.L., and Y.L.; Writing—original draft, Q.Y., M.D., and W.W.; Writing—review & editing, Q.Y., Y.H., L.Z., S.C., and Y.F.; Visualization, L.Z., M.D., S.C., Y.F. and Z.W.; Supervision, Y.H. All authors have read and agreed to the published version of the manuscript.
Funding
This work was supported by the Fundamental Research Funds for the Central Universities, grant number: 2232024D-22, and the Natural Science Foundation of Shanghai, grant number: 25ZR1402004. The authors would like to take this opportunity to thank the funding bodies for their support, as well as the collaboration of other fellow researchers.
Data Availability Statement
The data presented in this study are available on request from the corresponding author. The data are not publicly available due to confidentiality agreements with project partners.
Conflicts of Interest
The authors declared no potential conflicts of interest with respect to the research, authorship, and/or publication of this article.
Nomenclature
| AC | Air Conditioning | AR | Asphalt Roof |
| COP | Coefficient of Performance | CR | Cool Roof |
| thickness of PV absorber [m] | thickness of PV modules [m] | ||
| ∆h | spatial step of air [m] | turbulent heat transfer to air node at PV height [W/m2] | |
| outdoor convective heat transfer coefficient [W/m2] | indoor convective heat transfer coefficient [W/m2] | ||
| convective heat transfer coefficient of PV modules [W/m2] | HSCW | Hot-Summer and Cold-Winter | |
| heat conductivity of roof deck layer [W/m/K] | Plan Area Index | ||
| heat emission from power generation [W/m2] | PV | Photovoltaic | |
| PVCR | Photovoltaic-Cool Roof | PVR | Photovoltaic Roof |
| net longwave radiation of PV absorber [W/m2] | net longwave radiation of PV back [W/m2] | ||
| net longwave radiation of PV cover [W/m2] | net longwave radiation of roof external surface [W/m2] | ||
| net longwave radiation of roof internal surface [W/m2] | net shortwave radiation of PV absorber [W/m2] | ||
| net shortwave radiation of PV back [W/m2] | net shortwave radiation of PV cover [W/m2] | ||
| net shortwave radiation of roof external surface [W/m2] | net shortwave radiation of roof internal surface [W/m2] | ||
| RMSE | Root Mean Square Error | thermal resistance between PV cover and absorber [K/W] | |
| thermal resistance between PV back and absorber [K/W] | aerodynamic resistance below air node at PV height [s/m] | ||
| aerodynamic resistance above air node at PV height [s/m] | R2 | Coefficient of Determination | |
| SAM | System Advisor Model | SHGC | Solar Heat Gain Coefficient |
| Time [s] | PV absorber surface temperature [°C] | ||
| PV back surface temperature [°C] | temperature of air layer close to PV modules [°C] | ||
| temperature of air node at PV height [°C] | PV cover surface temperature [°C] | ||
| indoor temperature [°C] | temperature of roof deck layer [°C] | ||
| UHI | Urban Heat Island | wind speed of air node closest to PV modules [m/s] |
References
- Pérez-Lombard, L.; Ortiz, J.; Pout, C. A Review on Buildings Energy Consumption Information. Energy Build. 2008, 40, 394–398. [Google Scholar] [CrossRef]
- Allouhi, A.; El Fouih, Y.; Kousksou, T.; Jamil, A.; Zeraouli, Y.; Mourad, Y. Energy Consumption and Efficiency in Buildings: Current Status and Future Trends. J. Clean. Prod. 2015, 109, 118–130. [Google Scholar] [CrossRef]
- Sadineni, S.B.; Madala, S.; Boehm, R.F. Passive Building Energy Savings: A Review of Building Envelope Components. Renew. Sustain. Energy Rev. 2011, 15, 3617–3631. [Google Scholar] [CrossRef]
- Park, J.; Lee, S. Effects of a Cool Roof System on the Mitigation of Building Temperature: Empirical Evidence from a Field Experiment. Sustainability 2022, 14, 4843. [Google Scholar] [CrossRef]
- Zhang, W.; Jiao, D.; Zhao, B.; Pei, G. Experimental and Numerical Investigation of the Effects of Passive Radiative Cooling-Based Cool Roof on Building Energy Consumption. Appl. Energy 2024, 376, 124161. [Google Scholar] [CrossRef]
- Chen, J.; Lu, L.; Gong, Q.; Lau, W.Y.; Cheung, K.H. Techno-Economic and Environmental Performance Assessment of Radia tive Sky Cooling-Based Super-Cool Roof Applications in China. Energy Convers. Manag. 2021, 245, 114621. [Google Scholar] [CrossRef]
- Tzempelikos, A.; Lee, S. Cool Roofs in the US: The Impact of Roof Reflectivity, Insulation and Attachment Method on Annual Energy Cost. Energies 2021, 14, 7656. [Google Scholar] [CrossRef]
- Kapsalis, V.; Karamanis, D. On the Effect of Roof Added Photovoltaics on Building’s Energy Demand. Energy Build. 2015, 108, 195–204. [Google Scholar] [CrossRef]
- Wang, Y.; Wang, D.; Liu, Y. Study on Comprehensive Energy-Saving of Shading and Photovoltaics of Roof Added PV Module. Energy Procedia 2017, 132, 598–603. [Google Scholar] [CrossRef]
- Cubi, E.; Zibin, N.F.; Thompson, S.J.; Bergerson, J. Sustainability of Rooftop Technologies in Cold Climates: Comparative Life Cycle Assessment of White Roofs, Green Roofs, and Photovoltaic Panels. J. Ind. Ecol. 2016, 20, 249–262. [Google Scholar] [CrossRef]
- Piselli, C.; Saffari, M.; De Gracia, A.; Pisello, A.L.; Cotana, F.; Cabeza, L.F. Optimization of Roof Solar Reflectance under Dif ferent Climate Conditions, Occupancy, Building Configuration and Energy Systems. Energy Build. 2017, 151, 81–97. [Google Scholar] [CrossRef]
- Imran, H.M.; Kala, J.; Ng, A.W.M.; Muthukumaran, S. Effectiveness of Green and Cool Roofs in Mitigating Urban Heat Island Effects during a Heatwave Event in the City of Melbourne in Southeast Australia. J. Clean. Prod. 2018, 197, 393–405. [Google Scholar] [CrossRef]
- He, Y.; Yu, H.; Ozaki, A.; Dong, N. Thermal and Energy Performance of Green Roof and Cool Roof: A Comparison Study in Shanghai Area. J. Clean. Prod. 2020, 267, 122205. [Google Scholar] [CrossRef]
- Ben Amara, H.; Bouadila, S.; Fatnassi, H.; Arici, M.; Allah Guizani, A. Climate Assessment of Greenhouse Equipped with South-Oriented PV Roofs: An Experimental and Computational Fluid Dynamics Study. Sustain. Energy Technol. Assess. 2021, 45, 101100. [Google Scholar] [CrossRef]
- Chen, J.; Gong, Q.; Lu, L. Evaluation of Passive Envelope Systems with Radiative Sky Cooling and Thermally Insulated Glazing Materials for Cooling. J. Clean. Prod. 2023, 398, 136607. [Google Scholar] [CrossRef]
- Osma-Pinto, G.; Ordóñez-Plata, G. Measuring Factors Influencing Performance of Rooftop PV Panels in Warm Tropical Climates. Sol. Energy 2019, 185, 112–123. [Google Scholar] [CrossRef]
- Wei, L.J.; Islam, M.M.; Hasanuzzaman, M.; Cuce, E. Energy Consumption, Power Generation and Performance Analysis of Solar Photovoltaic Module Based Building Roof. J. Build. Eng. 2024, 90, 109361. [Google Scholar] [CrossRef]
- Khorat, S.; Das, D.; Khatun, R.; Aziz, S.M.; Anand, P.; Khan, A.; Santamouris, M.; Niyogi, D. Cool Roof Strategies for Urban Thermal Resilience to Extreme Heatwaves in Tropical Cities. Energy Build. 2024, 302, 113751. [Google Scholar] [CrossRef]
- Pan, Z.; Zhang, L.; Dong, L.; Xu, W.; Li, G.; Yuan, Y.; Wang, C.; Yu, B. Exploring the Seasonal Impact of Photovoltaic Roofs on Urban Land Surface Temperature under Different Urban Spatial Forms. Renew. Energy 2025, 244, 122724. [Google Scholar] [CrossRef]
- Zheng, W.; He, H.; Qin, F.; Lan, Y.; Yin, Y. Effect of the Overhead Height and Tilt Angle on Comprehensive Performance of Photovoltaic Roof Based on Simulation and Experimental Methods. Results Eng. 2025, 25, 104292. [Google Scholar] [CrossRef]
- Vasilakopoulou, K.; Ulpiani, G.; Khan, A.; Synnefa, A.; Santamouris, M. Cool Roofs Boost the Energy Production of Photovol taics: Investigating the Impact of Roof Albedo on the Energy Performance of Monofacial and Bifacial Photovoltaic Modules. Sol. Energy 2023, 265, 111948. [Google Scholar] [CrossRef]
- Ma, Z.; Hu, L.; Mao, H.; Shao, Q.; Tian, Z.; Luo, Y.; Deng, J.; Sun, D.; Fan, J. Shading Effect and Energy-Saving Potential of Rooftop Photovoltaic on the Top-Floor Room. Sol. Energy 2023, 265, 112099. [Google Scholar] [CrossRef]
- Ban-Weiss, G.; Wray, C.; Delp, W.; Ly, P.; Akbari, H.; Levinson, R. Electricity Production and Cooling Energy Savings from Installation of a Building-Integrated Photovoltaic Roof on an Office Building. Energy Build. 2013, 56, 210–220. [Google Scholar] [CrossRef]
- Altan, H.; Alshikh, Z.; Belpoliti, V.; Kim, Y.K.; Said, Z.; Al-chaderchi, M. An Experimental Study of the Impact of Cool Roof on Solar PV Electricity Generations on Building Rooftops in Sharjah, UAE. Int. J. Low-Carbon Technol. 2019, 14, 267–276. [Google Scholar] [CrossRef]
- Rahmani, F.; Robinson, M.A.; Barzegaran, M.R. Cool Roof Coating Impact on Roof-Mounted Photovoltaic Solar Modules at Texas Green Power Microgrid. Int. J. Electr. Power Energy Syst. 2021, 130, 106932. [Google Scholar] [CrossRef]
- Alim, M.A.; Tao, Z.; Saeed, N.; Hao, X.; Abden, M.J.; Rahman, A. Effect of Reflective Coating on Thermal and Electrical Per formances of Solar Roof Tiles. Energy Conv. Manag. 2022, 270, 116251. [Google Scholar] [CrossRef]
- He, Y.; Yang, Z.; Fan, Y. Thermal Performance Analysis for Roofs with Heat Mitigation Strategies in Subtropical Hot and Humid Regions. Sci. Rep. 2025, 15, 6117. [Google Scholar] [CrossRef]
- Gong, Q.; Chen, J.; Zhang, Y.; Lu, L. Spectrally Engineered Coatings for Steering the Solar Photons. Adv. Mater. 2025, 37, 2502542. [Google Scholar] [CrossRef]
- Vakilinezhad, R.; Ziaee, N. Assessing the Combined Effect of PV Panels’ Shading and Cool Materials on Building Energy Loads in Different Climates. Environ. Dev. Sustain. 2023, 26, 16201–16221. [Google Scholar] [CrossRef]
- Salamanca, F.; Georgescu, M.; Mahalov, A.; Moustaoui, M.; Martilli, A. Citywide Impacts of Cool Roof and Rooftop Solar Photovoltaic Deployment on Near-Surface Air Temperature and Cooling Energy Demand. Bound.-Layer Meteor. 2016, 161, 203–221. [Google Scholar] [CrossRef]
- Cavadini, G.B.; Cook, L.M. Green and Cool Roof Choices Integrated into Rooftop Solar Energy Modelling. Appl. Energy 2021, 296, 117082. [Google Scholar] [CrossRef]
- Ghenai, C.; Ahmad, F.F.; Rejeb, O.; Bettayeb, M. Artificial Neural Networks for Power Output Forecasting from Bifacial Solar PV System with Enhanced Building Roof Surface Albedo. J. Build. Eng. 2022, 56, 104799. [Google Scholar] [CrossRef]
- Motet, L.; Song, J.; Short, C.A.; Chen, S.; Wu, J.; Yu, W.; Xiong, J.; Zhang, Q.; Ge, J.; Liu, M.; et al. The Hot Summer-Cold Winter Region in China: Challenges in the Low Carbon Adaptation of Residential Slab Buildings to Enhance Comfort. Energy Build. 2020, 223, 110181. [Google Scholar] [CrossRef]
- Dong, S.; Xu, T.; Chen, M. Solar Radiation Characteristics in Shanghai. J. Phys. Conf. Ser. 2022, 2351, 012016. [Google Scholar] [CrossRef]
- Gu, Z.; Feng, J.; Han, W.; Li, L.; Wu, M.; Fu, J.; Sheng, G. Diurnal Variations of Polycyclic Aromatic Hydrocarbons Associated with PM2.5 in Shanghai, China. J. Environ. Sci. 2010, 22, 389–396. [Google Scholar] [CrossRef]
- Huang, X.; Li, J.; Xu, H.; Liao, B.; Gu, H.; Chen, Y.; Ji, C.; Zhang, B.; Du, S. The Changing Social Vulnerability in Shanghai during 2000–2020 and Its Implications for Risk Management. Int. J. Disaster Risk Reduct. 2024, 113, 104852. [Google Scholar] [CrossRef]
- Tan, C.; Li, S.; Li, Y.; Peng, Z. Dynamic Modeling and Data Fitting of Climatic and Environmental Factors and People’s Behav ior Factors on Hand, Foot, and Mouth Disease (HFMD) in Shanghai, China. Heliyon 2023, 9, e18212. [Google Scholar] [CrossRef]
- He, Y.; Tan, C.L.; Liu, J.; Dai, M.; Cui, H.; Chen, S.; Lu, J.; Li, Z.; Li, C. An Experimental and Modeling Study of Thermal Behavior of Photovoltaic-Greenery System. Sustain. Cities Soc. 2025, 126, 106373. [Google Scholar] [CrossRef]
- He, Y.; Yu, H.; Ozaki, A.; Dong, N.; Zheng, S. Long-Term Thermal Performance Evaluation of Green Roof System Based on Two New Indexes: A Case Study in Shanghai Area. Build. Environ. 2017, 120, 13–28. [Google Scholar] [CrossRef]
- Xu, W.; Zou, Y.; Chen, X.; Sun, D. National Standard “Design Standard for Energy Efficiency in Public Buildings” GB50189-2015. Constr. Sci. Technol. 2018, 16, 39–45. [Google Scholar]
- Song, C.; Chen, Y. Energy-Saving Potential of Cool Roofs at the Urban Scale: A Case Study of Xiamen City. Energy Build. 2025, 344, 116034. [Google Scholar] [CrossRef]
- Zhao, S.; Zhang, X.; Jin, X. Comparative Evaluation of Cool Roofs and Photovoltaic Roofs in Sustainable Buildings Within the Scope of the 3-E Static Payback Period Framework. Buildings 2025, 15, 3500. [Google Scholar] [CrossRef]
- Maurer, B.; Lienert, J.; Cook, L.M. Comparing PV-Green and PV-Cool Roofs to Diverse Rooftop Options Using Decision Analysis. Build. Environ. 2023, 245, 110922. [Google Scholar] [CrossRef]


Disclaimer/Publisher’s Note: The statements, opinions and data contained in all publications are solely those of the individual author(s) and contributor(s) and not of MDPI and/or the editor(s). MDPI and/or the editor(s) disclaim responsibility for any injury to people or property resulting from any ideas, methods, instructions or products referred to in the content. |
© 2026 by the authors. Licensee MDPI, Basel, Switzerland. This article is an open access article distributed under the terms and conditions of the Creative Commons Attribution (CC BY) license.