Abstract
The built environment is a major contributor to global greenhouse gas emissions and urgently requires decarbonization. Despite the decline in operational carbon emissions, which continue to fall as energy-efficient buildings rise, embodied carbon (EC) emissions from material extraction, production, and construction have become increasingly prominent, accounting for an increasing share of total building emissions. Establishing a benchmark value for buildings is essential for assessing, comparing, and mitigating emissions in new construction because it helps set goals, evaluate performance and resource efficiency, promote sustainable building practices, and lay the groundwork for decarbonizing the urban built environment. Globally, building carbon benchmarks are developed using life cycle assessment and statistical methods, whereas whole-life carbon assessment frameworks are increasingly adopted with regulatory integration. However, broader applicability remains constrained by methodological inconsistencies. This research reviews existing benchmarking studies and identifies discrepancies via semi-systematic and critical analyses. The results reveal that 81% of benchmark studies apply bottom-up approaches, and nearly 88% focus on residential buildings. The range of benchmark values for residential buildings using the bottom-up approach varies from 1.3 to 63.9 kg CO2e/m2/year, whereas the top-down approach ranges from 1.2 to 27 kg CO2e/m2/year. The overall range is 1.2 to 92.5 kg CO2e/m2/year, reflecting substantial variation due to variable scopes, typologies, modeling approaches, and data sources. This research highlights the urgent need for standardized benchmarking methods to ensure comparability across studies, enable effective policy implementation, and support decarbonization. Additionally, this study proposes a framework for establishing EC benchmarks and strategies that promote low-carbon, resource-efficient urban development.
1. Introduction and Background
Currently, climate change is widely recognized as one of the most significant threats to the planet. Since the 1800s, anthropogenic activities have been responsible for increasing greenhouse gas (GHG) emissions, thereby intensifying global temperature [1,2]. In 2022, the construction and building sectors were responsible for nearly 37% of global CO2 emissions, accounting for 34% of energy demand [1,3,4]. The built environment contributes to over one-third of global energy-related carbon emissions [5,6]. An IPCC AR6 report (2023) [7] indicates that buildings are a critical domain of action because they have a significant potential to reduce GHG emissions [8]. At the same time, the built environment is increasingly impacted by the effects of climate change [9,10,11].
The global status report for building and construction [1] projects that consumption of building materials will nearly double by 2060, leading to a steep increase in emissions. A substantial potential for reducing GHG emissions exists by implementing material efficiency strategies, such as intensive use, lifetime extension, reuse, recycling, and related approaches [12]. For example, using recycled materials could reduce the GHGs of residential buildings up to 80% within G7 countries [1]. Pathways to achieve this net-zero goal require a comparison ‘reference’ or benchmark value (used interchangeably) to improve efficiency. Related terminology in the literature includes limit values, targets, or baselines. This need for a reference framework underscores the importance of developing benchmarks to enable comparisons and to assess and improve the global warming potential (GWP) performance of buildings [13].
1.1. Building Emissions
In a building project, GHG emissions occur throughout the entire life cycle, primarily during the product and construction stages (A), use stage (B), and end-of-life stage (C). The total emissions generated across these stages constitute the whole-life carbon (WLC) of the building, which is quantified using a whole-building life-cycle assessment (WBLCA), as schematically illustrated in Figure 1 [1,5,14].
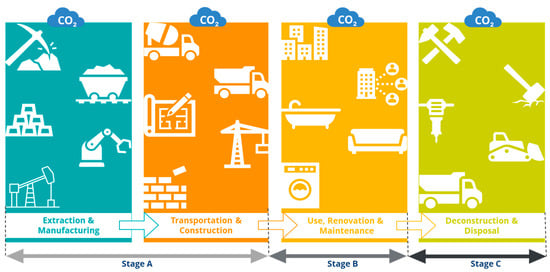
Figure 1.
Emissions produced due to a building project over its lifetime.
Operational carbon (OC) emissions are defined as GHG emissions generated from the day-to-day energy use of buildings, primarily heating, electricity, cooling, and other energy needs over the building’s lifetime. Many studies have focused on improving and optimizing the energy efficiency of buildings to reduce the operational energy demand in pursuit of sustainable buildings [15].
Embodied carbon (EC) emissions are generated from construction and material processes throughout the entire life cycle of buildings and include emissions from raw material extraction, transport, manufacture, construction, maintenance, and disposal of building materials [16,17]. The importance of EC emissions is reflected by the fact that, of the total emissions from the built environment, 10% are EC [14]. Emissions can be divided further into “upfront,” “in-use,” and “end-of-life” EC emissions. The upfront EC emissions (A1–A5) are associated with material production and construction phases occurring prior to building occupancy (Figure 2). Compared with other types, upfront emissions are particularly significant, as they are released into the environment before the building becomes operational [18]. The in-use EC emissions (B1–B5) relate to emissions from the materials and processes required for building maintenance. End-of-life EC emissions (C1–C4) refer to those produced from the demolition, transportation of building scrap, waste processing, and disposal [5,16,19,20].
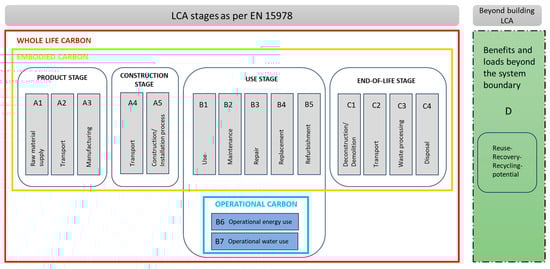
Figure 2.
Life-cycle carbon assessment of a building from EN 15978:2011 [21].
Figure 2 was adapted from the EN 15978:2011 [21] framework and depicts the life-cycle phases of a building, identifying the WLC, EC, and OC emissions. In Figure 2, Module D reports benefits and burdens beyond the system boundary (after the end-of-waste state), including the net impacts from material recycling, reuse, energy recovery (e.g., secondary fuels), and avoided energy production from waste incineration [22].
1.2. Importance of Setting the Emission Benchmark
A critical step in enabling the transition toward a sustainable built environment is the definition of appropriate environmental reference values. In addition, ISO 21678:2020 [23] identifies several key roles of benchmarks in the building sector, emphasizing their use in setting design-stage targets, guiding public procurement, supporting architectural competitions, and informing decision making throughout the building life cycle. Similarly, the Product Environmental Footprint (PEF) framework defines a benchmark as a reference point or standard used for comparison, whether in terms of energy consumption, material usage, or associated environmental impacts. Taken together, ISO 21678 and the PEF framework underscore the pivotal role of benchmarks in transitioning to a sustainable built environment [24,25].
Accordingly, the primary application of benchmarks is to serve as a transparent and consistent reference for assessing and evaluating the energy and environmental performance of buildings. This reference relies on the collection and availability of accurate, verifiable data, as availability can restrain the accuracy of results [13]. This benchmark is typically expressed via statistical indicators (e.g., median, mean, mode, or percentile values) in accordance with the International Energy Agency (IEA) Annex 72 project [26]. This benchmark represents typical building carbon emissions, calculated by combining data from multiple buildings and summarizing data with statistical measures, as depicted in Figure 3 [6,27,28].
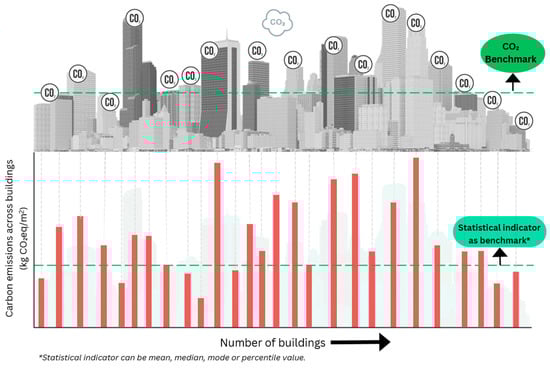
Figure 3.
Benchmark values established by aggregating carbon emissions from multiple buildings and applying a statistical indicator.
Most scientific communities have historically focused on optimizing operational energy use in buildings to reduce emissions associated with energy use or OC emissions. However, EC emissions have increasingly gained attention due to their critical contribution to overall building emissions, a trend that has become more evident in recent years [5,8,15]. In the framework of the European Directive on the Energy Performance of Buildings (EPB), well-established benchmarks for energy use in buildings have been proposed in the building sectors of EU member states [29]. Building energy benchmarking involves comparing the energy use in buildings with that of a best-practice or reference building [25,30,31], and its implementation has demonstrably contributed to reductions in operational energy use and emissions [13]. Efforts to create this benchmarking are provided by rating systems, including LEED [32], BREEAM [33], Green Star in Australia, the American Society of Heating, Refrigerating, and Air-Conditioning Engineers (ASHRAE) [34] standard, MOSTADAM [35] (green building rating system developed in Saudi Arabia), and others, which enable the comparison and evaluation of a building’s overall performance based on credit-based assessment frameworks [13,36,37]. Furthermore, substantial efforts have been made to incorporate EC emissions into these rating systems [38].
The use of life-cycle assessment (LCA) and building rating systems can enable a more comprehensive evaluation of environmental impacts [39]. In contrast, the establishment of LCA-based benchmarks remains at an early stage of development [40]. The EC emissions must be assessed because they are expected to be predominant in an energy-efficient building, as well as due to the reason of decarbonization in the electricity grid and efficient energy operations. The World Green Building Council [20] has projected that EC emissions will account for approximately 50% of the total carbon emissions associated with upcoming new construction until 2050. Thus, the need for a proper calculation of and reduction in EC emissions is of critical importance. Recent studies have focused on estimating EC emissions and establishing benchmarks to support the development of roadmaps to reduce the WLC of buildings [28,41]. Many studies from Finland, Sweden, Denmark, North America, Spain, and the EU have initiated carbon baselining efforts for buildings using the LCA method [28,42].
1.3. Objectives and Scope
This study aims to analyze carbon benchmarks established for buildings, covering EC and OC emissions. The existing literature presents a range of global benchmarks for the building sector, such as the IEA Annex 72 project [26,43], as well as analyzing 17 case studies from the IEA Annex 72 project [44]. These focus on the development and application of global reference values and methodological guidance for carbon assessment across multiple building typologies. A previous review by Trigaux et al. [25] compiled studies on carbon benchmarks by compiling 23 benchmarks. While valuable, their review predates a substantial body of recent literature and does not capture the rapid expansion of benchmarking efforts following the introduction of national WLC regulations and disclosure requirements in Europe and elsewhere. Additionally, Tigani et al. [45] focused on reducing EC emissions across buildings and explored the potential of carbon benchmarking to reduce EC emissions; however, their focus was primarily on mitigation potential and design strategies, with limited critical assessment of how benchmarks are actually constructed, including differences in system boundaries, life-cycle coverage, metrics, and underlying data sources.
Against this background, the objective of this study is to provide an updated and systematic evaluation of carbon benchmarks developed for buildings, focusing specifically on climate change impacts. This work analyzes more than 42 benchmark studies, substantially expanding the evidence base compared with earlier reviews. This study critically examines differences in benchmark definitions, system boundaries, life-cycle stages, functional units, and data availability across building typologies and regions. This work clarifies the current challenges and gaps and proposes future directions for enhancing benchmarking. Moreover, this study analyzes only those articles that focus on carbon benchmarks (climate change impact), without addressing other environmental categories such as acidification, eutrophication, etc. This research does not critically analyze the inclusion of building elements (e.g., primary or secondary structural finishes, floors, walls, doors, frames, etc.) or superstructure and substructure components because it aims to provide a high-level overview of existing benchmarking systems for the GWP of buildings. The study scope is to present and discuss benchmarks and their methods, rather than to conduct an in-depth examination of specific construction components.
This study makes several contributions to the field of carbon benchmarking. It provides an extensive analysis, extending the work by Trigaux et al. [25]. Beyond synthesizing recent benchmark values, this study contributes by (i) providing a critical and updated comparison of how carbon benchmarks are defined and applied across the literature, (ii) proposing a structured benchmarking framework with EC reduction pathways, and (iii) situating benchmarking practices within an evolving policy and stakeholder context. This study examines the challenges and practical aspects of implementing benchmarks in regulatory frameworks, offering insight into their broader context. This work references a recent Building Performance Institute Europe (BPIE) report [42] from Europe, providing policymakers with valuable guidance on enacting legislation to reduce WLC emissions in buildings and emphasizing the importance of establishing and advancing benchmarking efforts.
This paper is organized as follows. Section 1 provides an overview of building emissions and the need to establish benchmarks. Next, Section 2 outlines the method employed in this critical review, and Section 3 discusses approaches used for estimating EC and benchmarks. Then, Section 4 details the process of establishing benchmark systems, considering multiple aspects and methods, and Section 5 presents the results. Next, Section 6 analyzes and discusses these studies, highlighting their limitations and suggesting areas for future improvement. Finally, Section 7 concludes this study.
2. Method
This study employs a semi-systematic review approach to offer a high-level overview and focused insights into the field of carbon benchmarking of buildings. The comprehensive scope of this review focuses on understanding how carbon benchmarks have been developed, while aiming to synthesize and contextualize findings from existing studies to offer a broad overview of this field. This narrative review highlights the current approaches, gaps, and challenges in this field. The wide range of relevant studies includes articles and references from renowned academic databases, including Scopus (given its broader journal coverage) and a supplementary search conducted using Google Scholar. Boolean operators (AND and OR) were employed to narrow the search and pinpoint pertinent publications. This work also includes technical reports from experts, academia, and organizations. The search was conducted using the keywords in the query table. Thorough manual searches were conducted on Google Scholar, along with a snowball approach. Keywords identified through snowballing were systematically re-evaluated to capture any recent publications that could further contribute to this study. The final selection of publications for analysis was based on their relevance and contribution to the research objectives, encompassing a diverse range of sources, including journals, abstracts, conference papers, reports, and key references identified during the literature review, which were retrieved from the data sources.
The research scope and questions, inclusion and exclusion criteria, and databases were defined during the planning phase. The inclusion criteria for selecting articles were based on their relevance to the critical analysis of carbon benchmarks in the building sector and included only articles (i) based on carbon emission benchmarking specific to buildings and (ii) including a value for the carbon benchmark. Studies focusing solely on OC emissions or energy benchmarks were excluded; only those including EC emissions, either alone or alongside OC emissions, were considered. The filter criteria applied to the Scopus database were articles in (1) the English language, (2) document types that were limited to full-text articles or journal papers, and (3) the time frame that was limited to those published between 2000 and 2024 to ensure up-to-date research findings.
Following the initial search, the retrieved articles were screened based on their titles, abstracts, and keywords to assess their relevance to the research objectives. Studies that did not directly address carbon benchmarks for building construction (e.g., those focused on other sectors, materials, or that only mentioned benchmarks without providing values) were excluded from this review. Of the 304 studies, 190 were excluded. Applying the inclusion criteria reduced the count to 114. After further exclusion, 42 remained, which underwent a thorough review and content analysis to identify key themes, methods, applications, limitations, and gaps related to carbon benchmarks in the building sector. Special attention was given to articles that provided critical insight, innovative approaches, and empirical data to contribute significantly to the understanding of carbon benchmarking practices.
Table 1 summarizes the queries for searching for documents in Scopus, which served as the primary database. Figure 4 provides the review protocol of this study, while the word cloud in Figure 5 was generated exclusively from the titles of the reviewed articles. Titles were selected as they concisely reflect the primary focus of each study and reduce noise introduced by methodological or contextual details typically present in abstracts and full texts.

Table 1.
Search queries and results from the Scopus database.
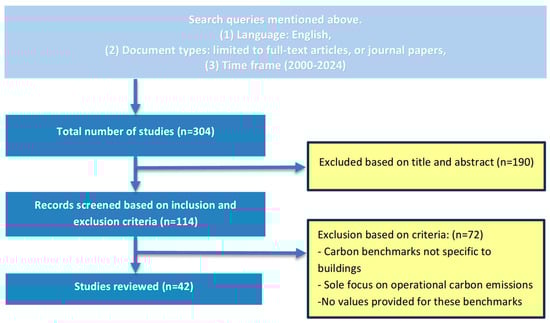
Figure 4.
Review protocol of this study.
Figure 5.
Word cloud generated from the titles of the reviewed articles, illustrating the frequently occurring terms.
3. Approach to Embodied Carbon Calculations
The critical importance of EC emissions has led to its quantification across the WLC of buildings using a widely adopted tool for environmental impact assessment: the LCA prescribed by ISO 14040:2006 [46] standards [20,47,48]. The outcomes of the LCA are essential for supporting decarbonization strategies. Moreover, international standards, including ISO 21930:2017 [49], and European standards, including EN 15804+A2: 2019 [50] and EN 15978:2011 [21], have also recommended the use of LCA. The LCA tool has been employed to evaluate the environmental effects of buildings throughout their life cycles, as recognized by the European Commission [25]. It accounts for the direct and indirect environmental effects associated with the production, transportation, use, and end-of-life phases of a material (or product), process, or service throughout its entire lifetime, commonly referred to as “cradle-to-grave” [38,51]. The LCA has also evolved to incorporate temporal dimensions through prospective LCA, assessing the potential future environmental impact of emerging technology as it is scaled [52]. This tool can provide a broader overview of environmental effects across diverse categories, including climate change, acidification, resource use, human toxicity, and more. To conduct an LCA study, three approaches can be employed: process LCA, input–output LCA (IO-LCA), and hybrid LCA. Existing studies have employed these methods to quantify EC emissions of buildings [53].
3.1. Top-Down Approach (Input–Output LCA)
The economy-wide IO-LCA applies a top-down approach that employs sector-wise financial data in a national economy as inputs for calculations of EC emissions, where the sectors include manufacturing, energy, construction, services, and others, depending on the national IO dataset [54]. This approach estimates direct emissions associated with sectoral operations (e.g., energy use and process emissions), followed by indirect emissions originating from upstream sectors through trade via the purchase of goods and services. The emission intensity is expressed as kilograms of carbon dioxide equivalent (kg CO2e) per national currency (€, ¥, $, etc.) and is obtained by the division of emissions by the “monetary value shared by that sector in the national economy” [4].
A top-down benchmark aims to translate global climate objectives into quantifiable targets at the regional or local levels [55,56]. This technique can estimate building life-cycle carbon emissions at an aggregated (macro) scale using data from national and regional building inventories by estimating the annual material flows, inputs, stocks, and outputs through statistical or estimated model-based data.
The Paris Agreement (2015) and the 2000-Watt Society are typical examples of this approach, where the targets are defined at an aggregated level, including for buildings [6]. Consequently, this approach is particularly relevant for national-level LCA studies, where the objective is to determine the overall emissions of an activity or sector without detailed breakdowns or further disaggregation [4,54]. Some research associated with this approach for building EC calculation includes research by Zhu et al. [57], who employed statistical data to calculate the EC emissions for the building sector and to project future scenarios. Another study employed national floor area statistics to evaluate the materials and stocks, which were used to estimate EC emissions at a national scale in China [58]. Other studies, such as those by Fishman et al. [59] and Tanikawa et al. [60], have presented relevant implementations of the top-down approach [61]. Nevertheless, these studies generally do not rely on detailed information at the individual building level due to limitations associated with coarse sectoral resolution and the aggregation of multiple industries, which makes it difficult to accurately isolate building-related activities. In addition, assumptions related to imports, price inhomogeneity, and sensitivity to sectoral investment patterns further limit precision [4]. The ranges across environmental indicators may be underestimated or overestimated by −51% to 96% using this approach [62,63].
3.2. Bottom-Up Approach (Process LCA)
Process-based LCA is a widely used approach implemented by most studies. This approach breaks down the life cycle of a product (or system) into unit or individual processes, such as raw material extraction, manufacturing, transportation, and other relevant activities. These unit processes are analyzed for their environmental impact by translating the inputs into outputs using emission factors. Process LCA aggregates the impacts of these unit processes along complex production chains to derive the overall environmental effect [4,54]. The effectiveness of this method lies in its potential to specify and detail production processes and supply chains. Given its advantage of detail, this method is regarded as more accurate for tracking processes, materials, and energy flows associated with the entire life cycle of a product, including its production, supply chain, use, and end-of-life stages [38,53].
Several studies have employed LCI data for individual buildings to quantify their EC emissions. According to a GBCA report [4], process LCA has been employed as a primary approach for estimating EC emissions in the Australian building sector, alongside other methodologies. The integration of LCA and building information modeling (BIM) to evaluate the emissions of typical residential buildings has been conducted in various studies [64,65,66]. A study in China [67] was also based on a process-based LCA model for China’s building construction sector to estimate carbon emissions. Nevertheless, extending this approach to a larger region, such as a city, can be challenging due to the high number of buildings.
A process-based approach is typically considered more detailed compared with an IO analysis, but it is more demanding in terms of manual exercise and time. Nonetheless, this method is susceptible to systematic truncation errors arising from the finite boundaries of the product system, which may omit contributions beyond these limits. As per Ward et al. [62], earlier values indicate that between 2% and 77% of the entire environmental effects may be disregarded by the truncation error, varying based on the sector and environmental indicator considered [54].
3.3. Hybrid Approach
The hybrid LCA combines the process LCA and IO-LCA techniques to address the limitations of each while leveraging their respective strengths. By combining a detailed process-based analysis with comprehensive IO data, the hybrid LCA minimizes the truncation error and enhances the accuracy of sector-specific emission allocation [4,68]. However, this approach requires a trade-off between increased complexity and greater time requirements. Although the approach by Yang [69] was questioned by others [70,71], it has proven to be more accurate and complete, with realistic data availability. As per Dixit [72], the hybrid approach offers the most holistic quantification of embodied flows.
Remote-sensing approaches utilize satellite or aerial data to estimate material stocks, often using indicators (e.g., nighttime light intensity) to represent human activity and related socioeconomic factors. This approach was applied to investigate carbon emissions associated with building material production and spatial distributions in Beijing, China, using a material flow analysis, GIS software (ArcGIS 10.2), and extensive data mining [73]. It was also used in building districts in the UK, using a spatiotemporal model and computer modeling [74]. Soonsawad et al. [61] also applied this approach in Canberra, Australia. In a recent study in China [53], the EC emissions of buildings were investigated using nighttime light data and data on building material intensity. Langston et al. [75] applied a hybrid LCA approach to assess EC emissions in buildings, integrating process-based and IO data. A hybrid LCA is commonly considered the best approach for LCA; however, cautious interpretation remains paramount in all LCA studies, recognizing the advantages and disadvantages of all methods [54,63,76].
4. Establishing a Benchmark
This section introduces the criteria for establishing benchmark values, presenting the standards, approaches, reviews, and reports that provide guidance, rules, and recommendations. ISO 21678:2020 [23] explains how benchmarks can fulfill the functions (Section 1) and focuses on criteria for benchmarks in buildings and construction work, in addition to VTT’s final report [77].
Lützkendorf et al. [78] distinguished between different types of benchmark values, including limit, reference, best practice, and target values. The limit value is the minimum satisfactory acceptable performance level, typically denoting the lowest acceptable level on an assessment continuum. Reference values are typically based on local statistical data, surveys, theoretical assessments, or demonstration projects. This value represents the current business-as-usual value, typically an average or median value. Best-practice values have been determined via experimental or demonstration projects, demonstrating exemplary performance in specific contexts. Finally, the target value represents a performance level exceeding the reference value, indicating the maximum theoretically attainable level [26,79].
These benchmark values are employed to compare performance levels [43], as explained in the IEA EBC program, project “Annex 72: Assessing Life Cycle Related Environmental Impacts Caused by Buildings,” which aims to reduce the environmental effects associated with buildings as well as “Benchmarking and target-setting for the life-cycle based environmental performance of buildings” [26,43]. One of the objectives is to develop specific environmental benchmarks for energy, GHGs, and other impacts. This project was an expansion of the two previous Annexes, 56 and 57. Currently, Annex 72 [26] has finished, and Annex 89, “Ways to Implement Net-zero WLC Buildings” [79], is in progress. One of its primary objectives is to formulate guidance and suggestions to set WLC targets, while outlining strategies and actions for carbon reduction [79]. The EBC Annex 72 project calls the last two values (best-practice and target value) Targets I and II, based on performance level.
Several methods have employed the top-down, bottom-up, or hybrid approach using linear interpolation, statistical analyses, or reference building modeling [80]. A technical report by the EU Joint Research Centre [81] addressed several benchmarks, methods, and systems based on LCA indicators, outlining a framework for establishing life-cycle performance benchmarks for buildings and offering an initial set of benchmark values for residential buildings across Europe. The graduated approach in the report defines the objectives and scope of benchmarking, followed by data collection, quantification, and preliminary benchmark establishment. Then, this approach progresses to identifying areas for improvement and reviewing the developed benchmarks and targets before iterating the process from the initial step [4,81].
In contrast, VTT’s report [77] explains the development criteria of the benchmarking process along with the data sources, in addition to providing recommendations for sustainability indicators on buildings. Benchmark development involves defining the benchmark type, selecting suitable data sources, and specifying the functional equivalent. Indicators must employ consistent reference units with proper normalization and aggregation for comparability. The recommendations for the indicators are given for six phases and corresponding subphases of the building process from customer briefing to use [77].
This work has further progressed to a third step based on a report by VITO [82], applying the PEF method for environmental assessment of buildings and constructions. Moreover, this section presents the latest guidelines and recommendations by Annex 72 [26] in accordance with ISO 21678:2022 [23]. Recently, Trigaux et al. [25] presented and analyzed existing environmental benchmarking systems for buildings. They revisited the most commonly employed benchmark systems from standards, labeling schemes, sustainability rating tools, and academic investigations, drawing primarily from older reviews [77,80,81,82] and consultations with field experts from IEA EBC Annex 72 [26,43,83]. This comprehensive analysis of existing benchmarking systems by Trigaux et al. [25] was based on the analytical framework, grounded in methodological reports and literature reviews on LCA benchmarks. The analysis categorized evaluation aspects into six primary domains, each encompassing several sub-aspects. As illustrated in Figure 6, this structured framework enables systematic comparative analysis to assess the effectiveness of benchmarking approaches and methods. Another study provided an overview of 17 benchmarking systems documented in IEA EBC Annex 72, covering a few aspects while discussing the core methodological choices for generating benchmarks [44].
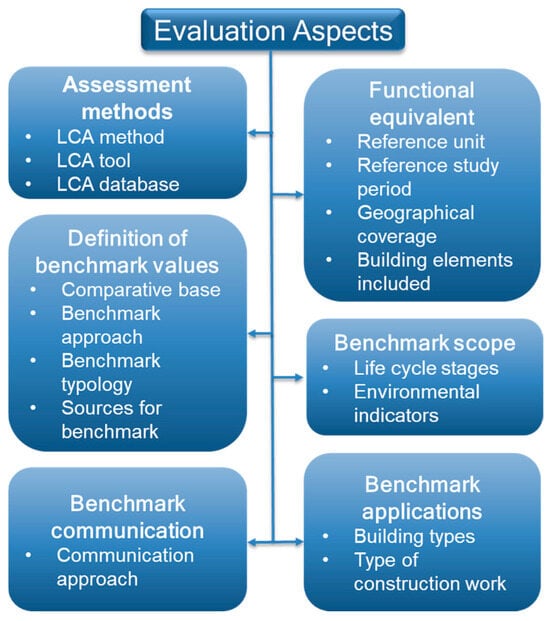
Figure 6.
Evaluation aspects and sub-aspects for analyzing methods and approaches for benchmarking, adapted from Trigaux et al. [25].
The latest ISO 21678:2020 [23] standard provides comprehensive principles, requirements, and guidelines for developing benchmarks in buildings and civil engineering work, ensuring transparency, comparability, and reliability across environmental, social, and economic indicators. Annex 72 [26] expands on this framework by offering practical methodologies for life-cycle-based benchmarks, including non-renewable energy use, GHG emissions, and other environmental impacts. This annex specifies system boundaries, definitions, documentation, and interpretation, supporting science-based, climate-aligned, and actionable benchmarks for policy, design, and industry practice. Annex 72 [26] provides a set of rules and recommendations for a benchmark developer, as listed in Table 2.
Table 2.
Guidance for benchmark development [26].
5. Results
National benchmarks are standardized reference points or metrics used to measure and compare the performance, efficiency, or quality of activities, processes, or sectors within a country, providing a country-specific reference for evaluating how entities perform relative to national standards. These benchmarks help identify best practices, set reduction goals, and monitor progress toward national and international climate commitments, as well as facilitate policy implementation aimed at reducing GHG emissions from buildings [84].
Some countries have developed national carbon benchmarks for the building sector using either primary data collected in the country or global generic databases, depending on the degree of determination in achieving national targets. Primary data encompass the original, site-specific information directly collected from a process, facility, or project under study. These data reflect actual measurements, records, or surveys from manufacturers, construction sites, or organizations, rather than generic databases (e.g., Ecoinvent or Ökobaudat). Examples include industry-specific data, national building stock information, manufacturer-specific EPDs, and national inventories.
This work also examines a few other studies that cover a broader region or are applicable globally. The choice of assessment methods varies: some countries adopt regionally developed methods, while others use standardized methods. The presence of national databases improves primary data collection, leading to more precise outcomes that accurately represent the real situation. Furthermore, the scope boundaries are determined by data availability, leading to inconsistencies even within the same country. While a limited number of studies provide disaggregated results for individual life-cycle phases, a substantial portion report only aggregated values or include partial scopes without quantifying contributions by phase. Direct comparison of studies with heterogeneous system boundaries (e.g., A1–A3 only versus full A–C) can be misleading and may compromise the reliability of benchmark interpretations. In this regard, an indicator is proposed, called the scope completeness index, which evaluates the inclusion of standardized life-cycle stages defined under EN 15978, ranging from A1 (raw material supply) to C4 (final disposal). Each stage is assigned equal weight and scored in a binary manner (1 if included and 0 if not) regardless of its relative contribution to the total EC. The scope completion index is a normalized indicator that quantifies the relative completeness of life-cycle stage coverage in an LCA study by assigning equal binary scores to the inclusion or exclusion of standardized system boundary modules. The mathematical formulation of the scope completion index is derived from the modular life-cycle structure defined in EN 15978 and from binary inclusion approaches commonly adopted in comparative LCA review studies. The index does not aim to represent the relative contribution of life-cycle stages to total emissions but serves as a transparent indicator of system boundary completeness. The SCI has been included for each reviewed study in Table 3.
Table 3.
Summary and report of sub-aspects by study, presenting variability in the range and study period of benchmark values.
Scope Completion Index (SCI)
where
- if life-cycle stage (e.g., A1–A3, A4–A5, B1–B7, or C1–C4) is included in the study;
- if life-cycle stage is not included;
- is the total number of predefined life-cycle stages considered (from A1 to C4).
This paper discusses most carbon benchmarks established globally, which are critically reviewed, analyzed, and summarized in Table 3 and Table 4. In Table 3, the sub-aspects that are highlighted and analyzed include the methods employed and tools like regional LCA tools (LCAbyg, Totem, ELODIE, etc.) or commonly used tools (SimaPro, GaBi, and One Click LCA), in addition to basic calculation/statistics software. Various databases have been employed in these studies, ranging from commonly used databases (e.g., Ecoinvent, GaBi, Inventory of Carbon and Energy (ICE), ÖKOBAUDAT, and co2data) to developed national databases or available statistical data across countries, serving as primary data.
Table 4.
Definition of benchmark values and building applications.
The carbon benchmark values are normalized either for floor area or year (depending on the study) and are expressed in kg CO2e/m2/year, where the floor area could be defined as the net floor area (NFA), usable area, heated floor area, GFA, or normalized GFA. Table 3 provides detailed range to facilitate the interpretation of variability and methodological differences.
As seen from Table 3, the carbon benchmark values range from 1.3 kg CO2e/m2/year [119] to 83.3 kg CO2e/m2/year [102], for a residential and office building, respectively. This variation reflects differences in building typology, data sources, and scope. Considering residential alone, the benchmark values range from 1.3 to 63.9 kg CO2e/m2/year with a bottom-up approach. The top-down approach without considering typology has a narrower range of 1.2 to 27 kg CO2e/m2/year.
The dataset also reveals significant contrasts in study scale and representativeness. The sample size of buildings varies across studies, with the highest reported by Famiglietti et al. [113], encompassing 240,000 buildings, whereas the lowest size is seven in the work by Rasmussen et al. [98]. These samples may represent actual buildings or be based on modeled data, such as statistically derived archetypes. In principle, giving greater weight to benchmark values derived from larger datasets could improve their reliability. However, due to the heterogeneity in building types, geographical contexts, data sources, and methodologies across studies, applying such weighting would be difficult and might introduce additional uncertainty. Therefore, all benchmark results are presented without statistical weighting, with the sample size, data source, and methodological context clearly reported for each study to allow readers to interpret the findings in context. The observed pattern suggests that benchmark development has evolved in phases, beginning with the most common building types (e.g., residential and office buildings) and expanding to other building types in later stages (e.g., healthcare, retail, and schools). Most benchmarks have been established for residential typologies, with about 88% of studies focusing on them individually or in combination with other typologies. Table 4 presents the sources used to establish benchmarks, offering crucial information for this analysis.
The statistical evaluation of LCA outcomes for buildings has been widely employed in a bottom-up method. Representative buildings or archetypes, along with their variants, have been modeled to serve as sample buildings for studies. In the top-down approach, studies typically employ global datasets for downscaling. About 81% of studies have employed a bottom-up approach, and 14% have used a top-down approach. The remaining 5% have adopted a combined approach. A typology distribution of 48% residential, 14% nonresidential, and 38% mixed, is also seen.
Figure 7 illustrates the distribution and frequency of the Scope Completeness Index (SCI) across the reviewed studies. The results indicate a highly heterogeneous treatment of life-cycle scope, with SCI values spanning a wide range rather than clustering around a common reference level. While local maxima are observed around SCI ≈ 0.4 and at higher values near 0.7–0.8, no dominant or representative SCI value emerges. The absence of a bell-shaped or normal distribution highlights the lack of consistency in scope definition across studies, reflecting substantial variation in life-cycle stage coverage. This irregular distribution underscores the challenges associated with harmonizing benchmarks and conducting robust cross-study comparisons based on scope completeness.
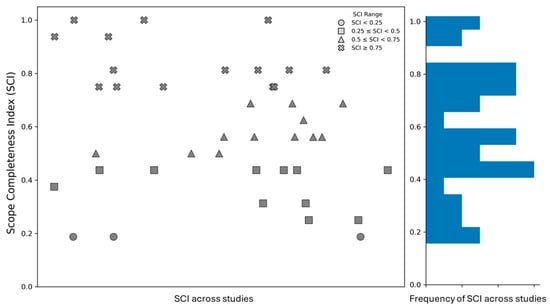
Figure 7.
Scope completeness index observed along with frequency of SCI’s across the reviewed studies.
Building on the observed heterogeneity in overall scope completeness, a more detailed examination of how individual life-cycle stages are represented across studies provides further insight into the sources of this variability. Figure 8 presents the proportion of reviewed studies that include each life-cycle stage within their LCA system boundaries. While upfront EC stages (A1–A3) are consistently assessed across all studies, substantial variability is observed for construction, use-phase, and end-of-life stages. Construction-related impacts (A4–A5) and use-phase processes (B2–B5) are frequently omitted, with inclusion rates below 50% in most cases. Although end-of-life stages (C1–C4) are more commonly addressed, their treatment remains inconsistent, which means they are modeled with simplified or generic assumptions. These findings highlight a persistent imbalance in system boundary definition within the literature and underscore the need for more comprehensive and harmonized whole-life carbon assessments.
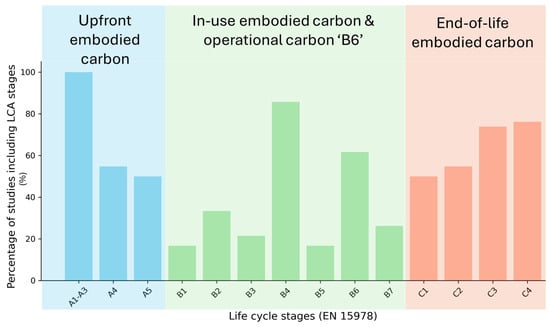
Figure 8.
Proportion of reviewed studies including individual life-cycle stages within their system boundaries, highlighting variability in scope coverage.
Figure 9 further explores the relationship between benchmark magnitude and system boundary completeness by plotting benchmark range values (kg CO2e/m2/year) against the SCI. A wide dispersion of benchmark values is observed across the full range of SCI scores, indicating that higher SCI values do not systematically correspond to higher benchmark values, nor do lower SCI values consistently result in lower benchmarks. Studies with relatively high SCI exhibit both low and high carbon intensities, while studies with limited scope coverage can also report comparatively high benchmark values. This lack of a monotonic relationship demonstrates that magnitude is influenced not only by life-cycle stage coverage but also by a combination of other methodological and contextual factors, including building typology, energy performance level, data sources, modeling assumptions, sample size, and regional context. Consequently, SCI should be interpreted as an indicator of methodological completeness rather than a direct proxy for benchmark stringency or carbon intensity. Results are differentiated for residential, non-residential, and mixed building samples, as well as by benchmark development approach.
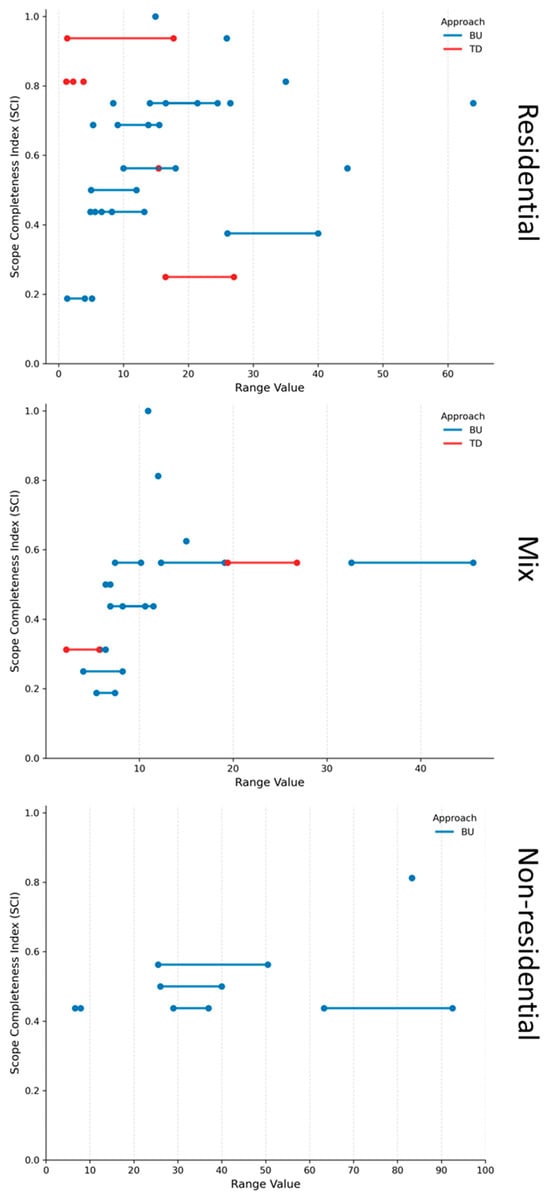
Figure 9.
Relationship between benchmark range values (kg CO2e/m2/year) and SI across reviewed studies.
A visual summary of the studies across different countries, illustrating their LCA scopes, value ranges (kg CO2e/m2/year), and building typologies to complement the detailed data presented in Table 3 and provided at the end for a quick overview (Figure 10). For residential buildings, several examples illustrate how benchmark values can vary despite similar or even lower SCI values. In Germany, studies by König and Cristoforo [87] report lower SCI values than Özdemir et al. [111], yet the benchmark values reported by the latter are higher. This difference is primarily attributed to building energy performance assumptions: Özdemir considers buildings designed to meet stricter energy performance levels (40 and 55) under the German Building Energy Act (GEG 2020), whereas König’s study is based on earlier EnEV 2009 requirements, which allow higher energy demand. Similarly, Belgian studies [108,118] have the same SCI but report lower benchmark values for the latter due to a larger and more representative building sample. In France [93], despite a relatively high SCI (~0.75), benchmark values remain low, reflecting the focus on low-energy buildings aligned with national thermal regulations that limit primary energy demand to 50 kWh/m2/year. In contrast, studies from Hungary [115] adopt typical construction systems to represent business-as-usual conditions, resulting in higher benchmarks. The Czech Republic [120] exhibits high benchmark values despite extensive scope coverage, largely due to the dominant contribution of OC, which accounts for approximately 59% of total emissions. Similarly, in Spain, where full WLC is assessed, higher benchmark values are driven primarily by operational emissions, whereas lower benchmark values correspond to cases with low-carbon scenarios.
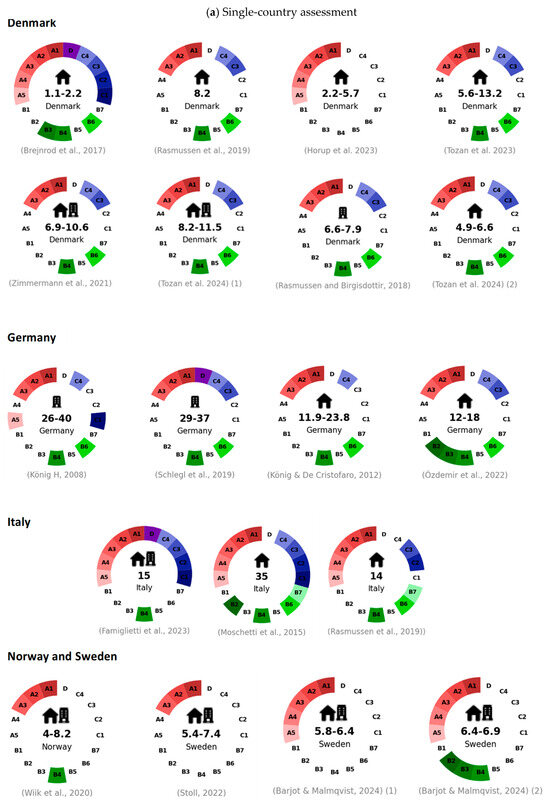
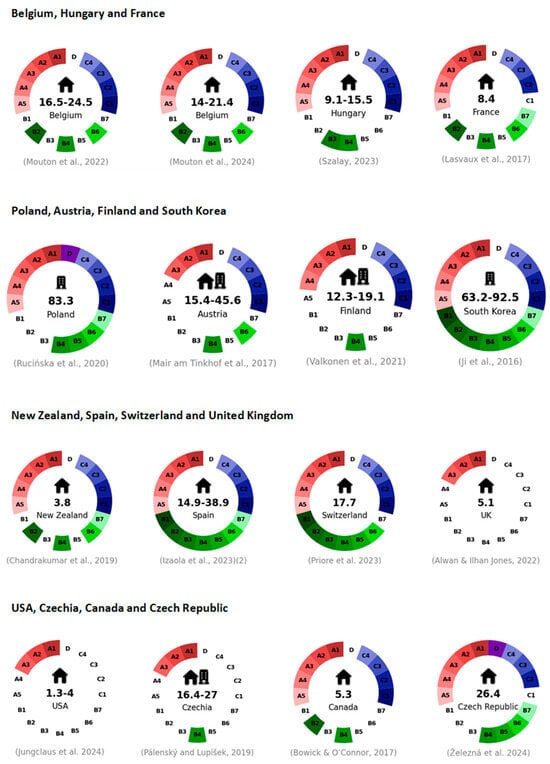
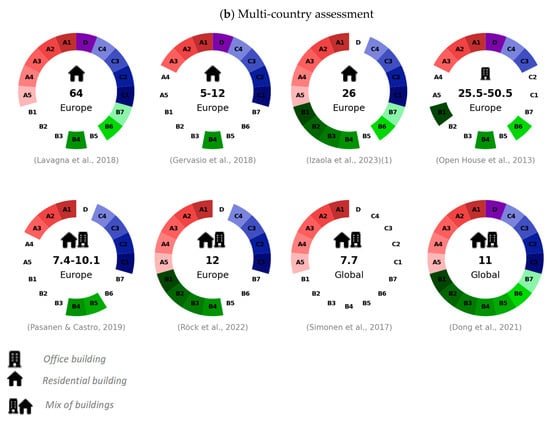
Figure 10.
Carbon benchmark values with scope and typology for (a) single country and (b) multiple countries [13,28,31,56,86,87,88,89,90,91,92,93,94,95,96,97,98,99,100,101,102,103,105,106,107,108,109,110,111,112,113,114,115,116,117,118,119,120,121,122].
For non-residential buildings, even greater variability is observed. South Korean elementary school buildings [90] report high values, with OC accounting for approximately 72% of total emissions. Likewise, a Polish study [102] reports elevated benchmarks driven by high primary energy demand (up to 265 kWh/m2/year), compared with substantially lower values reported in France. In this case, energy use contributes nearly 87% of total GWP. Conversely, studies reporting the lowest benchmark values focus only on partial upfront EC stages (A1–A3), apply non-empirical prototype models, and exhibit very low SCI values, limiting comparability.
Across both residential and non-residential cases, additional variability arises from the choice of methodological approach. Top-down approaches rely heavily on downscaling and target-based assumptions, introducing higher uncertainty compared with bottom-up assessments. Furthermore, benchmarks derived from mixed building samples inherently reflect greater heterogeneity, making it difficult to attribute variability to a single dominant factor. Overall, while system boundary completeness influences benchmark values, no single variable can be identified as the sole driver of variability; rather, benchmark outcomes emerge from the combined effects of scope definition, data quality, representativeness of building samples, and modeling assumptions.
6. Discussion
A unique or single global benchmark system remains challenging to establish due to the variability, inconsistency, and uncertainty across dimensions (e.g., regional variation, modeling approaches, and varying databases), whereas data unavailability leads to rough assumptions. Studies have reported a remarkable range in benchmark values, which can be attributed to various factors, including differences in building typologies, life-cycle scopes, data sources, and methods. Currently, every study presents a different approach to obtaining reference values; therefore, a common benchmarking framework must be developed that embeds consistency across data, scope, and modeling across regions. This framework would allow a fair comparison of emissions across buildings. In agreement with the general recommendations by Trigaux et al. [25] and those from Annex 72 [26], the following recommendations and discussion given below are based on the findings and limitations identified in the reviewed studies to improve future benchmarking research.
6.1. Challenges in Establishing Benchmarks
Several common problems can be addressed to enhance the benchmarking system substantially. Although this approach may not yield a perfect benchmark, it ensures feasible, well-justified parameters for a more robust framework than is currently available.
6.1.1. Modeling Approach
From the modeling approach perspective, each approach has distinct strengths and limitations. In top-down approaches, such as those by [56,85], benchmarks have been derived by allocating global or national climate targets to the construction sector, offering a science-based perspective aligned with absolute sustainability principles, but they rely on broad assumptions and allocation procedures that introduce significant uncertainty. For instance, economic or population-based allocations can overlook temporal dynamics (e.g., population growth) and context-specific factors (e.g., cultural/political variations), limiting their representativeness. Pálenský and Lupíšek [101] also employed extrapolations and proxy data, increasing variability in outcomes. Hence, acknowledging the uncertainties and assumptions in this approach is important.
Conversely, bottom-up approaches are suitable for developing operationally relevant, short-term benchmarks but may not fully capture the broader environmental boundaries necessary for long-term climate alignment. For example, uncertainties can arise from incomplete LCIs, inconsistent system boundaries, and limited representativeness of the sample buildings.
To address these limitations, hybrid approaches, adopted by Hoxha et al. [104] and Mair am Tinkhof et al. [94], offer a more balanced framework. By integrating top-down climate targets with bottom-up empirical data, hybrid models reduce truncation errors while preserving macro-level coherence and micro-level granularity.
Overall, the analysis highlights that top-down and bottom-up approaches should not be viewed as competing but as complementary tools for developing coherent benchmarks. Bottom-up values can serve as transitional evidence-based targets toward top-down science-based goals, providing a useful decision-making framework for policy and practice, as reflected in the recommendations of IEA EBC Annex 72 [26], which emphasize that benchmark developers should employ bottom-up approaches to assess the feasibility of top-down or science-based benchmarks.
While the benchmarks presented in this study are based on static emission factors and current material data, consistent with existing literature, dynamic factors such as future energy grid decarbonization and material technology improvements will influence life-cycle emission outcomes over time. Research on dynamic, science-based carbon budgets demonstrates how global climate targets can be downscaled to sectoral and building-level limits, suggesting that future benchmarks could be aligned with decarbonization pathways rather than present-day averages. Temporal variations in grid emission factors have been shown to significantly alter operational life-cycle impacts compared with static assumptions, highlighting the importance of considering projected changes in energy systems and technologies in forward-looking assessments. Although such dynamic data are not uniformly available across published building studies, the framework proposed here [114] is compatible with their future integration to refine benchmarks in alignment with evolving climate policy goals. Given ongoing technological and policy developments, EC benchmarks have limited temporal validity and should be periodically updated, with future work enabling a transition from static to dynamic LCA-based benchmark definitions [43].
6.1.2. Need for High-Resolution Representative Building Archetypes
A critical limitation in existing benchmark studies is the insufficient representativeness of building samples. Many studies have employed small or narrowly defined sample sizes and typologies, limiting the reliability of the benchmarks derived from them. For instance, König H [86] included only multifamily dwellings, excluding single-family homes, whereas Moschetti et al. [89] analyzed residential units without capturing variability across archetypes. Similarly, Ji et al. [90] conducted a statistical LCA on a limited number of elementary schools and Rucińska et al. [102] analyzed office buildings with a small sample size, restricting the broader applicability of their benchmarks.
Other studies have highlighted the influence of sampling and methodological choices on benchmark reliability. Mouton et al. [108] analyzed Belgian residential buildings but considered only four geometries over a limited period, excluding differences in refurbishment, component variations, and energy performance. Their follow-up study [118] improved representativeness by including a full set of dwellings with variants from the EPD database, demonstrating how increasing the sample diversity and capturing functional variants can enhance benchmark robustness. Similar limitations were reported in the studies [92,93,95,97,98], all of which emphasized the need for larger and more diverse samples to better reflect actual building stocks.
These observations highlight that benchmark values are highly dependent on the characteristics of the building sample. Building type, function, age, and sample quality significantly influence results. Moreover, no established consensus exists on what constitutes an adequate sample size for deriving representative benchmarks, making the number of cases critical for generalization.
The archetype or reference-building approach addresses some of these challenges by defining buildings that comply with the latest technical and functional requirements. Such archetypes can represent the most common building types within a stock and provide grounds for deriving benchmark values. Although environmental impacts can vary within the same archetype, real-world building samples better reflect actual conditions. Combining these approaches can yield realistic and consistent benchmarks.
6.1.3. Consistent Data and Scope
Direct comparisons between studies with varied stage coverage (e.g., A1–A3 vs. A1–A5 or B1) are problematic, underscoring the need for aligned scopes. To improve reliability, benchmarks should be derived using standardized methods, appropriate software, and preferably primary or local data, as energy mixes, technological practices, and material processes fluctuate across regions. Reporting the results for individual life-cycle stages (production, construction, use, and end-of-life) enhances transparency and reduces uncertainty, enabling more meaningful comparisons. Existing benchmarks often focus on limited data and building elements using generic secondary databases like ecoinvent or Ökobaudat [109] or incomplete datasets, omitting critical LCA parameters (e.g., nonstructural materials, energy use, or construction site influences). This problem has led to gaps in representativeness, geographic specificity, and stage coverage across studies [96,99,110]. A key barrier to establishing internationally consistent carbon limits and benchmarks is the lack of harmonization among life-cycle inventory (LCI) databases. The choice of using the LCI database remains a significant source of variability (about 20%) in results, even when conducted within the same country [124]. These differences arise from variations in background energy mixes, technological assumptions, temporal representativeness, allocation rules, and modeling choices adopted by database developers. Importantly, even within Europe, where multiple country-specific databases coexist alongside ecoinvent, results may differ substantially when switching between a national database and a regionalized ecoinvent dataset for the same country [125]. This highlights that discrepancies are not solely geographic but are also rooted in methodological decisions and data governance practices of database providers [126]. As a result, database choice introduces a significant source of variation in EC results and remains a fundamental barrier to defining global benchmarks, underscoring the need for transparent reporting and harmonized inventory development. Efforts to improve benchmarks include country-specific adaptations of databases (e.g., Denmark’s ÖKOBAUDAT) and incorporating updated building variants [111], but many frameworks still exclude crucial stages, such as the construction site facilities, finishing work, equipment, and others [127], or they rely on proxies, limiting reliability. Reduced accuracy can lead to the use of nonlocal databases [112]. Recent initiatives, including open-access databases and national carbon limit proposals, aim to enhance comparability and completeness [105,123]. In the future, the aim is to broaden the scope and achieve more reliable assessments [106]. Moving forward, developing reliable benchmarks requires careful attention to stage-specific reporting, systematic handling of uncertainties, and the integration of local, high-quality data.
6.1.4. Harmonization Challenges
A critical challenge in deriving benchmark values from the literature lies in the inconsistency of the methods, scopes, and data sources. Thus, harmonization is critical to achieving comparable and reliable results. Previous initiatives by Open House Project [88], Simonen et al. [31], and Röck et al. [28] demonstrate that even large-scale efforts struggle with differences in life-cycle stages, databases, and modeling approaches, all affecting benchmark validity. Although mathematical or statistical harmonization methods [107] can reduce variability, they often oversimplify context-specific conditions. More recent work, such as that by Wiik et al. [103] and Izaola et al. [112], has revealed that harmonization can support the development of regionally relevant benchmarks, yet significant variance persists due to data heterogeneity and inconsistent scope definitions. Future benchmark frameworks should emphasize transparent scope alignment, inclusion of country-specific parameters, precise harmonization factors, and explicit spread of data uncertainty. In this context, harmonization serves as a data alignment process and a methodological bridge, enabling consistent comparison across studies and geographical contexts.
6.2. Benchmarking Framework and Embodied Carbon Reduction Strategies
A framework for establishing the EC benchmark is proposed, along with pathways to reduce EC emissions. Decarbonizing building materials and energy-intensive industries can play a pivotal role in reducing EC [128,129]. Indicative benchmark values for EC and OC are provided in a consistent metric of kg CO2e/m2/year for each life-cycle phase. Benchmarks are established for specific building typologies (e.g., residential and office) using a minimum scope boundary of A1–A3, consistent with the majority of the literature. For each building typology, the benchmark is calculated based on aggregated LCA results of representative case studies, using the median or mean values of phase-specific EC emissions as the reference. Low-carbon and innovative materials are integrated by replacing conventional material GWP values with measured or literature-based GWP values, allowing the adjusted per-phase EC to inform the benchmark. This approach provides actionable guidance for policymakers and practitioners: building designs or materials with EC values below the indicative benchmark indicate better performance, while values above highlight opportunities for emission reduction.
Below are the steps and EC emission reduction strategies for each stage.
- First, benchmark values for the upfront EC or product stage (A1–A5) emissions should be developed with utmost reliability, as these contribute to the maximum EC emissions throughout the life of a building and help address the EC content of building materials. The uncertainty is also very low compared with other stages. This cradle-to-gate estimation of the EC content can be reduced using low-carbon and innovative materials and by incorporating efficient technology and processes, which are assessed based on their carbon intensity (kg CO2e per kg of material or functional unit [12]. Recycled materials are also a viable option, as their use can reduce the EC of building components by substituting virgin materials and minimizing the environmental impact of material production [130,131,132,133,134]. Buildings employing low-carbon materials in LCA calculations naturally result in lower benchmark values, thereby reflecting and incentivizing the reduction in EC emissions.
- Second, the use-phase EC (B1–B5) emission benchmark is assessed over the building lifetime. Reducing these emissions requires efficient design that optimizes material use without compromising structural integrity, incorporates modular or prefabricated construction to reduce waste, and extends building lifespan to minimize renovation and demolition. According to IEA EBC Annex 72, early design decisions, durable materials, adaptive layouts, and high-performance systems significantly influence lifetime embodied impacts. Together, these strategies help lower cumulative use-phase EC while maintaining functionality and performance [26,43,131,132,133].
- Finally, the end-of-life EC (C1–C4) covers emissions from demolition, material recovery, and disposal. Reductions can be achieved through selective demolition, efficient waste processing, and the use of low-emission equipment, while maximizing recycling and material reuse. Planning for deconstruction and material recovery early in design supports circularity and lowers total life-cycle EC [26,43,131,132].
6.3. Policy Perspective and Stakeholder Inclusion
Nevertheless, a challenge exists in most countries: the absence of national LCA datasets and WLC regulations for buildings due to a lack of policy regulations. Developing a policy would drive the data generation needed to conduct LCAs across sectors. Such policies also provide a clear reference point for stakeholders, enabling consistent data reporting and supporting informed decision-making throughout the construction supply chain. The recent European BPIE report reveals countries that have initiated or enforced WLC policy regulations. In emerging regulatory contexts, mandatory benchmarks are those embedded within policy or legislative frameworks and supported by enforcement mechanisms that directly influence building design, permitting, and compliance. Under the recast European Energy Performance of Buildings Directive (EPBD), for example, Member States are required to establish WLC calculation methodologies and define baseline and limit values by 2027/2028. This requirement ensures that policymakers, designers, and material suppliers have concrete benchmarks to guide compliance and strategic planning, linking regulations directly to practical building practices. In countries such as Ireland, Czechia, and Spain, current benchmarking efforts are, therefore, explicitly designed to support future mandatory requirements by developing measurement methods, baseline values, and regulatory pathways [42]. In contrast, voluntary benchmarks are typically developed through research initiatives, industry-led frameworks, or certification schemes and do not carry formal enforcement. Nevertheless, voluntary benchmarks serve as an important tool for stakeholder engagement, enabling early experimentation, knowledge transfer, and capacity building before mandatory regulations come into effect. Their primary role is to build sectoral capacity, support methodological harmonization, and provide early guidance for practitioners. From a policy perspective, while mandatory benchmarks directly inform enforceable limit values and compliance thresholds, voluntary benchmarks play a critical preparatory role by generating empirical evidence, mobilizing stakeholder engagement, and informing the design of future regulatory frameworks. Together, voluntary and mandatory benchmarks represent complementary stages in the progressive implementation of whole-life carbon regulation. Most European countries, such as France, the Netherlands, and Denmark, have already set and enforced limit values, whereas WLC disclosure requirements are currently in force in Norway and Sweden or are proposed in Spain, Estonia, Finland, and Iceland. Some other countries are preparing for voluntary WLC disclosure or benchmarking (e.g., Germany, Ireland, and Italy). These varying policy instruments, ranging from disclosure requirements to enforceable limits, have fostered data generation, industry engagement, and regional tool and database development (like LCAbyg, Totem, LCAquick, etc.), enabling measurable reductions in WLC emissions [42].
The LCA-based values can be adopted while highlighting the roles of various stakeholders, existing frameworks, supporting resources, and assessment tools and data. Introducing new carbon regulations in construction encounters significant challenges because it demands changes in design, procurement, and collaboration. Stakeholders must be prepared to adapt to these changes. Stakeholder acceptance, support, and readiness are essential for implementing the targeted regulatory values. Engaging industry actors at each stage, from architects to material manufacturers, helps ensure that benchmarks are practical, widely understood, and aligned with existing workflows [2]. Harmonization, which aligns with stakeholder agreements, is critical to achieving this. Incorporating feedback from diverse stakeholders early in the benchmark development process can prevent implementation barriers and promote consistent adoption across the sector. To support this acceptance, critical resources, such as relevant tools, data, and rating systems, must be accessible to the involved parties. For example, Finland’s CO2data.fi platform, Ökobaudat, and France’s INIES database have significantly supported LCA knowledge and practice. Moreover, building LCA competency is a must before introducing a regulation or declaration, and this competency should be strengthened through free resources from public authorities and industry players [135]. The European BPIE [42] provides critical support to policymakers in implementing legislative measures to reduce building WLC emissions. The report provides insight into the fundamental aspects of WLC regulations and the preliminary steps toward consistent and effective implementation. The report further presents recommendations for developing a standardized WLC assessment method, enhancing data collection processes, fostering stakeholder engagement, and defining WLC limit values while promoting a life-cycle thinking approach [42]. Despite growing global interest in EC benchmarking, the existing body of literature remains largely concentrated in developed regions. Highlighting stakeholder engagement in developing countries is crucial, as early involvement of policymakers, local industry, and academic institutions can accelerate the creation of regional databases, tools, and capacity needed for meaningful benchmarking. This geographical imbalance primarily reflects the earlier adoption of LCA frameworks, the availability of national LCA databases, established EPD programs, and the presence of regional software tools in these countries. In contrast, LCA practice in most developing countries is still at a nascent stage. Although awareness of life-cycle-based approaches is increasing, the lack of national or regional databases, limited access to localized software, and the absence of operational EPD schemes significantly constrain the development of benchmarks. Nevertheless, many developing regions are gradually moving toward establishing the foundational infrastructure required for LCA implementation, including data generation initiatives, capacity building, and policy discussions. As these efforts mature, future research is expected to expand benchmarking practices beyond developed contexts, contributing to a more globally representative evidence base [2,17,42,135].
7. Conclusions and Outlook
Building emissions must be addressed to decarbonize the construction sector. Although it is pertinent to consider the WLC of a building, due to considerable challenges along the pathway, it is better to separately assess EC and OC emissions. Due to technological advancements, the OC side of construction has been significantly reduced in energy-efficient buildings. Although efforts to reduce EC emissions are advancing, they continue to account for a significant share of WLC emissions, underscoring the need for greater attention.
This study compiles and analyzes various global benchmarks. A mix of studies focusing on EC, OC, or WLC emissions use different estimation approaches, including top-down, bottom-up, or hybrid, to calculate a range of benchmark values. As understood from the assessment, the top-down approach is a rough approach because it considers conversion factors that are highly uncertain regarding the bottom-up approach, which applies specific building data. A hybrid approach is a mixed approach that can employ the other two approaches along with any novel approach, such as remote sensing. Using both top-down and bottom-up approaches is recommended to serve as a cross-check.
Establishing benchmarks can serve numerous functions, as mentioned in ISO 21678. The performance levels of the buildings can be assessed via the limit, reference, best practices, and target values, which can be specific to an indicator (i.e., climate change). The process of developing benchmarks employs several methods that follow a systematic approach outlining the evaluation criteria necessary to establish a benchmark. The methods used so far are linear interpolation for missing data, harmonization for consistency, statistical analysis, or simulation-based modeling of reference buildings.
National benchmarks are important for a country’s climate goals. Numerous countries, especially European countries, have already established national benchmarks to enable performance comparisons across buildings, as implementation of WLC regulations, disclosure and legislation are already initiated. Benchmarking provides a metric to distinguish an environmentally high-performing building from others, facilitating efforts and targets to progress to a sustainable building and construction sector. Nonetheless, these benchmarks have enormous variability, uncertainty, and unreliability, which are all attributed to the inconsistent scope, variable boundaries, databases, and modeling techniques. This paper critically discusses these approaches regarding their scope, method, sample size, geographic location, limitations, and potential future improvements. The limitations in most studies arise from smaller sample sizes that do not necessarily yield a representative sample and, hence, cannot be broadly generalized. Due to abundant data sources, modeling tools, and the absence of a proper framework, the benchmark values cannot be compared unless they are simulated for the same scope. Broader use of primary, region-specific data is, therefore, strongly recommended to ensure benchmarks reflect real-world performance and regional material characteristics. Hence, a proper framework that assembles all inconsistencies and provides a pathway for an efficient, reliable, reproducible, and comparative assessment is needed in benchmarking systems. Thus, some recommendations are offered, along with EC reduction strategies.
In conclusion, the successful adoption of LCA-based values in construction requires stakeholder acceptance, support, and readiness. This adoption can be achieved by harmonization of values, aligning with stakeholders, and ensuring the availability of tools, data, and resources. Building LCA competency is essential, and it should be supported by free resources from public authorities and industry players to facilitate the smooth implementation of new carbon regulations and policies.
Author Contributions
B.A.M., writing—original draft, conceptualization, methodology, formal analysis, data curation, visualization, writing—review and editing, and validation; A.N., writing—review and editing, project administration, and supervision; S.G.A.-G., writing—review and editing, supervision, resources, and project administration. All authors have read and agreed to the published version of the manuscript.
Funding
This research received no external funding.
Data Availability Statement
The original contributions presented in this study are included in the article. Further inquiries can be directed to the corresponding author.
Acknowledgments
This research was supported by a scholarship from King Abdullah University of Science and Technology (KAUST). We would like to thank Verina Cristie and Athira U.N. for their support in visualization.
Conflicts of Interest
The authors declare no conflicts of interest.
References
- UNEP. Global Status Report for Buildings and Construction: Towards a Zero-Emission, Efficient and Resilient Buildings and Construction Sector; UNEP: Nairobi, Kenya, 2022. [Google Scholar]
- Falana, J.; Osei-Kyei, R.; Tam, V.W. Towards Achieving a Net Zero Carbon Building: A Review of Key Stakeholders and Their Roles in Net Zero Carbon Building Whole Life Cycle. J. Build. Eng. 2024, 82, 108223. [Google Scholar] [CrossRef]
- UNEP. 2023 Global Status Report for Buildings and Construction: Beyond Foundations—Mainstreaming Sustainable Solutions to Cut Emissions from the Buildings Sector; United Nations Environment Programme: Nairobi, Kenya, 2024. [Google Scholar]
- GBCA; Thinkstep-Anz. Embodied Carbon and Embodied Energy in Australia’s Buildings; Green Building Council of Australia: Sydney, Australia; Thinkstep-Anz: South Perth, Australia, 2021. [Google Scholar]
- UNEP. Building Materials and the Climate: Constructing a New Future; UNEP: Nairobi, Kenya, 2023. [Google Scholar]
- Hollberg, A.; Lützkendorf, T.; Habert, G. Top-down or Bottom-up? How Environmental Benchmarks Can Support the Design Process. Build. Environ. 2019, 153, 148–157. [Google Scholar] [CrossRef]
- IPCC Buildings. Climate Change 2022—Mitigation of Climate Change; Cambridge University Press: Cambridge, UK, 2023; pp. 953–1048. [Google Scholar]
- Röck, M.; Saade, M.R.M.; Balouktsi, M.; Rasmussen, F.N.; Birgisdottir, H.; Frischknecht, R.; Habert, G.; Lützkendorf, T.; Passer, A. Embodied GHG Emissions of Buildings—The Hidden Challenge for Effective Climate Change Mitigation. Appl. Energy 2020, 258, 114107. [Google Scholar] [CrossRef]
- Azmeer, A.; Tahir, F.; Al-Ghamdi, S.G. Progress on Green Infrastructure for Urban Cooling: Evaluating Techniques, Design Strategies, and Benefits. Urban Clim. 2024, 56, 102077. [Google Scholar] [CrossRef]
- Halder, N.; Kumar, M.; Deepak, A.; Mandal, S.K.; Azmeer, A.; Mir, B.A.; Nurdiawati, A.; Al-Ghamdi, S.G. The Role of Urban Greenery in Enhancing Thermal Comfort: Systematic Review Insights. Sustainability 2025, 17, 2545. [Google Scholar] [CrossRef]
- Tahir, F.; Al-Ghamdi, S.G. Climatic Change Impacts on the Energy Requirements for the Built Environment Sector. Energy Rep. 2023, 9, 670–676. [Google Scholar] [CrossRef]
- Hertwich, E.; Lifset, R.; Pauliuk, S.; Heeren, N. Resource Efficiency and Climate Change: Material Efficiency Strategies for a Low-Carbon Future; Report of the International Resource Panel (IRP); UNEP: Nairobi, Kenya, 2020. [Google Scholar]
- Gervasio, H.; Dimova, S.; Pinto, A. Benchmarking the Life-Cycle Environmental Performance of Buildings. Sustainability 2018, 10, 1454. [Google Scholar] [CrossRef]
- Le Den, X.; Steinmann, J.; Röck, M.; Birgisdottir, H.; Horup, L.H.; Tozan, B.; Sørensen, A. Towards EU Embodied Carbon Benchmarks for Buildings—Summary Report; Ramboll: Brussels, Belgium, 2022. [Google Scholar]
- Röck, M.; Balouktsi, M.; Saade, M.R.M.; Rasmussen, F.N.; Hoxha, E.; Birgisdottir, H.; Frischknecht, R.; Habert, G.; Passer, A.; Lützkendorf, T. Embodied GHG Emissions of Buildings—Critical Reflection of Benchmark Comparison and In-Depth Analysis of Drivers; IOP Publishing Ltd.: Bristol, UK, 2020; Volume 588. [Google Scholar]
- UKGBC. Net Zero Whole Life Carbon Roadmap: A Pathway for the UK Built Environment; UK Green Building Council: London, UK, 2021. [Google Scholar]
- Le Den, X.; Steinmann, J.; Kovacs, A.; Kockat, J.; Toth, Z.; Röck, M.; Allacker, K. Supporting the Development of a Roadmap for the Reduction of Whole Life Carbon of Buildings Final Report; European Commissions—DG ENV: Brussels, Belgium, 2023. [Google Scholar]
- Kumar, D.; Maurya, K.K.; Mandal, S.K.; Mir, B.A.; Nurdiawati, A.; Al-Ghamdi, S.G. Life Cycle Assessment in the Early Design Phase of Buildings: Strategies, Tools, and Future Directions. Buildings 2025, 15, 1612. [Google Scholar] [CrossRef]
- Craft, W.; Oldfield, P.; Reinmuth, G.; Hadley, D.; Balmforth, S.; Nguyen, A. Towards Net-Zero Embodied Carbon: Investigating the Potential for Ambitious Embodied Carbon Reductions in Australian Office Buildings. Sustain. Cities Soc. 2024, 105702. [Google Scholar] [CrossRef]
- WGBC. Bringing Embodied Carbon Upfront Coordinated Action for the Building and Construction Sector to Tackle Embodied Carbon; World GBC: London, UK, 2019. [Google Scholar]
- EN 15978:2011; Sustainability of Construction Works—Assessment of Environmental Performance of Buildings—Calculation Method. National Standards Authority of Ireland: Dublin, Ireland, 2011.
- Delem, L.; Wastiels, L. Module D in the Building Life Cycle: Significance Based on a Case Study Analysis. In IOP Conference Series: Earth and Environmental Science; IOP Publishing: Bristol, UK, 2019; Volume 290, p. 012042. [Google Scholar] [CrossRef]
- ISO 21678:2020; Sustainability in Buildings and Civil Engineering Works—Indicators and Benchmarks—Principles, Requirements and Guidelines. ISO: Geneva, Switzerland, 2020.
- PEF European Commission. PEFCR Guidance Document—Guidance for the 14 Development of Product Environmental Footprint Category Rules (PEFCRs); Version 6.3; Quantis: Lausanne, Switzerland, 2018. [Google Scholar]
- Trigaux, D.; Allacker, K.; Debacker, W. Environmental Benchmarks for Buildings: A Critical Literature Review. Int. J. Life Cycle Assess. 2021, 26, 1–21. [Google Scholar] [CrossRef]
- Lützkendorf, T.; Balouktsi, M.; Frischknecht, R.; Peuportier, B.; Nygaard Rasmussen, F.; Satola, D.; Houlihan Wiberg, A.; Birgisdottir, H.; Dowdell, D.; Lupíšek, A.; et al. Benchmarking and Target-Setting for the Life Cycle-Based Environmental Performance of Buildings; American Society of Civil Engineers: Reston, VA, USA, 2023. [Google Scholar]
- Nicholls, D.; Barnes, F.; Acrea, F.; Chen, C.; Buluç, L.Y.; Parker, M.M. Top-Down and Bottom-Up Approaches to Greenhouse Gas Inventory Methods—A Comparison Between National- and Forest-Scale Reporting Methods; U.S. Department of Agriculture: Portland, OR, USA, 2015. [Google Scholar]
- Röck, M.; Sørensen, A.; Tozan, B.; Steinmann, J.; Le Den, X.; Horup, L.H.; Birgisdottir, H. Towards EU Embodied Carbon Benchmarks for Buildings—Setting the Baseline: A Bottom-Up Approach; Ramboll: Brussels, Belgium, 2022. [Google Scholar] [CrossRef]
- European Commission. Energy Performance of Buildings Directive; European Commission: Brussels, Belgium, 2024. [Google Scholar]
- Alhorr, Y.; Elsarrag, E. Climate Change Mitigation through Energy Benchmarking in the GCC Green Buildings Codes. Buildings 2015, 5, 700–714. [Google Scholar] [CrossRef]
- Simonen, K.; Rodriguez, B.X.; De Wolf, C. Benchmarking the Embodied Carbon of Buildings. Technol. Archit. Des. 2017, 1, 208–218. [Google Scholar] [CrossRef]
- LEED. LEED (Leadership in Energy and Environmental Design) Rating System; USGBC: Washington, DC, USA, 1998. [Google Scholar]
- BREEAM. BREEAM (Building Research Establishment Environmental Assessment Methodology); BRE Group: Watford, UK, 1990. [Google Scholar]
- ASHRAE Standard 90.1; Energy Standard for Buildings Except Low-Rise Residential Buildings. American Society of Heating, Refrigerating and Air-Conditioning Engineers: Atlanta, GA, USA, 1989.
- MOSTADAM. Mostadam (Sustainable Building); Ministry of Municipal and Rural Affairs and Housing of the Kingdom of Saudi Arabia: Riyadh, Saudi Arabia, 2019. [Google Scholar]
- Bernardi, E.; Carlucci, S.; Cornaro, C.; Bohne, R.A. An Analysis of the Most Adopted Rating Systems for Assessing the Environmental Impact of Buildings. Sustainability 2017, 9, 1226. [Google Scholar] [CrossRef]
- Al-Ghamdi, S.G.; Bilec, M.M. Life-Cycle Thinking and the LEED Rating System: Global Perspective on Building Energy Use and Environmental Impacts. Environ. Sci. Technol. 2015, 49, 4048–4056. [Google Scholar] [CrossRef] [PubMed]
- Amiri, A.; Emami, N.; Ottelin, J.; Sorvari, J.; Marteinsson, B.; Heinonen, J.; Junnila, S. Embodied Emissions of Buildings—A Forgotten Factor in Green Building Certificates. Energy Build. 2021, 241, 110962. [Google Scholar] [CrossRef]
- Al-Ghamdi, S.G.; Bilec, M.M. Green Building Rating Systems and Whole-Building Life Cycle Assessment: Comparative Study of the Existing Assessment Tools. J. Archit. Eng. 2017, 23, 04016015. [Google Scholar] [CrossRef]
- Lützkendorf, T.; Balouktsi, M. From Energy Demand Calculation to Life Cycle Environmental Performance Assessment for Buildings: Status and Trends. In The Role of Exergy in Energy and the Environment; Springer: Cham, Switzerland, 2018; pp. 703–715. [Google Scholar]
- Xiong, L.; Wang, M.; Mao, J.; Huang, B. A Review of Building Carbon Emission Accounting Methods under Low-Carbon Building Background. Buildings 2024, 14, 777. [Google Scholar] [CrossRef]
- Toth, Z.; Broer, R.; Graaf, L.; Röck, M. How to Establish Whole Life Carbon Benchmarks: Insights and Lessons Learned from Emerging Approaches in Ireland, Czechia and Spain; BPIE (Buildings Performance Institute Europe): Brussels, Belgium, 2024. [Google Scholar]
- Frischknecht, R.; Lützkendorf, T.; Passer, A.; Birgisdottir, H.; Chae, C.-U.; Palaniappan, S.; Balouktsi, M.; Rasmussen, F.N.; Röck, M.; Potrč Obrecht, T.; et al. IEA EBC Annex 72 Background Information: Assessing Life Cycle Related Impacts Caused by Buildings; Verlag der Technischen Universität Graz: Graz, Austria, 2023. [Google Scholar] [CrossRef]
- Rasmussen, F.N.; Trigaux, D.; Alsema, E.; Balouktsi, M.; Birgisdóttir, H.; Bohne, R.; Dixit, M.; Dowdell, D.; Francart, N.; Frischknecht, R.; et al. Existing Benchmark Systems for Assessing Global Warming Potential of Buildings—Analysis of IEA EBC Annex 72 Cases; IOP Publishing: Bristol, UK, 2022; Volume 1078. [Google Scholar]
- Tigani, D.; Van Kan, D.; Tennakoon, G.; Geng, L.; Chan, M. Measuring Embodied Carbon of Buildings: A Review of Methodologies and Benchmarking Towards Net Zero. In IOP Conference Series: Earth and Environmental Science; IOP Publishing: Bristol, UK, 2024; Volume 1363, p. 012030. [Google Scholar] [CrossRef]
- ISO 14040; Environmental Management—Life Cycle Assessment—Principles and Framework. ISO: Geneva, Switzerland, 2006.
- Pan, W.; Teng, Y. A Systematic Investigation into the Methodological Variables of Embodied Carbon Assessment of Buildings. Renew. Sustain. Energy Rev. 2021, 141, 110840. [Google Scholar] [CrossRef]
- ISO 14044; Environmental Management—Life Cycle Assessment—Requirements and Guidelines. ISO: Geneva, Switzerland, 2006.
- ISO 21930; Sustainability in Buildings and Civil Engineering Works—Core Rules for Environmental Product Declarations of Construction Products and Services. ISO: Geneva, Switzerland, 2017.
- EN 15804:2012+A2; Sustainability of Construction Works—Environmental Product Declaration—Core Rules for the Product Category of Construction Products. National Standards Authority of Ireland: Dublin, Ireland, 2019.
- Mir, B.A.; Nurdiawati, A.; Al-Ghamdi, S.G. Assessing the Environmental Impact of Freshwater Use in LCA: Established Practices and Current Methods. Environ. Sci. Water Res. Technol. 2025, 11, 196–221. [Google Scholar] [CrossRef]
- Nurdiawati, A.; Mir, B.A.; Al-Ghamdi, S.G. Recent Advancements in Prospective Life Cycle Assessment: Current Practices, Trends, and Implications for Future Research. Resour. Environ. Sustain. 2025, 20, 100203. [Google Scholar] [CrossRef]
- Liang, H.; Bian, X.; Dong, L. Towards Net Zero Carbon Buildings: Accounting the Building Embodied Carbon and Life Cycle-Based Policy Design for Greater Bay Area, China. Geosci. Front. 2024, 15, 101760. [Google Scholar] [CrossRef]
- Suh, S.; Lenzen, M.; Treloar, G.J.; Hondo, H.; Horvath, A.; Huppes, G.; Jolliet, O.; Klann, U.; Krewitt, W.; Moriguchi, Y.; et al. System Boundary Selection in Life-Cycle Inventories Using Hybrid Approaches. Environ. Sci. Technol. 2004, 38, 657–664. [Google Scholar] [CrossRef] [PubMed]
- Bullen, L.; McLaren, S.J.; Dowdell, D.; Chandrakumar, C. Absolute Sustainability of New Zealand Office Buildings in the Context of Climate Targets. Build. Environ. 2021, 205, 108186. [Google Scholar] [CrossRef]
- Chandrakumar, C.; McLaren, S.J.; Dowdell, D.; Jaques, R. A Top-down Approach for Setting Climate Targets for Buildings: The Case of a New Zealand Detached House. In IOP Conference Series: Earth and Environmental Science; IOP Publishing: Bristol, UK, 2019; Volume 323, p. 012183. [Google Scholar] [CrossRef]
- Zhu, C.; Li, X.; Zhu, W.; Gong, W. Embodied Carbon Emissions and Mitigation Potential in China’s Building Sector: An Outlook to 2060. Energy Policy 2022, 170, 113222. [Google Scholar] [CrossRef]
- Chen, W.; Yang, S.; Zhang, X.; Jordan, N.D.; Huang, J. Embodied Energy and Carbon Emissions of Building Materials in China. Build. Environ. 2022, 207, 108434. [Google Scholar] [CrossRef]
- Fishman, T.; Schandl, H.; Tanikawa, H.; Walker, P.; Krausmann, F. Accounting for the Material Stock of Nations. J. Ind. Ecol. 2014, 18, 407–420. [Google Scholar] [CrossRef] [PubMed]
- Tanikawa, H.; Fishman, T.; Okuoka, K.; Sugimoto, K. The Weight of Society Over Time and Space: A Comprehensive Account of the Construction Material Stock of Japan, 1945–2010. J. Ind. Ecol. 2015, 19, 778–791. [Google Scholar] [CrossRef]
- Soonsawad, N.; Marcos-Martinez, R.; Schandl, H. City-Scale Assessment of the Material and Environmental Footprint of Buildings Using an Advanced Building Information Model: A Case Study from Canberra, Australia. J. Ind. Ecol. 2024, 28, 247–261. [Google Scholar] [CrossRef]
- Ward, H.; Wenz, L.; Steckel, J.C.; Minx, J.C. Truncation Error Estimates in Process Life Cycle Assessment Using Input-Output Analysis. J. Ind. Ecol. 2018, 22, 1080–1091. [Google Scholar] [CrossRef]
- Rowley, H.V.; Lundie, S.; Peters, G.M. A Hybrid Life Cycle Assessment Model for Comparison with Conventional Methodologies in Australia. Int. J. Life Cycle Assess. 2009, 14, 508–516. [Google Scholar] [CrossRef]
- Kumar, D.; Maurya, K.K.; Mandal, S.K.; Halder, N.; Mir, B.A.; Nurdiawati, A.; Al-Ghamdi, S.G. A Whole-Life Carbon Assessment of a Single-Family House in North India Using BIM-LCA Integration. Buildings 2025, 15, 2195. [Google Scholar] [CrossRef]
- Li, L.; Gao, L.; Zhang, X.; Xu, H.; Jiang, L. Research on Building’s Carbon Emission Calculation and Reduction Strategy Based on Life Cycle Assessment (LCA) and Building in Formation Modeling (BIM): A Case Study in Beijing, China. Buildings 2025, 15, 1403. [Google Scholar] [CrossRef]
- Yuan, L.; Qiu, J. An Analysis of Embodied Carbon of Different Types of Residential Buildings in China; Trans Tech Publications Ltd.: Baech, Switzerland, 2012; Volume 450–451, pp. 1557–1561. [Google Scholar]
- Zhang, Y.; Yan, D.; Hu, S.; Guo, S. Modelling of Energy Consumption and Carbon Emission from the Building Construction Sector in China, a Process-Based LCA Approach. Energy Policy 2019, 134, 110949. [Google Scholar] [CrossRef]
- Stephan, A.; Crawford, R.H.; Bontinck, P.A. A Model for Streamlining and Automating Path Exchange Hybrid Life Cycle Assessment. Int. J. Life Cycle Assess. 2019, 24, 237–252. [Google Scholar] [CrossRef]
- Yang, Y. Does Hybrid LCA with a Complete System Boundary Yield Adequate Results for Product Promotion? Int. J. Life Cycle Assess. 2017, 22, 456–460. [Google Scholar] [CrossRef]
- Pomponi, F.; Lenzen, M. Hybrid Life Cycle Assessment (LCA) Will Likely Yield More Accurate Results than Process-Based LCA. J. Clean. Prod. 2018, 176, 210–215. [Google Scholar] [CrossRef]
- Yang, Y. Rethinking System Boundary in LCA—Reply to “Lifting the Fog on the Characteristics and Limitations of Hybrid LCA” by Thomas Gibon and Thomas Schaubroeck (2017). Int. J. Life Cycle Assess. 2017, 22, 1009–1011. [Google Scholar] [CrossRef]
- Dixit, M.K. Life Cycle Embodied Energy Analysis of Residential Buildings: A Review of Literature to Investigate Embodied Energy Parameters. Renew. Sustain. Energy Rev. 2017, 79, 390–413. [Google Scholar] [CrossRef]
- Mao, R.; Bao, Y.; Huang, Z.; Liu, Q.; Liu, G. High-Resolution Mapping of the Urban Built Environment Stocks in Beijing. Environ. Sci. Technol. 2020, 54, 5345–5355. [Google Scholar] [CrossRef] [PubMed]
- Ajayebi, A.; Hopkinson, P.; Zhou, K.; Lam, D.; Chen, H.-M.; Wang, Y. Estimation of Structural Steel and Concrete Stocks and Flows at Urban Scale–towards a Prospective Circular Economy. Resour. Conserv. Recycl. 2021, 174, 105821. [Google Scholar] [CrossRef]
- Langston, C.; Chan, E.H.W.; Yung, E.H.K. Hybrid Input-Output Analysis of Embodied Carbon and Construction Cost Differences between New-Build and Refurbished Projects. Sustainability 2018, 10, 3229. [Google Scholar] [CrossRef]
- Crawford, R.H.; Stephan, A. The Significance of Embodied Energy in Certified Passive Houses. In Proceedings of the ICCBM 2013: International Conference on Construction and Building Materials, Copenhagen, Denmark, 26–27 September 2013. [Google Scholar]
- Häkkinen, T. VTT Sustainability and Performance Assessment and Benchmarking of Buildings, Final Report; VTT Technical Research Centre of Finland: Espoo, Finland, 2012. [Google Scholar]
- Lützkendorf, T.; Kohler, N.; König, H. Integrated Life Cycle Assessment: Benchmarks and Uncertainty. In Proceedings of the International Symposium on Life Cycle Assessment and Construction, Nantes, France, 10–12 July 2012. [Google Scholar]
- IEA EBC International Energy Agency. Annex 89: Ways to Implement Net-Zero Whole Life Carbon Buildings; International Energy Agency: Paris, France, 2025. [Google Scholar]
- Ganassali, S.; Di Milano, P.; Campioli, A.; Lavagna, M. Lca Benchmarks In Building’s Environmental Certification Systems. In Proceedings of the 41st IAHS World Congress on Housing-Sustainability and Innovation for the Future, Albufeira, Portugal, 25–31 January 2016. [Google Scholar]
- Gervasio, H.; Dimova, S. Environmental Benchmarks for Buildings: EFIResources: Resource Efficient Construction towards Sustainable Design; Publications Office: Luxembourg, 2018. [Google Scholar]
- VITO; KU Leuven; TU Graz PEF4Buildings. Study on the Application of the PEF Method and Related Guidance Documents to a Newly Office Building; Publications Office of the European Union: Luxembourg, 2018. [Google Scholar]
- Frischknecht, R.; Balouktsi, M.; Lützkendorf, T.; Aumann, A.; Birgisdottir, H.; Ruse, E.G.; Hollberg, A.; Kuittinen, M.; Lavagna, M.; Lupišek, A.; et al. Environmental Benchmarks for Buildings: Needs, Challenges and Solutions—71st LCA Forum, Swiss Federal Institute of Technology, Zürich, 18 June 2019. Int. J. Life Cycle Assess. 2019, 24, 2272–2280. [Google Scholar] [CrossRef]
- WBG Partnership for Market Readiness (PMR). A Guide to Greenhouse Gas Benchmarking for Climate Policy Instruments; World Bank: Washington, DC, USA, 2017. [Google Scholar]
- Zimmermann, M.; Althaus, H.-J.; Haas, A. Benchmarks for Sustainable Construction. Energy Build. 2005, 37, 1147–1157. [Google Scholar] [CrossRef]
- König, H. Guidelines for the Evaluation of Buildings—First Stage: Office Buildings; Final Report, File No. 10.08.17.7-07.29; Ascona König–Jama GbR, Society for Ecological Projects: Gröbenzell, Germany, 2008. [Google Scholar]
- König, H.; De Cristofaro, M.L. Benchmarks for Life Cycle Costs and Life Cycle Assessment of Residential Buildings. Build. Res. Inf. 2012, 40, 558–580. [Google Scholar] [CrossRef]
- Open House; Hiniesto, D.; Torre, M.D. Benchmarking and Mainstreaming Building Sustainability in the EU Based on Transparency and Openness (Open Source and Availability) from Model to Implementation. 2013. Available online: https://cordis.europa.eu/project/id/244130/reporting (accessed on 12 December 2025).
- Moschetti, R.; Mazzarella, L.; Nord, N. An Overall Methodology to Define Reference Values for Building Sustainability Parameters. Energy Build. 2015, 88, 413–427. [Google Scholar] [CrossRef]
- Ji, C.; Hong, T.; Jeong, J.; Kim, J.; Lee, M.; Jeong, K. Establishing Environmental Benchmarks to Determine the Environmental Performance of Elementary School Buildings Using LCA. Energy Build. 2016, 127, 818–829. [Google Scholar] [CrossRef]
- Brejnrod, K.N.; Kalbar, P.; Petersen, S.; Birkved, M. The Absolute Environmental Performance of Buildings. Build. Environ. 2017, 119, 87–98. [Google Scholar] [CrossRef]
- Bowick, M.; O’Connor, J. Carbon Footprint Benchmarking of BC Multi-Unit Residential Buildings; Athena Sustainable Materials Institute: Ottawa, ON, Canada, 2017. [Google Scholar]
- Lasvaux, S.; Lebert, A.; Achim, F.; Grannec, F.; Hoxha, E.; Nibel, S.; Schiopu, N.; Chevalier, J. Towards Guidance Values for the Environmental Performance of Buildings: Application to the Statistical Analysis of 40 Low-Energy Single Family Houses’ LCA in France. Int. J. Life Cycle Assess. 2017, 22, 657–674. [Google Scholar] [CrossRef]
- Mair am Tinkhof, O.; Strasser, H.; Prinz, T.; Herbst, S.; Schuster, M.; Tomschy, R.; Figl, H.; Fellner, M.; Ploß, M.; Roßkopf, T. Guideline and Target Values for Settlements for the Integral Assessment of the Climate Compatibility of Buildings and Mobility Infrastructure in New Housing Estates; BMVIT: Vienna, Austria, 2017. [Google Scholar]
- Lavagna, M.; Baldassarri, C.; Campioli, A.; Giorgi, S.; Dalla Valle, A.; Castellani, V.; Sala, S. Benchmarks for Environmental Impact of Housing in Europe: Definition of Archetypes and LCA of the Residential Building Stock. Build. Environ. 2018, 145, 260–275. [Google Scholar] [CrossRef]
- Gervasio, H.; Dimova, S. Model for Life Cycle Assessment (LCA) of Buildings; EUR 29123 EN; Publications Office of the European Union: Luxembourg, 2018. [Google Scholar] [CrossRef]
- Rasmussen, F.N.; Birgisdottir, H. Life Cycle Assessment Benchmarks for Danish Office Buildings. In Life-Cycle Analysis and Assessment in Civil Engineering: Towards an Integrated Vision; Caspeele, R., Taerwe, L., Frangopol, D.M., Eds.; Taylor & Francis Group: London, UK, 2018. [Google Scholar]
- Rasmussen, F.N.; Ganassali, S.; Zimmermann, R.K.; Lavagna, M.; Campioli, A.; Birgisdóttir, H. LCA Benchmarks for Residential Buildings in Northern Italy and Denmark—Learnings from Comparing Two Different Contexts. Build. Res. Inf. 2019, 47, 833–849. [Google Scholar] [CrossRef]
- Schlegl, F.; Gantner, J.; Traunspurger, R.; Albrecht, S.; Leistner, P. LCA of Buildings in Germany: Proposal for a Future Benchmark Based on Existing Databases. Energy Build. 2019, 194, 342–350. [Google Scholar] [CrossRef]
- Pasanen, P.; Castro, R. Carbon Heroes Benchmark Program—Whole Building Embodied Carbon Profiling. In IOP Conference Series: Earth and Environmental Science; IOP Publishing: Bristol, UK, 2019; Volume 323, p. 012028. [Google Scholar] [CrossRef]
- Pálenský, D.; Lupíšek, A. Carbon Benchmark for Czech Residential Buildings Based on Climate Goals Set by the Paris Agreement for 2030. Sustainability 2019, 11, 6085. [Google Scholar] [CrossRef]
- Rucińska, J.; Komerska, A.; Kwiatkowski, J. Preliminary Study on the GWP Benchmark of Office Buildings in Poland Using the LCA Approach. Energies 2020, 13, 3298. [Google Scholar] [CrossRef]
- Wiik, M.; Selvig, E.; Fuglseth, M.; Lausselet, C.; Resch, E.; Andresen, I.; Brattebø, H.; Hahn, U. GHG Emission Requirements and Benchmark Values for Norwegian Buildings. In IOP Conference Series: Earth and Environmental Science; IOP Publishing: Bristol, UK, 2020; Volume 588, p. 022005. [Google Scholar] [CrossRef]
- Hoxha, E.; Röck, M.; Truger, B.; Steininger, K.; Passer, A. Austrian GHG Emission Targets for New Buildings and Major Renovations: An Exploratory Study. In IOP Conference Series: Earth and Environmental Science; IOP Publishing: Bristol, UK, 2020; Volume 588, p. 032052. [Google Scholar] [CrossRef]
- Valkonen, L.; Kuittinen, M.; Hakaste, H. Carbon Footprint Limits for Common Building Types, Ministry of the Environment; Finland & OneClick LCA Ltd.: Helsinki, Finland, 2021. [Google Scholar]
- Zimmermann, R.K.; Andersen, C.M.E.; Kanafani, K.; Birgisdottir, H. Whole Life Carbon Assessment of 60 Buildings: Possibilities to Develop Benchmark Values for LCA of Buildings; BUILD Report No. 2021:12; Polyteknisk Boghandel Og Forlag: Lyngby, Denmark, 2021. [Google Scholar]
- Dong, Y.; Ng, S.T.; Liu, P. A Comprehensive Analysis towards Benchmarking of Life Cycle Assessment of Buildings Based on Systematic Review. Build. Environ. 2021, 204, 108162. [Google Scholar] [CrossRef]
- Mouton, L.; Trigaux, D.; Allacker, K.; Crawford, R.H. Development of Environmental Benchmarks for the Belgian Residential Building Stock. In IOP Conference Series: Earth and Environmental Science; IOP Publishing: Bristol, UK, 2022; Volume 1078, p. 012077. [Google Scholar] [CrossRef]
- Stoll, P. Baseline and Carbon Limit Values A1–A3 for New Buildings in Sweden Green Building Council’s Net Zero Building Certification System “NollCO2”-Version 1.1; Sweden Green Building Council: Stockholm, Sweden, 2022. [Google Scholar]
- Alwan, Z.; Ilhan Jones, B. IFC-Based Embodied Carbon Benchmarking for Early Design Analysis. Autom. Constr. 2022, 142, 104505. [Google Scholar] [CrossRef]
- Özdemir, Ö.; Hartmann, C.; Hafner, A.; König, H.; Lützkendorf, T. Next Generation of Life Cycle Related Benchmarks for Low Carbon Residential Buildings in Germany. In IOP Conference Series: Earth and Environmental Science; IOP Publishing: Bristol, UK, 2022; Volume 1078, p. 012053. [Google Scholar] [CrossRef]
- Izaola, B.; Akizu-Gardoki, O.; Oregi, X. Setting Baselines of the Embodied, Operational and Whole Life Carbon Emissions of the Average Spanish Residential Building. Sustain. Prod. Consum. 2023, 40, 252–264. [Google Scholar] [CrossRef]
- Famiglietti, J.; Madioum, H.; Motta, M. Developing a New Data-Driven LCA Tool at the Urban Scale: The Case of the Embodied Environmental Profile of the Building Sector. Sustainability 2023, 15, 11518. [Google Scholar] [CrossRef]
- Horup, L.H.; Birgisdóttir, H.; Ryberg, M.W. Defining Dynamic Science-Based Climate Change Budgets for Countries and Absolute Sustainable Building Targets. Build. Environ. 2023, 230, 109936. [Google Scholar] [CrossRef]
- Szalay, Z. A Parametric Approach for Developing Embodied Environmental Benchmark Values for Buildings. Int. J. Life Cycle Assess. 2024, 29, 1563–1581. [Google Scholar] [CrossRef]
- Tozan, B.; Nielsen, L.H.; Hoxha, E.; Birgisdóttir, H. Mitigating Carbon Emissions of Single-Family Houses: Assessing the Need for a Limit Value. J. Phys. Conf. Ser. 2023, 2600, 152019. [Google Scholar] [CrossRef]
- Priore, Y.D.; Habert, G.; Jusselme, T. Exploring the Gap between Carbon-Budget-Compatible Buildings and Existing Solutions—A Swiss Case Study. Energy Build. 2023, 278, 112598. [Google Scholar] [CrossRef]
- Mouton, L.; Ramon, D.; Trigaux, D.; Allacker, K.; Crawford, R.H. Life Cycle Environmental Benchmarks for Flemish Dwellings. Environ. Res. Infrastruct. Sustain. 2024, 4, 015005. [Google Scholar] [CrossRef]
- Jungclaus, M.A.; Grant, N.; Torres, M.I.; Arehart, J.H.; Srubar, W.V. Embodied Carbon Benchmarks of Single-Family Residential Buildings in the United States. Sustain. Cities Soc. 2024, 117, 105975. [Google Scholar] [CrossRef]
- Železná, J.; Felicioni, L.; Trubina, N.; Vlasatá, B.; Růžička, J.; Veselka, J. Whole Life Carbon Assessment of Buildings: The Process to Define Czech National Benchmarks. Buildings 2024, 14, 1936. [Google Scholar] [CrossRef]
- Tozan, B.; Hoxha, E.; Olsen, C.O.; Rose, J.; Kragh, J.; Andersen, C.E.; Sørensen, C.G.; Garnow, A.; Birgisdóttir, H. A Novel Approach to Establishing Bottom-up LCA-Based Limit Values for New Construction. Build. Environ. 2024, 263, 111891. [Google Scholar] [CrossRef]
- Barjot, Z.; Malmqvist, T. Limit Values in LCA-Based Regulations for Buildings—System Boundaries and Implications on Practice. Build. Environ. 2024, 259, 111658. [Google Scholar] [CrossRef]
- Ramboll. Ramboll’s Carbon Assessment Database Co2mpare; Ramboll: København, Denmark, 2024. [Google Scholar]
- Emami, N.; Heinonen, J.; Marteinsson, B.; Säynäjoki, A.; Junnonen, J.-M.; Laine, J.; Junnila, S. A Life Cycle Assessment of Two Residential Buildings Using Two Different LCA Database-Software Combinations: Recognizing Uniformities and Inconsistencies. Buildings 2019, 9, 20. [Google Scholar] [CrossRef]
- Kalverkamp, M.; Helmers, E.; Pehlken, A. Impacts of Life Cycle Inventory Databases on Life Cycle Assessments: A Review by Means of a Drivetrain Case Study. J. Clean. Prod. 2020, 269, 121329. [Google Scholar] [CrossRef]
- Teng, Y.; Li, C.Z.; Shen, G.Q.P.; Yang, Q.; Peng, Z. The Impact of Life Cycle Assessment Database Selection on Embodied Carbon Estimation of Buildings. Build. Environ. 2023, 243, 110648. [Google Scholar] [CrossRef]
- Kuittinen, M. Method for the Whole Life Carbon Assessment of Buildings; Publications of the Ministry of the Environment: Helsinki, Finland, 2019. [Google Scholar]
- Sbahieh, S.; Zaher Serdar, M.; Al-Ghamdi, S.G. Decarbonization Strategies of Building Materials Used in the Construction Industry. Mater. Today Proc. 2023, in press. [Google Scholar] [CrossRef]
- Nurdiawati, A.; Urban, F. Towards Deep Decarbonisation of Energy-Intensive Industries: A Review of Current Status, Technologies and Policies. Energies 2021, 14, 2408. [Google Scholar] [CrossRef]
- Tahir, F.; Alzahrani, S.; Noori, Y.; Al-Ghamdi, S.G. Environmental Impacts and the Future Prospects of Waste Utilization in the Concrete Production. Mater. Today Proc. 2024, in press. [Google Scholar] [CrossRef]
- McCord, K.H.; Dillon, H.E.; Gunderson, P.; Carlson, S.; Phillips, A.R.; Griechen, D.; Antonopoulos, C.A. Strategies for Connecting Whole-Building LCA to the Low-Carbon Design Process. Environ. Res. Infrastruct. Sustain. 2024, 4, 015002. [Google Scholar] [CrossRef]
- Akbarnezhad, A.; Xiao, J. Estimation and Minimization of Embodied Carbon of Buildings: A Review. Buildings 2017, 7, 5. [Google Scholar] [CrossRef]
- Jackson, D.J.; Brander, M. The Risk of Burden Shifting from Embodied Carbon Calculation Tools for the Infrastructure Sector. J. Clean. Prod. 2019, 223, 739–746. [Google Scholar] [CrossRef]
- Röck, M.; Hollberg, A.; Habert, G.; Passer, A. LCA and BIM: Integrated Assessment and Visualization of Building Elements’ Embodied Impacts for Design Guidance in Early Stages. Procedia CIRP 2018, 69, 218–223. [Google Scholar] [CrossRef]
- Balouktsi, M.; Francart, N.; Kanafani, K. Harmonised Carbon Limit Values for Buildings in Nordic Countries: Analysis of the Different Regulatory Needs; Springer: Berlin/Heidelberg, Germany, 2024. [Google Scholar]


Disclaimer/Publisher’s Note: The statements, opinions and data contained in all publications are solely those of the individual author(s) and contributor(s) and not of MDPI and/or the editor(s). MDPI and/or the editor(s) disclaim responsibility for any injury to people or property resulting from any ideas, methods, instructions or products referred to in the content. |
© 2026 by the authors. Licensee MDPI, Basel, Switzerland. This article is an open access article distributed under the terms and conditions of the Creative Commons Attribution (CC BY) license.