


Abstract
Fatigue failure is a prevalent concern within structural engineering, often resulting in critical safety risks. The inherent complexity of construction projects leads to structural components experiencing loads of varying amplitudes and diverse load paths. Investigating the fatigue response under variable-amplitude and load path conditions is essential for mitigating catastrophic failures. This study presents multiaxial fatigue testing of HRB335, a widely utilized construction steel, by subjecting it to variable-amplitude and path loading protocols. Comparative analysis of several established fatigue cumulative damage models, such as Miner, Manson, Tensile Factor, and Bilinear, was conducted based on experimental data to evaluate their effectiveness in predicting fatigue damage accumulation under these complex loading scenarios. The results indicated that, for variable-amplitude loading, the Miner, Manson, and Tensile Factor models demonstrated reasonable accuracy in residual life estimation, with minor deviations observed. Conversely, the Bilinear model exhibited greater variability and reduced predictive precision. Under variable load path conditions, the Manson nonlinear model provided the most accurate predictions, followed by the Miner and Tensile Factor models, while the Bilinear model underperformed.
1. Introduction
In the field of structural engineering, components like steel industrial structures and bridges frequently encounter cyclic loading. This exposure makes fatigue failure a particularly insidious and catastrophic failure mechanism [1,2,3,4,5]. These failures often manifest abruptly with no discernible precursors, resulting in devastating incidents such as bridge collapses, tower failures, and ruptures in marine or aerospace structures. Consequently, rigorous investigation into fatigue phenomena and damage progression principles are paramount. Such research underpins informed decisions on structural upkeep and retrofitting, refines maintenance protocols, enhances the operational lifespan of structures, and supports comprehensive lifecycle management. Moreover, this knowledge is critical for mitigating sudden failures, thereby ensuring structural integrity and preventing catastrophic events.
The phenomenon of metal fatigue has been extensively investigated by numerous researchers, with a predominant focus on fatigue behavior under uniaxial or multiaxial stress states [6,7,8,9,10,11,12]. Nevertheless, real-world operational environments present a more intricate scenario, characterized by fluctuating cyclic load amplitudes, sequences, and load paths. These dynamic variations exert a profound impact on material fatigue response, thereby underscoring the critical need for multiaxial fatigue research that explicitly accounts for variable-amplitudes and load paths. Several investigations have been undertaken internationally to address this imperative. For example, Zakaria [13] demonstrated that the order of applied loads, through load interaction mechanisms, significantly altered fatigue life. Shamsaei [14] performed axial, torsional, and in-phase/out-of-phase axial–torsional strain-controlled experiments under constant and variable amplitude conditions on tubular specimens of pure titanium and BT9 titanium alloy. This research elucidated the impact of loading sequences on multiaxial low-cycle fatigue characteristics. Rusnati [15] evaluated the impact of defects on the fatigue life of additively manufactured Ti-6Al-4V, comparing four prediction models against experimental data to establish critical defect size curves. They then integrated a crack growth-based model into software for probabilistic fatigue analysis, which determined the critical flaw sizes throughout the components. Li [16] developed a predictive model for variable-amplitude low-cycle fatigue life that incorporated the load sequence effect, which was evidenced by damage accumulation under such loading conditions. However, current fatigue life prediction models lack universal applicability across diverse materials and loading scenarios, indicating a persistent requirement for continued fatigue testing and refined damage characterization methodologies.
At the level of damage characterization, scholars have proposed various cumulative damage models, including linear, bilinear, and nonlinear, yet these primarily rely on empirical relationships. For example, Mei [17] conducted a comprehensive study on the multiaxial fatigue damage induced by non-proportional loading in a wrought aluminum alloy using a newly proposed multiaxial fatigue damage parameter. Luo [18] proposed an effective strain criterion which unified multi-mode and multiaxial loads into a single parameter expressed in analytical form. This criterion does not require searching for the plane of the maximum damage parameter by rotation, making it suitable for the fatigue design of anti-vibration components. Qi [19] investigated the changes in the mechanical properties of Q355B and Q690D steels after high-cycle fatigue damage through static tensile tests. Based on continuum damage mechanics and the extended finite element method, they proposed a numerical simulation method for structural steel with fatigue damage, which was subsequently verified using ABAQUS. Huang [20] studied the fatigue damage accumulation laws of metals under variable strain amplitude and variable load paths, and examined the validity of the Miner linear and Manson nonlinear fatigue cumulative damage models. Liu [21] improved the nonlinear cumulative model under variable-amplitude loading by introducing a load sequence correction factor. Wang [22] proposed a numerical analysis method that accounted for the influence of bearing defects and vehicle loads on the entire fatigue damage process in T-beam bridges, facilitating a more comprehensive assessment of their fatigue damage. Liu [23] proposed an enhanced fatigue damage model based on Weibull strength distribution for the more accurate prediction of damage evolution and the fatigue life of materials under cyclic loading.
However, research on the laws of fatigue damage accumulation caused by such non-proportional, variable-amplitude, and variable-path loads remains immature and with limited applicability. For instance, Xia [24] compared the predictive capabilities of six multiaxial cumulative damage models for step spectra of LY12CZ aluminum alloy and found that no single model was applicable to all two-level step spectra simultaneously. Khan [25] combined linear cumulative models with experiments and confirmed that prediction deviations significantly increased when the load sequence changed. Rejovitzky [26] pointed out that the Palmgren–Miner model possessed an upper predictive bound under random loading. Marhadi [27] conducted a comparative study on various methods used to characterize and visualize load paths, analyzing the effectiveness of each method under different loading conditions and boundary constraints. The results showed discrepancies in the outcomes provided by these methods, with each emphasizing different interpretations of load transfer mechanisms; no single method emerged as the universally optimal choice for characterizing load paths. Therefore, it is necessary to test and evaluate the validity and rationality of both linear and nonlinear fatigue damage cumulative models and formulas for different materials.
Therefore, this study concentrated on HRB335 structural steel, a material prevalent in civil engineering applications, and systematically investigated its fatigue behavior under variable-amplitude and variable-path loading protocols. Comprehensive experimental data encompassing both high-cycle fatigue and low-cycle fatigue regimes were acquired. Utilizing this dataset, a rigorous quantitative analysis and comparative validation of the predictive performance and broader applicability of four widely adopted cumulative damage models were conducted: the Miner linear damage rule, the Bilinear accumulating damage model, the Manson nonlinear damage model, and the Tensile Factor nonlinear model. This research aimed to establish an empirical foundation for fatigue life prediction of structural steel elements in building frameworks subjected to complex loading histories.
2. Materials and Specimens
The specimen employed for fatigue testing in this research is a hot-rolled ribbed low-alloy high-strength steel reinforcement, grade HRB335, manufactured by Liuzhou Iron and Steel Company Limited. It possesses attributes such as high-yield strength, lightweight construction, superior deformability, and exceptional structural integrity, rendering it extensively utilized in contemporary civil and structural engineering applications. Its primary chemical composition is detailed in Table 1, with its corresponding mechanical properties summarized in Table 2, both provided by the manufacturer.
Table 1.
Chemical composition of HRB335 (%).
Table 2.
Mechanical capacity of HRB335.
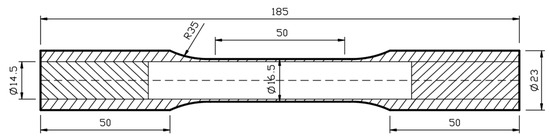
Multiaxial fatigue specimens can take various shapes, including disks, tubes, plates, and cruciform types. In this study, tubular specimens were employed for multiaxial fatigue testing, as they are capable of withstanding various forms of loading to obtain the stress and strain states required for analysis. The specific dimensions of the specimens are shown in Figure 1.
Figure 1.
Sectional dimension of the specimen (mm).
3. Methods
3.1. Fatigue Experimental Program
3.1.1. Constant-Amplitude Fatigue Tests
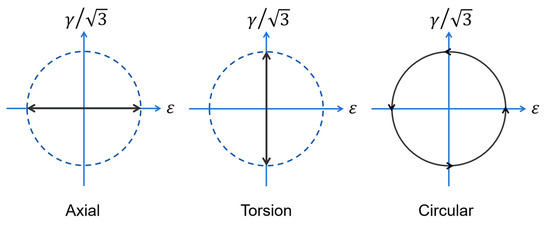
These tests were completed in previous research [28]. The apparatus employed was an MTS809 electro-hydraulic servo tension–torsion testing system. Tests were performed under strain-controlled conditions with symmetric cyclic loading, characterized by a strain ratio (R) of −1 and a zero-mean strain. The load paths included axial, torsion, and circular, all employing sinusoidal waveform loading. The load paths are illustrated in Figure 2.
Figure 2.
The diagram of load paths.
The sinusoidal waveforms selected for the axial and shear directions in the tests were as follows:
where and represent the instantaneous axial strain and shear strain, respectively; and represent the axial and shear strain amplitudes; is the angular frequency; t is time; and is the phase difference between and .
The circular path represents multiaxial loading, with a 90° phase difference between axial strain and torsional strain. The loading frequency for all tests was 1 Hz. The specific test conditions and results are listed in Table 3. The equivalent strain is the von Mises equivalent strain.
Table 3.
Experimental parameters and results of low-cycle fatigue of HRB335.
3.1.2. Variable-Amplitude Fatigue Tests
Two-stage fatigue tests were conducted on the HRB335 specimens in this study. In these tests, the number of cycles n1 in the first stage was taken as either half or a quarter of the mean fatigue life under constant-amplitude loading. And the number of cycles experienced at the second loading stage (until failure) was n2. The selected load paths, the equivalent strain amplitude of the second stage, and the corresponding mean fatigue life are presented in Table 4.
Table 4.
Two-stage equivalent strain amplitudes of variable-amplitude fatigue tests and corresponding mean fatigue life.
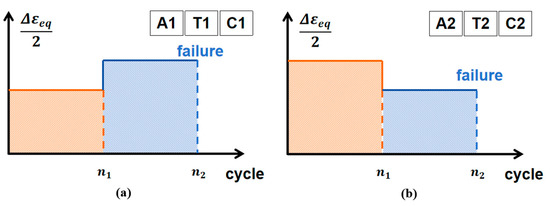
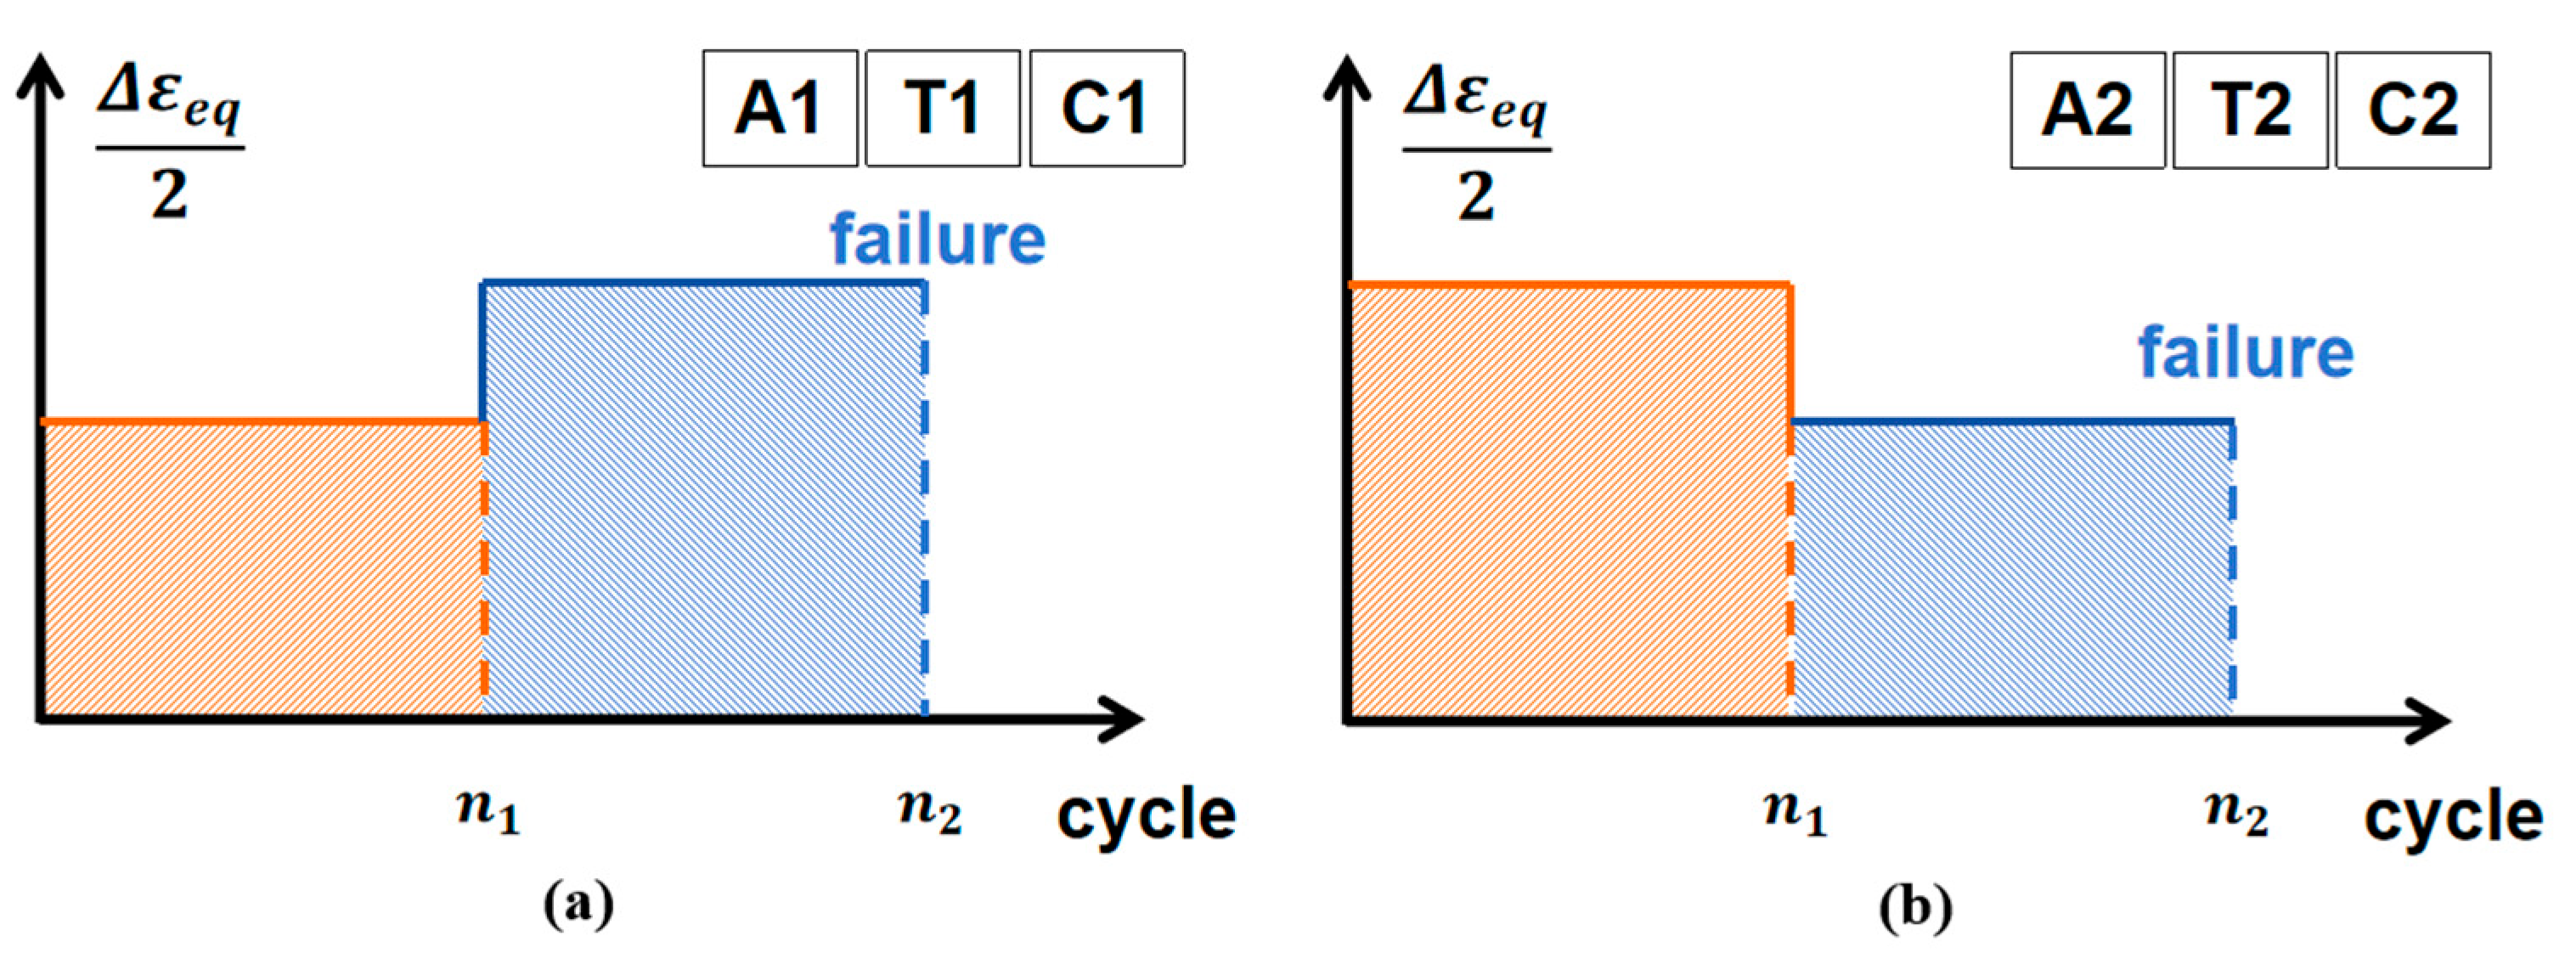
Based on the selected two-stage equivalent strain amplitudes and their corresponding mean fatigue lives, variable-amplitude fatigue tests were performed on HRB335 specimens. The specific test conditions are presented in Figure 3. A1, T1, C1 and A2, T2, C2 in the upper-right corner of Figure 3 indicate the load paths. ‘A,’ ‘T,’ and ‘C’ represent axial, torsional, and circular paths, respectively. The number ‘1’ indicates that the loading amplitude in the first stage is a small value, and the loading amplitude in the second stage is a large value. The number ‘2’ represents the opposite situation.
Figure 3.
Load diagram of variable-amplitude fatigue test. (a) Loading amplitude: small → large; (b) Loading amplitude: large → small.
3.1.3. Variable-Path Fatigue Tests
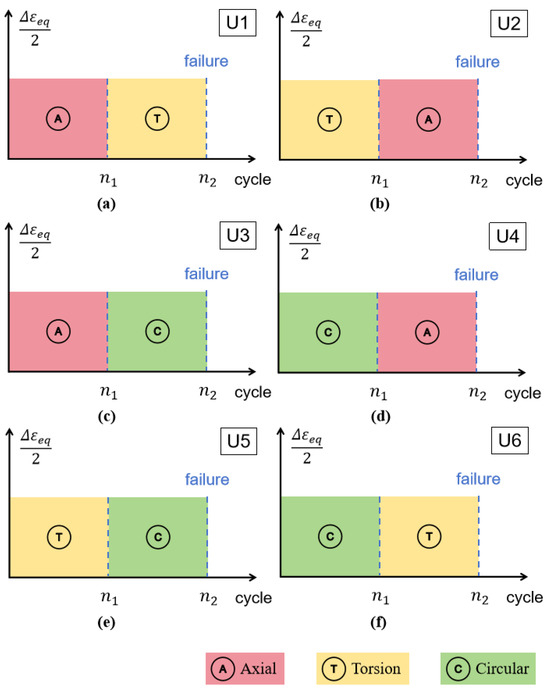
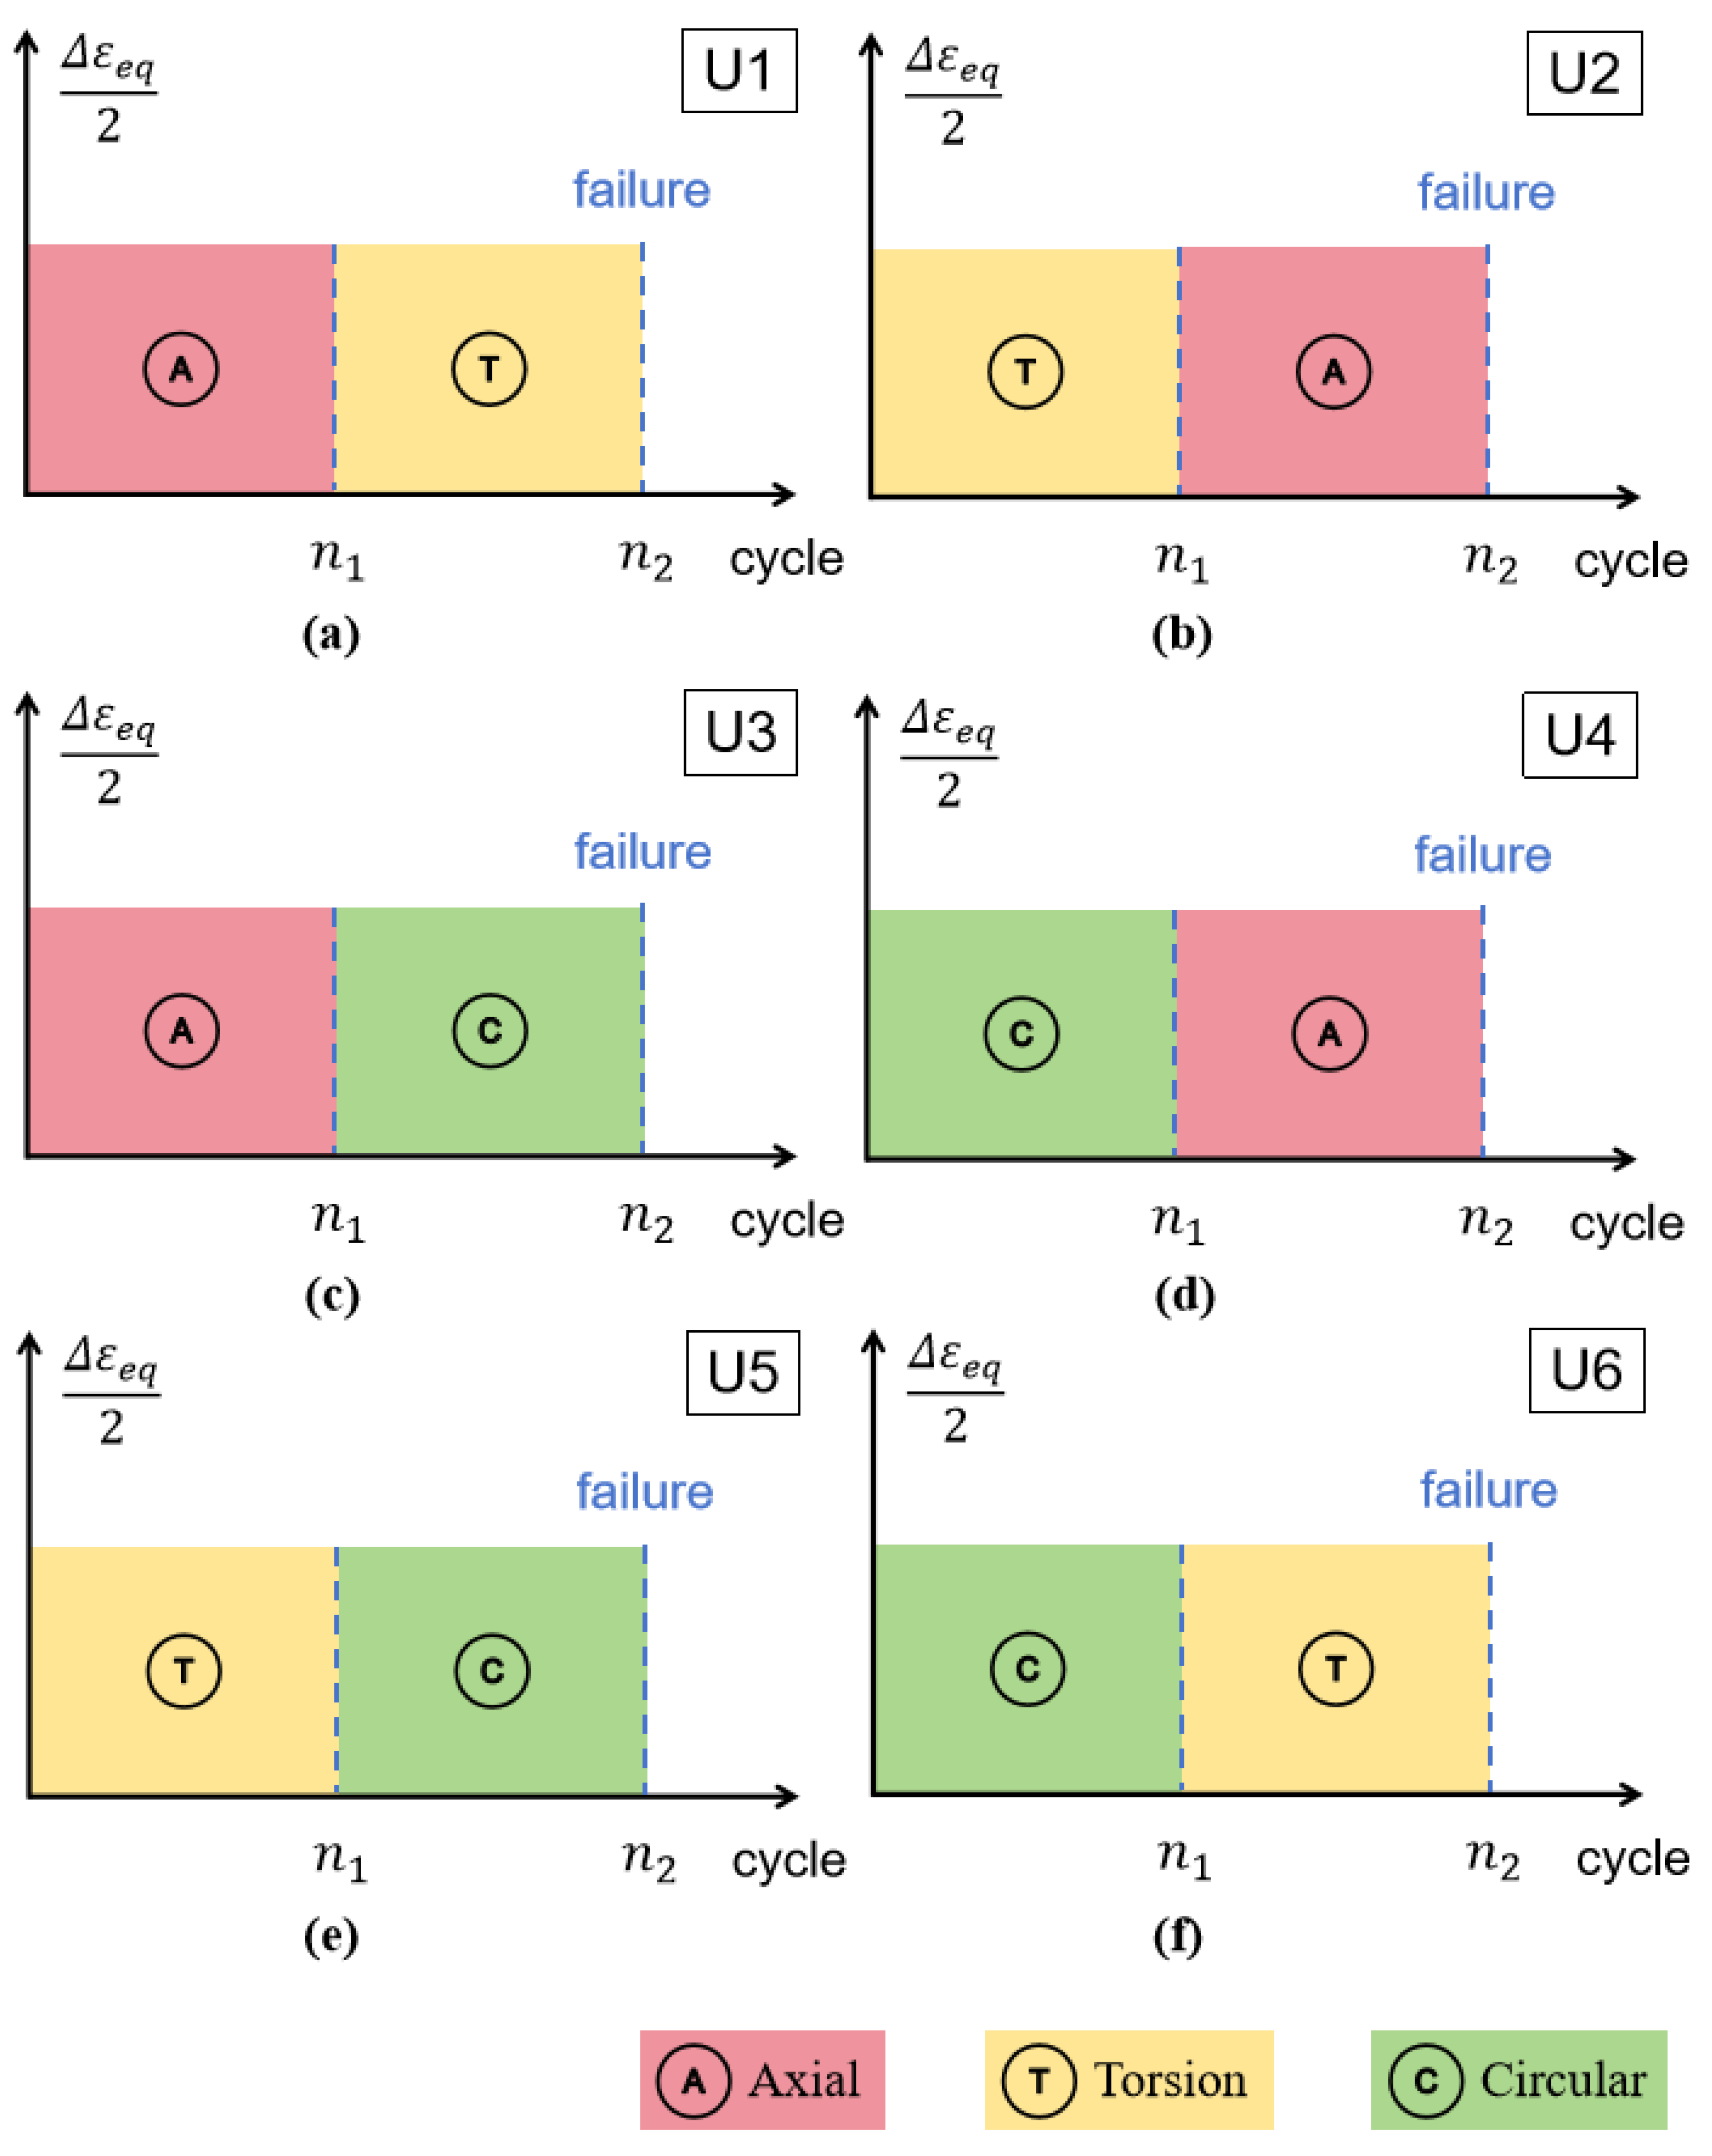
This study investigates the effects of variable fatigue load paths. The specific path transition types designed were: axial → torsion, axial → circular, torsion → circular, and their reversed sequences—torsion → axial, circular → axial, and circular → torsion, named U1~U6 respectively, as illustrated in Figure 4. For all variable-path fatigue tests, the equivalent strain amplitude was set at 0.003 and the loading frequency at 1 Hz.
Figure 4.
Load diagram of variable-path fatigue test. (a) Axial → Torsion; (b) Torsion → Axial; (c) Axial → Circular; (d) Circular → Axial; (e) Torsion → Circular; (f) Circular → Torsion.
3.2. Theoretical Damage Models
Numerous theoretical studies on low-cycle fatigue cumulative damage have been conducted by scholars both domestically and internationally, leading to the proposal of various linear, bilinear, and nonlinear cumulative damage models. Based on the variable-amplitude and variable-path fatigue test data obtained for HRB335 as described earlier, this paper will validate the general applicability of several commonly used fatigue cumulative damage models: the Miner linear model, the Bilinear model, the Manson nonlinear model, and the Tensile Factor nonlinear model.
3.2.1. Miner Linear Model
Numerous theoretical models have been proposed for multiaxial low-cycle fatigue cumulative damage research. Among them, the Miner linear cumulative damage model [29] was the earliest proposed and the most widely used in engineering. It can be given as follows:
where represents the cycle ratio at the -th load level, ni denotes the number of cycles at the i-th load level, and is the number of cycles to fatigue failure corresponding to the i-th load level. D indicates the cumulative damage value; when the cumulative damage value D reaches 1, it signifies fatigue failure.
The application of the Miner model relies on two prerequisites: changing the order of each load level does not affect the fatigue life, and the loading at each level must be symmetric.
For the case of two-stage loading, Equation (2) yields the low-cycle fatigue cycle ratio under the second-stage strain level as:
where and represent the fatigue lives corresponding to the first-stage and second-stage strain amplitudes, respectively.
3.2.2. Bilinear Model
The Miner theory does not account for the influence of different stages of fatigue evolution on the cumulative damage value. Building upon Miner’s theory, Manson and colleagues divided the fatigue cumulative damage process into two distinct stages and proposed the bilinear fatigue cumulative damage theory [30]. For the case of two-stage loading, with the turning point denoted as TP, the fatigue cycle ratios for the first and second stages are given respectively as:
When calculating the residual life under two-stage loading using the Bilinear model, we can set: , , , .
When , then:
When , then:
3.2.3. Manson Model
Both previously mentioned cumulative damage theories assume that the damage value corresponding to each cycle remained constant throughout any loading stage. However, studies by many scholars have found that fatigue damage is not linear. On this basis, Manson and colleagues proposed a nonlinear cumulative damage model that can account for the influence of loading sequence on the fatigue damage value [31]. In the case of two-stage loading, this model can be simplified as:
Following the Manson nonlinear cumulative damage model described above, the remaining fatigue life during the second-stage loading under two-stage loading conditions can be determined as:
3.2.4. Tensile Factor Model
Building upon the Manson nonlinear cumulative damage theory, many scholars have proposed various nonlinear cumulative damage models [32,33]. This paper experimentally validated one such model that was relatively simple in parameter settings and convenient for practical engineering applications through an analysis of the strengthening effect under non-proportional loading and the stress–strain relationship on the critical plane. Following the research of Brown and Miller [34], the plane where the maximum shear strain of the material during the fatigue cycle can be defined as the critical plane. The model can be expressed as follows [35]:
where and are the equivalent damage strain parameters under the first-stage and second-stage loading, respectively. Their calculation equation is:
where and represent the maximum shear strain amplitude and the normal strain amplitude on the critical plane, respectively. Both of these can be calculated from the instantaneous maximum shear strain and the instantaneous normal strain on the critical plane [36]:
where is the phase difference between and , and is the angle between the critical plane and the axial direction of the specimen. The meanings of , , t, , and are the same as those of Equation (1). Thus:
where is the ratio of shear strain amplitude to axial strain amplitude, is the equivalent Poisson’s ratio of the material, and and are the elastic and plastic Poisson’s ratios, respectively.
In Equation (10), is the tensile factor. Its calculation equation is as follows:
where S represents the integral area of the normal strain on the critical plane over one cycle.
The equivalent damage parameters for the three load paths considered in this study, calculated using the equations above, are presented in Table 5.
Table 5.
Equivalent damage parameters of stretching factor model.
Subsequently, the residual life under the second-stage loading for both variable-amplitude and variable-path conditions can be calculated using Equation (9) and compared with the experimentally measured results.
4. Results and Discussion
4.1. Fatigue Test Results
4.1.1. Constant-Amplitude Fatigue Test Results
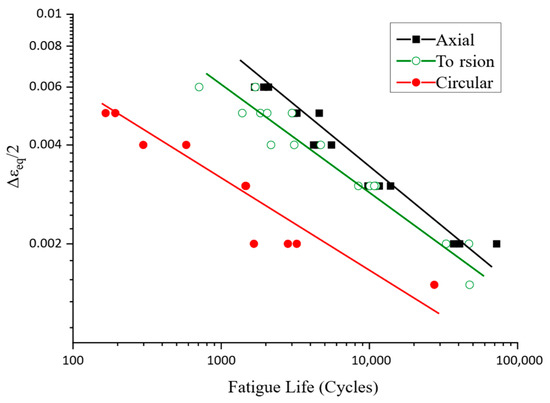
The fatigue data obtained from the constant-amplitude fatigue tests were used to construct strain-life curves for the different load paths. These curves can plot the equivalent strain amplitude against the corresponding fatigue life, as shown in Figure 5 below; the vertical and horizontal axes represent the equivalent strain amplitude and fatigue life, respectively.
Figure 5.
The curves of equivalent strain and fatigue life for different load paths.
From Table 3 and Figure 5, it can be observed that the fatigue lives under the two uniaxial load paths were relatively close. Under the premise of the same equivalent strain, the fatigue life of axial loading was higher than that of torsional loading. The mean differences in fatigue life under the two load paths corresponding to equivalent strain amplitudes of 0.002, 0.003, 0.004, 0.005, and 0.006 were 9948, 1506, 1414, 1366, and 694 cycles, respectively.
In contrast, the circular load path involved multiaxial non-proportional loading where the principal axes of stress and strain can rotate cyclically. This led to the activation of more slip systems within the material, generating fatigue cracks in different directions and locations, and resulted in non-proportional additional strengthening. Consequently, its fatigue life was considerably lower than those under the two uniaxial paths. For equivalent strain amplitudes of 0.002, 0.003, 0.004, and 0.005, the mean differences in fatigue life between the circular path and axial loading were 47,349, 10,138, 4301, and 3457 cycles, respectively; while the differences between the circular path and torsional loading were 37,401, 8632, 2887, and 2091 cycles, respectively.
4.1.2. Variable-Amplitude Fatigue Test Results
Based on the selected two-stage equivalent strain amplitudes and their corresponding mean fatigue lives, variable-amplitude fatigue tests were conducted on the HRB335 specimens. The specific test conditions and their results, as well as the statistical analysis of these results are presented in Table 6. For each load path, four specimens were subjected to fatigue testing. For two specimens, n1 was set to half the mean fatigue life, while for the other two specimens, n1 was set to one quarter of the mean fatigue life.
Table 6.
Fatigue test results under variable-amplitude loading.
Applying the Miner linear cumulative damage theory to analyze the experimental data in Table 6 reveals the following:
(1) For axial and torsional variable-amplitude fatigue tests, when the number of cycles in the first stage was relatively high (approximately 1/2 Nf1), the cumulative damage values were relatively large. For the axial variable-amplitude fatigue tests A1 and A2, the cumulative damage values were 0.99062 and 1.063315, respectively. For the torsional variable-amplitude fatigue tests T1 and T2, the cumulative damage values were 1.074 and 0.77798, respectively.
Conversely, when the number of cycles in the first stage was relatively low (approximately 1/4 Nf1), the cumulative damage values were generally less than 1. For the axial variable-amplitude fatigue tests A1 and A2, the cumulative damage values were 0.685059 and 0.895895, respectively, deviating from 1 by 0.31494 and 0.10411. For the torsional variable-amplitude fatigue tests T1 and T2, the cumulative damage values were 0.61545 and 0.62848, respectively, deviating from 1 by 0.38455 and 0.37152.
(2) For the axial load path, whether the loading sequence was from low strain to high strain (cumulative damage values: 0.99062, 0.685059) or from high strain to low strain (cumulative damage values: 1.074, 0.895895), the cumulative damage values were generally close to 1.
(3) For the torsion load path, the fatigue cumulative damage under high strain → low strain loading was 0.77798 and 0.62848, with both generally below 1. Under low strain → high strain loading, the cumulative damage values were 1.074 and 0.61545, showing significant variation: when the number of cycles in the first-stage loading was approximately 1/2 Nf1, the cumulative damage value was close to 1; however, when the number of cycles in the first-stage loading was approximately 1/4 Nf1, the cumulative damage values were 0.62848 and 0.61545, with both significantly below 1.
(4) For the circular load path under low strain → high strain loading, the fatigue cumulative damage values were 1.220225 and 1.34818, with both greater than 1; conversely, under high strain → low strain loading, the values were 0.940045 and 0.76425, with both less than 1. However, all deviations were relatively small.
4.1.3. Variable-Path Fatigue Tests
This study designed six variable-path loading modes, as shown in Figure 4. The specific test results and the statistical analysis of these results are presented in Table 7. Here, n1 is taken as half of the mean fatigue life.
Table 7.
Fatigue test results under variable-path loading.
From Table 7, it can be observed that, when using the Miner linear cumulative damage theory to calculate the cumulative damage values for two-stage variable-path loading of HRB335, only the results for three specimens exceeded 1, specifically 1.64273, 1.21649, and 1.07566, while the rest were below 1. The mean cumulative damage values for the axial → torsion and torsion → axial variable-path loadings were 1.198595 and 1.081815, respectively, and both were greater than 1. For the axial → circular and torsion → circular variable-path loadings, the mean values were 1.09471 and 0.985155, respectively, which were relatively close to 1. For the circular → axial and circular → torsion variable-path loadings, the mean values were 0.892835 and 0.73937, respectively, with both less than 1. The cumulative damage values under variable-path loading showed less scatter and were relatively closer to 1 compared to those under variable-amplitude loading.
4.2. Model Characterization Analysis
To better reflect the accuracy of each model in predicting the remaining fatigue life, this study employed the following three indicators to evaluate the predictive capability of each model:
① Logarithm Error (LE)
where represents the predicted residual life under the i load path, and is the experimentally measured residual life under the i load path.
This indicator reflected the deviation between the model’s predicted values and the actual measured values. A positive value indicated that the predicted residual life was greater than the measured life, representing a potentially dangerous prediction; conversely, a negative value indicated a conservative estimate. Values in the model’s predictions where the absolute value of LE exceeded 1 correspond to data points in the predicted versus measured residual life comparison plot that fell outside the two-factor range.
② Mean Absolute Logarithm Error (MALE)
This metric reflected the average deviation between the model-predicted remaining fatigue life and the experimentally measured results. A smaller value indicated better overall prediction performance of the model.
③ Symmetric Mean Absolute Percentage Error (sMAPE)
This metric reflected the proportion of the absolute prediction deviation relative to the typical value (i.e., the average of the predicted and actual values). It provided an intuitive indication of the relative deviation between the model predictions and the actual values. A smaller value signified better overall prediction accuracy of the model.
The three prediction errors of the four models are shown in Table 8 and Table 9. Table 8 shows the variable-amplitude loading situation while Table 9 shows the variable-path loading. From these, only LE values with an absolute magnitude greater than 1, i.e., data points falling outside the two-factor range in the residual life prediction plot, were listed.
Table 8.
Prediction errors of residual fatigue life under variable-amplitude loading.
Table 9.
Prediction errors of residual fatigue life under variable-path loading.
4.2.1. Miner Linear Model
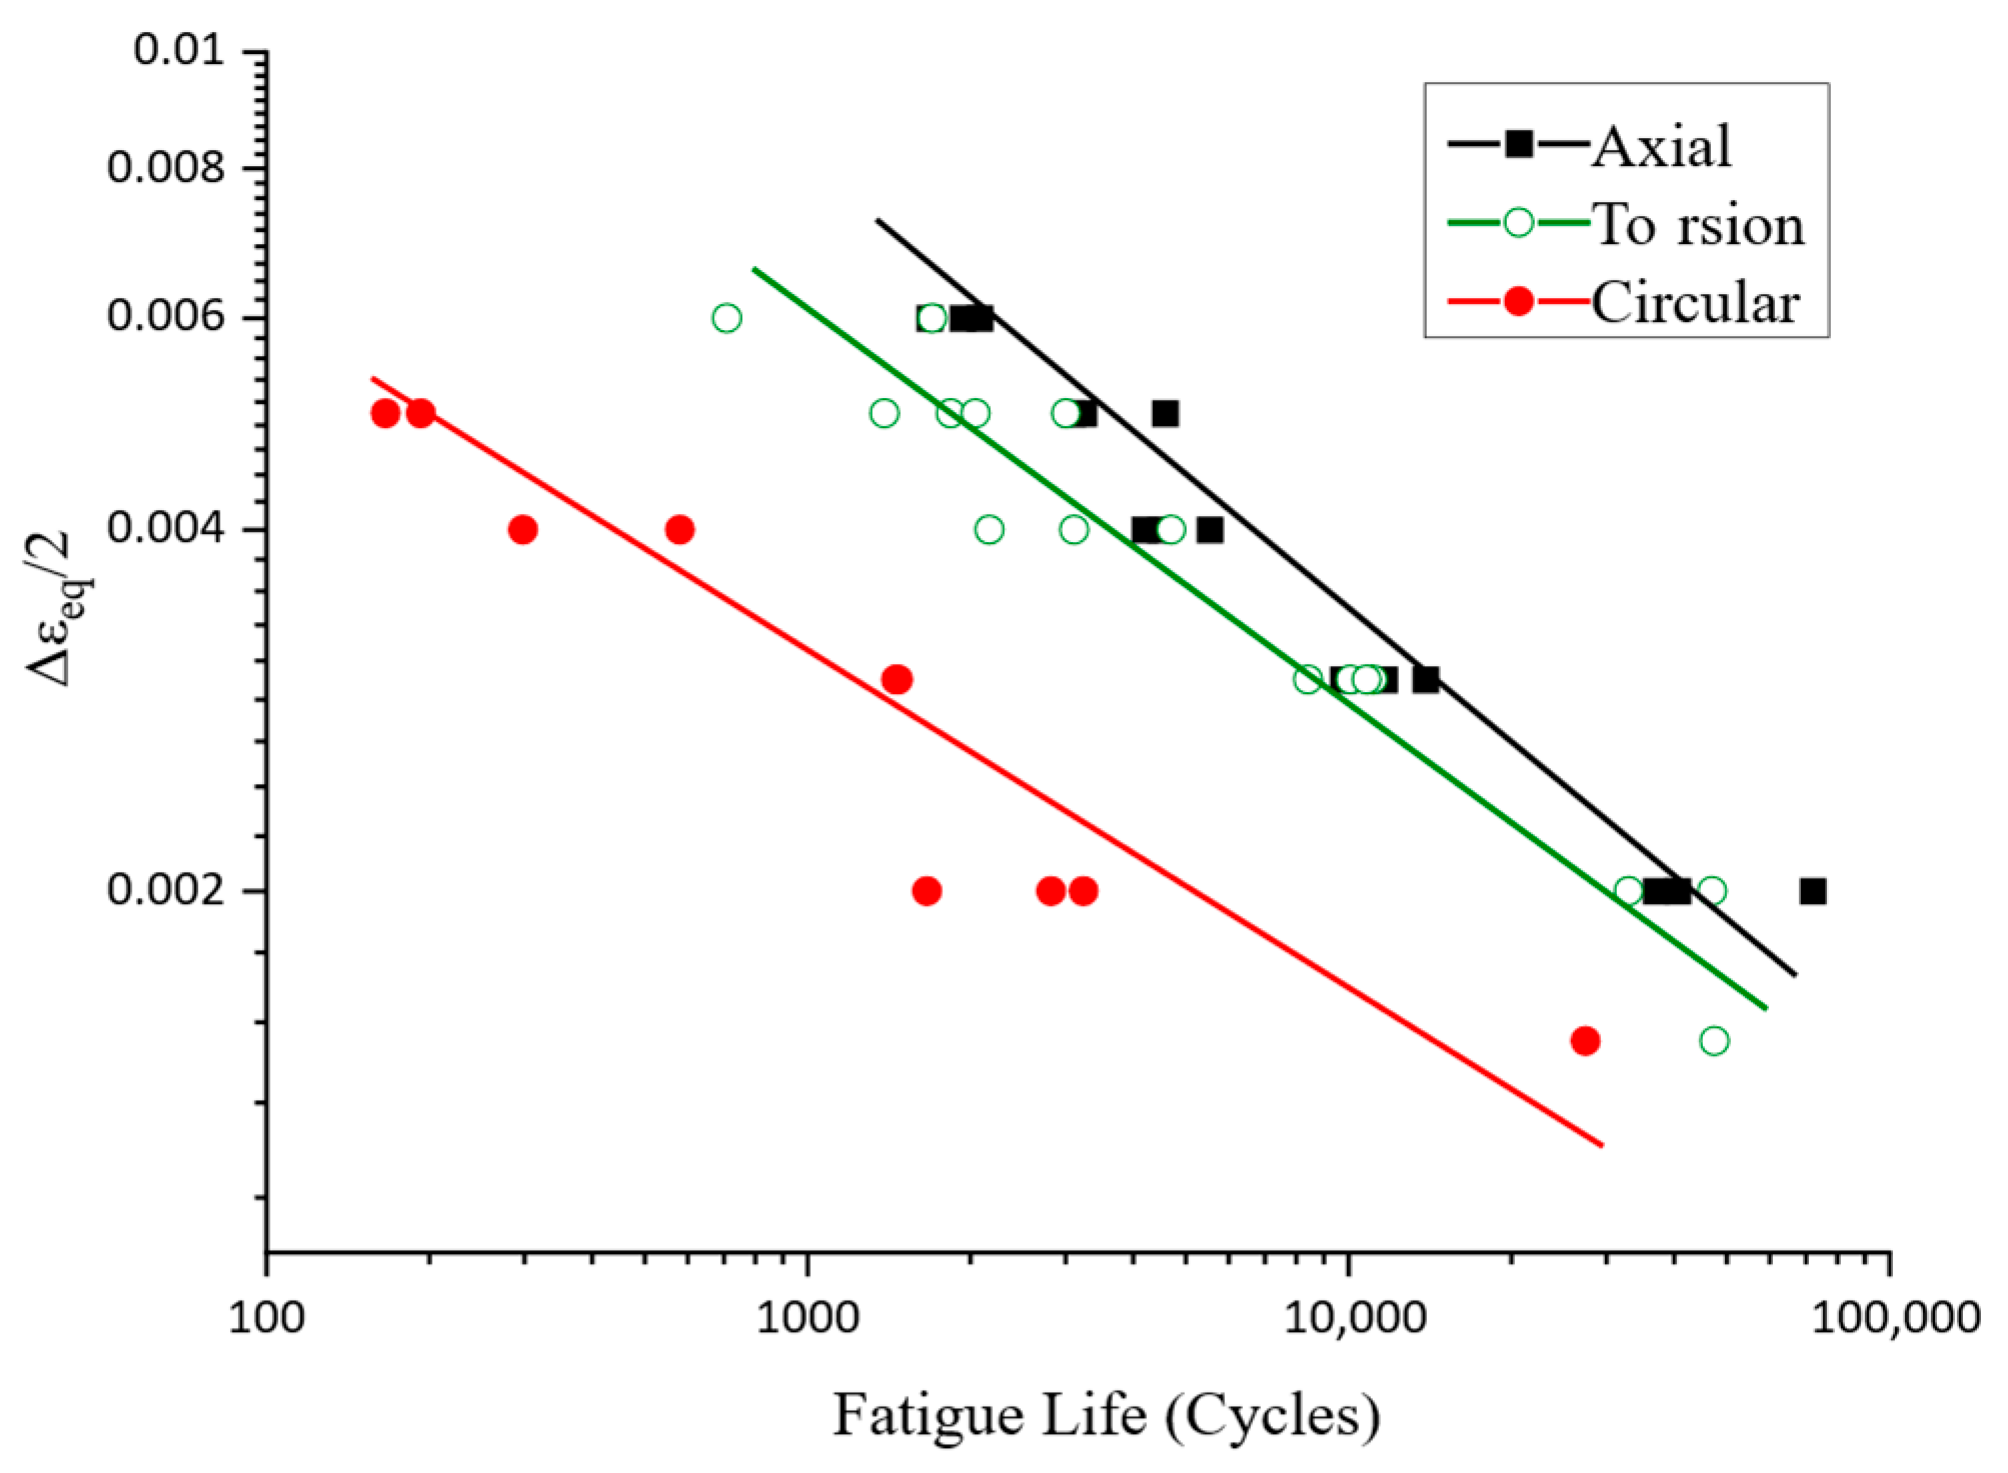
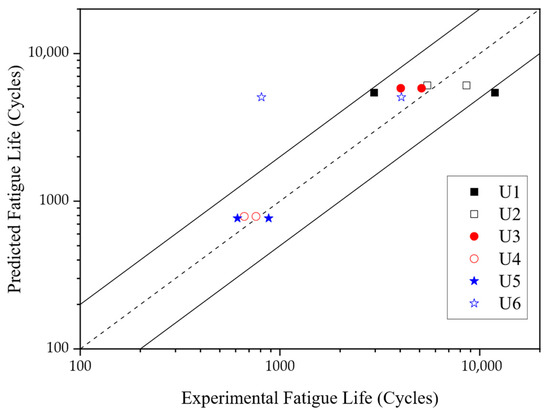
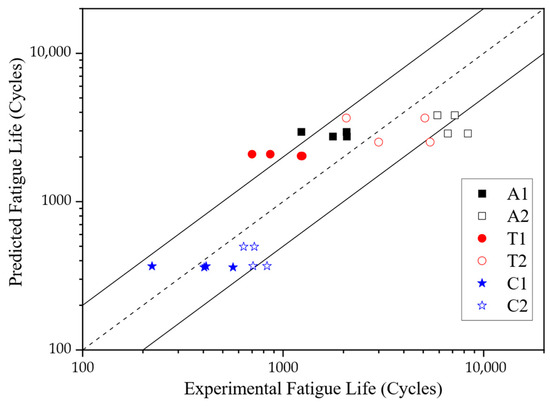
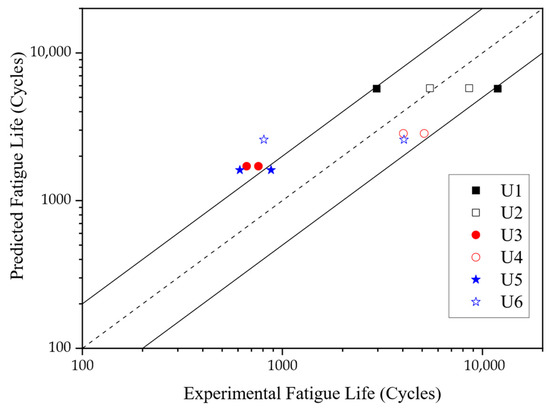
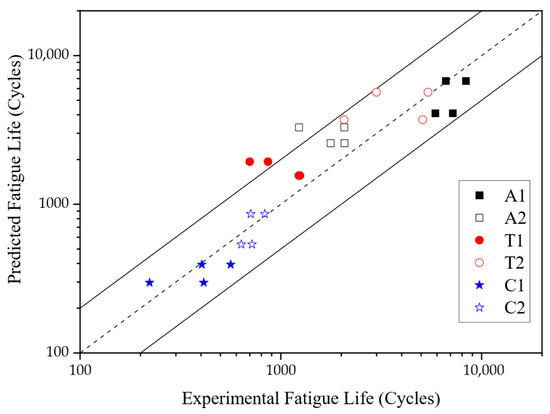
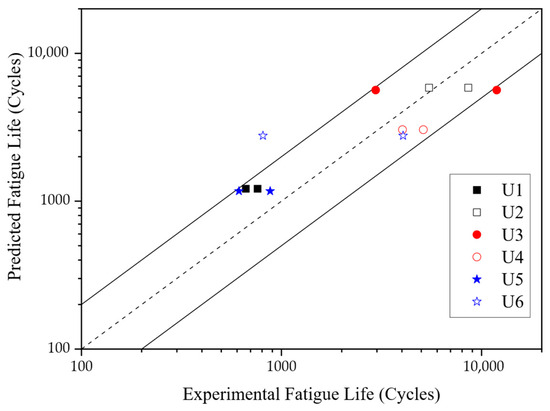
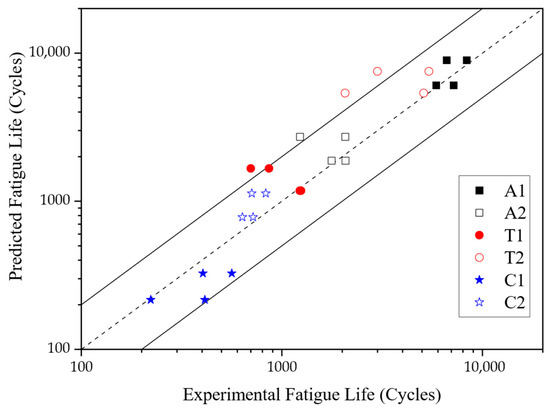
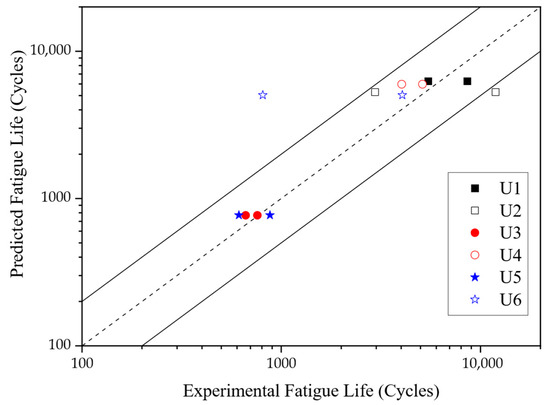
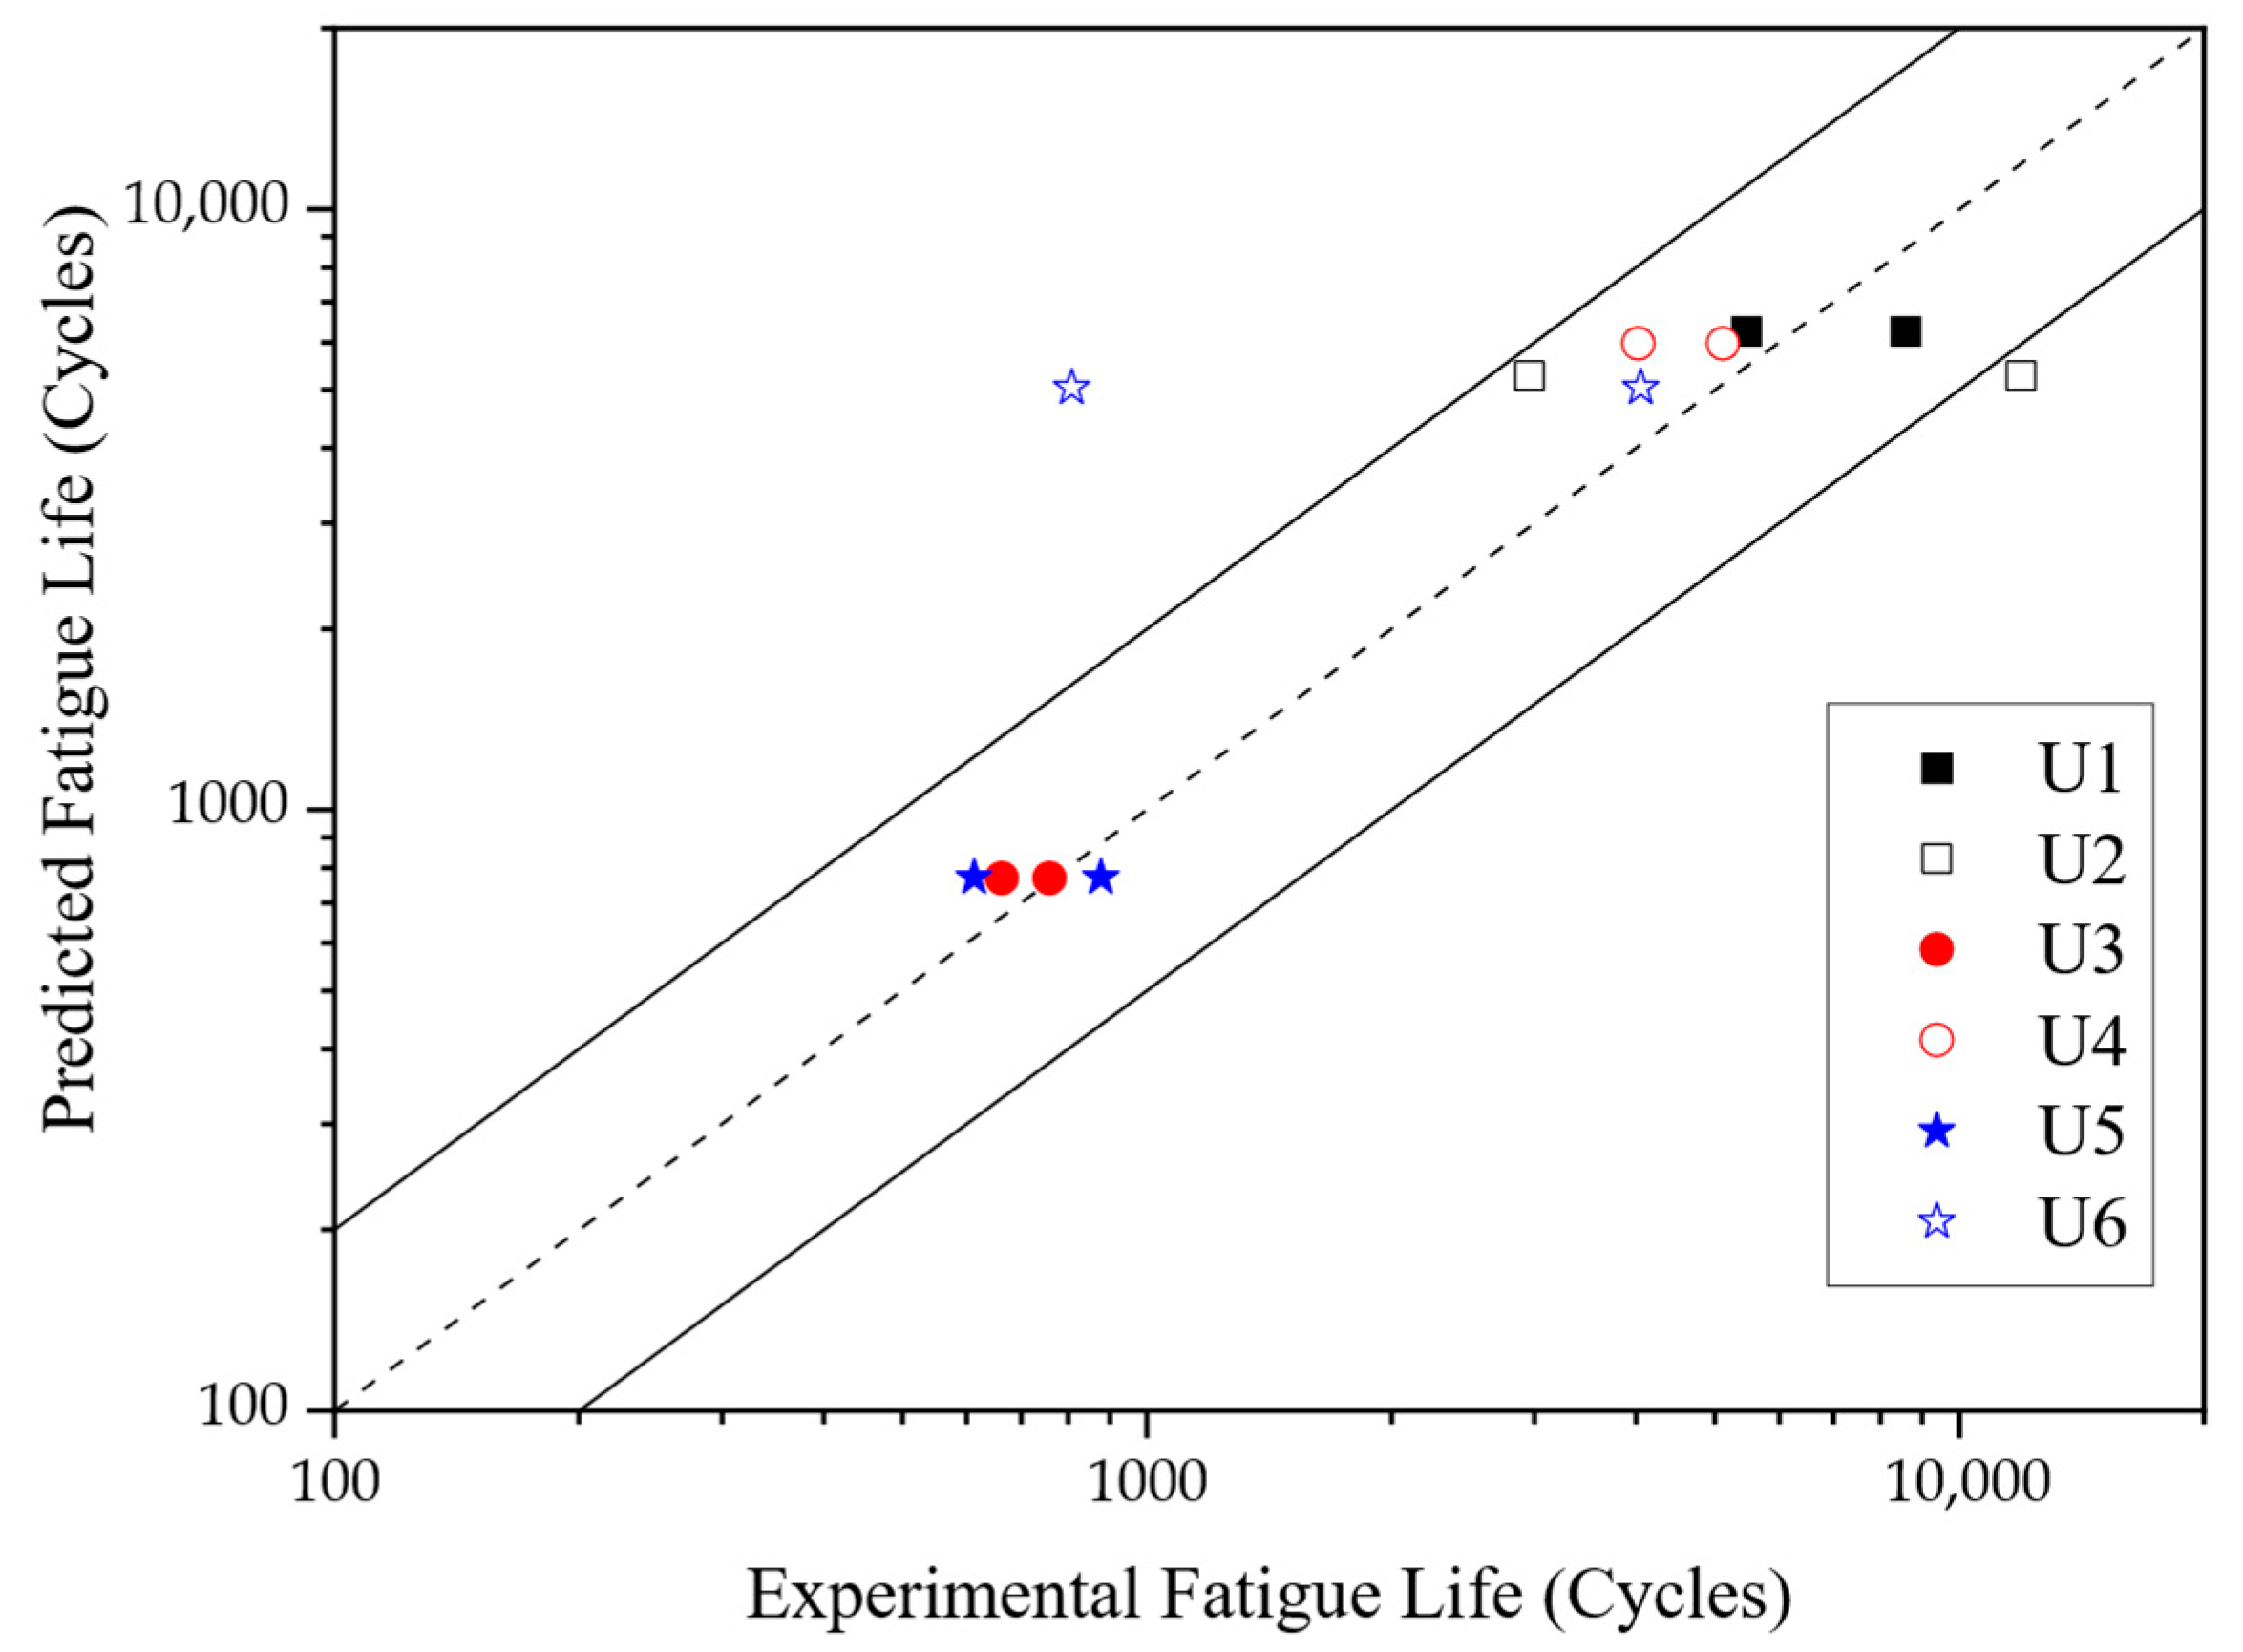
The predicted results based on the Miner linear cumulative damage model were compared with the corresponding experimental values, as shown in Figure 6. In the figure, the vertical and horizontal axes represent the predicted and experimentally measured residual life under the second-stage strain loading, respectively. The dashed line indicates the line of perfect agreement where predictions equal measurements. The region bounded by the two solid lines above and below the dashed line represents the two-factor range, meaning that predictions falling within this region differ from the measured results by no more than a factor of two.
Figure 6.
Prediction of residual life under variable-amplitude loading by Miner model.
Following the Miner linear cumulative damage model, predictions were made for the residual life under the second-stage load path under two-stage variable-path loading conditions. The predicted results were compared with the corresponding experimental measurements, with the comparison is presented in Figure 7.
Figure 7.
Prediction of residual life under variable-path loading by Miner model.
According to the contents of Table 9, when predicting the residual life under variable-path loading, the Miner model yielded one prediction with an LE of 2.6473, indicating a substantial deviation and representing a potentially hazardous, i.e., non-conservative, estimate.
4.2.2. Bilinear Model
Following the Bilinear cumulative damage model, predictions were made for the residual life under the second-stage load path under both variable-amplitude and variable-path loading conditions. The predicted results were then compared with the corresponding experimental measurements. The comparisons are presented in Figure 8 (for variable-amplitude loading) and Figure 9 (for variable-path loading). In Figure 8 and Figure 9, the vertical and horizontal axes represent the predicted residual life under the second-stage strain loading and the experimentally measured residual life for that stage, respectively.
Figure 8.
Prediction of residual life under variable-amplitude loading by Bilinear model.
Figure 9.
Prediction of residual life under variable-path loading by Bilinear model.
The sMAPE and MALE values for the Bilinear model were higher than those of the Miner model, indicating greater dispersion in its predictions. Furthermore, there were a considerable number of data points where the absolute value of LE exceeded 1, encompassing both positive and negative values, which suggested that the predictive performance of this model was not ideal.
4.2.3. Manson Model
According to the Manson nonlinear cumulative damage model, predictions were made for the residual life under the second-stage load path under both variable-amplitude and variable-path loading conditions. The predicted results were then compared with the measured results, as shown in Figure 10 and Figure 11, respectively.
Figure 10.
Prediction of residual life under variable-amplitude loading by Manson model.
Figure 11.
Prediction of residual life under variable-path loading by Manson model.
The sMAPE and MALE values of the Manson model were higher than those of the Miner model, indicating greater dispersion in its prediction results. However, the number of data points with an absolute LE value greater than 1 was smaller than that of the Miner model, and the maximum absolute LE value was also lower. This suggested that the Manson model provided better control over extreme prediction deviations, although its overall results exhibited higher dispersion.
4.2.4. Tensile Factor Model
Using Equation (9), the residual life under the second-stage load path for both variable-amplitude and variable-path conditions was calculated and compared with the experimentally measured results, as shown in Figure 12 and Figure 13, respectively.
Figure 12.
Prediction of residual life under variable-amplitude loading by stretching factor model.
Figure 13.
Prediction of residual life under variable-path loading by stretching factor model.
The sMAPE and MALE values for the Tensile Factor model were slightly lower than those of the Miner model, suggesting relatively better predictive performance. The number of data points with an absolute LE value exceeding 1 was consistent with that of the Miner model, and the maximum absolute LE value was also marginally smaller. This demonstrated that the overall prediction accuracy of the Tensile Factor model was superior to that of the Miner model.
4.2.5. Comparison of Prediction Results
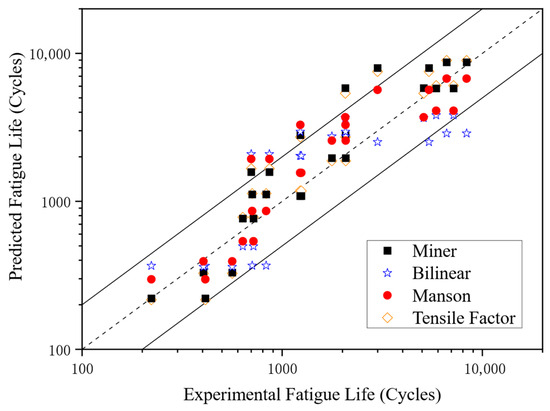
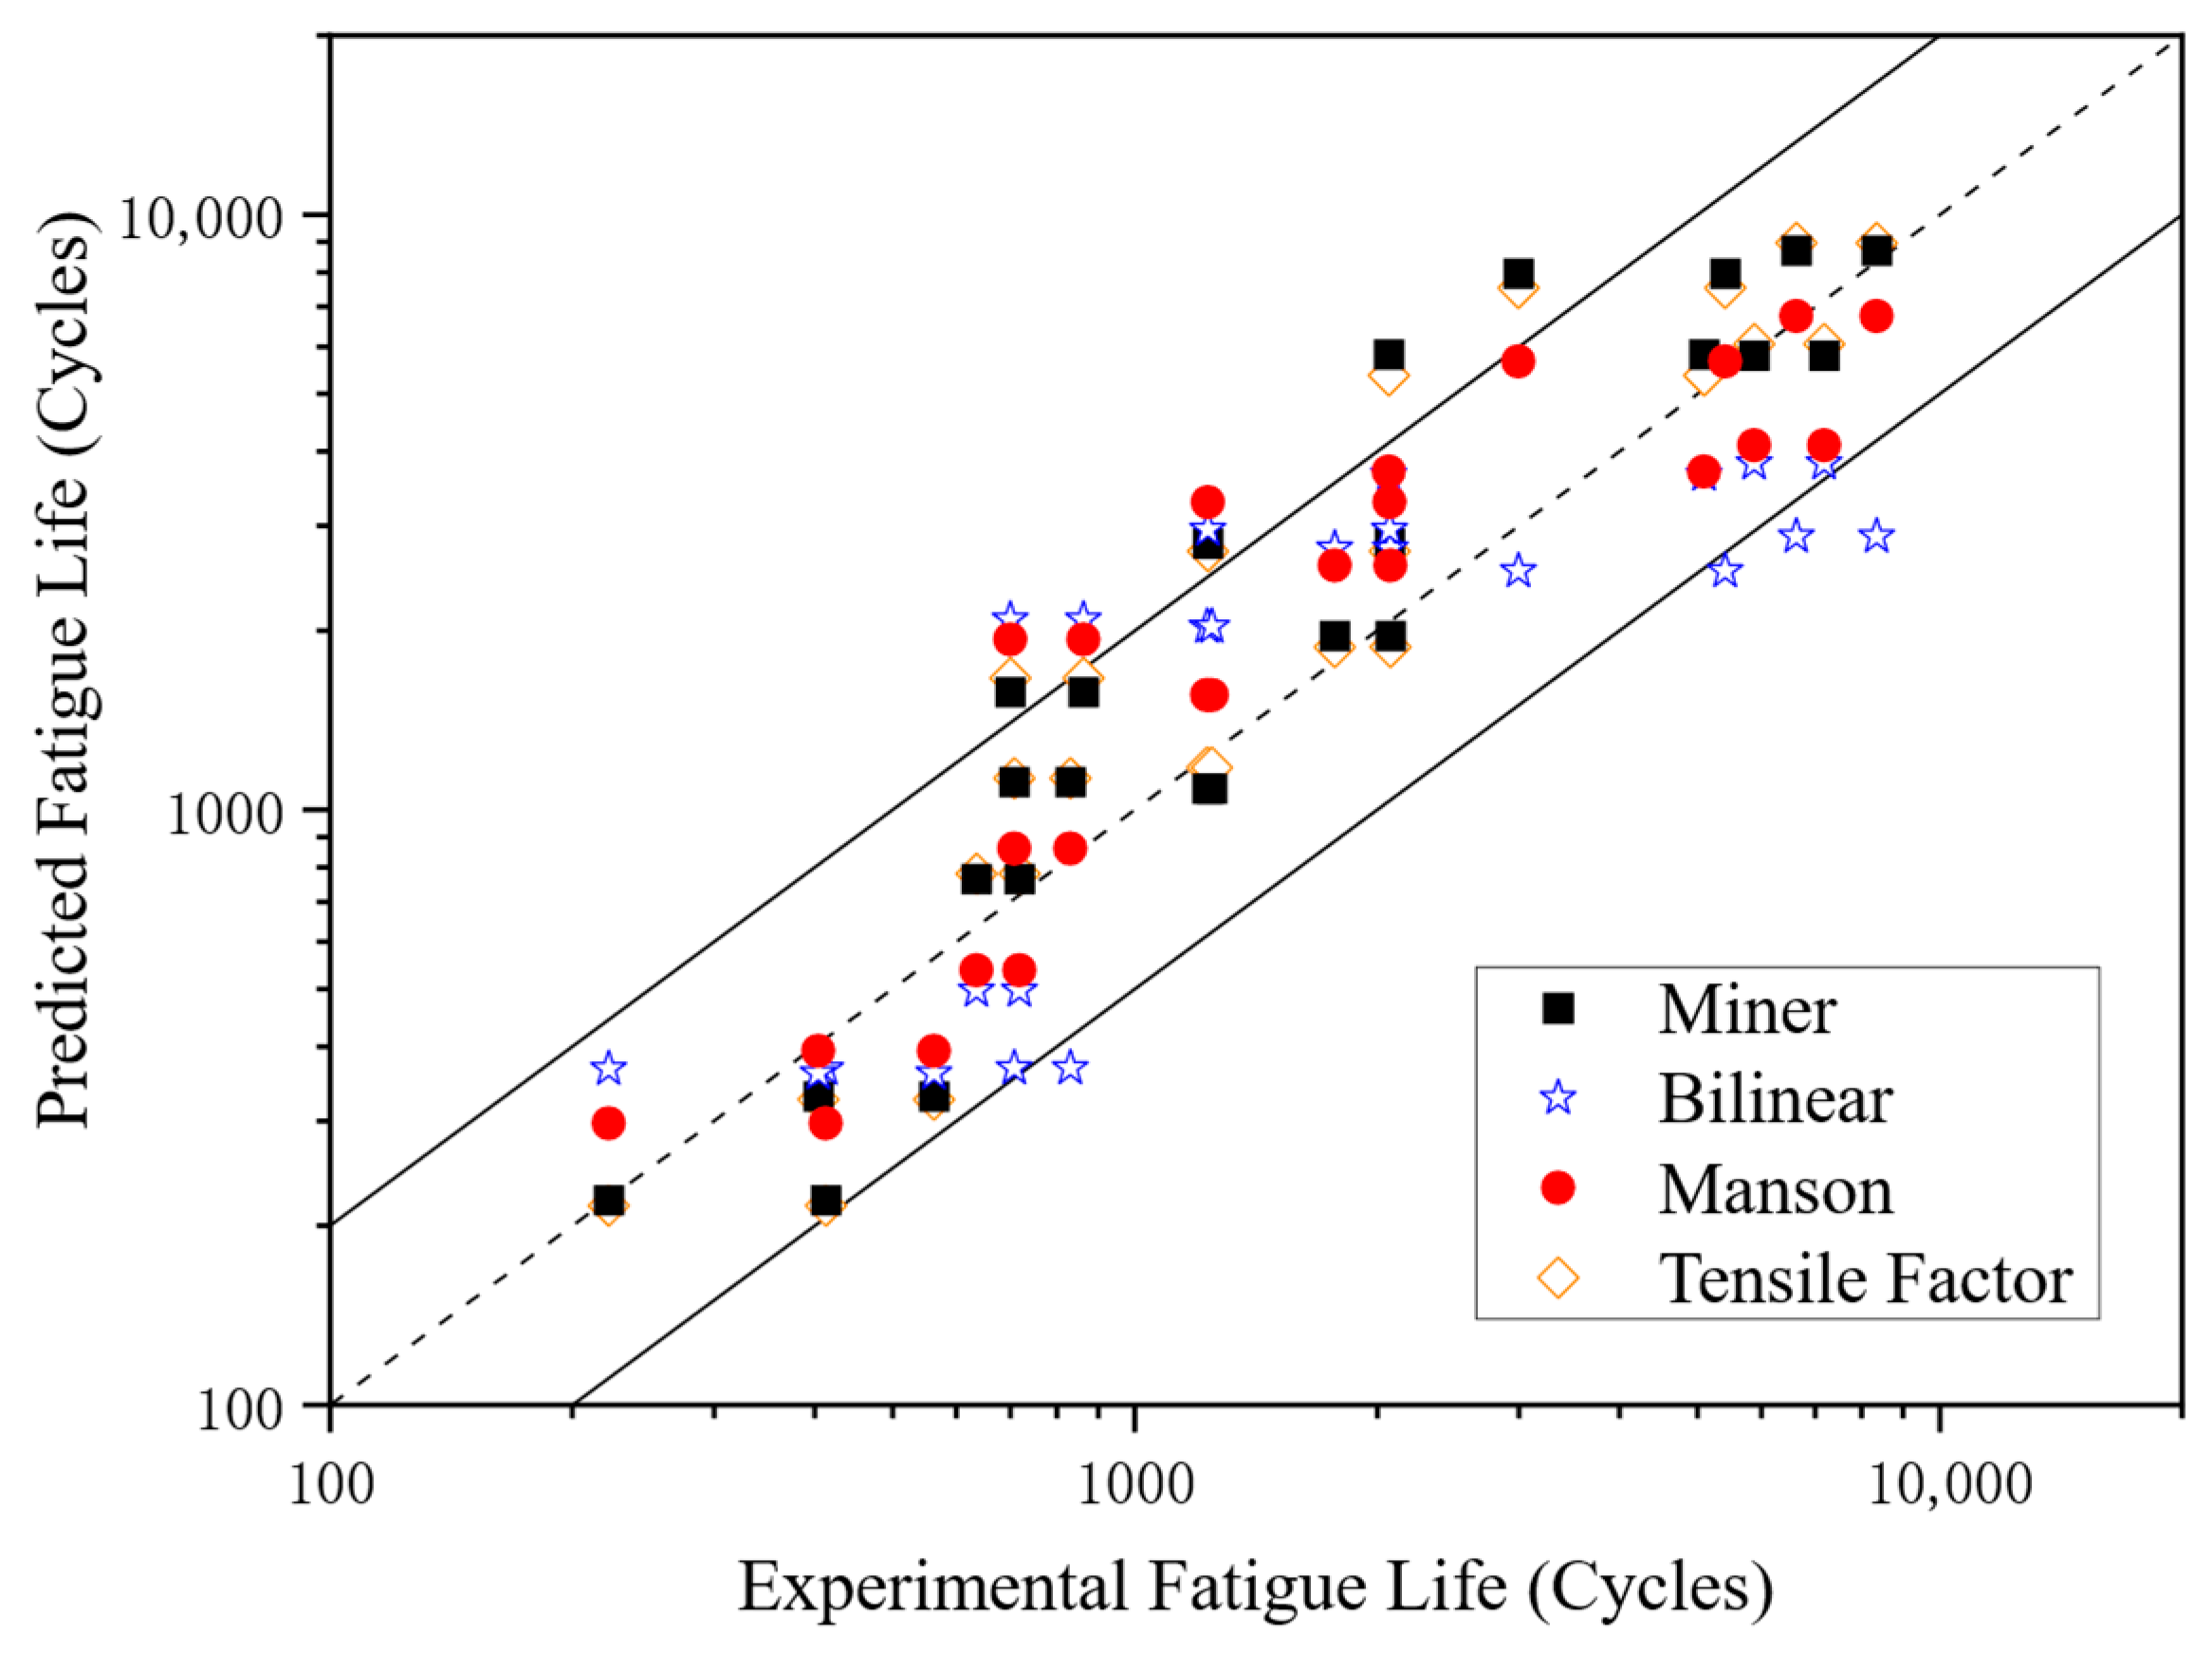
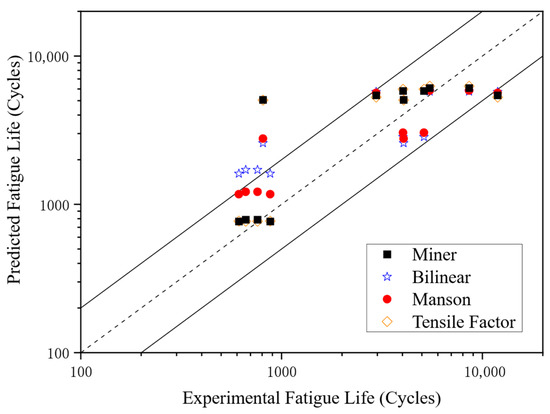
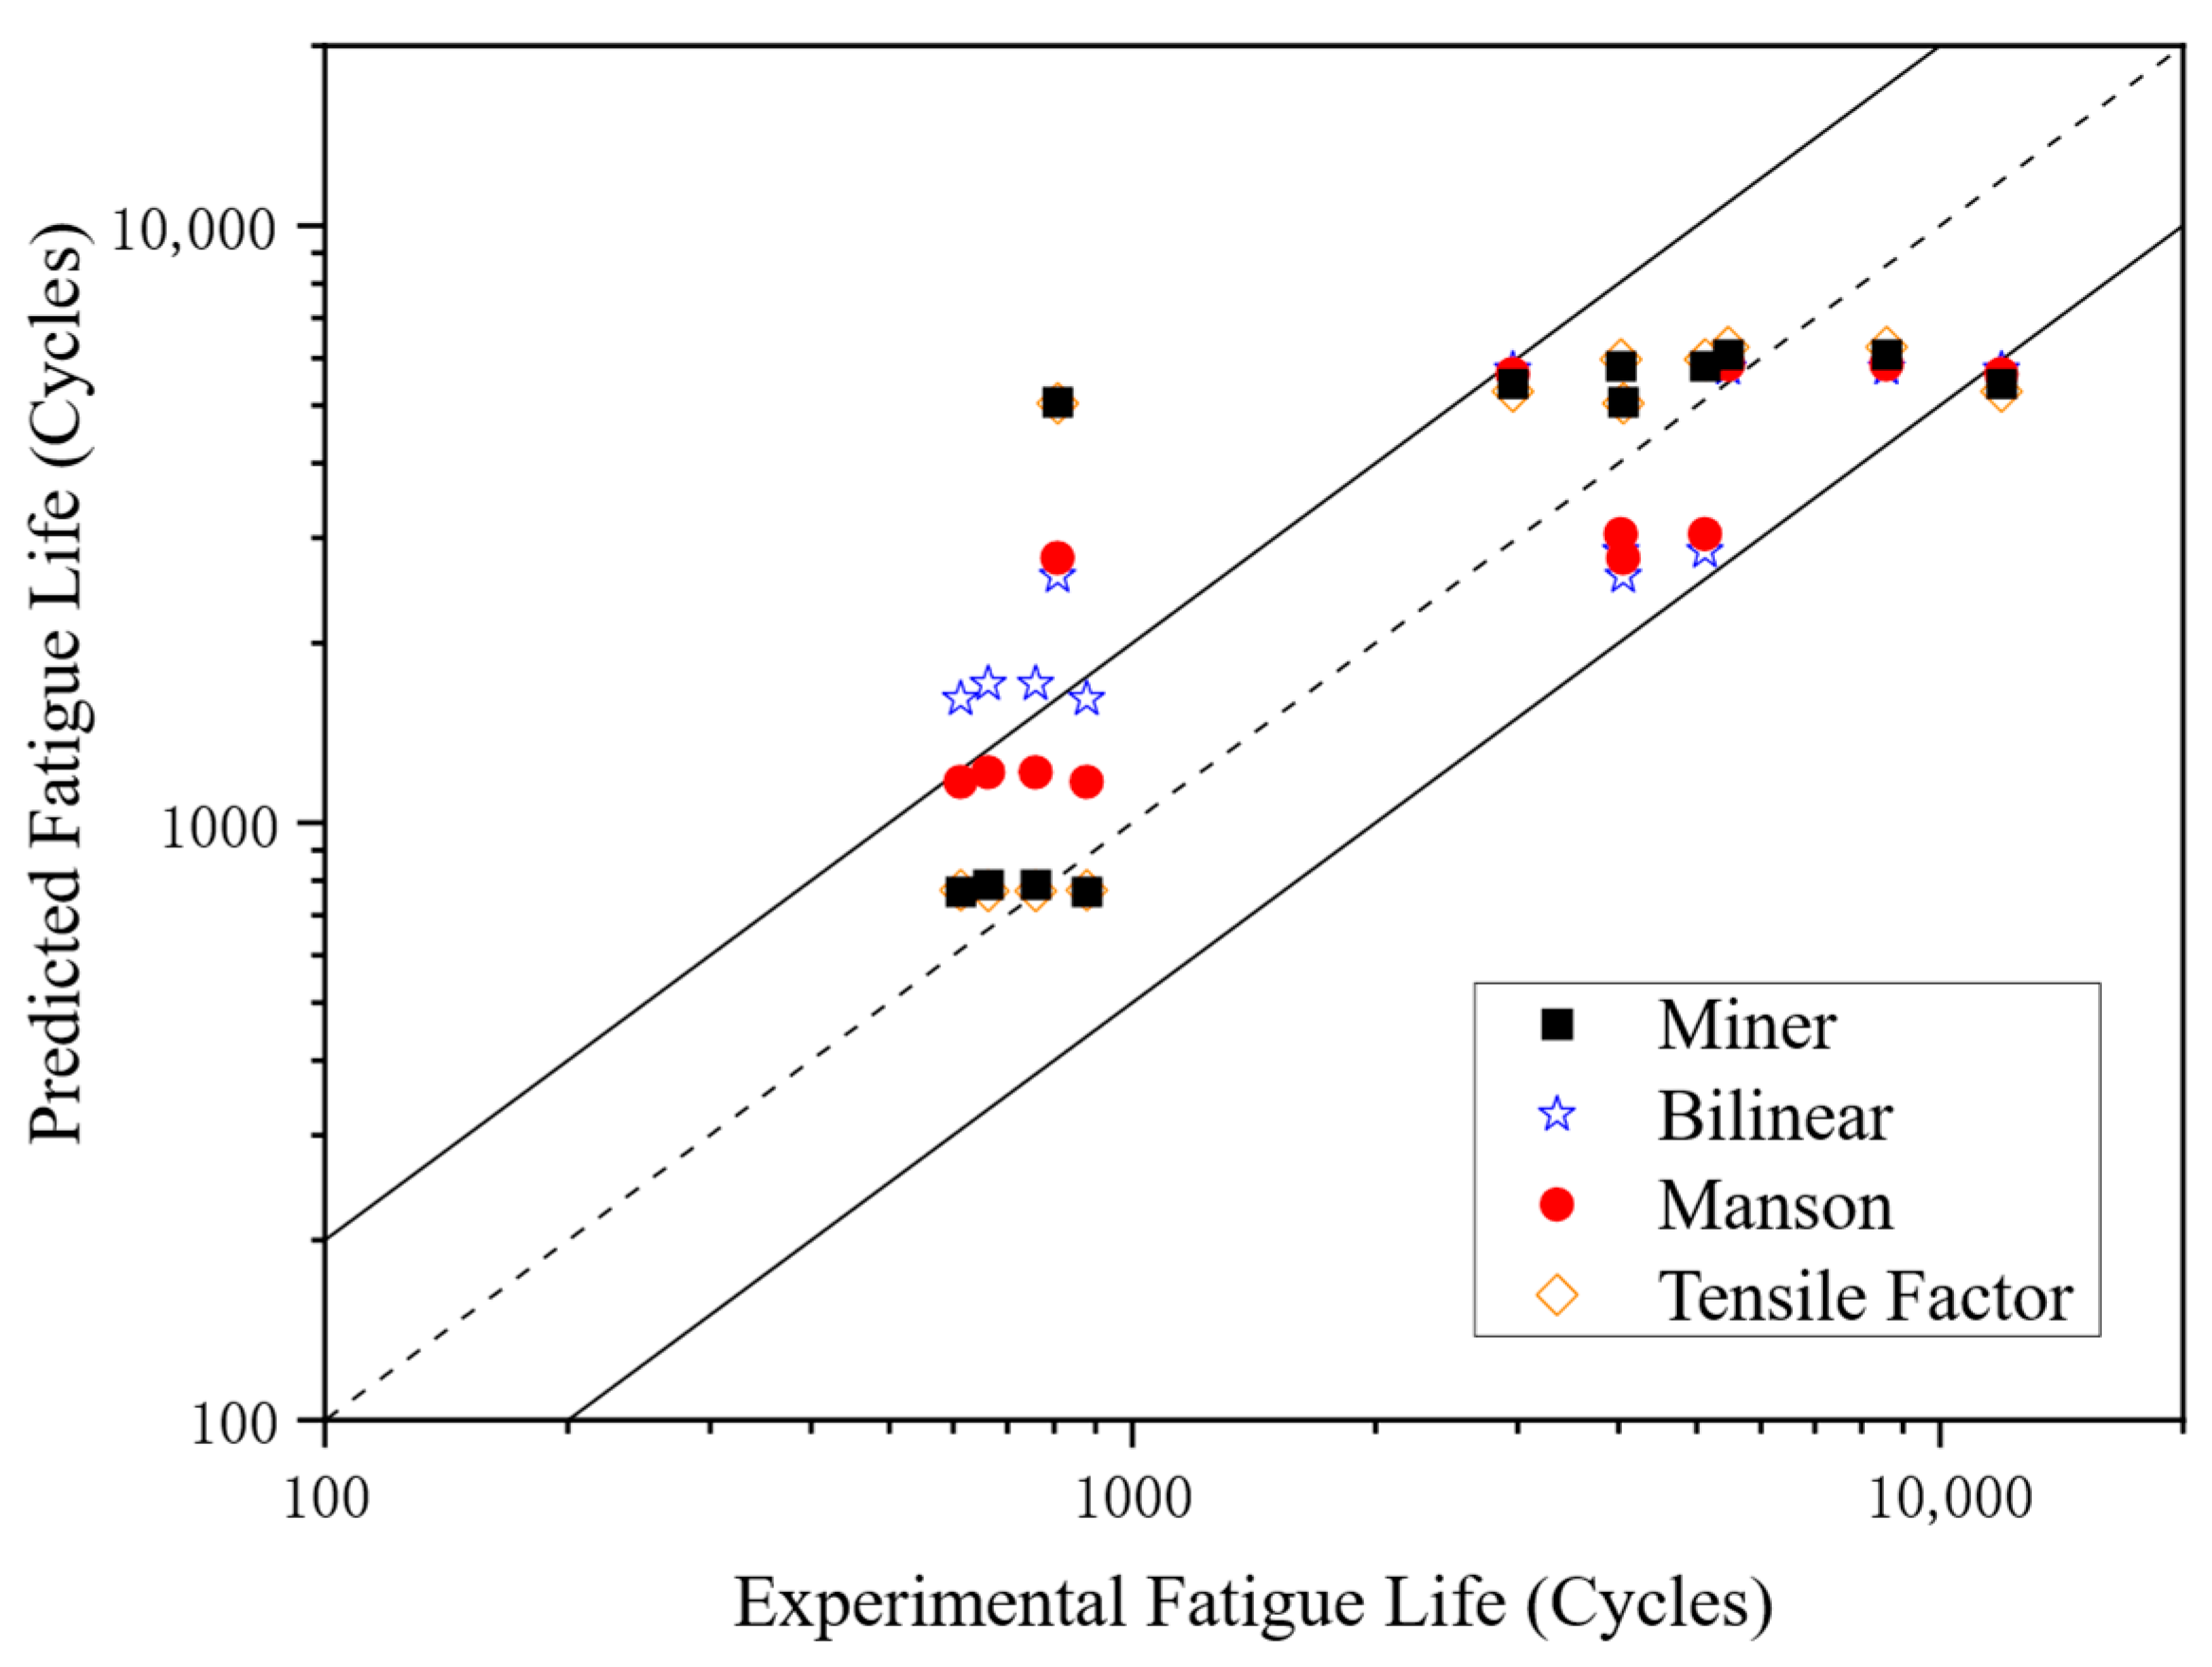
The predicted results of the remaining fatigue life under variable-amplitude and variable-path loading conditions from the aforementioned four models were summarized in Figure 14 and Figure 15, respectively.
Figure 14.
Prediction of residual life under variable-amplitude loading by 4 models.
Figure 15.
Prediction of residual life under variable-path loading by four models.
Based on Figure 14 and Figure 15, as well as the error data of each model, the following observations can be made:
(1) The predictions of the Miner model and the Tensile Factor model were relatively close. For variable-amplitude loading, most of the predicted remaining fatigue lives from both models fell within the two-factor range, with only a few points lying outside this range, yet the deviations were not significant. Under variable-path loading, however, both models yielded one prediction point that fell outside the two-factor range with a considerable deviation; this point corresponded to the loading condition of circular path → torsion path.
(2) The predictions of the Bilinear model were unsatisfactory under both variable-amplitude and variable-path loading conditions, showing significant scatter with numerous prediction points falling outside the two-factor range.
(3) In comparison, the prediction error metrics sMAPE and MALE for the Manson model were slightly larger than those of the Miner and Tensile Factor models. However, the Manson model performed better for data points where the predictions of the Miner and Tensile Factor models deviated more substantially from the measured values, demonstrating a certain corrective capability for extreme deviations. Overall, the Manson model yielded the best prediction results.
5. Conclusions
This study focused on the fatigue life assessment of HRB335 under two-stage variable-amplitude and variable-path loading at room temperature. Multiaxial fatigue tests involving variable amplitudes and variable paths were conducted on HRB335. Based on the experimental results, the applicability of several commonly used fatigue cumulative damage models for describing the material’s fatigue damage accumulation behavior under variable-amplitude and variable-path loading conditions was compared and analyzed. The following conclusions were drawn:
(1) Under the same von Mises equivalent strain amplitude, the fatigue life of HRB335 material under torsion loading was lower than that under axial loading, whereas the fatigue life under circular loading was significantly lower than that under either of the two uniaxial load paths (axial and torsion).
(2) For variable-amplitude loading, the Miner model, Manson model, and Tensile Factor model can all yield relatively good predictions of the residual life. Although some deviations existed in the predictions, they were not substantial. In contrast, the predictions of the Bilinear model were more scattered, with a larger number of results showing deviations and lower accuracy.
(3) For variable-path loading conditions, by comparing the prediction results it can be observed that the Manson nonlinear model yielded the best predictions, followed by the Miner model and the Tensile Factor model, while the Bilinear model performed poorly.
Author Contributions
Writing the draft, S.Q. and S.H.; data curation, S.Q., S.H. and C.L.; writing—review and editing, S.Q.; methodology, S.Q. and S.H.; supervision, S.Q. All authors have read and agreed to the published version of the manuscript.
Funding
This research was supported by the Guangxi First-Class Discipline Statistics Construction Project Fund, and Guangxi Philosophy and Social Sciences Foundation (25GJB039). Supported by the funding of “Construction of High-level Discipline Team for Environmental Safety and Governance” from the School of Management Science and Engineering, Guangxi University of Finance and Economics.
Data Availability Statement
The data are available from the corresponding author on reasonable request.
Conflicts of Interest
The authors declare no conflicts of interest.
References
- Pagliari, L.; Concli, F. A Review of Multiaxial Low-Cycle Fatigue Criteria for Life Prediction of Metals. Int. J. Damage Mech. 2025, 34, 377–414. [Google Scholar] [CrossRef] [Scilit]
- Zhang, L.; Wang, G.; Ji, X.; Zhang, S.; Lei, H. Study on Axial Fatigue Performance and Life Prediction of High-Strength Bolts at Low Temperatures. Buildings 2024, 14, 2615. [Google Scholar] [CrossRef] [Scilit]
- Zang, J.; Yang, Z.; Sun, M.; Li, Z.; Wang, Y.; Ye, S. Simulation-Based Microstructural Analysis of Thermal–Mechanical Fatigue Behavior in Sicp/A356 Composites for Brake Disc Applications. J. Mater. Sci. 2024, 59, 650–668. [Google Scholar] [CrossRef] [Scilit]
- Muniz-Calvente, M.; Alvarez-Vazquez, A.; Pelayo, F.; Aenlle, M.; Garcia-Fernandez, N.; Lamela-Rey, M.J. A Comparative Review of Time- and Frequency-Domain Methods for Fatigue Damage Assessment. Int. J. Fatigue 2022, 163, 107069. [Google Scholar] [CrossRef] [Scilit]
- Bjorheim, F.; Siriwardane, S.C.; Pavlou, D. A Review of Fatigue Damage Detection and Measurement Techniques. Int. J. Fatigue 2022, 154, 106556. [Google Scholar] [CrossRef] [Scilit]
- Li, J.; Li, X.L.; Wang, R.; Lu, Z.Y. Comparative Analysis and Evaluation of the Commonly-Used Fatigue Life Prediction Models under Various Multiaxial Loadings. Strength Fract. Complex. 2025, 18, 76–85. [Google Scholar] [CrossRef] [Scilit]
- Hussain, H.; Kim, D.-K. Low Cyclic Fatigue Properties and Cyclic Constitutive Modeling of Ss275 Steel for Seismic Applications. Buildings 2025, 15, 3997. [Google Scholar] [CrossRef] [Scilit]
- Ge, X.; Zhang, C.; Sun, M.; Liu, C.; An, X. Enhanced Equivalent Strain Damage Model Predicting Multiaxial Non-Proportional Metal Fatigue Life. J. Constr. Steel Res. 2025, 235, 109787. [Google Scholar] [CrossRef] [Scilit]
- Chen, F.; Hua, L.; Zhang, J. The Deterioration of Low-Cycle Fatigue Properties and the Fatigue Life Model of Reinforcing Steel Bars Subjected to Corrosion. Buildings 2025, 15, 3313. [Google Scholar] [CrossRef] [Scilit]
- Aeran, A.; Acosta, R.; Siriwardane, S.C.; Starke, P.; Mikkelsen, O.; Langen, I.; Walther, F. A Nonlinear Fatigue Damage Model: Comparison with Experimental Damage Evolution of S355 (Sae 1020) Structural Steel and Application to Offshore Jacket Structures. Int. J. Fatigue 2020, 135, 105568. [Google Scholar] [CrossRef] [Scilit]
- Wang, H.; Qin, S.; Wang, Y. Nonlinear Cumulative Damage Model and Application to Bridge Fatigue Life Evaluation. Adv. Struct. Eng. 2018, 21, 1402–1408. [Google Scholar] [CrossRef] [Scilit]
- Santecchia, E.; Hamouda, A.M.S.; Musharavati, F.; Zalnezhad, E.; Cabibbo, M.; El Mehtedi, M.; Spigarelli, S. A Review on Fatigue Life Prediction Methods for Metals. Adv. Mater. Sci. Eng. 2016, 2016, 9573524. [Google Scholar] [CrossRef] [Scilit]
- Zakaria, K.A.; Abdullah, S.; Ghazali, M.J. A Review of the Loading Sequence Effects on the Fatigue Life Behaviour of Metallic Materials. J. Eng. Sci. Technol. Rev. 2016, 9, 189–200. [Google Scholar] [CrossRef] [Scilit]
- Shamsaei, N.; Gladskyi, M.; Panasovskyi, K.; Shukaev, S.; Fatemi, A. Multiaxial Fatigue of Titanium Including Step Loading and Load Path Alteration and Sequence Effects. Int. J. Fatigue 2010, 32, 1862–1874. [Google Scholar] [CrossRef] [Scilit]
- Rusnati, L.; Minerva, G.; Patriarca, L.; Miccoli, S.; Beretta, S. Comparison of Methods for the Determination of Fatigue Critical Flaw Size and Implementation for Probabilistic Fatigue Assessment. Int. J. Fatigue 2026, 203, 109252. [Google Scholar] [CrossRef] [Scilit]
- Li, W.; Xiang, Z.; Li, H.; Ren, Z.; Wang, J. Study on the Prediction Model of the Intrinsic Damage Dissipation Life of Two-Stage Variable Amplitude Strain Fatigue. Chin. J. Theor. Appl. Mech. 2024, 56, 149–156. [Google Scholar] [CrossRef]
- Mei, J.; Dong, P. Modeling of Path-Dependent Multi-Axial Fatigue Damage in Aluminum Alloys. Int. J. Fatigue 2017, 95, 252–263. [Google Scholar] [CrossRef] [Scilit]
- Luo, R.K. Effective Strain Criterion under Multimode and Multiaxial Loadings—A Rubber Sn Curve with the Scatter-Band Factor of 1.6 from 90 Fatigue Cases. Express Polym. Lett. 2022, 16, 130–141. [Google Scholar] [CrossRef] [Scilit]
- Si, Q.; Ding, Y.; Zong, L.; Liu, H. Mechanical Properties and Simulation Method of Structural Steel after High Cycle Fatigue Damage. Adv. Steel Constr. 2023, 19, 70–76. [Google Scholar] [CrossRef] [Scilit]
- Huang, S.; Liu, G.; Tan, J.; Zhang, X.; Zhang, K. Research on Cumulative Damage of Q235 Steel under Low Cycle Fatigue. J. Guangxi Univ. (Nat. Sci. Ed.) 2018, 43, 10. [Google Scholar] [CrossRef]
- Liu, Y.; Xue, Q. A Continuous Damage Fatigue Cumulative Damage Model Based on Load Sequence Correction. Mech. Res. Appl. 2023, 36, 41–43. [Google Scholar] [CrossRef]
- Wang, L.; Tian, L.; Guo, J.; Zhang, Q.; Zheng, J.; Huang, H. Fatigue Damage Study of Reinforced Concrete T-Beam Bridge Considering Bearing Defect. Buildings 2025, 15, 1169. [Google Scholar] [CrossRef] [Scilit]
- Liu, Z.; Liu, Y.; Zhou, J.; Bai, X.; Ye, N. An Enhanced Fatigue Damage Model Based on Weibull Strength Distribution. Fatigue Fract. Eng. Mater. Struct. 2024, 47, 2552–2569. [Google Scholar] [CrossRef] [Scilit]
- Xia, T.; Yao, W.; Xu, L. Comparative Research on Accumulative Damage Models under Multiaxial 2-Stage Step Loading Spectra for Ly12cz Aluminium Alloy. J. Aeronaut. Mater. 2014, 34, 86–92. [Google Scholar] [CrossRef]
- Khan, S.U.; Alderliesten, R.C.; Benedictus, R. Linear Damage Accumulation for Predicting Fatigue in Fiber Metal Laminates. J. Aircr. 2009, 46, 1706–1713. [Google Scholar] [CrossRef] [Scilit]
- Rejovitzky, E.; Altus, E. On Single Damage Variable Models for Fatigue. Int. J. Damage Mech. 2013, 22, 268–284. [Google Scholar] [CrossRef] [Scilit]
- Marhadi, K.; Venkataraman, S. Comparison of Quantitative and Qualitative Information Provided by Different Structural Load Path Definitions. Int. J. Simul. Multidiscip. Des. Optim. 2009, 3, 384–400. [Google Scholar] [CrossRef] [Scilit]
- Qin, S.; Zhao, G.; Shuai, T.; Zhang, K. Improved Critical Plane Model for Multiaxial Fatigue Life Prediction of Hrb335 Steel. Mater. Mech. Eng. 2021, 45, 47–54, 61. [Google Scholar] [CrossRef]
- Miner, M.A. Cumulative Damage in Fatigue. J.Appl. Mech. Trans.Asme 1945, 67, A159–A164. [Google Scholar] [CrossRef] [Scilit]
- Manson, S.S.; Halford, G.R. Practical Implementation of the Double Linear Damage Rule and Damage Curve Approach for Treating Cumulative Fatigue Damage. Int. J. Fract. 1981, 17, 169–192. [Google Scholar] [CrossRef] [Scilit]
- Manson, S.S.; Halford, G.R. Re-Examination of Cumulative Fatigue Damage Analysis—An Engineering Perspective. Eng. Fract. Mech. 1986, 25, 539–571. [Google Scholar] [CrossRef] [Scilit]
- Xia, T.; Yao, W. Comparative Research on the Accumulative Damage Rules under Multiaxial Block Loading Spectrum for 2024-T4 Aluminum Alloy. Int. J. Fatigue 2013, 48, 257–265. [Google Scholar] [CrossRef] [Scilit]
- Risitano, A.; Risitano, G. Cumulative Damage Evaluation in Multiple Cycle Fatigue Tests Taking into Account Energy Parameters. Int. J. Fatigue 2013, 48, 214–222. [Google Scholar] [CrossRef] [Scilit]
- Brown, M.W.; Miller, K. A Theory for Fatigue Failure under Multiaxial Stress-Strain Conditions. Proc. Inst. Mech. Eng. 1973, 187, 745–755. [Google Scholar] [CrossRef] [Scilit]
- Zhang, X.; Zhang, K.; Huang, S.; Gu, S. Experimental Research on Life Evaluation for Low Cycle Multiaxial Fatigue of Q235 Steel. J. Guangxi Univ. (Nat. Sci. Ed.) 2013, 38, 982–990. [Google Scholar] [CrossRef]
- Kanazawa, K.; Miller, K.J.; Brown, M.W. Low-Cycle Fatigue under out-of-Phase Loading Conditions. J. Eng. Mater. Technol. 1977, 99, 222–228. [Google Scholar] [CrossRef] [Scilit]

Disclaimer/Publisher’s Note: The statements, opinions and data contained in all publications are solely those of the individual author(s) and contributor(s) and not of MDPI and/or the editor(s). MDPI and/or the editor(s) disclaim responsibility for any injury to people or property resulting from any ideas, methods, instructions or products referred to in the content. |
© 2026 by the authors. Licensee MDPI, Basel, Switzerland. This article is an open access article distributed under the terms and conditions of the Creative Commons Attribution (CC BY) license.