Article

Spatiotemporal Interactive Effects Between Thermal Comfort and Acoustic Quality on University Students’ Performance and Satisfaction in Hong Kong


1
Department of Building Environment and Energy Engineering, The Hong Kong Polytechnic University, Hong Kong, China
2
Healthy Living Spaces, RWTH Aachen University, 52072 Aachen, Germany
*
Author to whom correspondence should be addressed.
Buildings 2026, 16(3), 670; https://doi.org/10.3390/buildings16030670
Submission received: 24 December 2025 / Revised: 3 February 2026 / Accepted: 3 February 2026 / Published: 5 February 2026

Abstract

This study investigated the individual and interactive effects of thermal and acoustic parameters on university students’ concentration and satisfaction in a library environment. Measurements of temperature, relative humidity (RH), and sound pressure level (SPL), alongside questionnaire surveys assessing students’ concentration, environmental perceptions, and satisfaction, were conducted over ten continuous working days in four library rooms. The results revealed significant interactive effects between operative temperature (To), RH, and background noise level (LA90) on students’ concentration and overall satisfaction, highlighting the importance of an integrated approach to managing Indoor Environmental Quality (IEQ). Furthermore, multi-objective optimization using the NSGA-II algorithm suggested optimal ranges for To (22.6–24.8 °C), RH (41.0–48.4%), and LA90 (45.0–48.5 dB(A)). Existing library conditions surpassed these optimal levels, particularly on the first floor, indicating a pressing need for interventions to enhance student well-being and academic performance. Overall, this study provides insights into the interactions between thermal comfort and acoustic quality, offering recommendations for creating more conducive learning environments that boost student satisfaction and performance.

1. Introduction

Indoor Environmental Quality (IEQ) plays a crucial role in shaping the comfort, health, and performance of occupants in educational settings [1]. Among the various dimensions of IEQ, thermal comfort and acoustic quality are particularly significant for student satisfaction and learning outcomes and, thus, are given higher weights in overall environment evaluations [2,3]. Many studies reported that an uncomfortable thermal environment can impair students’ health and academic performance [4,5], while poor acoustic quality often leads to decreased cognitive function and diminished well-being [6,7]. Thus, optimizing these environmental factors is essential for fostering enhanced educational experiences.
Apart from the individual impacts of these two aspects, recent studies have started to examine the combined effects [8] and interactive effects [9,10] of thermal comfort and acoustic quality, demonstrating that these components do not function in isolation. The interplay between them can significantly influence occupants’ thermal sensation, acoustic perceptions, and/or overall comfort [11,12,13]. For example, Guan et al. [14] reported a significant combined effect between sound levels and temperature on occupants’ overall comfort, but not on thermal comfort or acoustic comfort. This underscores the distinction between combined and interactive effects: combined effects refer to the overall influence of both factors, while interactive effects focus on how one factor may enhance or diminish the influence of the other. Thus, considering the interaction between these two variables is essential for a comprehensive understanding of their impact on occupants.
Despite the growing recognition of these interactions, several limitations still exist. First, many studies have been conducted in controlled laboratory settings or through theoretical models, which leaves a gap in understanding the interactions between thermal and acoustic quality in real-world settings [15,16,17,18,19]. This gap is particularly pronounced in studies focusing on learning environments. Furthermore, most previous studies on interactive effects have mainly examined either environmental perceptions or comfort, while occupant performance was rarely investigated [20]. Considering the individual effects of IEQ factors on occupants’ performance and the interactions between these factors on occupants’ perceptions, it is plausible to suppose that the interactive effects between acoustic quality and thermal comfort might also influence students’ performance in learning spaces.
To address this hypothesis and identify optimal learning environments, the present study explores the interactive effects of thermal comfort and acoustic quality on university students’ performance and satisfaction. Focusing on a university library is particularly relevant due to its critical role as a study environment where students spend extensive hours and researchers have easy access. This setting makes it an ideal starting point for examining the interactive effects of IEQ on occupants. Moreover, university students also tend to be more willing to participate in academic research, allowing for direct assessment of how these interactions impact occupants who rely heavily on effective learning environments. By investigating this real-world setting with actual occupants, this research aims to provide valuable insights that can inform the design and management of educational spaces. Ultimately, the goal is to enhance students’ well-being and improve educational outcomes.

2. Materials and Methods

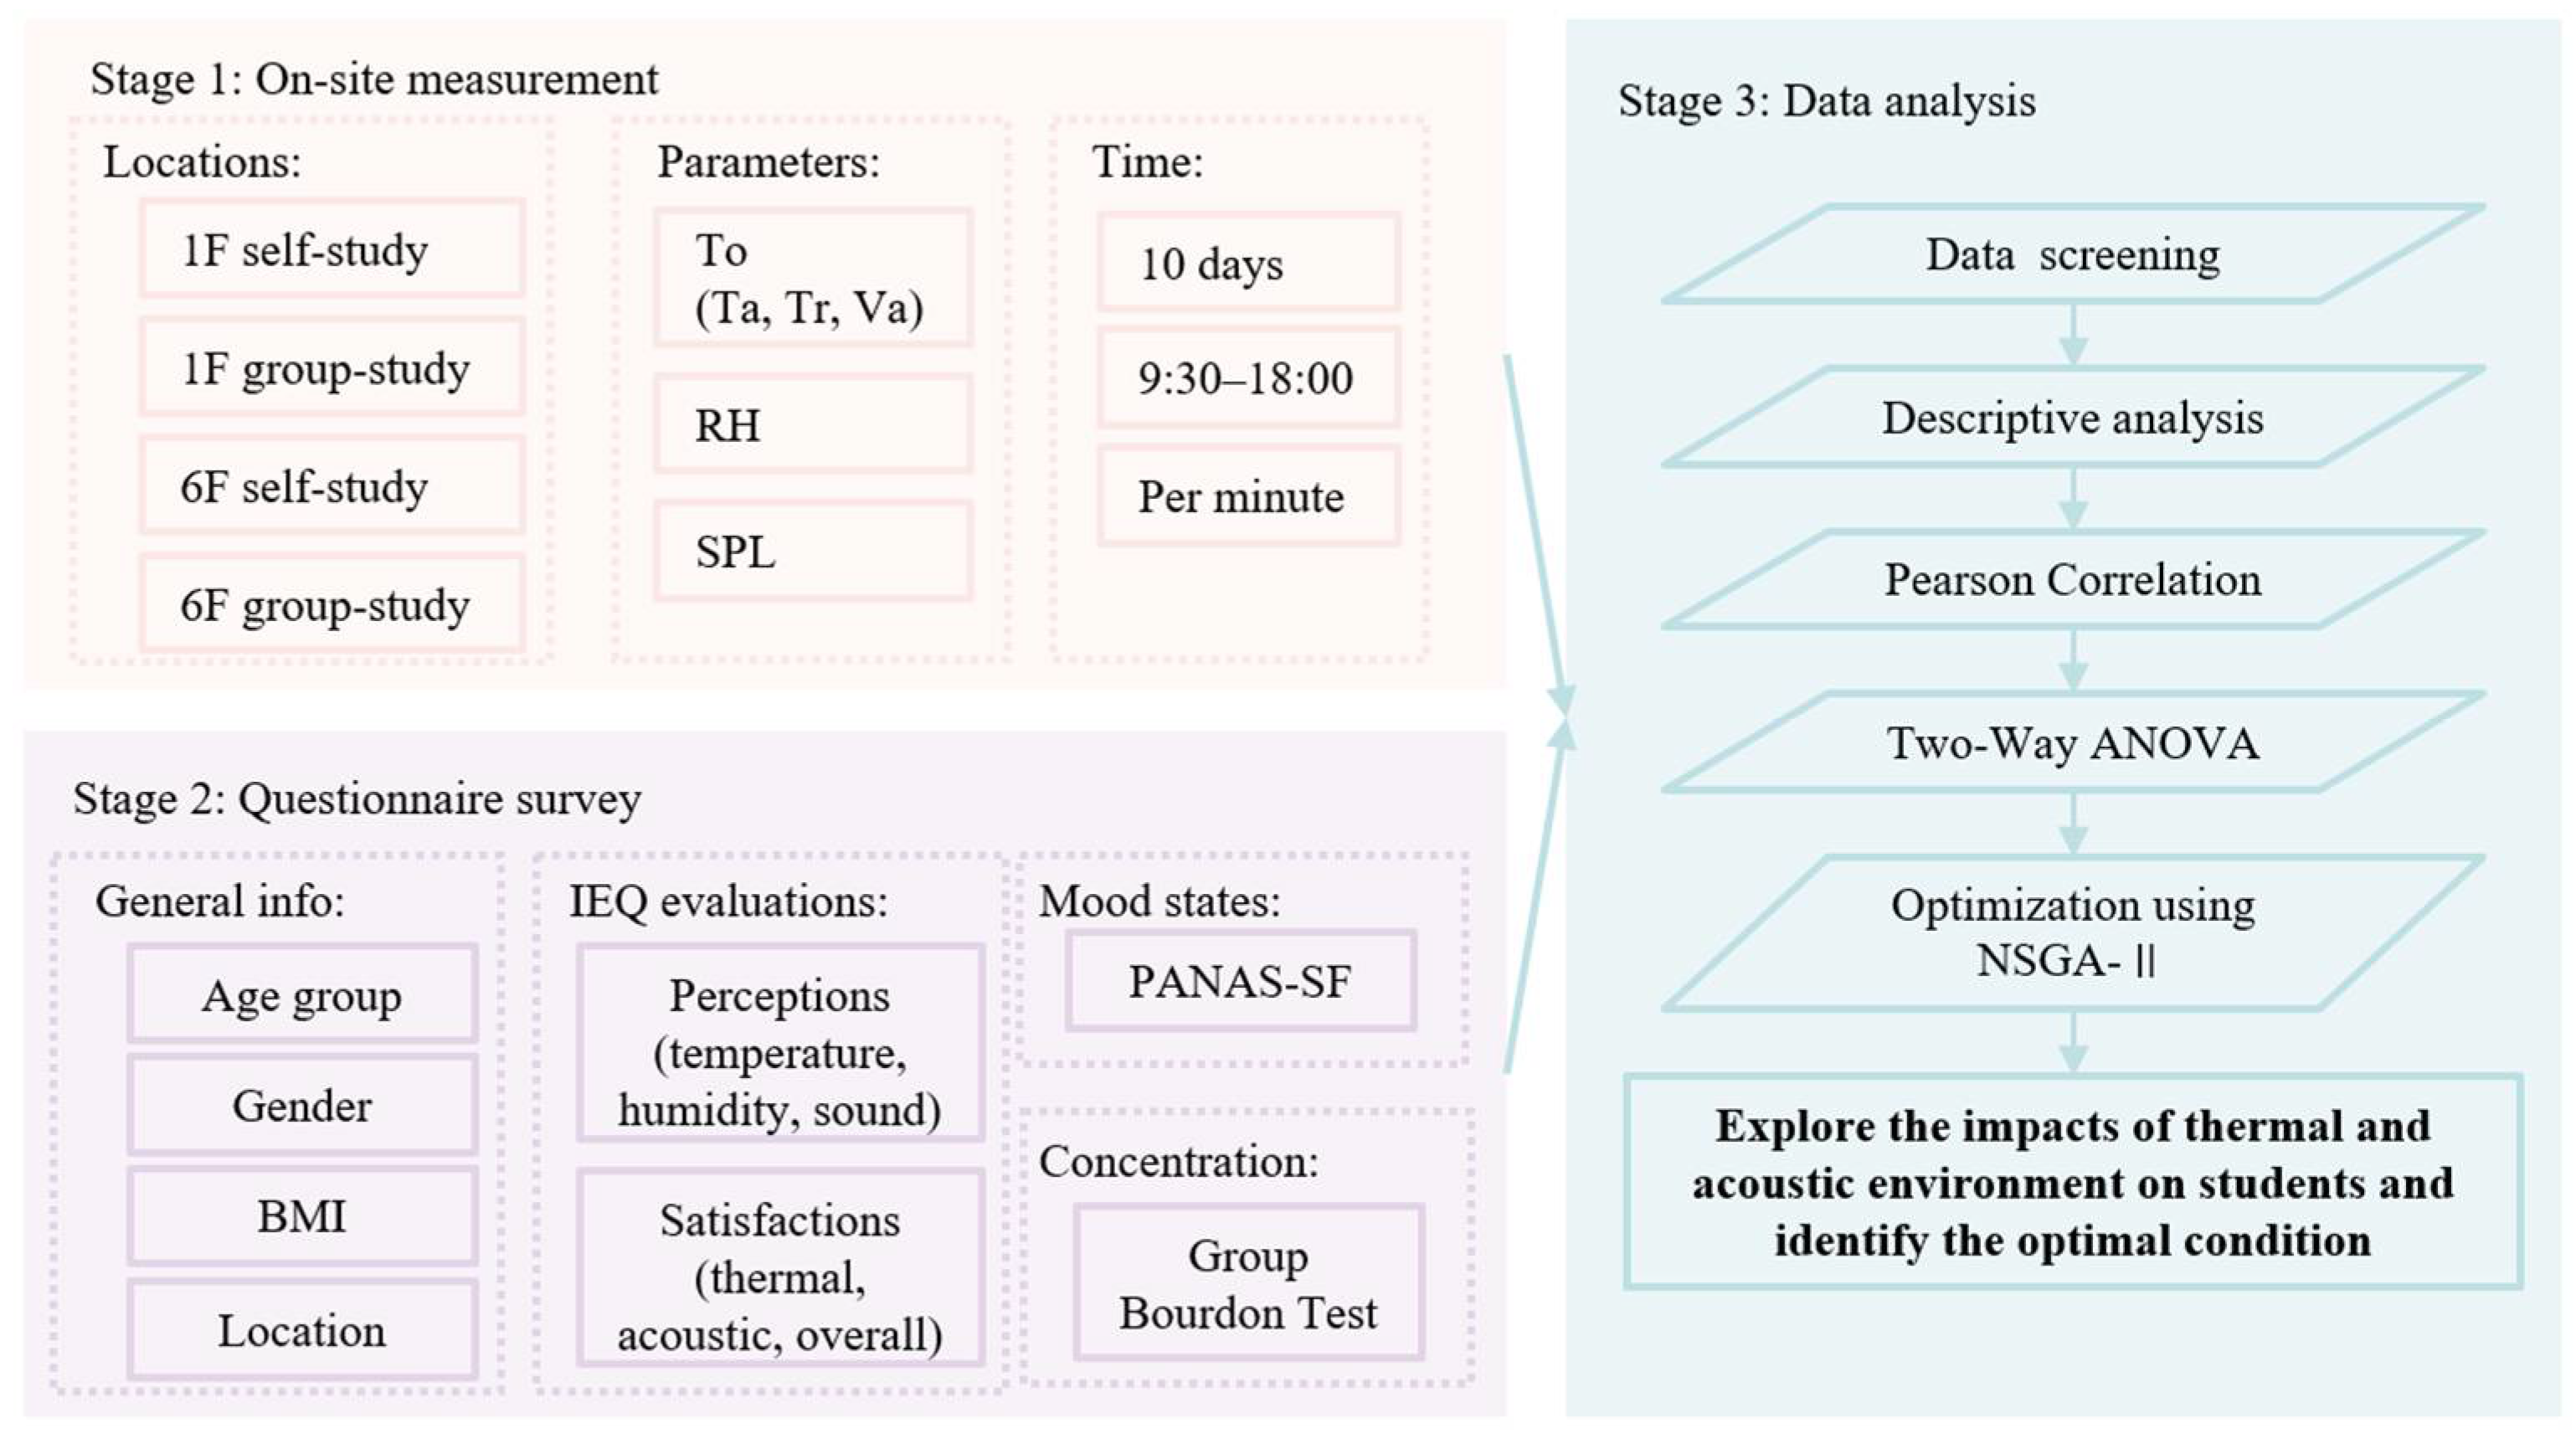
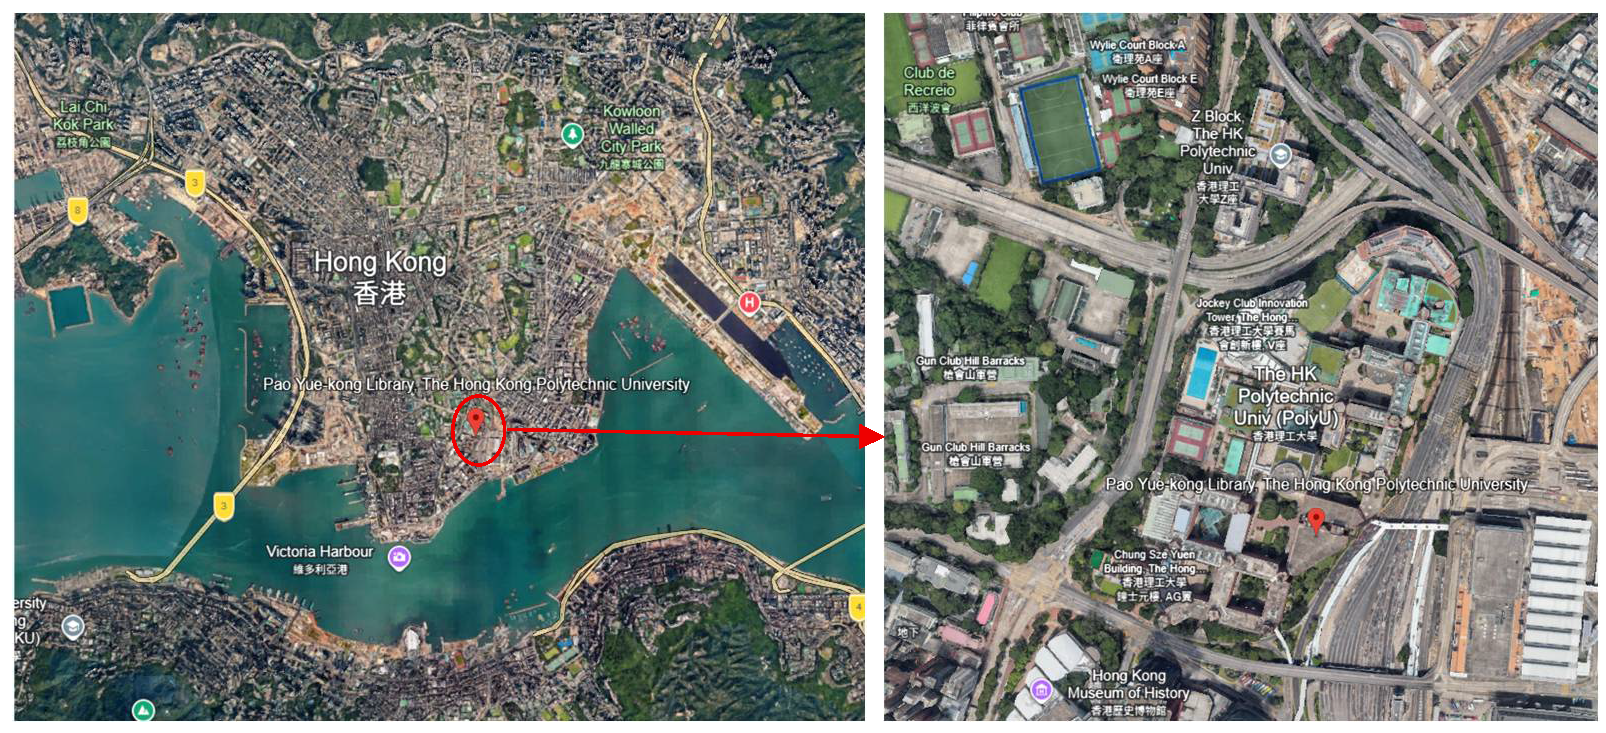
Figure 1 illustrates the overall workflow of this study, including on-site measurement, questionnaire survey, and data analysis. A convenience sampling approach was adopted for both the measurement and survey, which were carried out in the library of The Hong Kong Polytechnic University, located in Hung Hom, Kowloon, Hong Kong (see Figure 2).
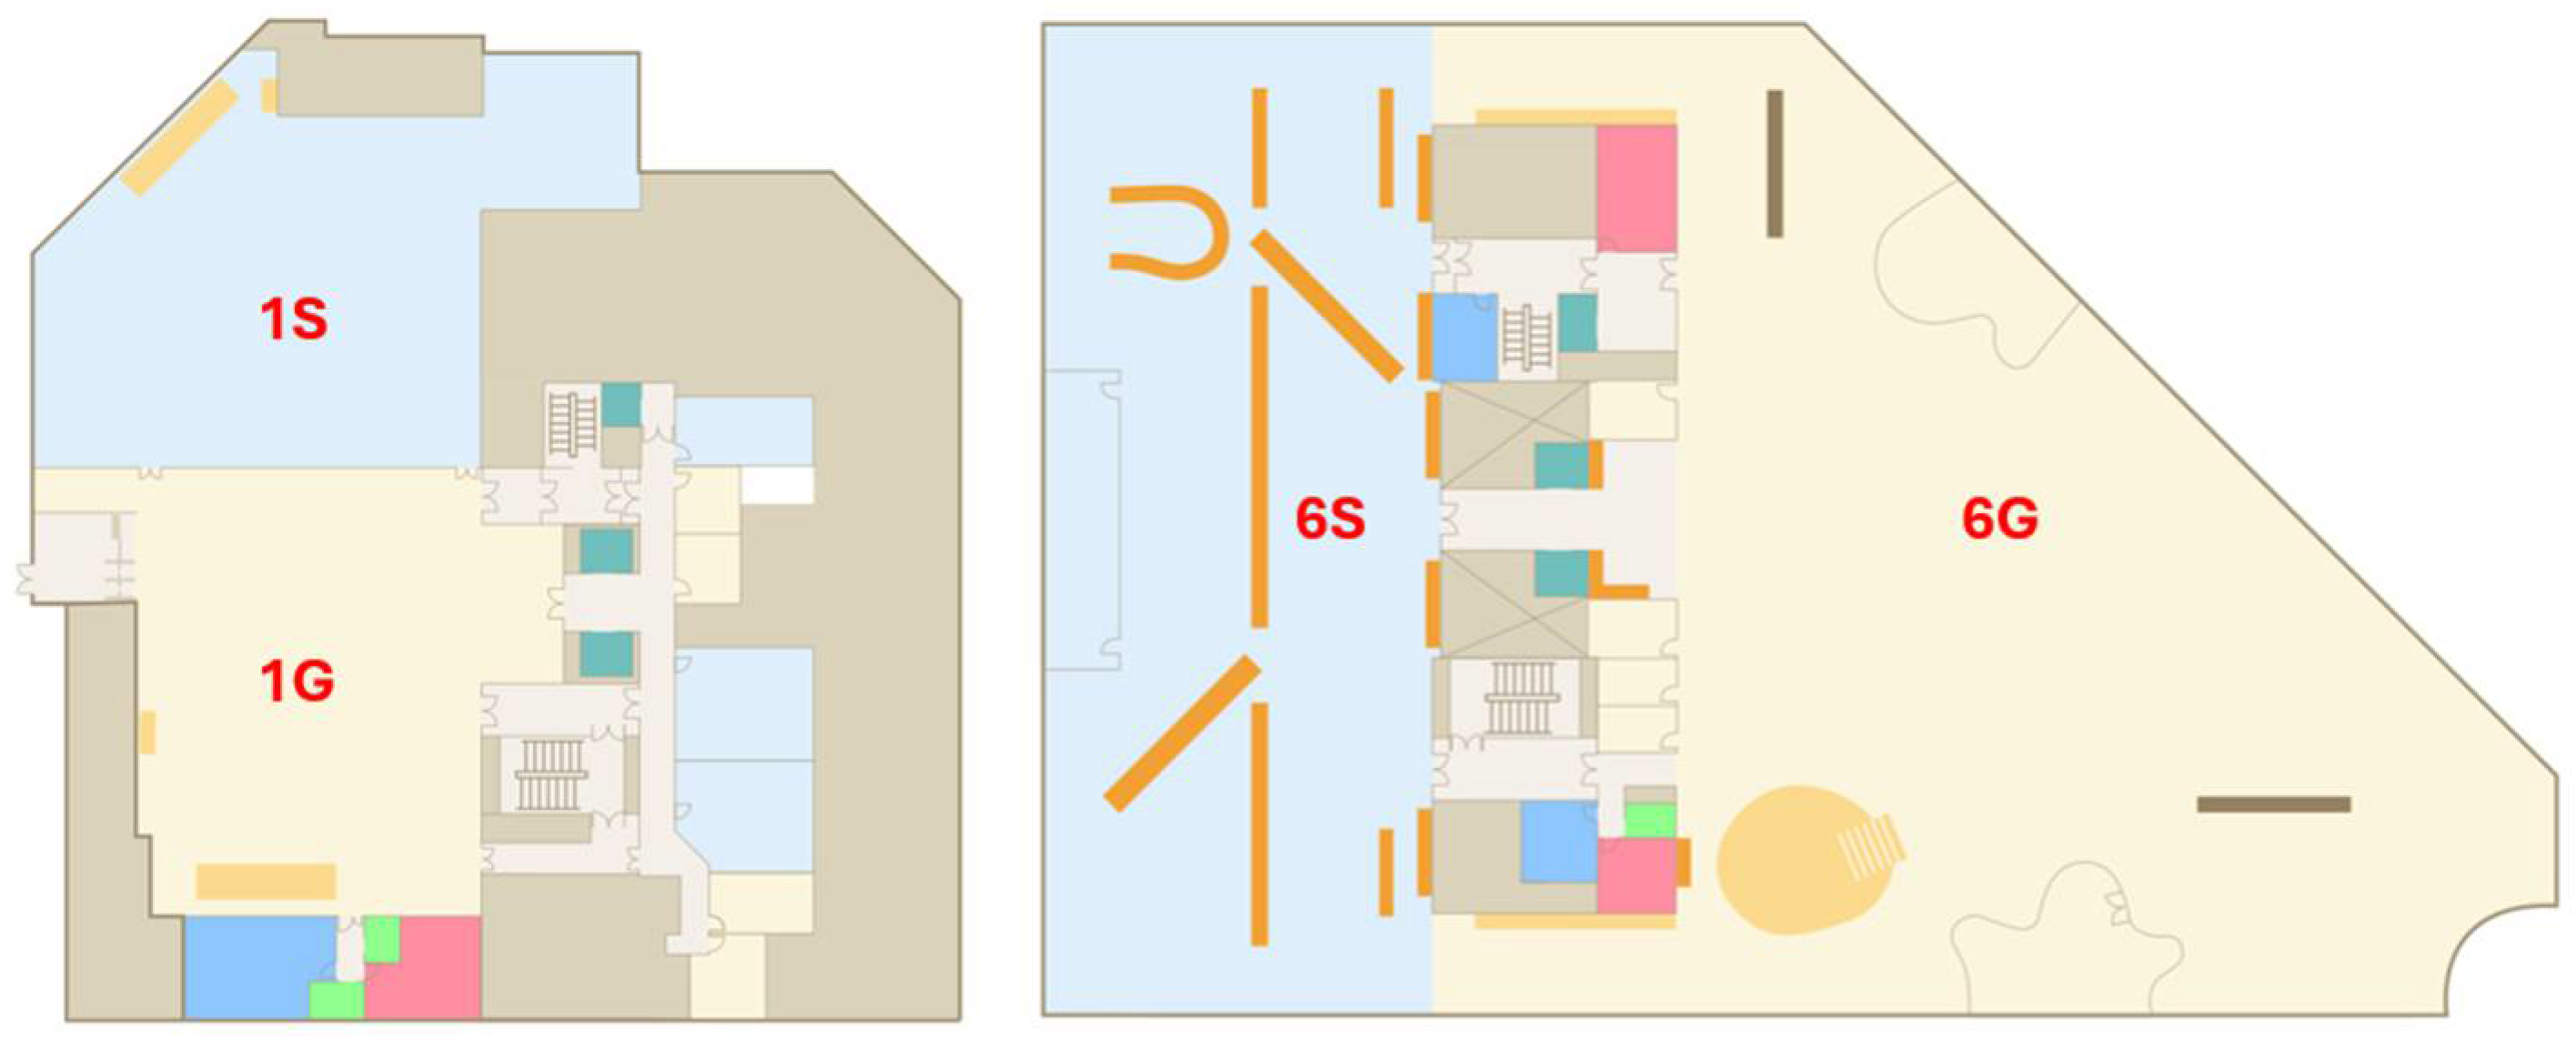
The field study was conducted during 10 weekdays between 19th October and the 1st of November 2022 at four study areas, i.e., self-study on the 1st floor (1S), group study on the 1st floor (1G), self-study on the 6th floor (6S), and group study on the 6th floor (6G), as shown in Figure 3.
For the measurement, five parameters, namely air temperature (Ta), radiant temperature (Tr), air velocity (Va), relative humidity (RH), and sound pressure level (SPL), were monitored using an IEQ logger (EVQSense, Hong Kong, China) with accuracy and resolutions shown in Table 1. In the meantime, students’ perceptions (on temperature, humidity, and sound), satisfactions (on thermal comfort and acoustic quality), and concentrations were collected using questionnaires. After data collection, a series of analyses, including descriptive, correlation, and two-way ANOVA, were conducted to explore the impacts of thermal and acoustic environments on students’ satisfaction and comfort and identify the optimal learning condition. The following three sections introduce detailed information on these parts.

2.1. On-Site Measurement

The measurement of Ta, Tr, RH, Va, and SPL was continuously carried out from 9:00 to 18:00, with one-minute intervals, every weekday during the investigation weeks. In accordance with the sampling procedure suggested by CIBSE [21], the IEQ loggers were positioned at the centre of the designated areas on a desk with a height of 1.1 m. Before this study, validation measurements were conducted simultaneously using the four devices at the same location within an office setting. The results showed no significant differences in the measured parameters among the devices.
Based on the collected parameters, the operative temperature (To), as a widely recognized indicator in thermal comfort studies [22,23,24], can be calculated using Equation (1). Additionally, the 15 min A-weighted equivalent sound pressure level (LAeq), commonly used to describe environmental noise, can be calculated using Equation (2) [25]. Subsequently, LA90 and LA10 can be derived to represent background noise and sporadic high noise levels, as they indicate the A-weighted sound levels exceeded for 90% or 10% of the measurement period, respectively.
T o p = C o p T a 1 C o p T r ;   C o p = 0.5 ,   V a < 0.2 0.6 ,   0.2 V a < 0.6 0.7 ,   V a 0.6
L A e q = 10   log 10 1 n i = 1 n 10 S P L i 10
where C o p is the coefficient; n is the number of samples in the targeted interval, which is 15 in this study.

2.2. Questionnaire Survey

The questionnaire comprises four sections. The first section gathers demographic information, including age, gender, weight, height, and location. The second section assesses students’ perceptions of their study environments, specifically temperature, humidity, and sound, as well as their satisfaction with thermal, acoustic, and overall environmental conditions. All questions in this section utilized seven-point scales. The third section employed the Positive and Negative Affect Schedule Short Form (PANAS-SF), a validated instrument for evaluating mood states. Students were asked to evaluate 10 mood states (including five positive and five negative states) using a five-point scale. The last section is a Group Bourdon test (with a full score of 45), which was used to measure students’ concentration level. The Bourdon test is a well-established and validated assessment tool widely used to evaluate sustained attention and concentration in various populations [26,27,28]. The questionnaires were randomly distributed to students in the selected study areas. The researchers recorded the time at which each student began the questionnaire to align with the measurement results.

2.3. Data Analysis

All the questionnaire data were manually entered into a database in IBM SPSS Statistics 26.0 (SPSS Inc., Chicago, IL, USA) and then merged with the measured results based on time and location. The analyses were conducted in five steps, as shown in Figure 1.
First is data cleaning. The measured results (i.e., Ta, Tr, Va, RH, and SPL) were assessed using z-scores [29]. Although a threshold of |z| > 3 is also commonly used, a slightly more conservative threshold of 2.5 was applied in the current study to minimize the risk of including potentially erroneous data points that might influence the results. The cases where any variables’ z-scores were larger than 2.5 or lower than −2.5 were considered as outliers and removed.
Then, a series of descriptive analyses was carried out to get a basic understanding of the data. Specifically, the mean and standard deviation (SD) of continuous variables (e.g., measurement data and concentration score) and the frequency of the discrete variables (e.g., gender and age group) were calculated. It is important to note that although the mean and standard deviation were calculated for the seven-point Likert-scale data to show the overall trends and patterns among the responses, the comparisons of them between different areas were conducted using the Kruskal–Wallis H test, in recognition of the ordinal nature of the data. Additionally, the mood states were transferred to a mood index (MI), which was the normalized difference between the sum of the five positive mood scores (PMS) and the sum of the five negative mood scores (NMS), as shown in (3).
M I = ( M S min M S ) ( max M S min M S ) ;   M S = i 1 5 P M S i = 1 5 N M S
Thirdly, a series of Spearman correlations between the measured results and the questionnaire responses was conducted to examine the relationships among them. Spearman’s rank correlation was chosen for this analysis due to its suitability to assess monotonic relationships between variables, which is particularly relevant for ordinal data such as Likert-scale responses.
Fourthly, a series of two-way ANOVA was executed to assess the interactive effects of the acoustic and thermal environment on students’ satisfaction and concentration. The independent variables regarding acoustic and thermal conditions were selected based on the findings from the correlation analysis, and the dependent variables included students’ satisfaction with acoustic, thermal, and overall environment, and their concentration test scores.
Fifthly, a Random Forest (RF) model was developed to establish a series of predictive models linking the environmental parameters with students’ satisfaction (with thermal, acoustic, and overall environment) and concentration. To optimize the performance of the selected machine learning model, Grid Search and cross-validation with five folds were applied to identify the best-performing hyperparameters (i.e., the number of estimators, maximum depth and minimum samples split). Additionally, Mean Absolute Error (MAE) was used to evaluate the performance of the models.
Lastly, these models were applied, together with Monte Carlo simulations, to generate a new database with 8000 cases (20 To × 20 RH × 20 LA90). Building upon this, a Pareto-optimal solution set was identified using Non-dominated Sorting Genetic Algorithm II (NSGA-II), which is a popular evolutionary algorithm used for solving multi-objective optimization problems. Two objectives, i.e., maximum satisfaction and concentration, were set for this method to identify the optimal learning environments to improve both students’ satisfaction and concentration.

3. Results

This section outlines the analysis results of the data collected in the field study, which aimed to explore the relationship between environmental factors and student satisfaction and identify the optimal learning environment. Section 3.1 (i.e., descriptive results) highlights significant patterns related to student preferences for different study areas, as well as variations in physical parameters such as temperature, sound levels, and relative humidity across these settings. Section 3.2 (i.e., correlation results) details the relationships between various environmental parameters and students’ mood states and satisfaction levels. Section 3.3 explores the interactive effects between thermal and acoustic factors through two-way ANOVA analysis and elucidates how the interactions influence student experiences. Finally, Section 3.4 presents the results from optimizations through NSGA–II and provides practical implications for creating enhanced study environments.

3.1. Descriptive Results

A total of 404 questionnaires were collected, with 381 deemed validated. Table 2 shows the demographic characteristics of the students and their study environments. The majority of participants were female students, under 20 years of age, maintained a normal body mass index (BMI), and reported a positive mood. Significant differences in age distribution and weight were observed among students across the four study areas. Younger students (under 20 years old) tended to prefer group-study areas, whereas older students preferred self-study areas. Additionally, students weighing over 60 kg were more likely to study on the first floor, while those with lower weights preferred the sixth floor.
Regarding the measurement results, there were statistically significant differences in all the examined parameters among the four study areas, which demonstrated the diversity of the environments investigated in this study. Specifically, both temperatures and sound levels were higher on the first floor than the sixth floor, while RH in 6S was substantially higher than it was in the other areas.
Consistent with the measurement results, students perceived higher temperatures on the first floor and reported greater satisfaction with the acoustic and overall environment on the sixth floor. These findings suggest a general preference for cooler and quieter environments. However, students’ perceptions of sound did not fully correspond with the measured sound levels, as group study areas were perceived as noisier than self-study areas. This discrepancy indicates that factors beyond sound level, such as the type of sounds present, may significantly influence students’ sound perception.

3.2. Correlation Results

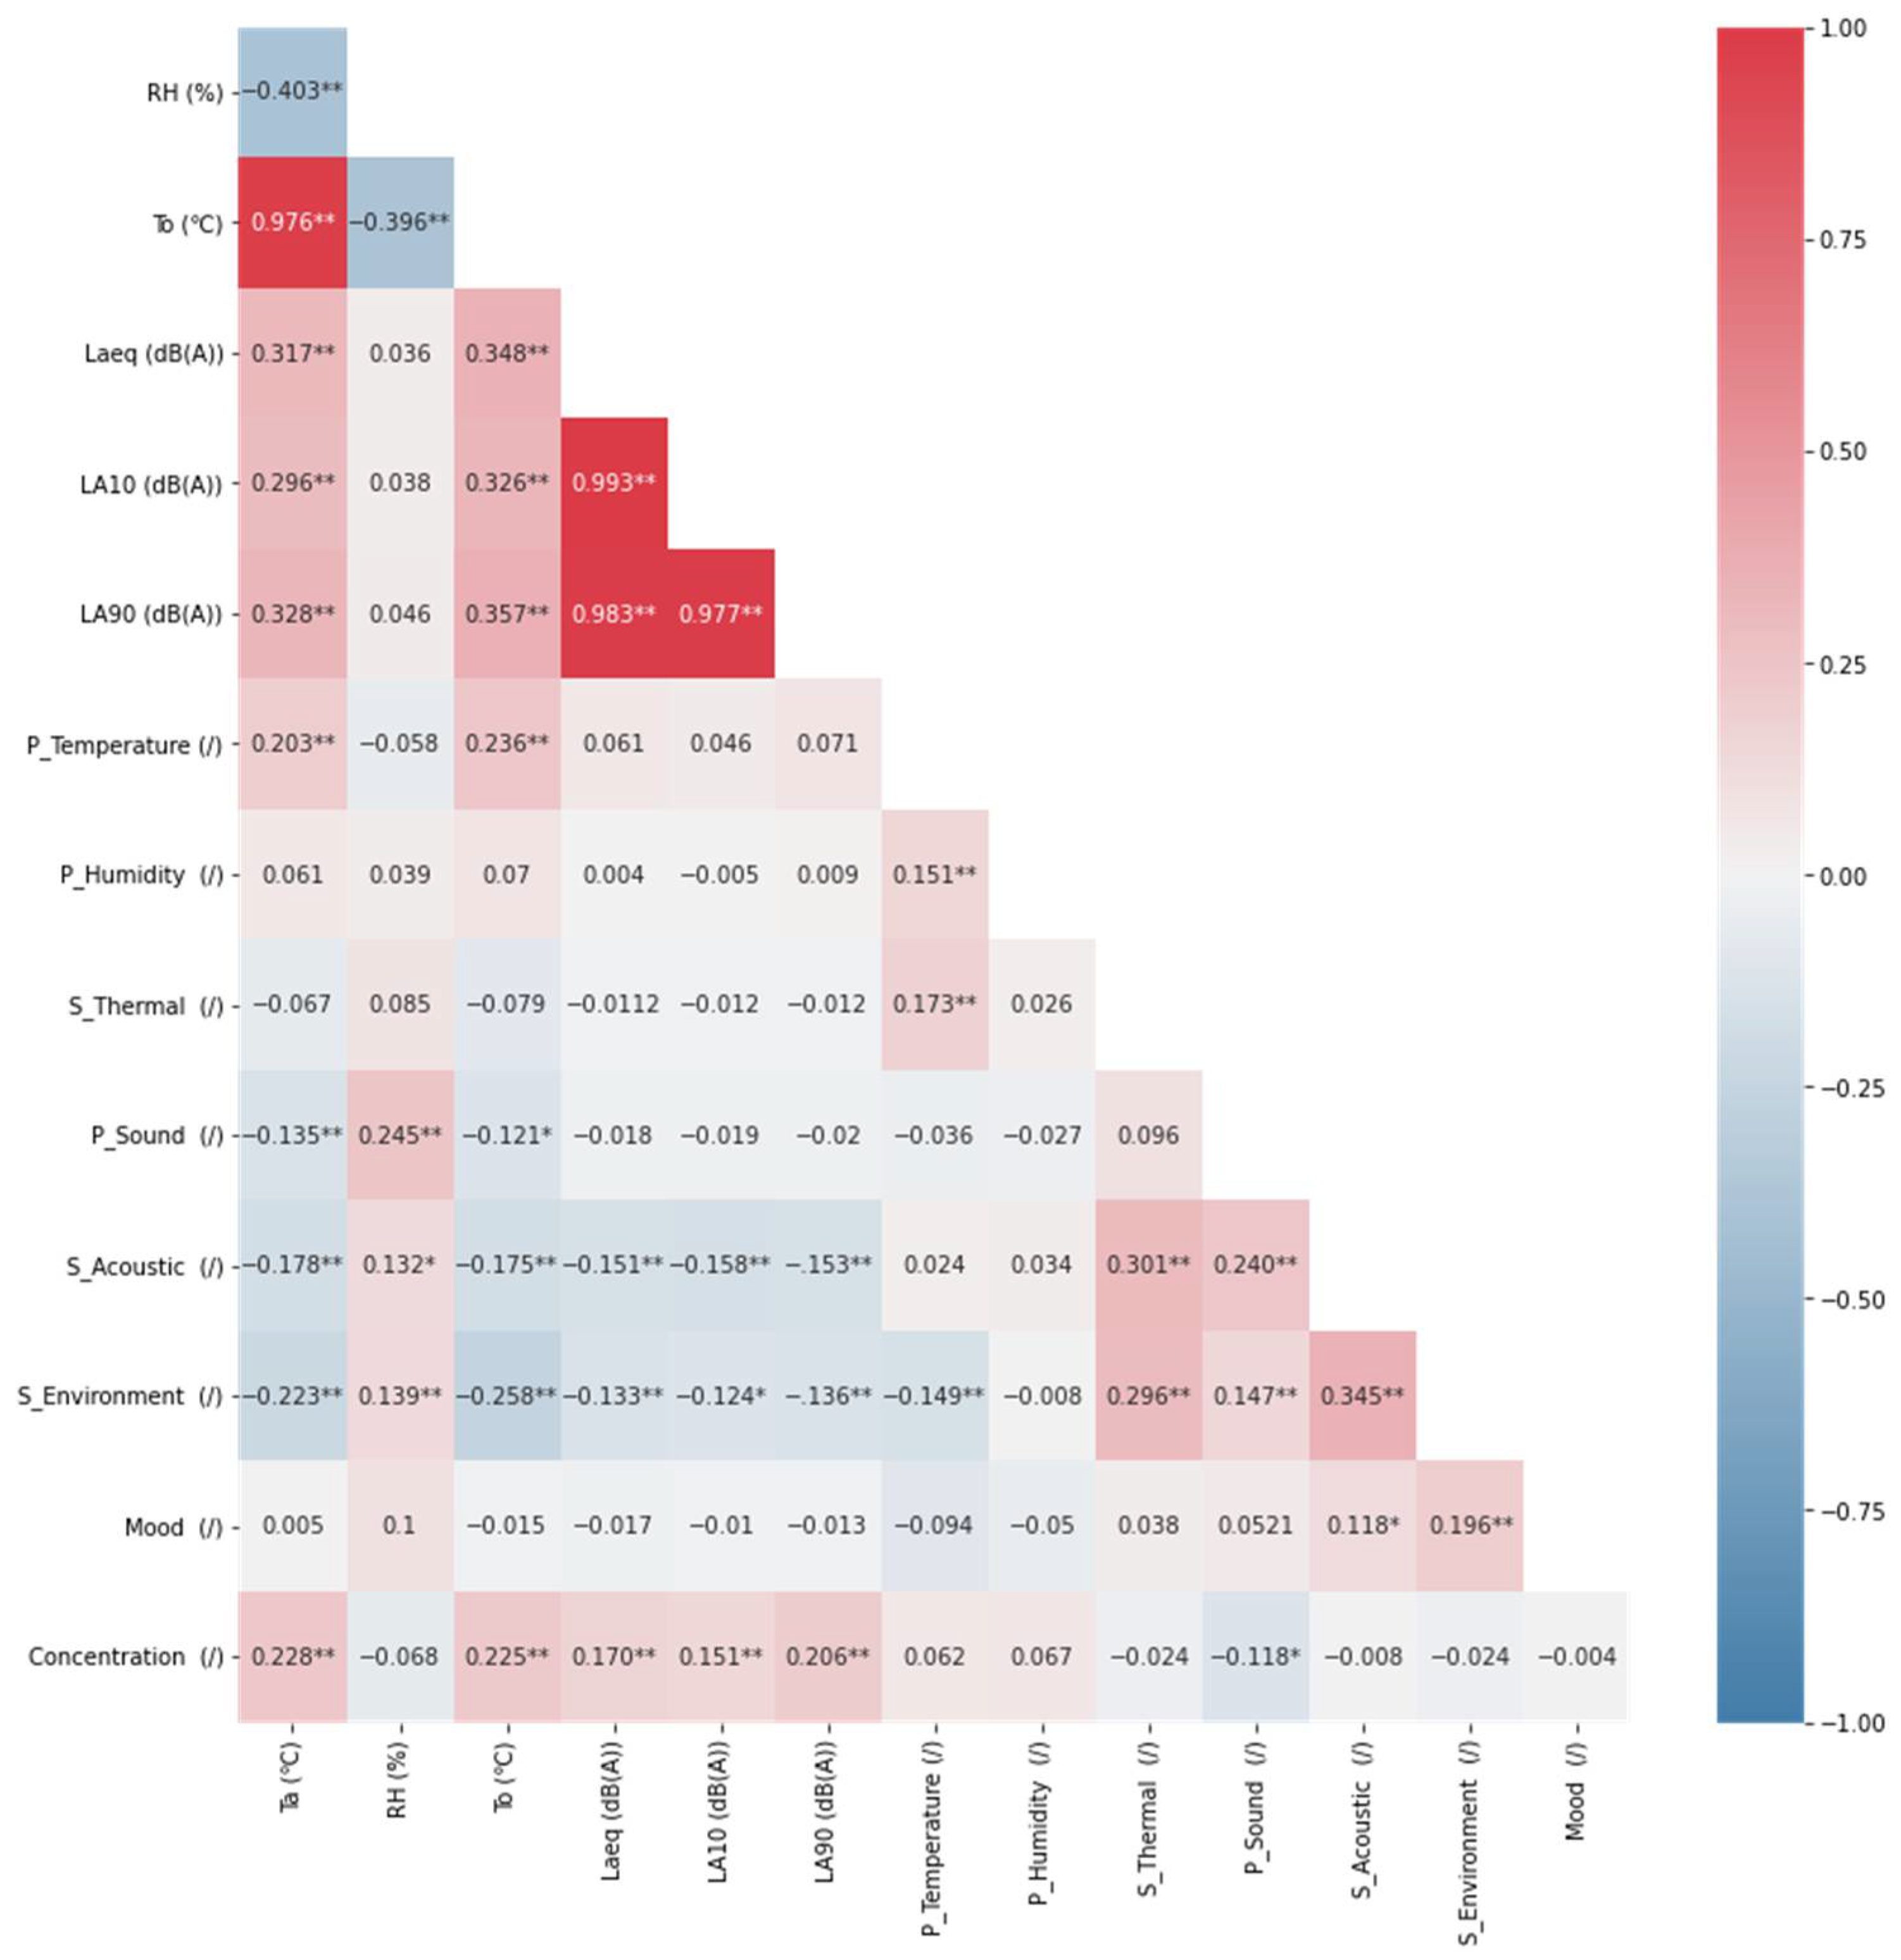
Figure 4 presents the Spearman correlation coefficients among the investigated parameters, which include physical variables (Ta, RH, To, LAeq, LA10, and LA90), students’ mood states, concentration levels, and their environmental assessments (such as perceptions of temperature, humidity, and sound, as well as satisfaction with thermal, acoustic, and overall environmental conditions. Both Ta and To, representing thermal-related parameters, were positively correlated with sound-related parameters and temperature perceptions, but negatively correlated with RH, sound perception, acoustic satisfaction, and overall satisfaction. In contrast, RH showed positive correlations with sound perception, acoustic satisfaction, and overall satisfaction. For the sound-related parameters, they exhibited strong and positive correlations with each other but had negative impacts on students’ acoustic satisfaction and overall satisfaction.
Almost all the parameters were significantly correlated with students’ overall environment satisfaction, except for their humidity perception. Given the significant correlations among these parameters, only To (as the temperature parameter), LA90 (as the sound parameter), and RH (as the humidity parameter) were selected for further analysis. This decision was based on the observation that To had stronger correlations with students’ thermal perception and overall satisfaction than Ta, and LA90 had stronger correlations with students’ acoustic satisfaction and overall satisfaction compared to LAeq and LA10.
Additionally, mood states exhibited significantly negative impacts on students’ temperature perceptions, and positive impacts on students’ acoustic satisfaction and overall environment satisfaction. In other words, students in positive moods were more likely to feel cool and satisfied with the acoustic and overall environment, while students in relatively negative moods were more likely to feel warm and dissatisfied with the acoustic and the overall learning environment. However, no impact of mood on concentration was identified.
Lastly, a series of independent t-tests and one-way ANOVA tests were conducted to examine the impacts of gender and age on students’ IEQ assessments and concentrations. As presented in Table 3, gender had a significant impact only on students’ temperature perceptions, with female students reporting feeling cooler than their male counterparts, consistent with findings from previous studies. Additionally, age significantly influenced students’ temperature perceptions and acoustic satisfaction. Specifically, as students’ ages increased, they reported feeling cooler and expressed lower satisfaction with the acoustic environment. However, since neither age nor gender showed a significant impact on students’ overall IEQ satisfaction and concentration, they were not included in the subsequent analyses.

3.3. Interactive Effects Examination

A series of two-way ANOVA analyses were conducted to further understand the interactive effects of thermal and acoustic environments on the students’ satisfaction and concentration.
Before the two-way ANOVA, To, RH, and LA90 were divided into three groups based on their distributions, as shown in Table 4. Specifically, the two demarcation points were around the 33rd and 67th percentiles. Slight adjustments were made considering the relationship between them and students’ satisfaction.
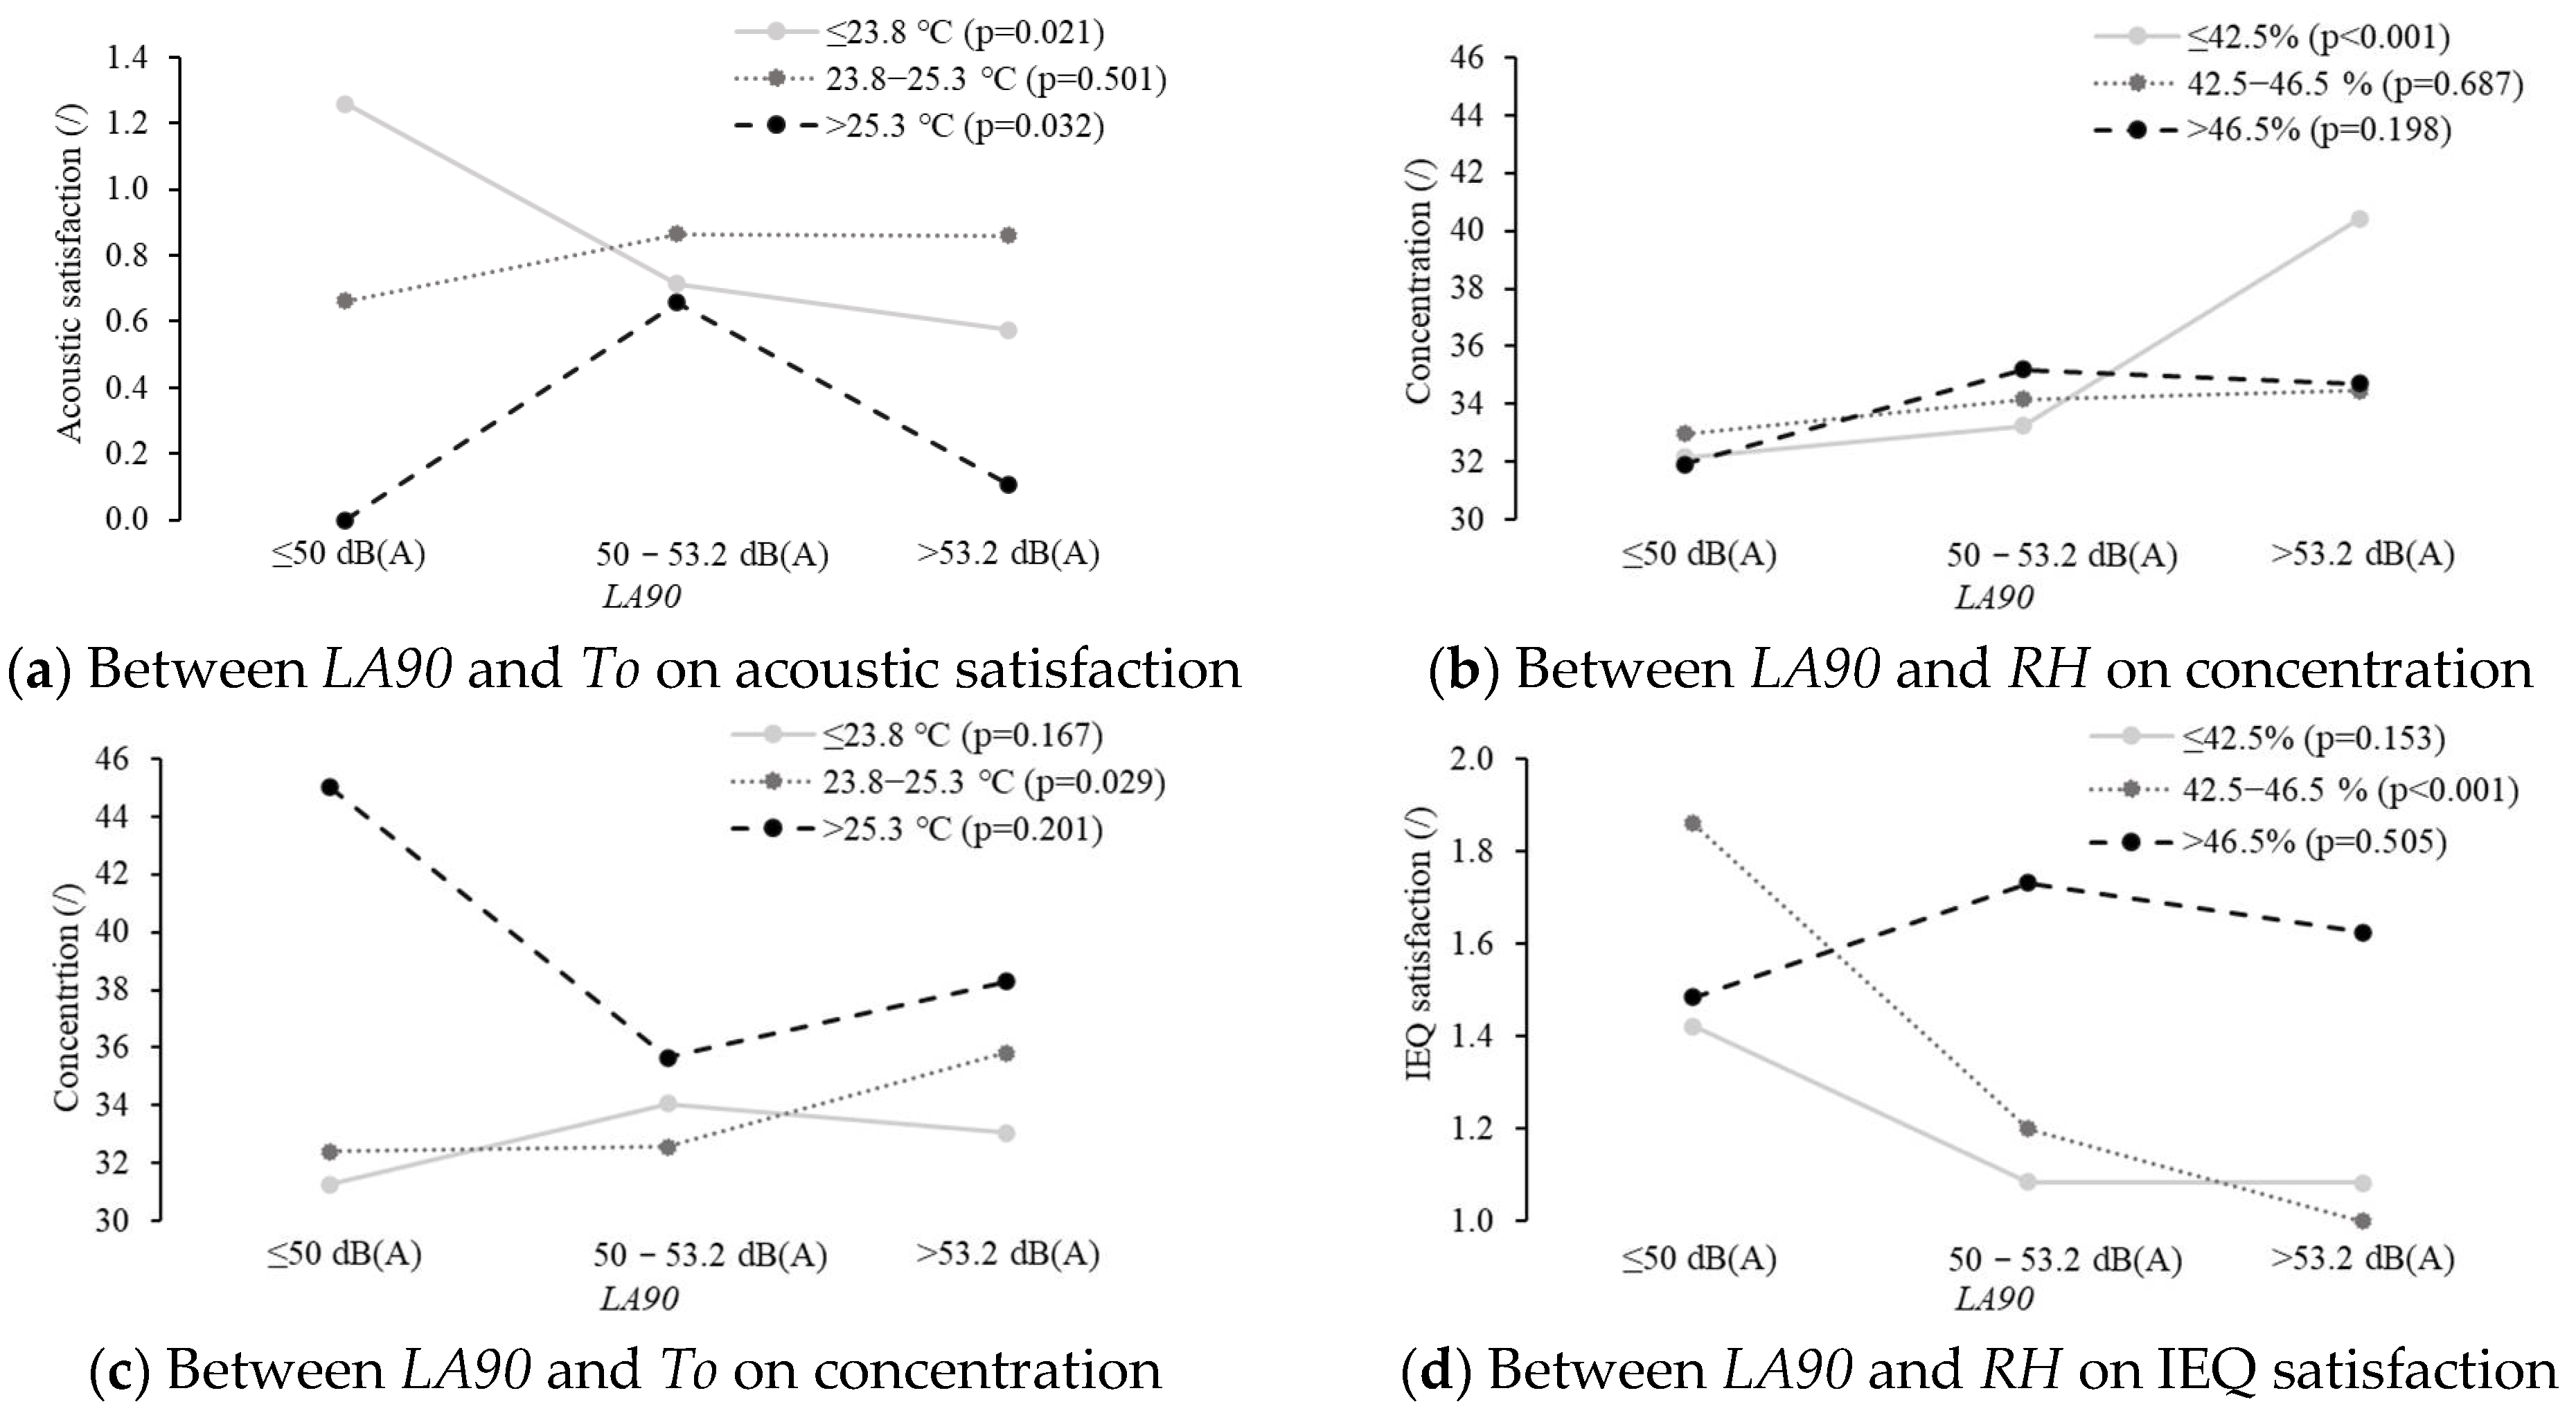
Table 5 shows the results of the two-way ANOVA tests. Significant interactive effects between the acoustic and thermal environments were identified on students’ concentration and their satisfaction with the acoustic and overall environments. Specifically, a significant interaction effect between LA90 and To was found on students’ acoustic satisfaction (p = 0.009). Additionally, To showed a significant main effect (p = 0.023). As illustrated in Figure 5a, To negatively influenced students’ acoustic satisfaction in a relatively quiet environment (i.e., LA90 < 50 dB(A)). Although LA90 alone did not have any significant impact, it showed significant and different impacts on students’ acoustic satisfaction under extreme thermal conditions, i.e., when To was lower than 23.8 °C or higher than 25.3 °C, as shown in Figure 5a.
Additionally, there were also significant interactive effects between LA90 and RH on students’ concentration (p = 0.016) and overall environmental satisfaction (p = 0.011). For concentration, LA90 showed a significant positive effect only when RH was lower than 42.5% (p < 0.001), as shown in Figure 5b. For students’ overall environmental satisfaction, both LA90 and RH showed significant main effects, and LA90 displayed a significant negative impact when RH was between 42.5% and 46.5%, as shown in Figure 5d.
Furthermore, it is worth noting that there was a trend of the interactive effect between LA90 and To on students’ concentration (p = 0.064). Again, a significant and positive impact of LA90 was found when To was between 23.8 °C and 25.3 °C (p = 0.029), as shown in Figure 5c.

3.4. Optimization of the Study Environment

Regarding the RF models, the optimal hyperparameters identified through grid search were a maximum depth of 10, a minimum samples split of 10, and a number of estimators set to 50. The MAEs for predictions on Concentration, S_Acoustic, S_Thermal, and S_Environment were 6.48, 0.90, 1.06, and 0.80, respectively, representing about 11% to 15% of the total range. These results suggest reasonably accurate predictions.
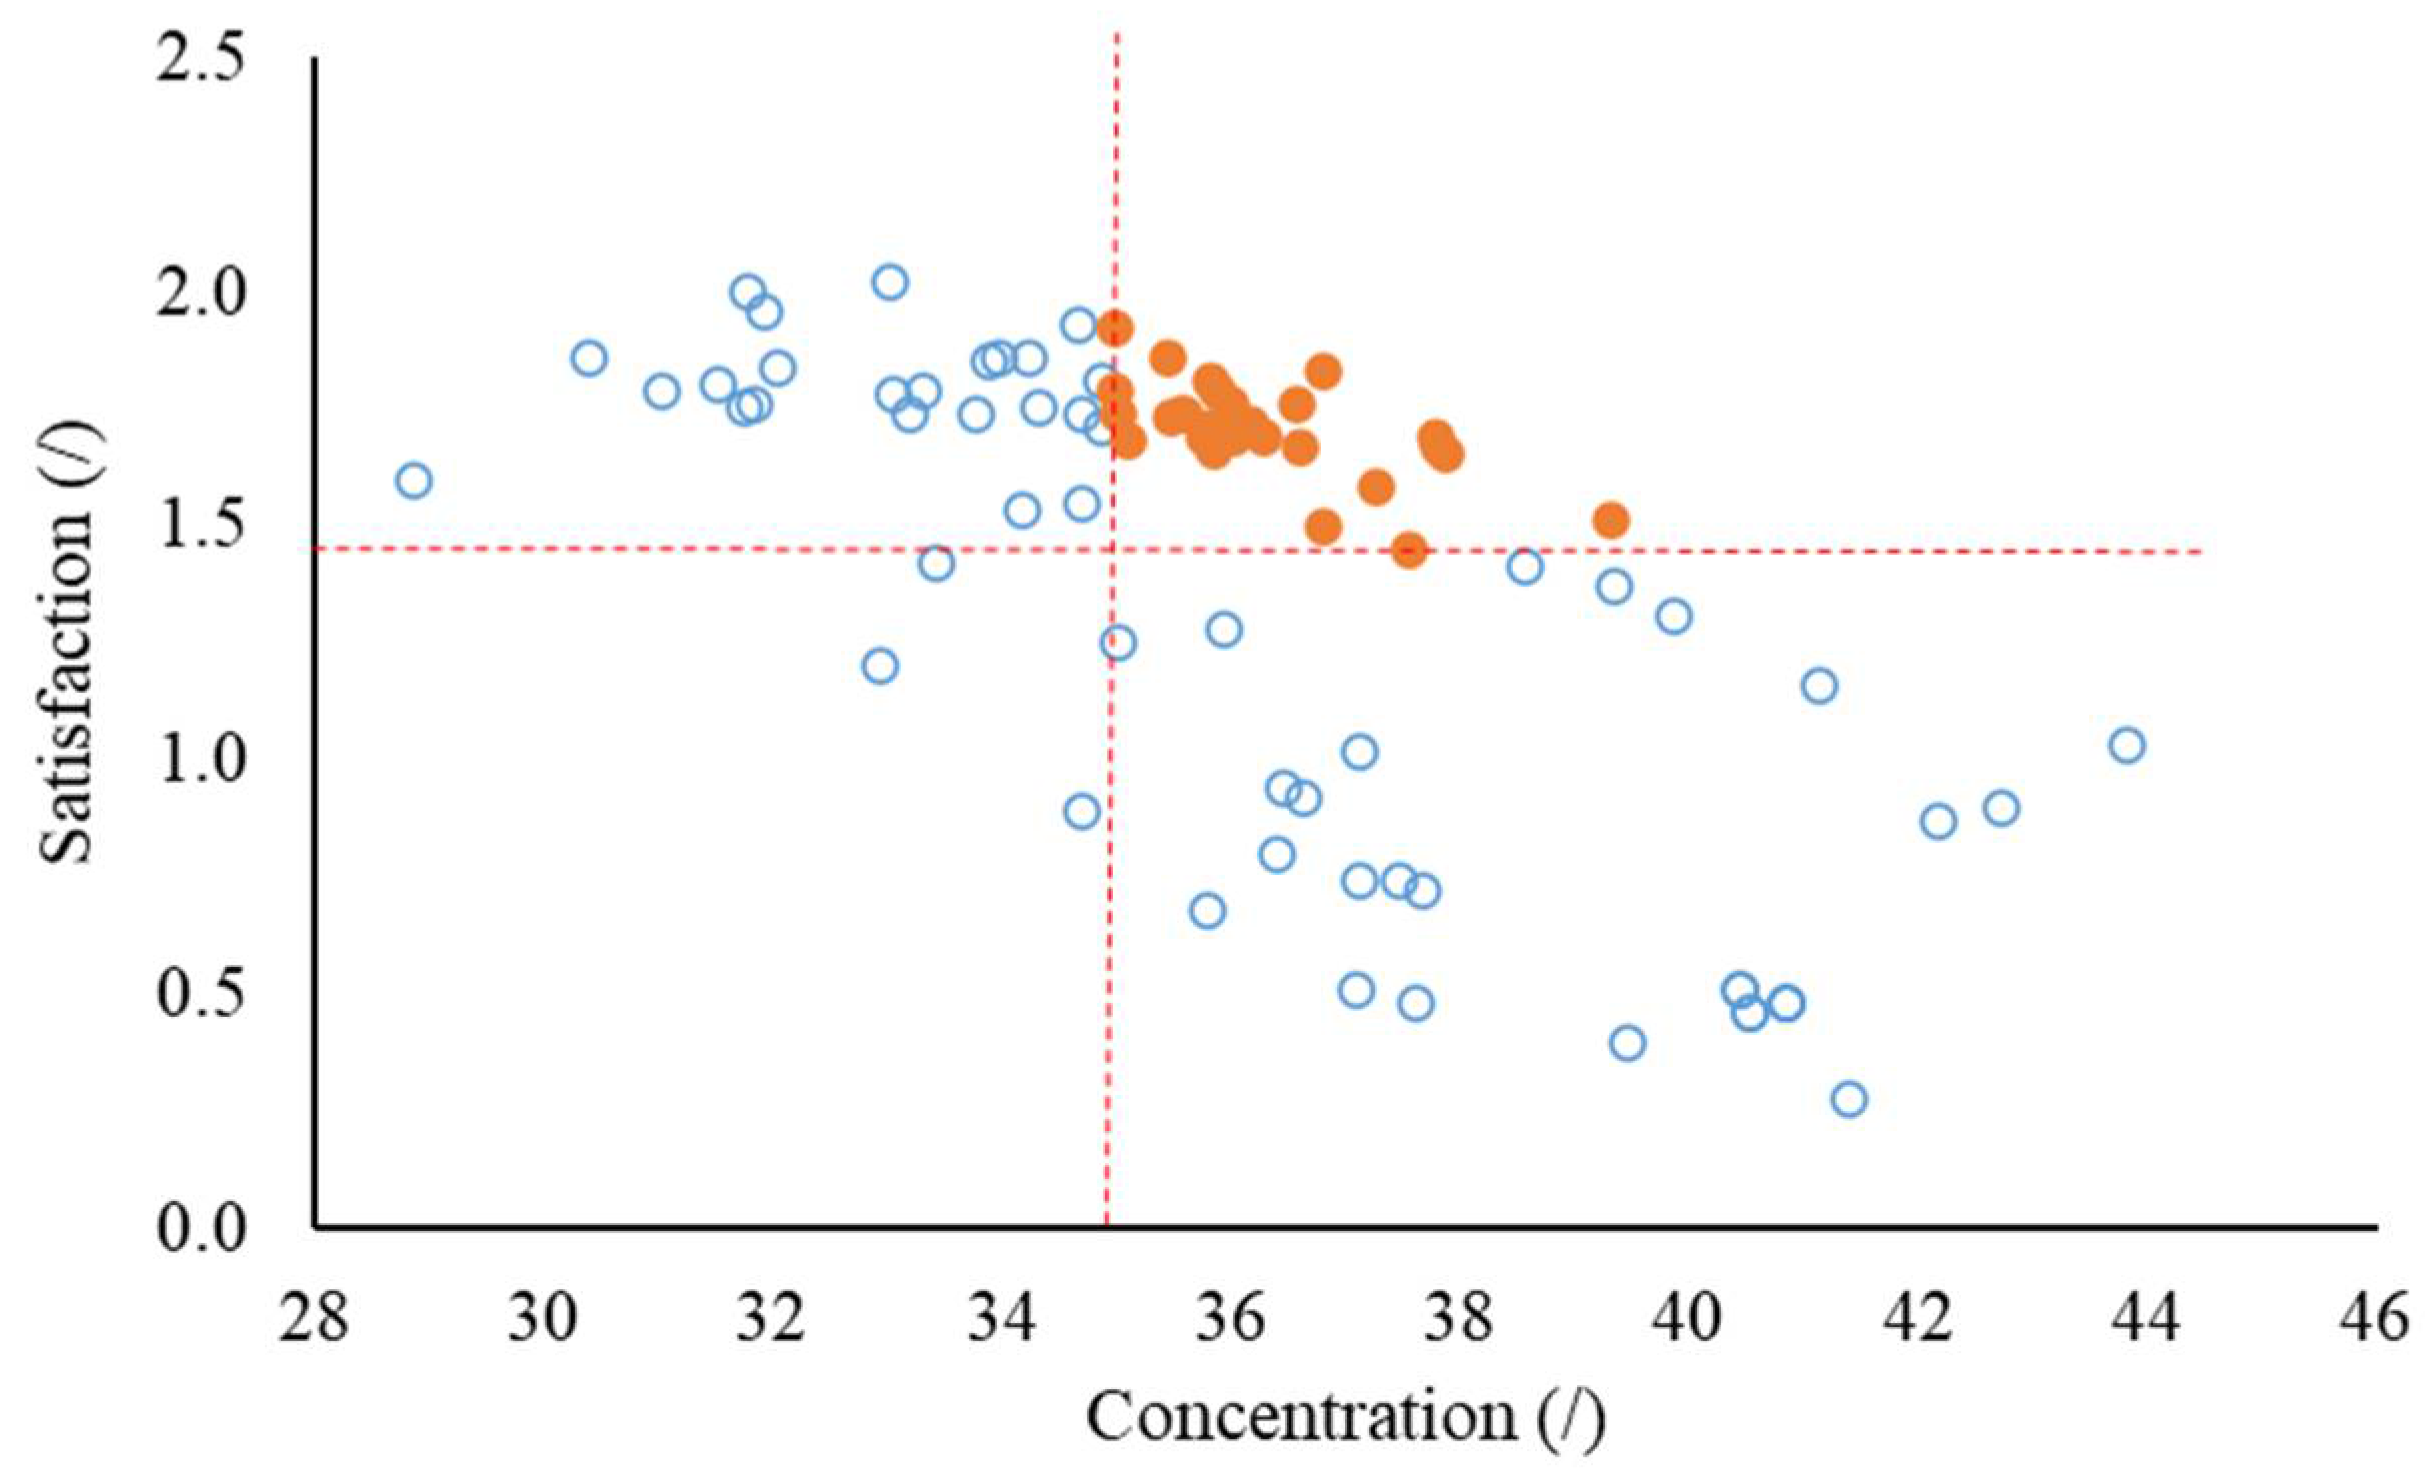
For the NSGA–II, the optimization was executed for 100 generations, iterating through 5000 populations, which resulted in 82 Pareto-optimal solutions, as shown in Figure 6. The range of To, RH, and LA90 was 22.5–26.6 °C, 40.6–48.4%, and 36–56.9 dB(A), respectively.
To achieve more effective solutions, two thresholds of satisfaction and concentration were selected (i.e., the average levels, as shown by the dashed lines marked in Figure 6) to ensure improvement in both students’ satisfaction and concentration compared to the original average levels. In total, 24 solutions fulfil these requirements, which were considered as the optimal solution in the current studies (see the solid points in Figure 6). The ranges of To, RH, and LA90 among these optimal solutions were 22.6–24.8 °C, 41.0–48.4%, and 45.0–48.5 dB(A), respectively. While these ranges reflect certain variability in the data, the calculated 95% confidence intervals (CIs) for the mean values were much narrower, which were 23.9–24.3 °C, 43.9–45.5%, and 47.4–48.1 dB(A), respectively. This indicates that the mean values could be effective indicators of optimal conditions. Under these conditions, students’ average satisfaction and concentration were 1.7 and 36.3, representing 22% and 6% improvement compared with the average levels of the original collected data.

4. Discussion

The findings of this study provide valuable insights into the influence of thermal and acoustic parameters on student concentration and satisfaction in academic settings. The interactions between these environmental factors identified by this study contribute to the optimization of learning environments. This discussion section will explore the implications of these findings, address the limitations inherent in the study, and propose directions for future research to further investigate the complexities of IEQ and its effects on student well-being and academic performance.

4.1. Individual Impacts of Thermal or Acoustic Parameters

Temperature, RH, and sound levels were found to significantly affect students’ concentration and their satisfaction with thermal, acoustic, and overall environmental conditions. Specifically, students’ sound perceptions and acoustic satisfaction were influenced by both sound levels and temperature, consistent with the laboratory findings of Yang and Moon [10]. However, in contrast to their results that occupants’ thermal comfort decreased with increased noise level, the current research did not observe a significant effect of sound level on students’ thermal satisfaction. This difference may result from two reasons. First, the range of noise levels in this study was narrower than that in the study conducted by Yang and Moon [10]. Although they only tested two noise levels, the difference between these levels was greater than in the current study, potentially leading to a more pronounced effect. Second, occupants’ thermal comfort might be distinct from their thermal sensation. While Yang and Moon [10] focused on thermal comfort, the current study focused on thermal satisfaction. Wu et al. [30] reported that occupants’ comfort and satisfaction ratings for the same environment can differ due to individual preferences. Similarly, Chen et al. [31] identified varying effects of sound level on occupants’ thermal sensation, thermal comfort, and thermal acceptance.
This situation highlights a research gap in IEQ-related studies. Over the past few decades, numerous studies have investigated the impact of IEQ on occupants, yet there is no officially endorsed uniform terminology. Various terms have been used in these studies, including perceptions [32], comfort [33], satisfaction [34], and acceptance [35], among others. Given the differing results associated with these terms, a standardized set of evaluation terms should be developed, and careful consideration should be given to parameter selection during study design. Zhang et al. [36] distinguished between acoustic acceptance and acoustic satisfaction, recommending the use of thermal satisfaction due to its stronger correlations with measured acoustic parameters.

4.2. Interactive Effect Between Thermal and Acoustic Parameters

Regarding the interactive effects, this study exhibits significant interactions between temperature and sound level on students’ acoustic satisfaction, while not on their thermal satisfaction or overall satisfaction. These results are consistent with the findings of Seyedrezaei et al. [37]. Furthermore, both studies identified a similar interactive trend between noise level and temperature affecting occupants’ concentration (i.e., 0.05 < p < 0.1).
Few studies have examined the interactions between humidity and sound level, as most previous laboratory studies maintained consistent humidity while investigating the interactive effects between thermal and acoustic parameters [38,39]. Nevertheless, previous studies have identified the individual impact of RH on acoustic perceptions [40] and the interactive effect between temperature and RH on perceptions of noise annoyance and loudness [13]. All of these studies highlighted the importance of the overall consideration of the IEQ aspects when designing learning environments.

4.3. Optimization of Thermal and Acoustic Parameters

Given the interactive effects between acoustic and thermal parameters, especially the negative correlation between students’ concentration and overall environmental satisfaction, a multi-objective optimization method, NSGA-II, was applied to identify the optimal environmental conditions for both concentration and satisfaction. The optimization results indicated that the optimal settings are as follows: To should be maintained around 24.1 °C (95% CI: 23.9–24.3), RH should be around 44.7% (95% CI: 43.9–45.5), and the background noise level, measured as LA90, should be around 47.7 dB(A) (95% CI: 47.4–48.1). According to the model outputs, these optimal conditions are projected to yield improvements of approximately 22% in overall IEQ satisfaction and 6% in concentration among students. However, it is important to recognize that these values represent theoretical and ideal scenarios. A rigorous field investigation is recommended to validate these inferred improvements and ensure their applicability in real-world settings.
These findings indicate a significant concern within the library, as the average temperature and noise levels in the studied areas were consistently outside the recommended optimal ranges. The first floor, in particular, frequently exceeded these thresholds, indicating an urgent need for environmental adjustments. Reducing temperature and background noise levels, especially on the first floor, is recommended to enhance student satisfaction. Implementing strategies such as upgrading HVAC systems and installing acoustic panels may help achieve optimal environmental conditions and promote improved student satisfaction and academic performance.
It is important to note that although this study was conducted from October 19 to November 1, these recommendations can be implemented year-round in Hong Kong. This is due to the fact that the indoor thermal environment is predominantly controlled by air conditioning systems that operate continuously throughout the year in nearly all public learning spaces in Hong Kong.

4.4. Limitations and Future Directions

This study has two primary limitations that should be noted. First, only three IEQ parameters, i.e., To, RH, and LA90, were considered for the interactive effects analysis. Apart from the interactions between these parameters, previous studies also identified interactive effects among other environmental parameters. For example, research has explored the combined influence of sound types and sound levels on students’ sound perceptions and performance [41], the interaction between light colour and temperature on occupants’ thermal responses and overall comfort [42], and the effects of brightness and sound level on noise annoyance [43]. Moreover, several studies have even identified interactive effects among three or more IEQ factors [37,44], which indicated the need for more comprehensive research. The second limitation of this study is that it was conducted in a single building and during one season. While there are four distinct outdoor seasons in Hong Kong, it is important to note that nearly all enclosed public buildings (including the library investigated in this study) are maintained by year-round mechanical ventilation and air conditioning systems. Thus, despite the narrow scope of measurements, the derived optimal ranges for indoor environmental quality are deemed applicable to mechanically controlled indoor spaces in Hong Kong throughout the year. Future studies could validate these findings by extending measurements across different seasons and buildings.
Considering the above-mentioned limitations and the terminology issues highlighted in Section 4.1, future research should aim to develop a comprehensive framework for investigating IEQ. This framework should encompass indicator selection, measurement settings, questionnaire design, and data analysis procedures to guide subsequent IEQ-related studies and facilitate the establishment of a global IEQ database. Additionally, the interactive effects between the four IEQ aspects and occupants’ characteristics remain insufficiently explored and require further study. Field studies in real-life environments that focus on actual performance are also recommended.

5. Conclusions

This study investigated the effects of thermal and acoustic parameters, specifically operative temperature (To), relative humidity (RH), and background noise level (LA90), on university students’ performance and satisfaction. Measurement and questionnaire surveys were conducted in four rooms of a university library over ten consecutive working days. These findings highlight significant individual and interactive effects of To, RH, and LA90 on students’ satisfaction and concentration. Specifically, significant interactions were observed between To and LA90 on students’ acoustic satisfaction (p = 0.009) and between RH and LA90 on students’ concentration (p = 0.016) and overall satisfaction (p = 0.011). These interactions emphasize the importance of considering multiple aspects of IEQ in an integrated manner.
Furthermore, the multi-objective optimization conducted using NSGA-II identified optimal ranges for To, RH, and LA90 in the library. The mean values with 95% confidence intervals are 24.1 (23.9–24.3) °C, 44.7 (43.9–45.5)%, and 47.7 (47.4–48.1) dB(A), respectively. In comparison, the measured results indicate that the library currently exceeds the optimal ranges for temperature and noise levels, particularly on the first floor. These findings indicate an urgent need for intervention to enhance the environment and better support student well-being and academic performance.
In conclusion, the application of two-way ANOVA and NSGA-II revealed multiple interactive effects between thermal comfort and acoustic quality on students’ satisfaction and concentration. This study also identified optimal environmental settings that have the potential to improve both students’ satisfaction and academic performance.

Author Contributions

Conceptualization, D.Z., A.H., L.-T.W. and K.-W.M.; methodology, D.Z.; formal analysis, L.-T.W. and D.Z.; investigation, D.Z., L.-T.W. and K.-W.M.; resources, L.-T.W. and K.-W.M.; writing—original draft preparation, D.Z.; writing—review and editing, A.H., L.-T.W. and K.-W.M.; visualization, D.Z.; supervision, L.-T.W. and K.-W.M.; project administration, K.-W.M.; funding acquisition, L.-T.W. and K.-W.M. All authors have read and agreed to the published version of the manuscript.

Funding

This research was funded by the PolyU internal funds (P0052976 and P0052767).

Institutional Review Board Statement

The study was conducted in accordance with the Declaration of Helsinki and approved by the Institutional Review Board (or Ethics Committee) of The Hong Kong Polytechnic University HSEARS20220425005 27 April 2022.

Informed Consent Statement

Informed consent was obtained from all subjects involved in the study.

Data Availability Statement

The original contributions presented in this study are included in the article. Further inquiries can be directed to the corresponding author.

Conflicts of Interest

The authors declare no conflicts of interest.

Abbreviations

The following abbreviations are used in this manuscript:
IEQIndoor environmental quality
TaAir temperature (°C)
TrRadiant temperature (°C)
VaAir velocity (m/s)
RHRelative humidity (%)
SPLSound pressure level (dB)
ToOperative temperature (°C)
LAeqA-weighted equivalent sound pressure level (dB(A))
LA90A-weighted sound levels exceeded for 90% of the measurement period (dB(A))
LA10A-weighted sound levels exceeded for 10% of the measurement period(dB(A))
PANAS-SFPositive and Negative Affect Schedule Short Form
SDStandard deviation
MIMood index
PMSsPositive mood scores
NMSsNegative mood scores
RFRandom forest
MAEMean absolute error
NSGA-IINon-dominated sorting genetic algorithm II
BMIBody mass index

References

  1. Haverinen-Shaughnessy, U.; Shaughnessy, R.J. Effects of classroom ventilation rate and temperature on students’ test scores. PLoS ONE 2015, 10, e0136165. [Google Scholar] [CrossRef]
  2. Buratti, C.; Belloni, E.; Merli, F.; Ricciardi, P. A new index combining thermal, acoustic, and visual comfort of moderate environments in temperate climates. Build. Environ. 2018, 139, 27–37. [Google Scholar] [CrossRef]
  3. Yang, D.; Mak, C.M. Relationships between indoor environmental quality and environmental factors in university classrooms. Build. Environ. 2020, 186, 107331. [Google Scholar] [CrossRef]
  4. Jiang, J.; Liu, F.; Jiang, Z.; Zhang, J.; Ma, C. Experimental evaluation of short-term thermal experiences on students’ thermal comfort and cognitive performance. Build. Environ. 2025, 285, 113613. [Google Scholar] [CrossRef]
  5. Zomorodian, Z.S.; Tahsildoost, M.; Hafezi, M. Thermal comfort in educational buildings: A review article. Renew. Sustain. Energy Rev. 2016, 59, 895–906. [Google Scholar] [CrossRef]
  6. Astolfi, A.; Puglisi, G.E.; Murgia, S.; Minelli, G.; Pellerey, F.; Prato, A.; Sacco, T. Influence of Classroom Acoustics on Noise Disturbance and Well-Being for First Graders. Front. Psychol. 2019, 10, 2736. [Google Scholar] [CrossRef]
  7. Mealings, K. A Scoping Review of the Effect of Classroom Acoustic Conditions on University Students’ Listening, Learning, and Well-Being. J. Speech Lang. Hear. Res. 2023, 66, 4653–4672. [Google Scholar] [CrossRef]
  8. Li, W.; Jin, Y.; Jin, H.; Kang, J. Combined effects of thermal-acoustic-luminous environments on environmental and emotional perceptions in learning spaces in winter. Int. J. Biometeorol. 2025, 69, 1725–1737. [Google Scholar] [CrossRef]
  9. Shi, Y.; Wu, J.; Lan, L.; Lian, Z. Interactive effects of indoor environmental factors on work performance. Ergonomics 2024, 67, 897–912. [Google Scholar] [CrossRef] [PubMed]
  10. Yang, W.; Moon, H.J. Cross-modal effects of noise and thermal conditions on indoor environmental perception and speech recognition. Appl. Acoust. 2018, 141, 1–8. [Google Scholar] [CrossRef]
  11. Geng, Y.; Hong, B.; Du, M.; Yuan, T.; Wang, Y. Combined effects of visual-acoustic-thermal comfort in campus open spaces: A pilot study in China’s cold region. Build. Environ. 2022, 209, 108658. [Google Scholar] [CrossRef]
  12. Tiller, D.; Wang, L.M.; Musser, A.; Radik, M. AB-10-017: Combined effects of noise and temperature on human comfort and performance (1128-RP). ASHRAE Trans. 2010, 116, 522–540. [Google Scholar]
  13. Yang, W.; Moon, H.J.; Kim, M.J. Combined effects of short-term noise exposure and hygrothermal conditions on indoor environmental perceptions. Indoor Built Environ. 2018, 27, 1119–1133. [Google Scholar] [CrossRef]
  14. Guan, H.; Hu, S.; Lu, M.; He, M.; Mao, Z.; Liu, G. People’s subjective and physiological responses to the combined thermal-acoustic environments. Build. Environ. 2020, 172, 106709. [Google Scholar] [CrossRef]
  15. Zhao, Y.; Li, D. Multi-domain indoor environmental quality in buildings: A review of their interaction and combined effects on occupant satisfaction. Build. Environ. 2023, 228, 109844. [Google Scholar] [CrossRef]
  16. Huang, L.; Zhu, Y.; Ouyang, Q.; Cao, B. A study on the effects of thermal, luminous, and acoustic environments on indoor environmental comfort in offices. Build. Environ. 2012, 49, 304–309. [Google Scholar] [CrossRef]
  17. Peng, Y.; Antanuri, N.; Lau, S.K.; Jebelli, B.; Jusuf, S.K.; Miller, C.; Teo, Y.T.; Chua, Y.X.; Chong, A. Experimental assessment of thermal and acoustics interactions on occupant comfort in mixed-mode buildings. Build. Environ. 2023, 238, 110342. [Google Scholar] [CrossRef]
  18. Wen, X.; Meng, Q.; Yin, Y.; Yang, D.; Li, M.; Kang, J. Exploring the boundaries of indoor combined thermal-acoustic environmental effects on comfort perceptions. Build. Environ. 2025, 271, 112580. [Google Scholar] [CrossRef]
  19. Wen, X.; Meng, Q.; Yang, D.; Li, M. Effect of thermal-acoustic composite environments on comfort perceptions considering different office activities. Energy Build. 2024, 305, 113887. [Google Scholar] [CrossRef]
  20. Bourikas, L.; Gauthier, S.; En, N.K.S.; Xiong, P. Effect of Thermal, Acoustic and Air Quality Perception Interactions on the Comfort and Satisfaction of People in Office Buildings. Energies 2021, 14, 333. [Google Scholar] [CrossRef]
  21. The Chartered Institution of Building Services Engineers. CIBSE TM68: Monitoring Indoor Environment Quality; Chartered Institution of Building Services Engineers: London, UK, 2022. [Google Scholar]
  22. de Dear, R.; Brager, G.S. The adaptive model of thermal comfort and energy conservation in the built environment. Int. J. Biometeorol. 2001, 45, 100–108. [Google Scholar] [CrossRef] [PubMed]
  23. Jindal, A. Thermal comfort study in naturally ventilated school classrooms in composite climate of India. Build. Environ. 2018, 142, 34–46. [Google Scholar] [CrossRef]
  24. Mohammadpourkarbasi, H.; Jackson, I.; Nukpezah, D.; Addo, I.A.; Oppong, R.A. Evaluation of thermal comfort in library buildings in the tropical climate of Kumasi, Ghana. Energy Build. 2022, 268, 112210. [Google Scholar] [CrossRef]
  25. Menge, C.W. The One-Minute Leq Measurement Method. J. Urban Econ. 1982, 11, 333–347. [Google Scholar]
  26. Hoonhout, H.; Knoop, M.; Vanpol, R. Colored Lighting in Offices the New Caffeine? Looking into Performance Effects of Colored Lighting. Proc. Hum. Factors Ergon. Soc. Annu. Meet. 2009, 53, 502–506. [Google Scholar] [CrossRef]
  27. Van Der Linden, D.; Keijsers, G.P.J.; Eling, P.; Van Schaijk, R. Work stress and attentional difficulties: An initial study on burnout and cognitive failures. Work. Stress 2005, 19, 23–36. [Google Scholar] [CrossRef]
  28. Mehibe, A.; Gülsüm, B.; Recep, A.; Kahraman, B. The effect of educational game over attention in children. Ovidius Univ. Ann. Ser. Phys. Educ. Sport Sci. Mov. Health 2010, 10, 325. [Google Scholar]
  29. Seo, S. A Review and Comparison of Methods for Detecting Outliers in Univariate Data Sets. Ph.D. Thesis, University of Pittsburgh, Pittsburgh, PA, USA, 2006. [Google Scholar]
  30. Wu, H.; Sun, X.; Wu, Y. Investigation of the relationships between thermal, acoustic, illuminous environments and human perceptions. J. Build. Eng. 2020, 32, 101839. [Google Scholar] [CrossRef]
  31. Chen, Y.; Li, T.; Chen, S.; Chen, H.; Lan, Y. Thermal–Acoustic Interaction Effects on Physiological and Psychological Measures in Urban Forests: A Laboratory Study. Forests 2024, 15, 1373. [Google Scholar] [CrossRef]
  32. De Giuli, V.; Da Pos, O.; De Carli, M. Indoor environmental quality and pupil perception in Italian primary schools. Build. Environ. 2012, 56, 335–345. [Google Scholar] [CrossRef]
  33. Al Horr, Y.; Arif, M.; Kaushik, A.; Mazroei, A.; Katafygiotou, M.; Elsarrag, E. Occupant productivity and office indoor environment quality: A review of the literature. Build. Environ. 2016, 105, 369–389. [Google Scholar] [CrossRef]
  34. Tang, H.; Ding, Y.; Singer, B. Interactions and comprehensive effect of indoor environmental quality factors on occupant satisfaction. Build. Environ. 2020, 167, 106462. [Google Scholar] [CrossRef]
  35. Zhang, D.; Wong, L.T.; Mui, K.W. Occupants’ mood states in evaluating indoor environmental quality (IEQ) acceptance. Archit. Sci. Rev. 2024, 68, 1–12. [Google Scholar] [CrossRef]
  36. Zhang, D.; Mui, K.W.; Masullo, M.; Wong, L.T. Application of Machine Learning Techniques for Predicting Students’ Acoustic Evaluation in a University Library. Acoustics 2024, 6, 681–697. [Google Scholar] [CrossRef]
  37. Seyedrezaei, M.; Awada, M.; Becerik-Gerber, B.; Lucas, G.; Roll, S. Interaction effects of indoor environmental quality factors on cognitive performance and perceived comfort of young adults in open plan offices in North American Mediterranean climate. Build. Environ. 2023, 244, 110743. [Google Scholar] [CrossRef]
  38. Pellerin, N.; Candas, V. Combined effects of temperature and noise on human discomfort. Physiol. Behav. 2003, 78, 99–106. [Google Scholar] [CrossRef]
  39. Abbasi, A.M.; Motamedzade, M.; Aliabadi, M.; Golmohammadi, R.; Tapak, L. Combined effects of noise and air temperature on human neurophysiological responses in a simulated indoor environment. Appl. Ergon. 2020, 88, 103189. [Google Scholar] [CrossRef]
  40. Yu, L.; Kang, J. Modeling subjective evaluation of soundscape quality in urban open spaces: An artificial neural network approach. J. Acoust. Soc. Am. 2009, 126, 1163–1174. [Google Scholar] [CrossRef]
  41. Zhang, D.; Tenpierik, M.; Bluyssen, P.M. Interaction effect of background sound type and sound pressure level on children of primary schools in the Netherlands. Appl. Acoust. 2019, 154, 161–169. [Google Scholar] [CrossRef]
  42. Chinazzo, G.; Wienold, J.; Andersen, M. Combined effects of daylight transmitted through coloured glazing and indoor temperature on thermal responses and overall comfort. Build. Environ. 2018, 144, 583–597. [Google Scholar] [CrossRef]
  43. Ma, H.; Nie, W. Influence of visual factors on noise annoyance evaluation caused by road traffic noise in indoor environment. In INTER-NOISE and NOISE-CON Congress and Conference Proceedings; Institute of Noise Control Engineering: Melbourne, VIC, Australia, 2014; pp. 6308–6315. [Google Scholar]
  44. Bluyssen, P.M.; Zhang, D.; Kim, D.H.; Eijkelenboom, A.; Ortiz-Sanchez, M. First SenseLab studies with primary school children: Exposure to different environmental configurations in the experience room. Intell. Build. Int. 2021, 13, 275–292. [Google Scholar] [CrossRef]
Figure 1. Overview of the research methodology.
Buildings 16 00670 g001
Figure 2. Location of the investigated university (left) and library (right) (Satellite imagery from Google Earth © 2026).
Buildings 16 00670 g002
Figure 3. Four investigated areas in the library (blue areas are self-study, while yellow areas are group study).
Buildings 16 00670 g003
Figure 4. Correlations between the investigated variables (Note: * the correlation is significant at the 0.05 level; ** the correlation is significant at the 0.01 level).
Buildings 16 00670 g004
Figure 5. Interactive effects between the acoustic and thermal parameters.
Buildings 16 00670 g005
Figure 6. The Pareto frontier solutions (Note: the dash lines represent the average levels of satisfaction and concentration; the hollow circles represent the identified solutions; the solid circles represent the optimal solutions that can achieve higher satisfaction and concentration levels).
Buildings 16 00670 g006
Table 1. Specification of the IEQ logger.
ParametersRangeAccuracyResolution
Air temperature (Ta)0 to 100 °C±≤1 °C0.1 °C
Radiant temperature (Tr)5 to 50 °C±2 °C0.1 °C
Relative humidity (RH)0 to 100%±≤2%1%
Air velocity (Va)0.2 to 20 m/s±5% of reading0.1 m/s
Sound pressure level (SPL)35 to 130 dB±3 dB0.1 dB
Table 2. General information about the collected data.
All (N = 381)1G (N = 57)1S (N = 64)6G (N = 169)6S (N = 91)p-Value d
Personal characteristics
Gender a
-
female
-
male
-
unknown

201 (53)
176 (47)
4 (1)

21 (37)
35 (61)
1 (2)

34 (53)
30 (47)
0 (0)

96 (57)
70 (41)
3 (2)

50 (55)
41 (45)
0 (0)
0.069
Age a
-
16–20
-
21–25
-
26–30
-
30+

176 (46)
168 (44)
30 (8)
7 (2)

36 (63)
19 (33)
1 (2)
1 (2)

21 (33)
31 (48)
11 (17)
1 (2)

84 (50)
77 (46)
7 (4)
1 (1)

35 (39)
41 (45)
11 (3)
4 (4)
0.001
Height (cm) b169 (8)171 (8)169 (9)168 (8)168 (8)0.224
Weight (kg) b59 (10)62 (11)60 (12)58 (10)58 (9)0.037
BMI b21 (3)21 (3)21 (4)20 (2)21 (3)0.107
Mood Index (/) b0.9 (0.2)0.8 (0.2)0.9 (0.3)0.9 (0.2)0.9 (0.2)0.179
Physical measurement b
Ta (°C) 25.7 (1.1)27.1 (0.6)26.2 (0.7)25.7 (0.7)24.4 (0.3)<0.001
To (°C) 24.4 (1.2)26.0 (0.6)25.3 (0.7)24.3 (0.7)22.8 (0.3)<0.001
RH (%) 44.3 (3.0)42.9 (3.0)45.4 (3.7)42.8 (1.7)47.0 (1.8)<0.001
LAeq dB(A) 49.9 (6.3)53.2 (2.5)55.2 (1.8)47.9 (5.7)48.0 (7.8)<0.001
LA10 dB(A) 49.7 (6.2)52.6 (2.2)54.9 (1.8)47.7 (5.8)47.9 (7.8)<0.001
LA90 dB(A) 50.3 (6.3)54.0 (2.3)55.5 (1.8)48.1 (5.6)48.2 (7.8)<0.001
Evaluations and concentration
P_Temperature c−0.4 (1.1)0.1 (1.1)−0.3 (1.1)−0.5 (1.1)−0.7 (1.0)0.001
P_Humidity c0.2 (0.6)0.4 (0.8)0.2 (0.6)0.2 (0.7)0.1 (0.4)0.062
S_Thermal c0.7 (1.2)0.5 (1.2)0.5 (1.2)0.8 (1.1)0.6 (1.2)0.232
P_Sound c−0.2 (1.4)−0.6 (1.3)0.2 (1.5)−0.5 (1.1)0.2 (1.5)<0.001
S_Acoustic c0.7 (1.1)0.5 (1.1)0.4 (1.1)0.8 (1.0)0.8 (1.3)0.005
S_Environment c1.4 (1.0)0.9 (1.0)1.1 (1.0)1.5 (1.0)1.6 (0.9)<0.001
Concentration b34.3 (8.4)43.0 (9.3)32.9 (9.2)32.6 (6.0)33.1 (7.9)<0.001
Note: a. The numbers are n (%) in each group, and p-values were obtained from chi-square tests b. The numbers are the mean (standard deviation) values over the measurement period, and p-values were obtained from the one-way ANOVA tests c. The numbers are the mean (standard deviation) values over the measurement period, and p-values were obtained from the Kruskal–Wallis tests d. p-values less than 0.05 are significant and marked in bold.
Table 3. Impacts of gender on students’ IEQ assessments and concentration.
VariablesGendert (p)AgeF (p)
FemaleMale16–2021–25≥26
P_Temperature −0.54−0.26−2.45 (0.015)−0.22−0.56−0.594.58 (0.011)
P_Humidity 0.240.141.53 (0.126)0.190.180.190.01 (0.992)
S_Thermal 0.640.69−0.42 (0.672)0.700.630.590.23 (0.793)
P_Sound −0.29−0.14−1.08 (0.282)−0.15−0.33−0.160.86 (0.424)
S_Acoustic 0.670.71−0.33 (0.740)0.820.630.353.17 (0.043)
S_Environment 1.421.311.03 (0.304)1.321.421.320.51 (0.600)
Concentration 4.454.18−0.49 (0.624)33.7734.8134.190.65 (0.524)
Note: p-values less than 0.05 are significant and marked in bold.
Table 4. Groups of the three physical parameters.
ParametersLowMiddle High
To (°C)≤23.823.8–25.3>25.3
RH (%)≤42.542.5–46.5>46.5
LA90 (dB(A))≤5050–53.2>53.2
Table 5. Interactive effects between acoustic and thermal environments on students’ satisfaction and concentration.
Dependent VariablesSourcedfFp-Value
Acoustic satisfactionLA9021.4130.245
To23.8200.023
LA90*To43.4090.009
ConcentrationLA9028.094<0.001
RH21.1760.310
LA90*RH43.1030.016
ConcentrationLA9021.5620.211
To28.859<0.001
LA90*To42.2420.064 *
Overall environmental satisfactionLA9024.4160.013
RH25.3510.005
LA90*RH43.3240.011
Note: p-values less than 0.05 are significant and marked in bold. * The interactive effect between sound level and operative temperature on students’ concentration is not significant at the 0.05 level, but there is a noticeable trend (0.05 < p < 0.1).
Disclaimer/Publisher’s Note: The statements, opinions and data contained in all publications are solely those of the individual author(s) and contributor(s) and not of MDPI and/or the editor(s). MDPI and/or the editor(s) disclaim responsibility for any injury to people or property resulting from any ideas, methods, instructions or products referred to in the content.