Article

Analytical and Experimental Compressive Behavior of Reinforced Concrete Columns Subjected to Stray Current and Chloride Ingress

1
National Building Research Institute, Faculty of Civil and Environmental Engineering, Technion—Israel Institute of Technology, Haifa 3200003, Israel
2
Department of Civil Engineering, Braude College of Engineering, Karmiel 2161002, Israel
*
Author to whom correspondence should be addressed.
Buildings 2026, 16(3), 654; https://doi.org/10.3390/buildings16030654
Submission received: 28 December 2025 / Revised: 23 January 2026 / Accepted: 27 January 2026 / Published: 4 February 2026
(This article belongs to the Special Issue Research on Corrosion Resistance of Reinforced Concrete)

Abstract

Stray current-induced corrosion poses a significant risk to the durability of reinforced concrete (RC) structures in electrified transit systems. This study addresses a critical knowledge gap by experimentally and analytically investigating the compression behaviors of circular RC columns under the combined effects of stray currents, chloride intrusion, and sustained service loads. The experimental program involved testing columns constructed with normal strength concrete (NSC) and moderate strength concrete (MSC) under accelerated corrosion induced by electrical potentials of 9 V and 18 V in a 3.5% NaCl solution. A key variable was the application of a sustained axial load, equal to 60% of the ultimate capacity, to simulate realistic service conditions. The findings revealed a severe deterioration in structural performance due to the synergistic effect of mechanical loading and corrosion. NSC columns subjected to 18 V potential and sustained axial loading exhibited a decrease in ultimate load-carrying capacity of up to 46% and a ductility reduction of approximately 69% compared to reference specimens. This damage was significantly more severe than in unloaded or lower-voltage (9 V) scenarios. Furthermore, MSC specimens demonstrated a strength loss of approximately 29% under similar aggressive conditions. An analytical confinement model, adjusted to account for corrosion by reducing the reinforcement cross-section and introducing a semi-empirical parameter α to represent localized pitting, showed strong agreement with the experimental stress–strain curves. The validated model provides a practical tool for assessing the residual capacity of corroded elements, addressing a crucial need in the maintenance of electrified transportation infrastructure.

1. Introduction

The global development of metro and light rail systems is intrinsically linked to the expansion of electrified tracks. As modern urban rail transport overwhelmingly relies on electricity for its efficiency and environmental benefits, cities worldwide continue to expand their infrastructure to combat congestion and pollution [1,2]. Report have highlighted a consistent global growth in rail infrastructure, with thousands of kilometers of new tracks becoming operational across hundreds of cities [3,4]. However, alongside these benefits, the electrification of railways introduces a significant durability risk to adjacent reinforced concrete (RC) structures: stray current-induced corrosion [5,6].
Corrosion of concrete reinforcement is a major global challenge that compromises the integrity of RC structures. While factors such as carbonation and freeze–thaw cycles contribute to deterioration, chloride-induced corrosion is often the most severe, accounting for a significant portion of damage to infrastructure [7]. Typically, corrosion physically degrades RC members by reducing the cross-sectional area of the reinforcement, producing expansive byproducts that cause concrete cracking and spalling, weakening the bond between the steel and concrete. This results in a marked decrease in the strength, stiffness, and energy dissipation capacity of the structural elements [8,9].
In the context of electrified transit, the corrosion mechanism is fundamentally altered by the presence of stray currents. Unlike natural environmental corrosion, which progresses through distinct initiation and propagation phases governed by slow chloride diffusion [10], stray currents act as a catalyst. They create an electric field that drastically accelerates chloride ion migration, significantly reducing the initiation time [10,11,12]. Stray current corrosion typically occurs at the point of current exit, leading to rapid, localized degradation (pitting) that behaves similarly to severe chloride exposure but proceeds at a much faster rate [10]. Consequently, standard predictive models based on natural diffusion often fail to capture the rapid deterioration kinetics in these environments.
Despite extensive research on corrosion mechanisms, monitoring, and repair strategies, most existing studies have focused on unloaded elements or simple rectangular beams [13,14,15,16]. This represents a critical knowledge gap, as real-world infrastructure elements, such as bridge piers and tunnel linings, operate under sustained axial service loads. Research has indicated that mechanical loading at service levels induces microcracks in the concrete cover [14]. These microcracks increase the permeability of the concrete, accelerating the ingress of aggressive agents like chlorides and oxygen [17]. Furthermore, under the influence of stray currents, these cracks may alter the electrical resistance path, concentrating the electrolytic current at specific locations and intensifying localized pitting [18].
The existing literature presents contradictions regarding the interaction between loading and corrosion. Some studies suggest that low levels of corrosion might temporarily enhance bond strength due to the accumulation of rust products, while others report immediate degradation in ductility and load-bearing capacity [19,20]. Moreover, the protective role of concrete cover and high-strength concrete, which is well-documented for natural conditions, has not been sufficiently quantified under the combined aggressive regime of high-voltage stray currents and sustained compression [21,22]. Specifically, there is a lack of experimental data and analytical models for circular RC columns subjected to this synergistic mechano-electrochemical attack.
This study addresses this critical gap by experimentally and analytically investigating the compression behavior of circular RC columns under the combined effects of stray currents, chloride intrusion, and sustained service loads. The experimental program involved testing RC columns constructed with both normal strength (NSC) and moderate strength concrete (MSC) under accelerated corrosion induced by electrical potentials of 9 V and 18 V. A key innovation of this study is the application of a sustained axial load—equal to 60% of the ultimate capacity—to a subset of the columns. This allows for the evaluation of structural performance under realistic service conditions where creep and micro-cracking are active factors. Finally, an analytical confinement model is adapted to account for corrosion effects, providing a practical tool for assessing the residual capacity of such elements in electrified transit environments.

2. Experimental Program and Methods

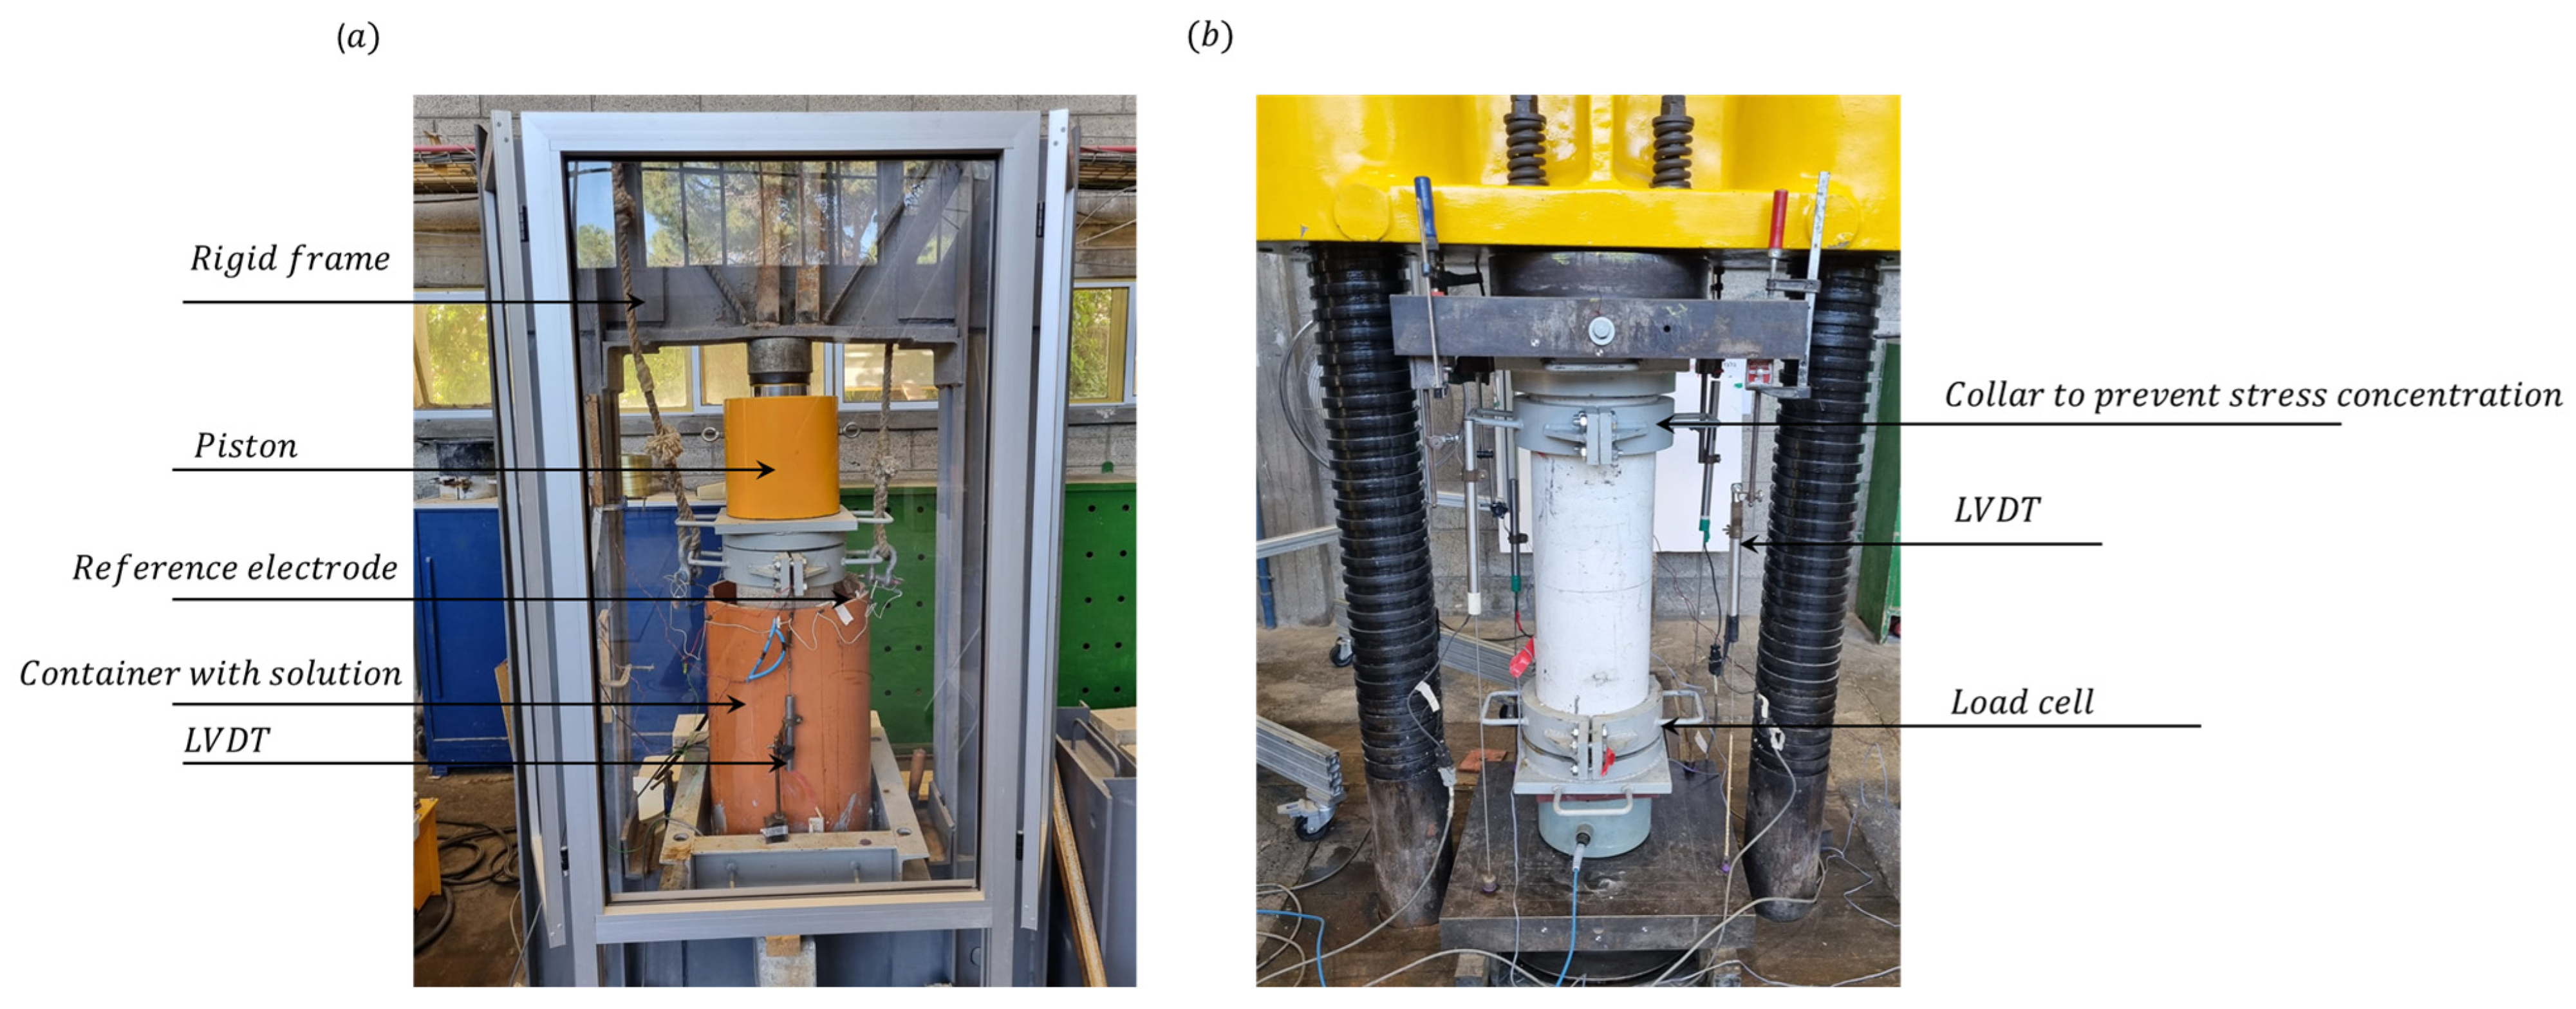
Reinforced concrete columns with dimensions of 750 mm in height and 230 mm in diameter were tested in this study (Figure 1). Two experimental setups were used to examine the effect of corrosion on the structural behavior of RC columns. The first setup was designed to accelerate the corrosion of the reinforcing bars within the concrete using an electrochemical method. For this purpose, two electrodes were connected to each specimen: a counter electrode and a working electrode. A hydraulic piston system was also used to apply a constant compressive load to the specimens. The applied loads were 0% and 60% of the theoretical ultimate load-bearing capacity of the columns. The selection of the sustained axial load level of 60% of the ultimate bearing capacity was based on a preliminary experimental study conducted prior to the main testing program. In this preliminary phase, the evolution of the Poisson’s ratio under increasing axial loads was monitored. The results indicated a clear range in which the Poisson’s ratio remained relatively constant vertically as a function of load, representing stable microcracking conditions. The 60% load level was specifically chosen as the midpoint of this stable range, ensuring that the columns would operate under high service loads while avoiding the occurrence of crack propagation at this load. Two types of concrete strength were tested—moderate strength concrete (MSC) and normal strength concrete (NSC)—with their properties listed in Table 1. For each type of treatment, three separate specimens were used (Figure 2). The counter electrode was made of 12 stainless steel rods (type 314) placed within a sealed plastic tube surrounding the specimen, which was filled with a 3.5% salt (NaCl-sodium chloride (Sigma-Aldrich, St. Louis, MO, USA)) solution by weight (Figure 2a). The reinforcing bars within the concrete served as the working electrode. A controlled power supply provided an electrical voltage of 0, 9, or 18 volts between the electrodes. Additionally, a voltage meter was connected between the reinforcing rods and a reference electrode (Ag/AgCl), with measurements recorded automatically every 5 min (Figure 2b).
The second type of test setup was designed to examine the structural behavior (axial load vs. strain) of the specimens after exposure to the combined effects of stray currents, chloride ingress, and continuous service loads (based on Table 2). The instrumentation included a load cell to measure the axial load, four linear variable differential transformers (LVDT) mounted on the specimens to record displacement, and two internal strain gauges mounted in the center of the specimen. In the reference specimens (those not exposed to electricity or chloride), four external strain gauges were also mounted on the surface to corroborate the readings and test the agreement between the different measurement devices. To minimize stress concentrations at the interface between the sample and the press, steel plates and a cap with a 20 mm thick neoprene rubber pad were used.

2.1. Materials

In this study, concrete mixtures were prepared from CEM I 52.5N cement, coarse limestone aggregate, fine quartz aggregate and tap water (Table 1).
The reinforcing bars used were of the B500C type, which meet the requirements of the European standard EN 10080. The results of the average tensile strength was determined based on tests of six reinforcing bars, three reinforcing bars with a diameter of 12 mm (type used as longitudinal bars) and three bars with a diameter of 8 mm (type used as hoops). A summary of the deformed reinforcing bar properties is presented in Table 3.

2.2. Casting and Curing

The column specimens were kept in plastic molds for 24 h at an ambient temperature of 24 ± 3 °C and a relative humidity of 65 ± 5% after casting. After this period, the columns were removed from the molds and immersed in water for 90 days.
To evaluate the concrete’s mechanical properties, nine cylinders (150 mm diameter, 300 mm height) and nine prisms (70 × 70 × 280 mm) were also prepared for each concrete type, adhering to the EN 12390-1 standard [23]. These cylinders were cured in water containing calcium hydroxide until the day of testing. Compressive strength tests were conducted at 7, 28 and 90 days after casting.

2.3. Accelerated Corrosion Tests

The accelerated corrosion process was implemented using an impressed current technique. The reinforcing bars served as the working electrode (anode), while the counter electrode (cathode) consisted of 12 stainless steel rods (type 314) positioned within a sealed plastic tube surrounding the specimen, filled with a 3.5% NaCl solution.
A controlled DC power supply was used to apply a constant electrical potential of either 9 V or 18 V. While these potentials exceed typical stray voltage fluctuations encountered in the field, these magnitudes were chosen to simulate long-term deterioration within the 28-day experimental timeframe [6]. Furthermore, based on previous research, such magnitudes have only been measured for very short time scales [6].
Although high voltages can cause overvoltage effects, previous observations indicate that the resulting corrosion morphology remains sufficiently representative of natural stray current damage for structural evaluation purposes [24].
The test assumes that the current passing from the anode produces ferrous ions according to the anodic reaction:
F e F e + + + 2 e
The mass loss will be proportional to the total current passed, and can be calculated using Faraday’s law:
m = A m n F I t d t
Here, ∆m is the steel loss in grams, I(t) is the measured current in amperes at time t, t is the duration of the test in seconds, Am is the atomic mass of Fe, n is valency (assuming that the rust product is mainly iron[II] hydroxide [Fe(OH])2], n = 2), and F is Faraday’s constant (96,485 coulomb per mol) [25].
Following the load test and column failure, the steel bars were extracted and weighed again. The mass loss due to corrosion was determined by calculating the difference between the initial and final masses of the bars. For design purposes, one can estimate the mass loss using Faraday’s law (Equation (2)).

3. Confinement Model

3.1. Non-Corroded Reinforced Concrete Columns

Various stress–strain models have been developed based on the principles proposed in [26,27,28,29,30,31]. Eid and Paultre [28] developed a model for predicting the axial behavior of a concrete column reinforced with steel, FRP, and both steel and FRP confinement [28]. This model was chosen to facilitate future research on the repair of corroded concrete columns. The pre-peak response of the model is derived from a fitted expression based on the fracture relationship proposed in [29,30,31].
f c = a ε c 1 + b ε c + z ε c 2     for     ε c ε c c
where the dimensionless shape parameters governing the curvature of the ascending branch a , b , and z are defined as:
a = E c t ;     b = E c t f c c 2 ε c c + E c t E c u ε c c f c c 2 ;         z = 1 ε c c 2 E c t E c u f c c 2
E c t is the initial stiffness of the concrete, representing the slope of the curve at the origin (tangent elastic modulus);
f c c is the maximum compressive stress capacity of the confined concrete (confined peak strength);
ε c c is the axial strain corresponding to the confined peak strength, where the tangent slope is zero (strain at peak).
The stress–strain curve, shown in Figure 3, is defined by the confined concrete strength, f c c , and its corresponding peak strain, ε c c , as given by Equations (4) and (5) [28,29]:
  f c c f c o = 1 + 2.4 I e 0.7
ε c c ε c o = 1 + 35 I e 1.2
where ε c o is the strain corresponding to the unconfined compressive concrete strength f c o , and I e = f l e f c o is the effective confinement index at concrete peak stress.
The effective lateral confining stress, f l e , is defined as follows:
f l e = f l s k e + f l f
and, for circular columns:
f l s = 0.5 ρ s f h
k e = 1 s d c o r e 2 1 ρ c c
where f l s = effective lateral confining pressure at concrete peak stress resulted from steel transverse reinforcement;
k e = confinement effectiveness coefficient ( k e ≤ 1.0);
f h = lateral steel stress at concrete peak stress ( f h f h y , where f h y is the yield strength of lateral steel reinforcement);
f l f the lateral confining pressure due to FRP;
s = clear vertical spacing between hoops;
d c o r e = diameter of the core measured center to center of hoop;
ρ s = ratio of the volume of transverse confining steel to the volume of confined concrete core [26,27].
Introducing Equation (6) and taking into account the tensile strain of the lateral steel and FRP at the peak concrete stress, the confinement index, I e , is defined as follows [32]:
I e = I e 1 = ν c c k 1 η   I e 2       i f     k 1 > η   k 2 η   I e 2 = ν c c f c + k 2 ρ s e f h y f c k 2 η I e , m a x     i f   k 1 η   a n d   k 2 > η   I e , m a x   = ρ s e f h y f c + E f l   ε f u   ξ f c   i f   k 1 η   k 2 η
where k 1 and k 2 are given by:
k 1 = f c ρ s e E s ε c + E f l ε c = E c E s l + E f l
k 2 = f c E f l ε c = E c E f l
and
η = 29.8 ν c c 3.56
ν c 0 ν c c = 10 f c E f l + ρ s e E s γ s f 0.9 0.5
where the lateral steel stiffness E s l = ρ s e E s , and
  ρ s e = K e A s y h s d c o r e
where ρ s e is the effective sectional ratio of the confining/transverse steel reinforcement [28]; ν c 0 is the concrete’s initial secant Poisson’s ratio (can be taken as 0.15);
γ s f is the ratio ε h y ε f u and can be assumed as 0.133 for concrete column confined with only lateral steel [33];
ν c c is the concrete’s secant Poisson’s ratio at peak stress;
E c = f c ε c = 3320 f c + 6900 (MPa) is the concrete secant modulus [34] at peak stress;
Efl is FRP elastic modulus;
ε c = 0.0005 f c 0 0.4 .
For a column that is confined only by the transverse steel reinforcement, the stress–strain relationship is calculated with the above parameters but without the FRP’s influence (i.e., E f l = 0 in all equations).
The post-peak branch of the stress–strain model is given by [29]:
    f c = f c c e x p k 1 s ε c c ε c c k 2 s   f o r   ε c c ε c c
where k 1 s and k 2 s are parameters controlling the shape of the stress–strain model.
K 1 s = ln 0.5 ε c c 50 ε c c k 2 s
K 2 s = 1 + 25 I e 50 2
where I e 50 is the effective confinement index evaluated at the post-peak strain ε c c 50 :
I e 50 = ρ s e f y h f c 0
The post-peak strain ε c c 50 measured at 50% of the maximum stress defines the post-peak shape of the stress–strain curve. The following equation is proposed [29]:
ε c c 50 ε c 50 = 1 + 60 I e 50
where ε c 50 is the corresponding post-peak strain in the unconfined concrete measured at 0.5 f c 0 [29]. In the absence of data, it is possible to use ε c 50 = 0.004 [29].

3.2. Corroded Reinforced Concrete Columns

Under the influence of corrosion, the cross-sectional area A s of the average loss of the stirrups in a column is calculated using:
  A s = A s m m = A s 1 D c D 2
where m is the mass per unit length (g/mm) of the non-corroded rebar and D c is the diameter of the clean corroded rod (without rust products). It is known that corrosion products can reach up to 3–6 times the volume of the corroded steel [35]. The potential corrosion risk is further increased by compressive rebar buckling. For the corroded compressive rebar with an exposed length of Lp, its critical buckling strength σ c r c can be estimated using the improved Euler buckling formula [36]:
σ c r c = π 2 E π A s 1 m m 16 L p 2 > f y  
where the exposed length L p is associated with the number n p of the damaged stirrups, defined as L p = 1 + n p S , where S is the spacing between the hoops (center-to-center).

Proposed Confinement Model of Corroded Columns

After the corrosion crack has formed, the crack on the surface reaches a depth equal to the concrete cover thickness plus half the diameter of the bar, as observed in previous models [37,38,39] and in the experimental results of the present study.
Once the corrosion crack is present, the corrosion products can move freely outward. However, the reinforcing bars are no longer protected, and the corrosion rate becomes equal to or very close to that of bare steel bars without the protection of an alkaline environment. Under stray current conditions and in the presence of a crack, the reinforcing bars will corrode in accordance with Faraday’s Law. Corrosion of steel in cracked concrete is generally expected to increase with increasing crack depth, since chloride penetration and diffusion also increase. Nevertheless, the corrosion test results show an opposite trend, likely due to reduced oxygen availability at the steel surface in the cathodic zone beneath thick concrete covers.
It is important to differentiate the effects of various crack types. Cracks formed by external forces, such as flexure or shrinkage, are typically transverse (perpendicular) to the reinforcement bars. For these transverse cracks, an increasing trend in steel corrosion is observed with increasing crack width, up to a crack width of approximately 0.3 mm, after which the effect may plateau [40].
In contrast, cracks caused directly by the pressure of accumulating corrosion products are typically longitudinal (parallel) to the rebar. These longitudinal cracks are considered more severe in terms of accelerating corrosion damage.
Corrosion reduces the cross-sectional area of both the longitudinal and transverse bars, affecting the effective confinement index. Additionally, corrosion may be concentrated at specific points rather than uniformly distributed; this is accounted for by introducing the parameter α, which represents the severity of localized corrosion. Due to the formation of corrosion products surrounding the reinforcing bars, the mechanical properties of reinforced concrete are significantly affected. The modulus of elasticity of these corrosion products is higher than that of the surrounding concrete and can even approach that of steel [41,42]. This mismatch in stiffness creates stress concentrations at the concrete–corrosion interface, leading to a more complex internal force distribution. This, in turn, can reduce the overall stiffness of the reinforced concrete and contribute to cracking in the concrete cover.
The pre- and post-peak branches of the stress–strain model (Equations (18) and (20)) vary according to the degree of corrosion and the coefficient alpha (α), which accounts for the reduction in peak stress and strain of unconfined concrete. The recommended value for α is 0.51 [43,44]. While using average corrosion levels is convenient for engineering applications, it may not accurately reflect localized corrosion effects. When corrosion is concentrated in specific regions, the resulting mass loss distribution differs significantly from a uniform model, which can lead to inaccurate assessments of structural integrity. The α coefficient was introduced to account for this discrepancy; however, a fixed parameter does not adapt as corrosion progresses—an approach that experimental studies have shown to be misleading. The following equations define the proposed stress–strain model:
f c =   1 a ε c 1 + b ε c + z ε c 2   for   ε c ε c c
f c = 1 f c c e x p k 1 s ε c c ε c c ( k 2 s ( 1 ) )   f o r   ε c c ε c c
where
= 0.51 3 + e 20 m m 100
where m = L A s ρ s ; here, ρ s is the density of the steel and L is the length of the hoop including the anchorage or 2 S for longitudinal bars. It should be noted that Δm was experimentally measured in this study; however, for prediction purposes, it can be estimated using [45,46]. Equation (20) demonstrates that is not a fixed value but a variable dependent on the corrosion level m m . The coefficients within this semi-empirical expression were calibrated based on regression analysis and visual observations of the corroded bars extracted from the specimens examined in this study for both NSC and MSC types. While this provides a strong correlation for the tested range, further validation may be required for concrete with significantly different compressive strengths or confinement ratios.
The electrochemical corrosion rate, quantified as current density i c o r r , is directly correlated with the physical degradation of the reinforcement. This relationship is often expressed as a section loss rate; where, for example, a current density of 1.0   μ A / c m 2 corresponds to a section loss of approximately 11.5   μ m y e a r and 0.5   μ A c m 2 corresponds to 5.5   μ m / y e a r .This physical material loss is a critical parameter for service-life modeling, as it governs the time to cracking. Experimental work by Rodriguez-Martin et al. (2015) [45] demonstrated that a section loss of only 15–40 mm is sufficient to induce cover cracking in bars with a cover-to-diameter ratio between 2 and 4. This threshold corresponds to the transition from a low to moderate corrosion rate (approx. 0.5   m A / c m 2 ) [46,47].
To ensure structural safety, it is essential to assess the failure mode caused by mass loss. This loss may manifest as localized depressions, which can lead to rupture of the bar, or as generalized corrosion (affecting 100% of the bar circumference), which causes a significant reduction in the diameter of the reinforcing bars or stirrups. If such severe conditions exist, the affected reinforcement should be excluded from load-bearing capacity calculations. This exclusion can be simulated by applying a steel reduction factor (e.g., a ) to the contribution of the reinforcement within the closed core. Alternatively, if corrosion causes significant cross-sectional loss that is not yet critical, a more conservative and safety-oriented approach is to model this loss as being concentrated at one critical location.
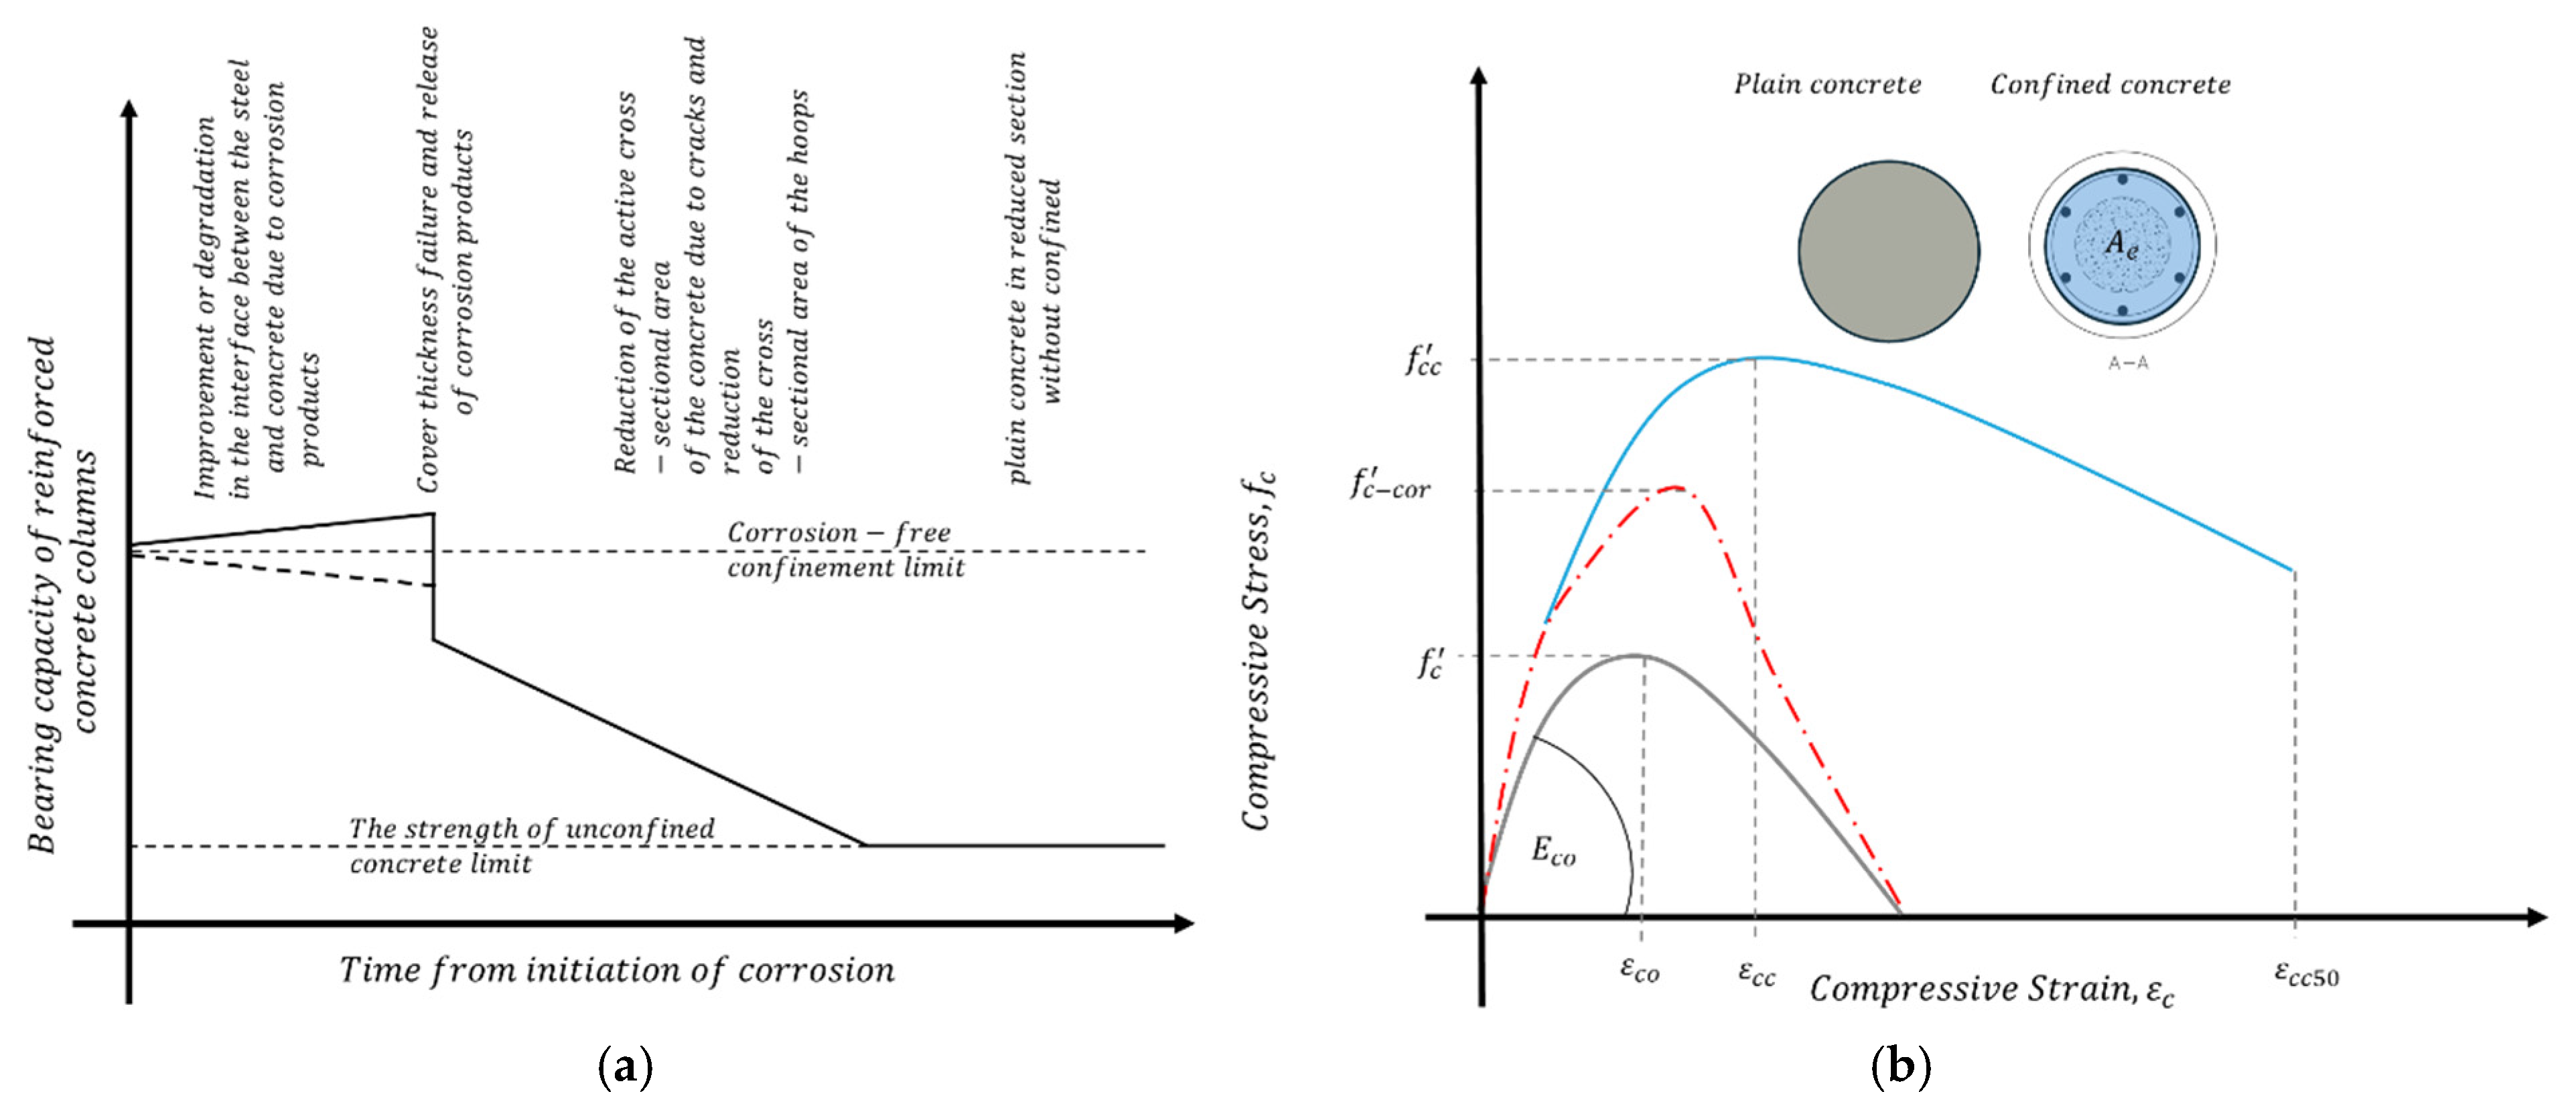
Figure 3 illustrates the confinement model of reinforced concrete over time, comparing unreinforced concrete, confined concrete (Figure 3a) and confined concrete with corroded reinforcement (Figure 3b).

4. Results and Discussion

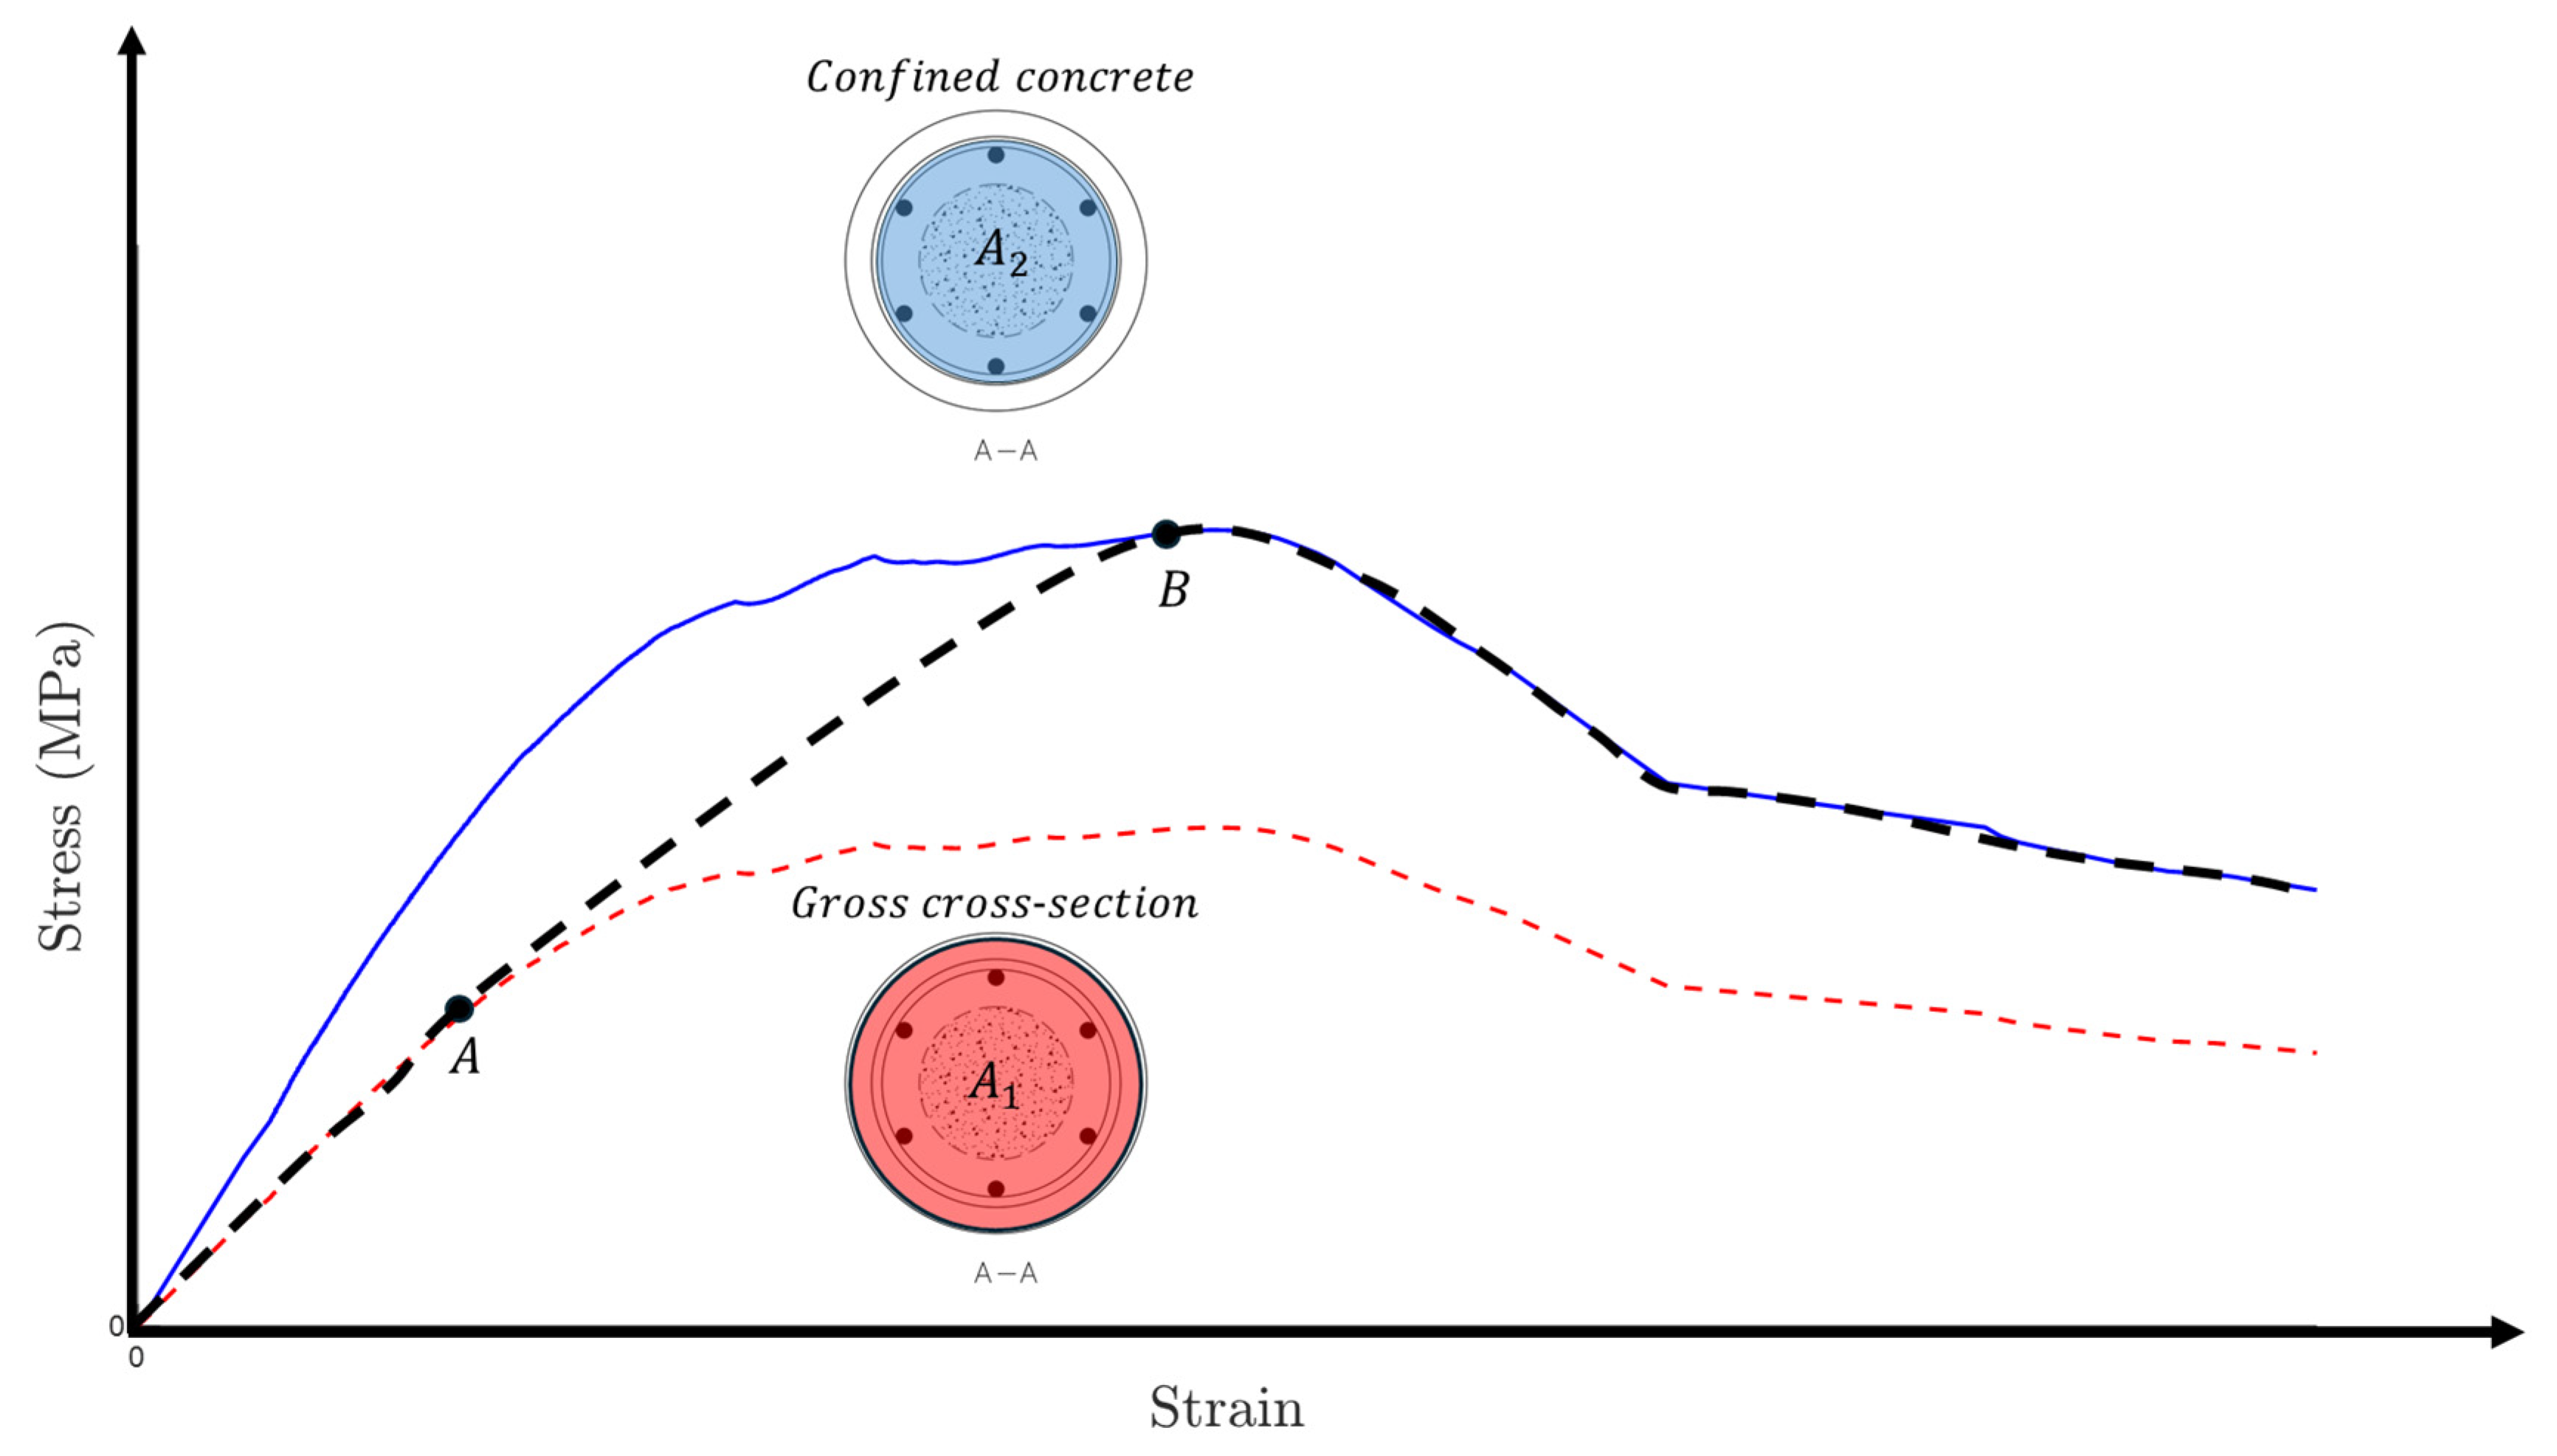
The axial load versus axial strain curves of all specimens are given in Figures 5b, 7b, 10b, 12b, 15b and 17b. The stress–strain curves of the confined concrete are estimated using a technique based on [32,48,49,50]. The response of the confined concrete, shown in Figure 4, initially follows the ascending portion of the full cross-section area (denoted A1 in the lower red curve) up to point A, which corresponds to the spalling of the concrete cover. After this point, the cover no longer contributes to axial strength and the response shifts to the upper stress–strain curve (blue line in Figure 4), where the stress is derived based on the axial load divided by the confined cross-section area denoted A2 (core cross-section defined by center-to-center of hoops). The transition between points A (full cross-section) and B (core cross-section) is approximated as a smooth curve, shown as a black dashed line. It should be noted that the stress of the concrete is derived by subtracting the contribution of the longitudinal steel before dividing the axial load by the relevant cross-sectional area (A1 or A2 based on the above and Figure 4). The axial stress–strain behavior of the longitudinal steel reinforcement is based on the tensile tests performed on steel bars and is presented in Table 3.
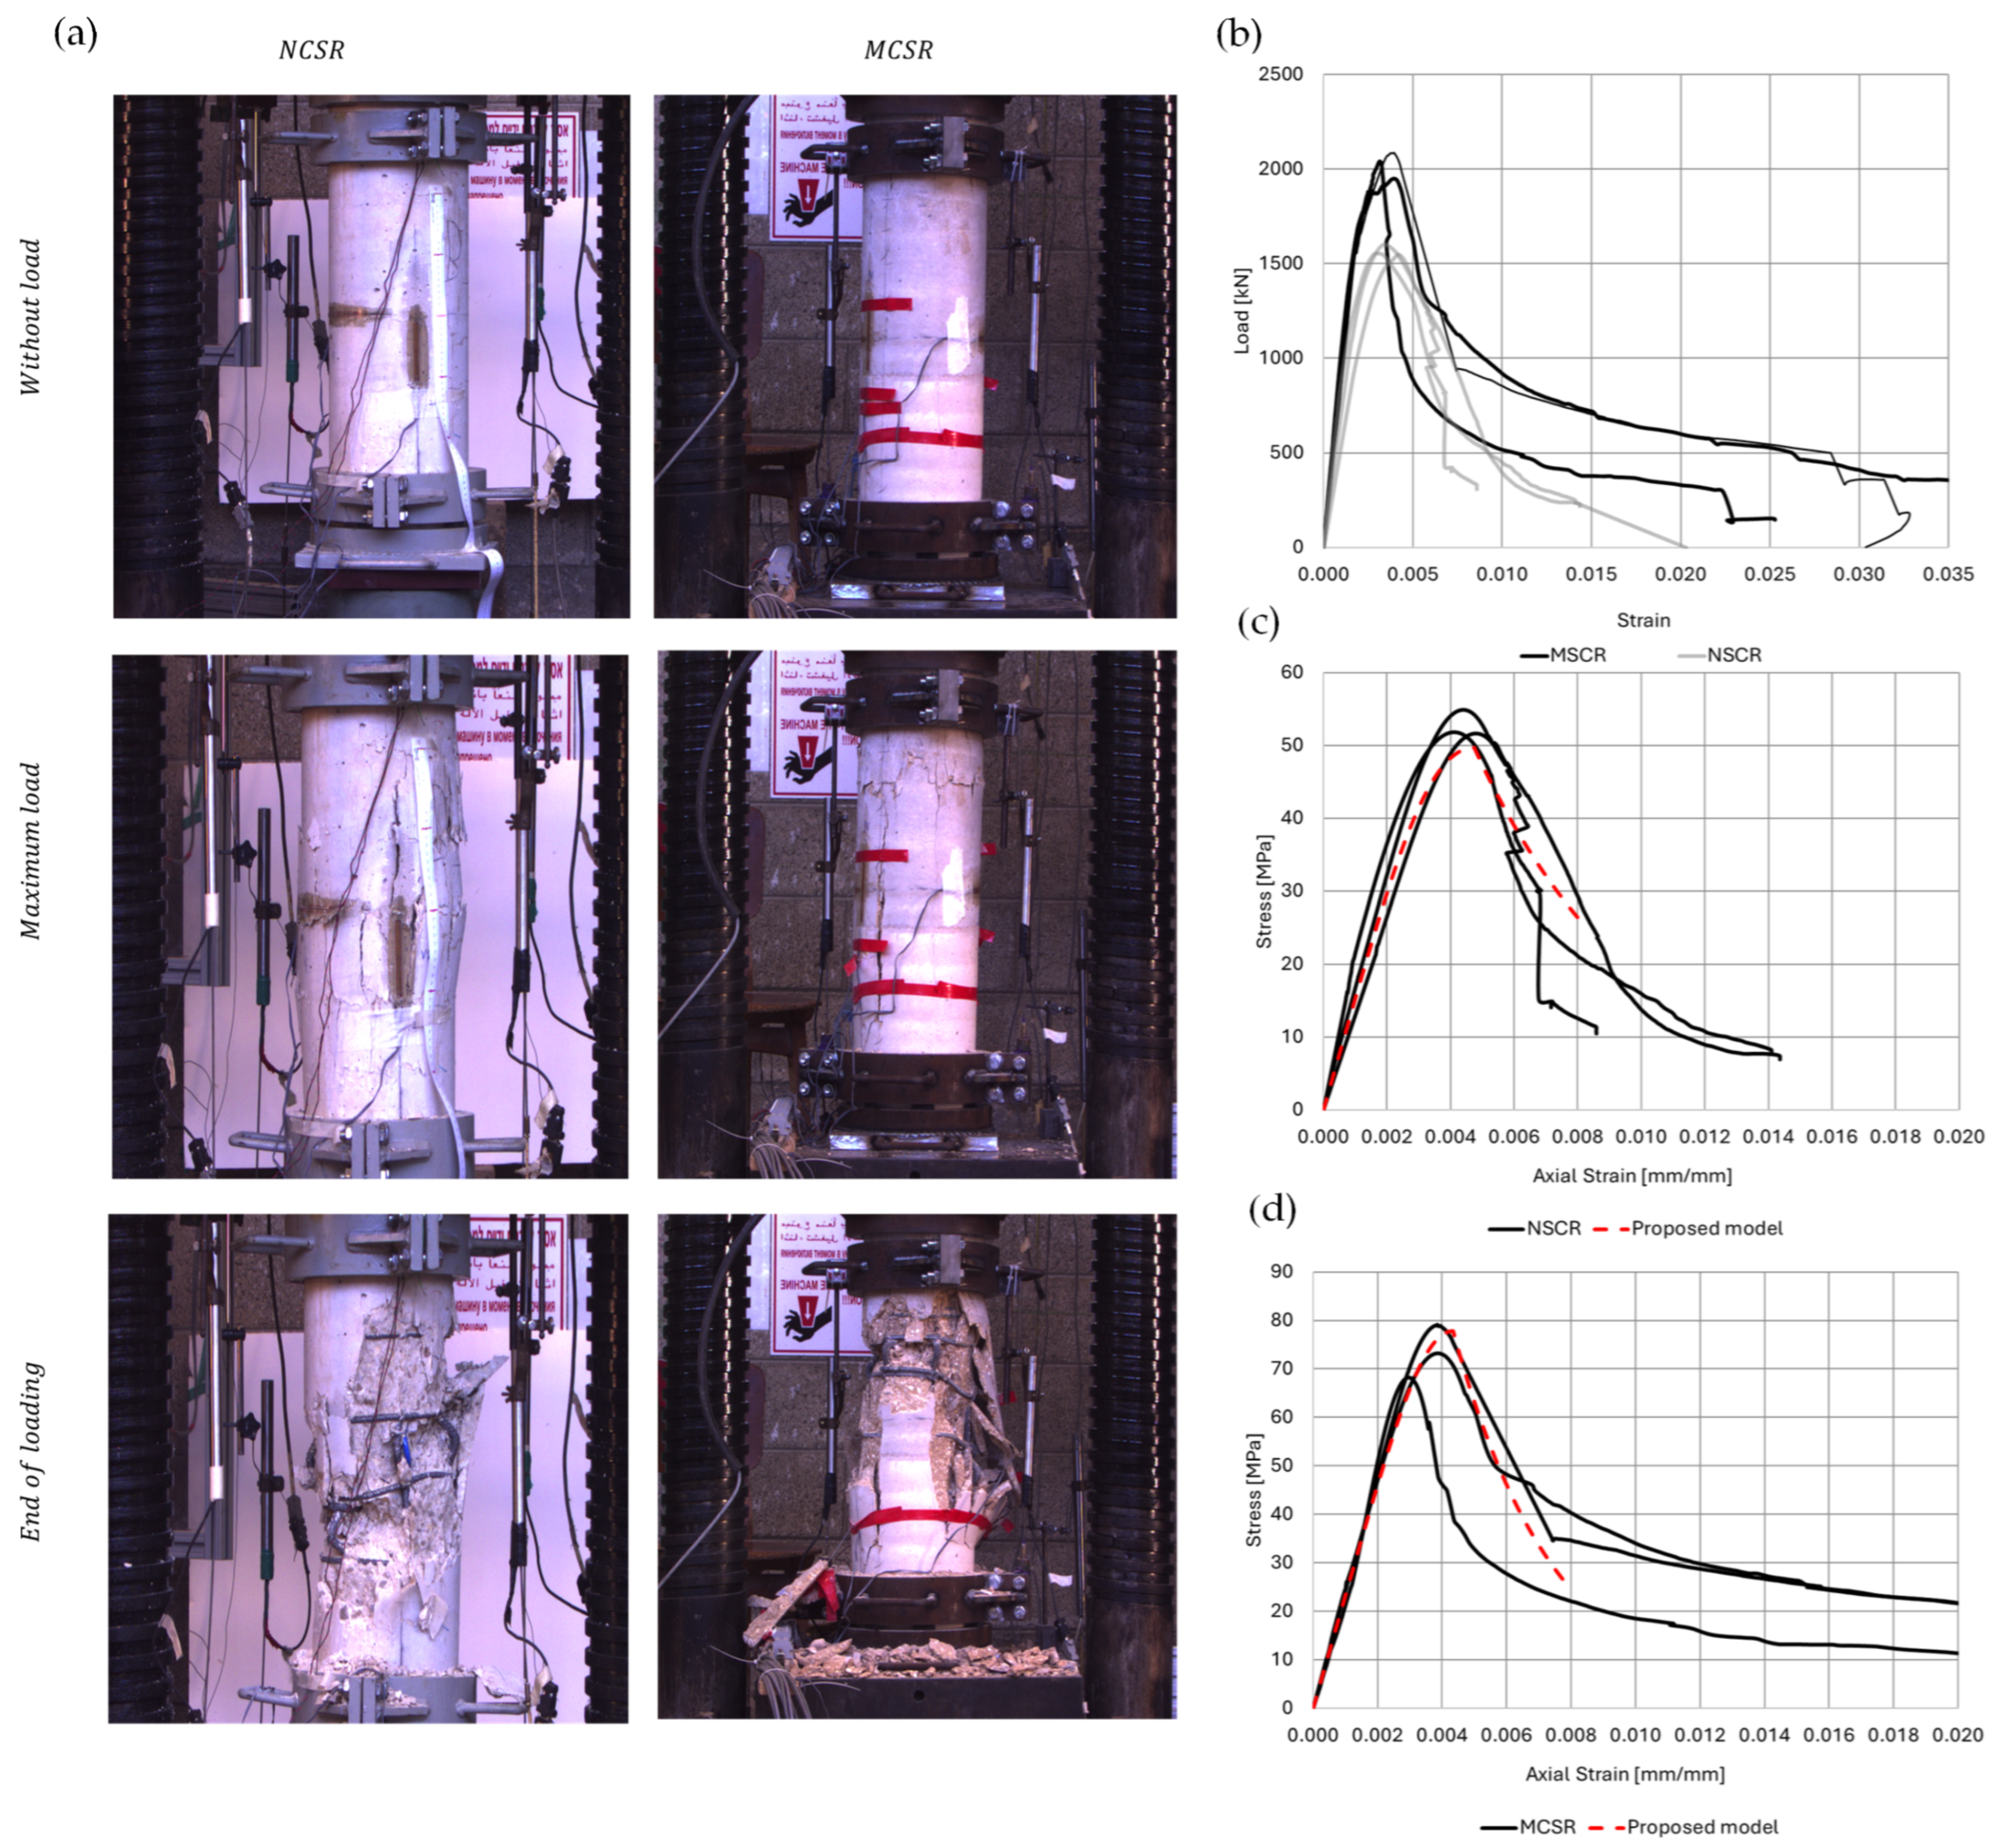
Reference specimens of concrete columns, which were not exposed to electrical voltage or chlorides, were tested after 90 days of water curing. The testing machine was set to apply a load at a rate of 100–180 kN/min until the concrete cover failed. The loading rate was then reduced to obtain post-peak measurements. Figure 5 shows the results for three reference pairs of NSC and MSC specimens (NSCR and MSCR). Figure 5a shows the reference specimens in three main stages: initially before loading, at peak load, and after the test was completed. As the specimen approaches peak load, cracks form but the concrete cover has not yet peeled off. These cracks run parallel to the reinforcing bars, marking an area that eventually leads to buckling of the longitudinal bars. Figure 5b presents the applied axial load versus the axial strain (derived from the average of 4 LVDTs, divided by the measurement length between their connection points to the specimen) for NSCR and MSCR specimens. Figure 5c,d show the experimental stress–strain curves and those predicted based on the proposed model, indicating good agreement between the experimental and analytical curves. It should be noted that the model calculation, represented by the dashed red line in Figure 5c,d, was performed using the MATLAB (R2022b) software based on Equations (3)–(20).

4.1. Effect of Wetting and Drying in Salt Solution

A process of wetting and drying with salt water simulates the severe exposure conditions to which most infrastructure is subjected [51].
In concrete that has surpassed the initial corrosion stage but is not yet cracked, we expect to see an increase in internal forces due to the expansion of corrosion products. Evidence for this is seen in the temporal changes in longitudinal and transverse stresses within the specimens, as compared to a control specimen that remained in a constant dry state. These stresses, while small, are sufficient to initiate crack formation without significantly affecting the load-carrying capacity.
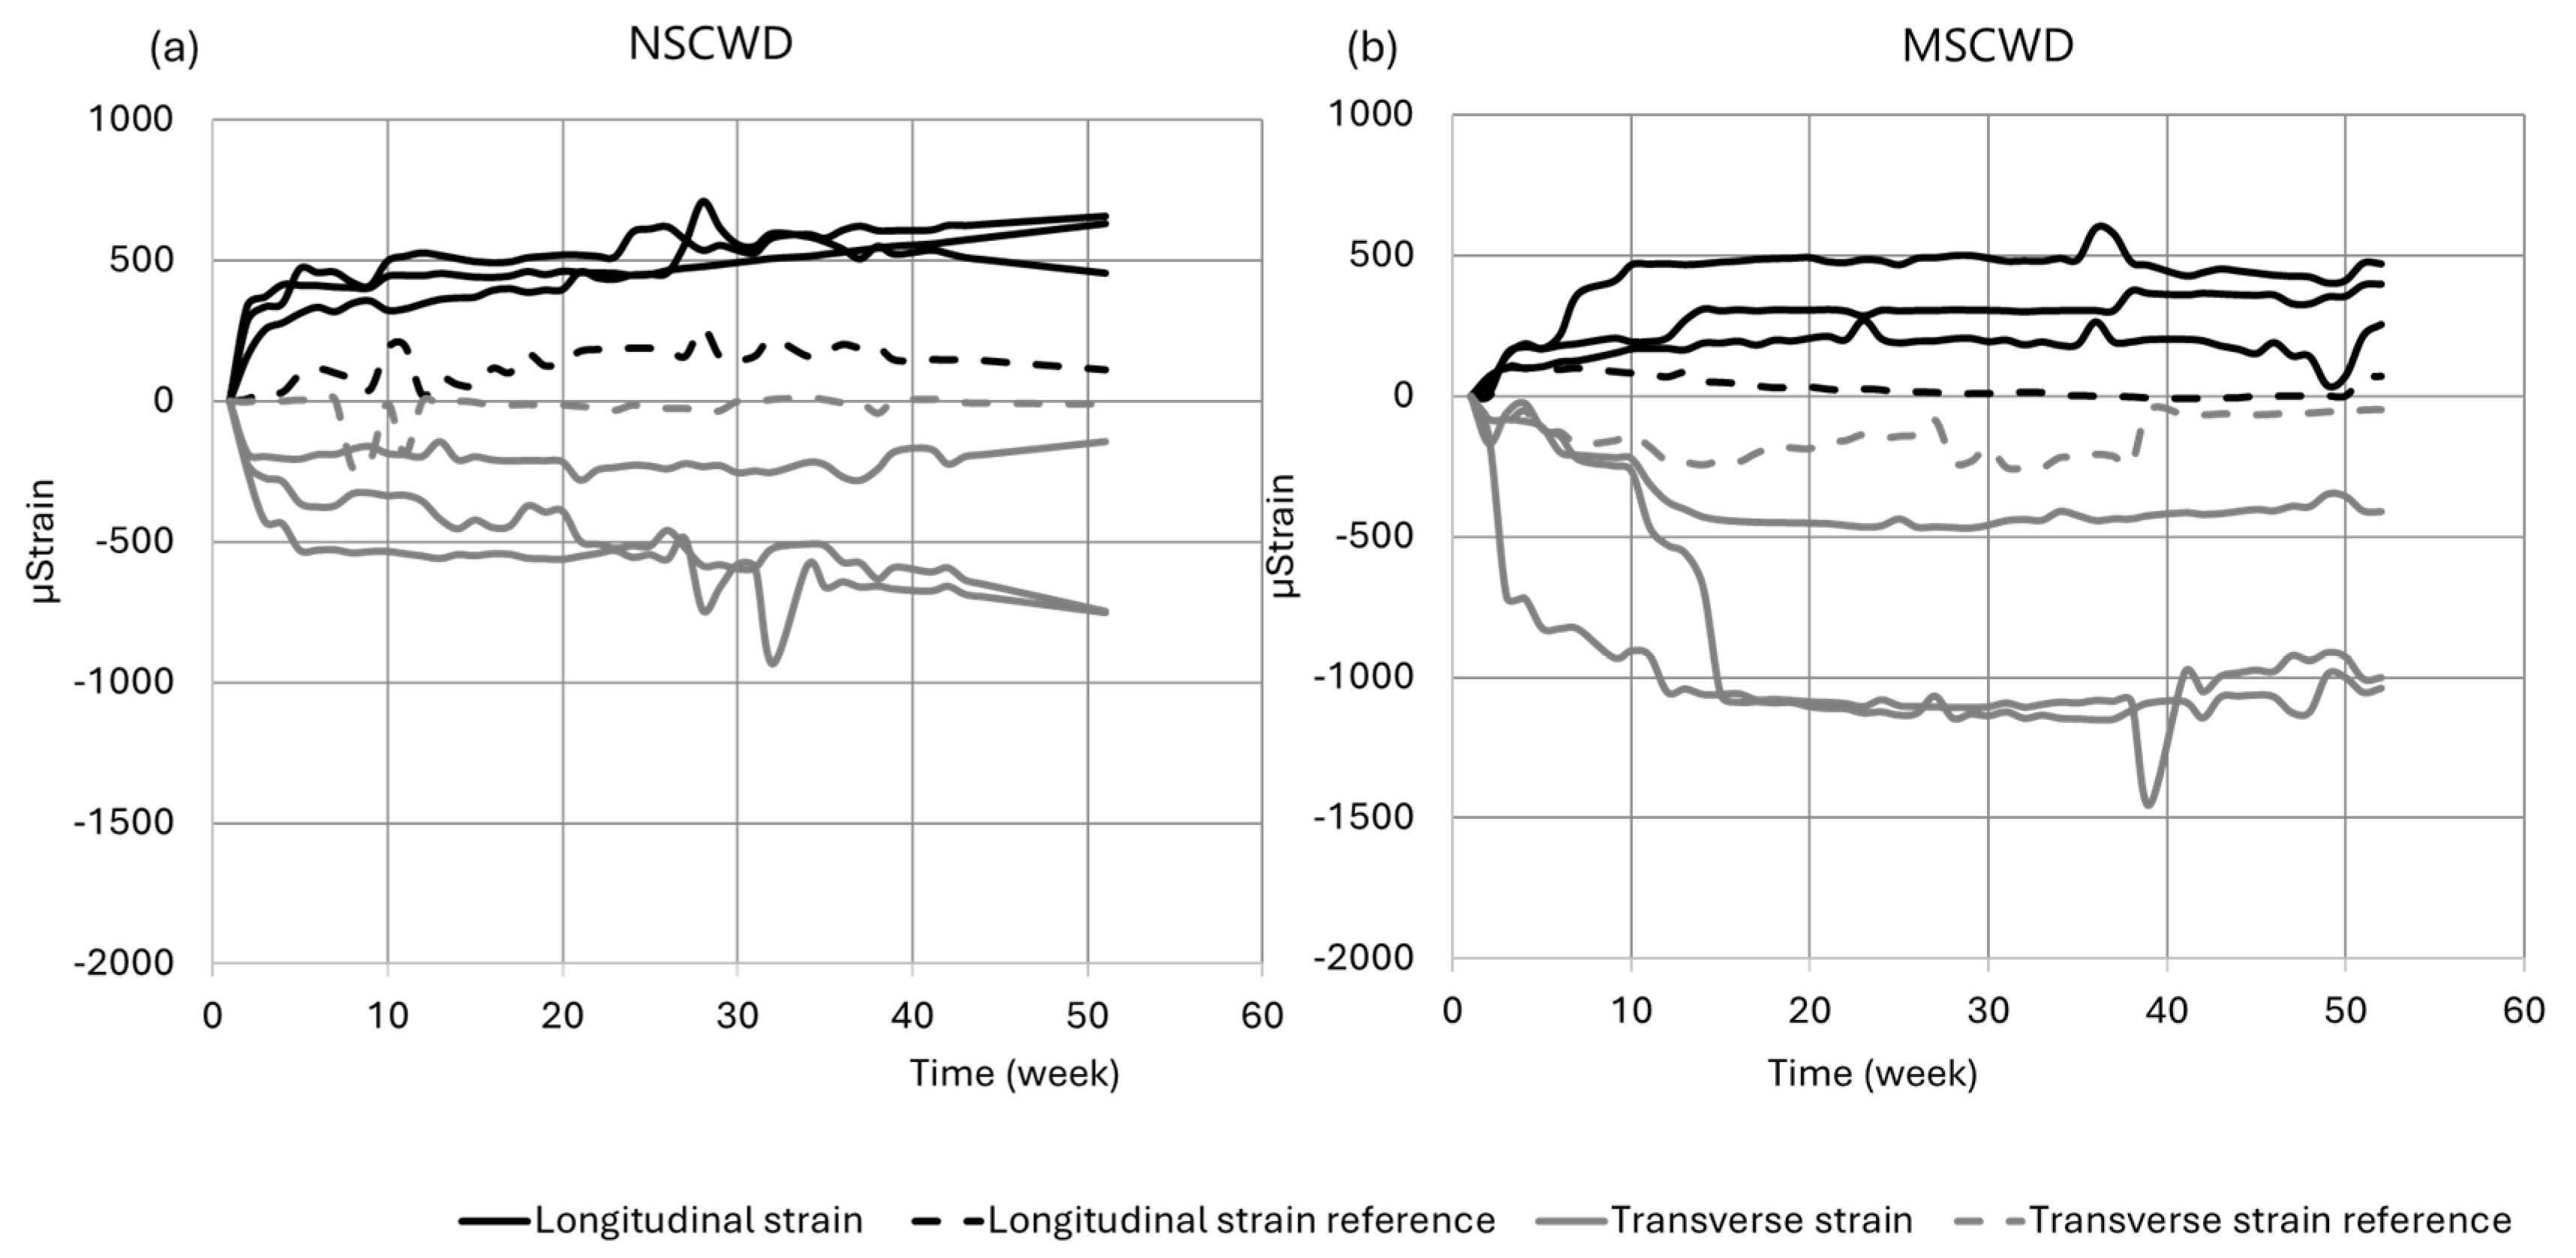
During the wetting and drying cycles in chloride solution, both transverse and longitudinal strains were measured in the concrete samples. Figure 6 presents these results. The initial strain changes observed in the graph reflect stresses within the concrete induced by two primary factors: cyclic variations in moisture content and the expansion of corrosion products forming on the steel reinforcement due to chloride ingress. The results suggest that the longitudinal expansion observed in the column samples is primarily driven by internal stresses generated as corrosion products expand transversely around the reinforcement. Furthermore, the measured transverse strain is influenced by concrete shrinkage—an effect that is notably more pronounced in the samples subjected to wetting and drying cycles compared to the reference samples.
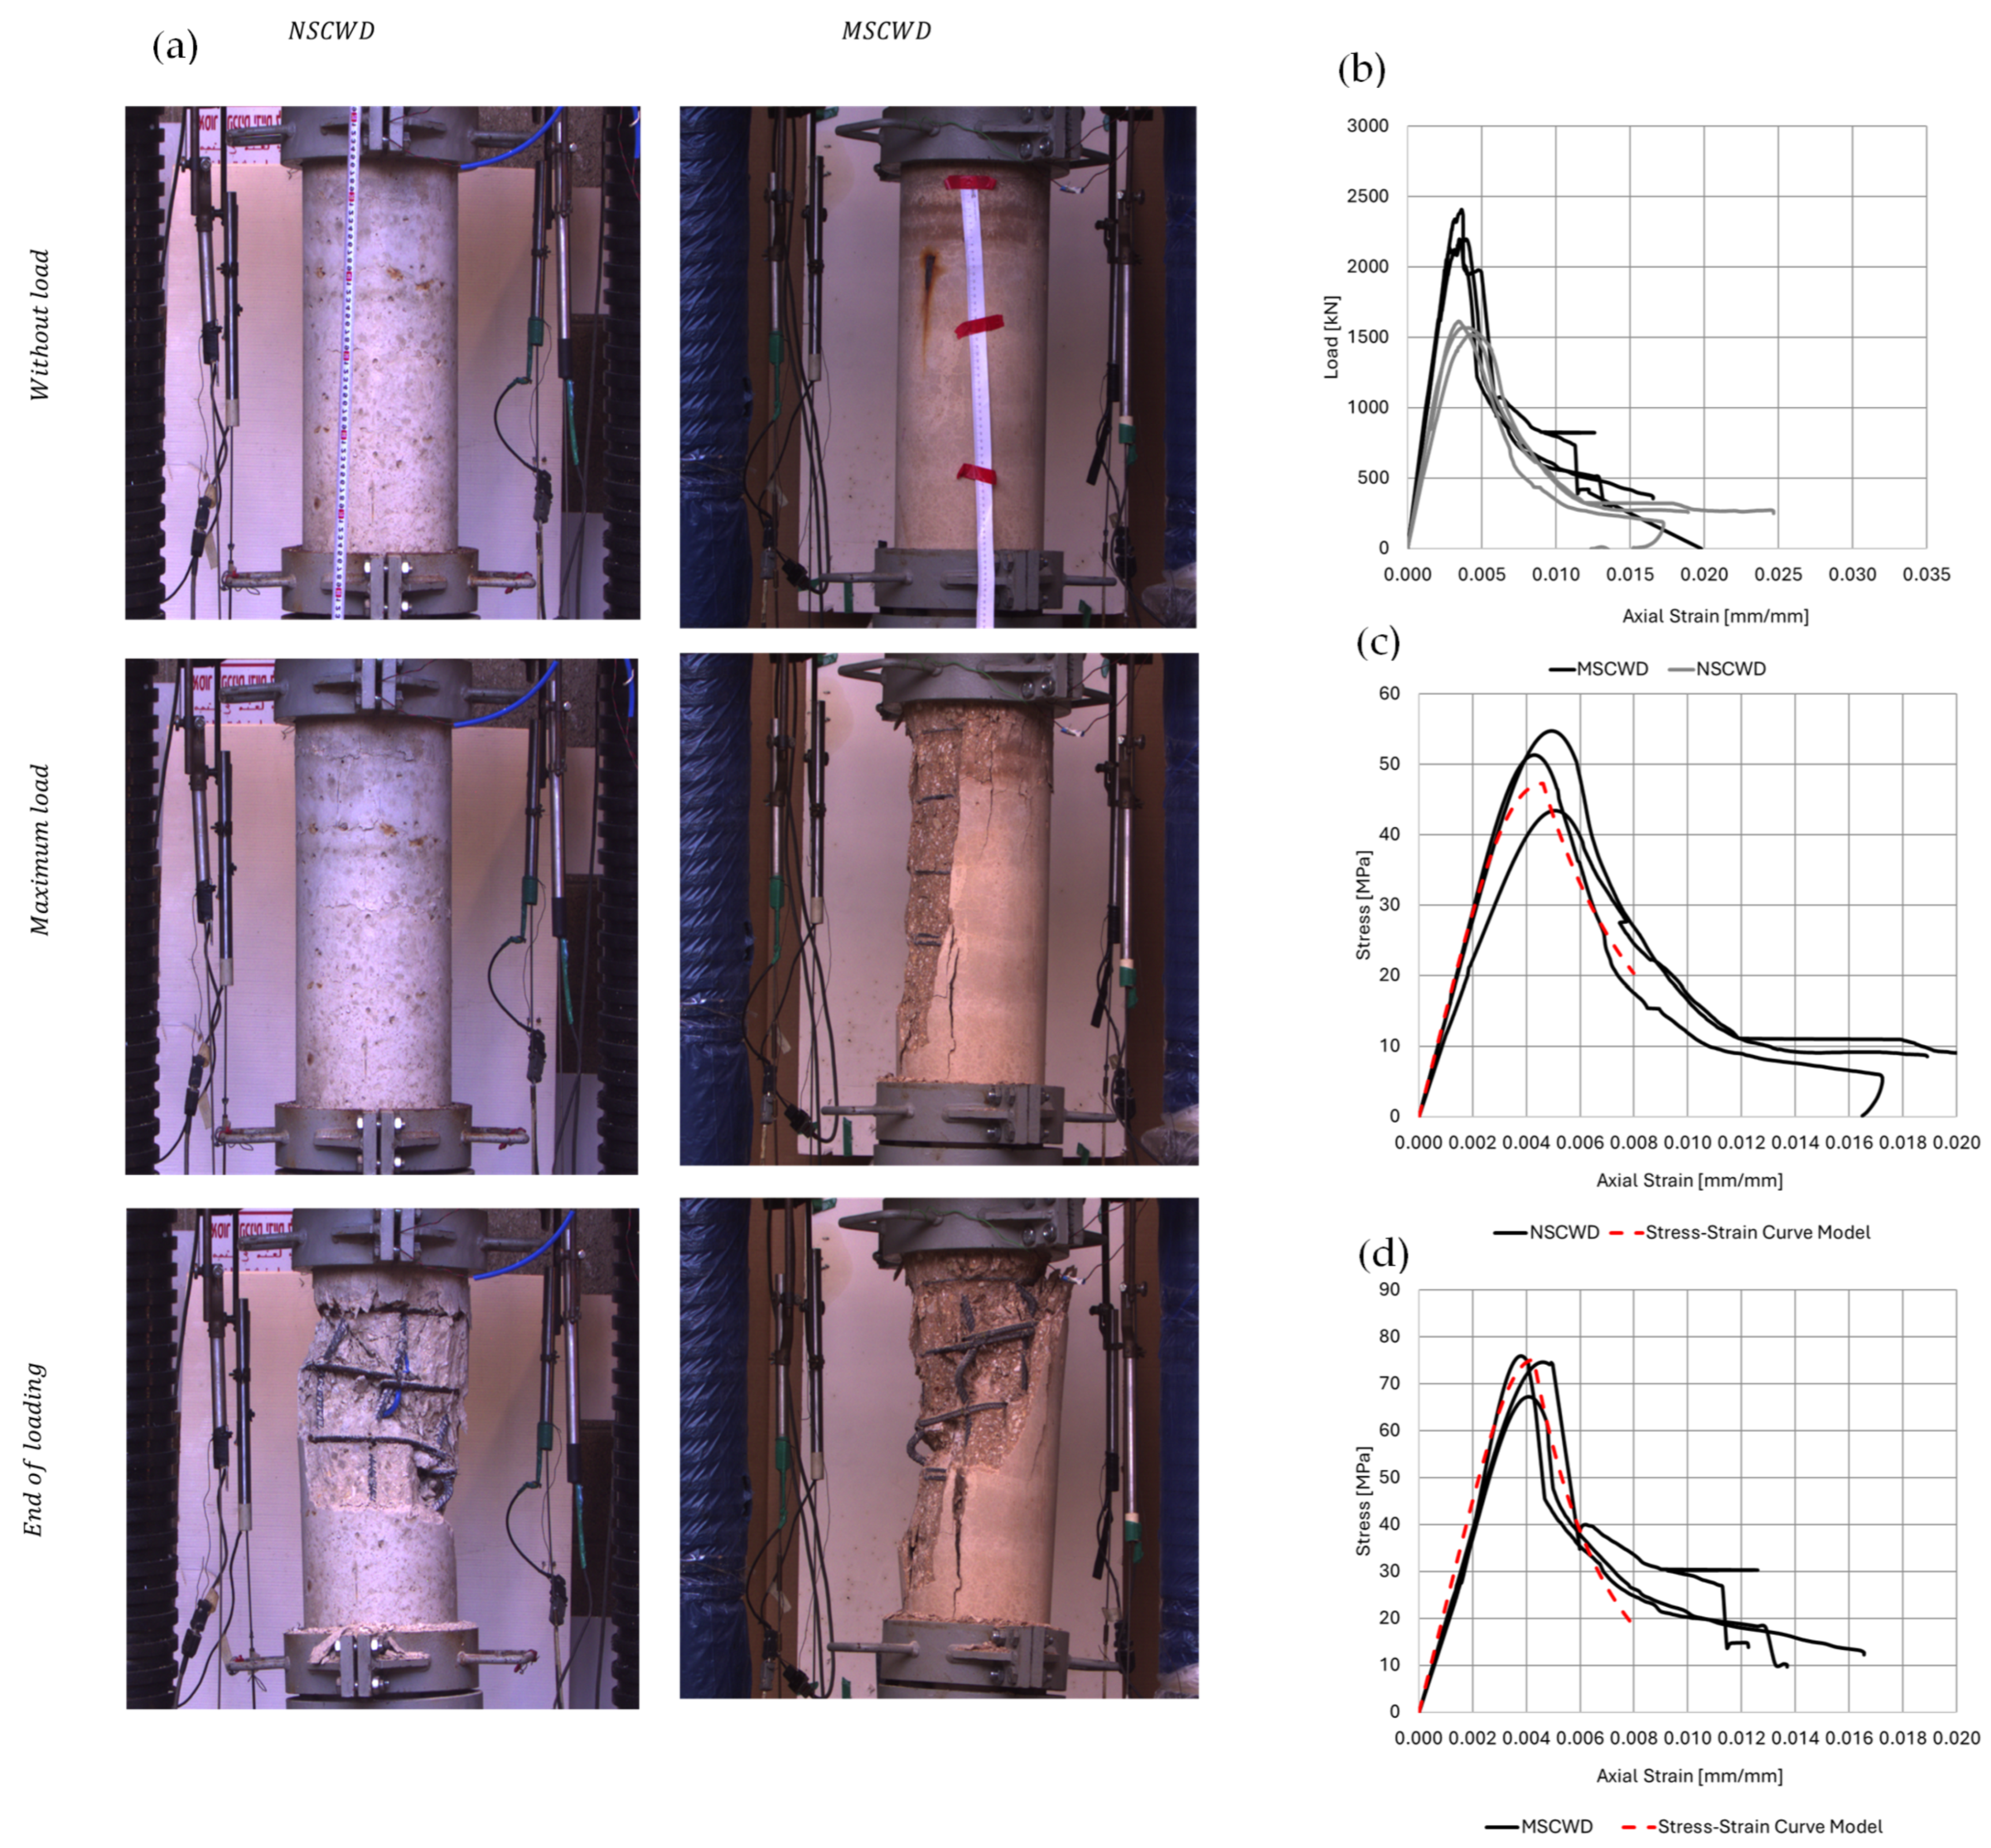
Figure 7 illustrates the effect of wetting/drying cycles on the load–strain diagrams. A slight increase in concrete strength was observed compared to the reference concrete (see Figure 5), which suggests an increase in load-bearing capacity despite the presence of rust on the reinforcement and visible crack patterns. This slight strengthening may be attributed to additional hydration caused by the cyclic exposure to moisture.
The variations in strength changes among the samples could be attributed to capillary suction—a mechanism that initially increases the material’s mechanical strength while simultaneously compromising its elastic properties through the formation of micro-cracks [48].
After 52 cycles, the average ultimate load capacity for the MSC specimens was 2266 kN and that for the NSCE specimens was 1569 kN. Post-test reinforcement analysis revealed mass loss due to corrosion. For the longitudinal bars removed from the failed MSC and NSC specimens, the final masses were 96.8% and 96.6% of their original masses, respectively. Similarly, the final masses of the transverse reinforcement (hoops) were 97.6% and 97.7% of their original masses for the MSC and NSC specimens, respectively. This mass reduction represents the maximum loss under the given natural conditions after one year of exposure.
Finally, Figure 7c,d present the experimental as well as the predicted stress–strain curves. The predicted model calculations were performed according to Equations (18)–(21), with the experimental measured mass loss introduced as Δm.
A study by [49] examined the physical and mechanical properties of concrete under dry–wet cycles, focusing on the relationship between strength and concrete pore structure at a microscopic scale. The results showed that concrete strength initially increased but then decreased after 40 cycles. The analysis of the pore structure revealed that as the number of cycles increased, porosity, total pore volume, and pore diameters all initially decreased before subsequently increasing. The study identified the final characteristics of pore crystallization as the intrinsic cause of the later loss of concrete strength. This same mechanism—initial densification followed by a later degradation of the concrete pore structure due to crystallization—is the likely cause of the strength changes observed in the samples of the present study.

4.2. Effect of Accelerated Corrosion—Simulation of Stray Currents

4.2.1. Exposure Conditions: 9 Volts in Salt Solution (MSCV9 and NSCV9)

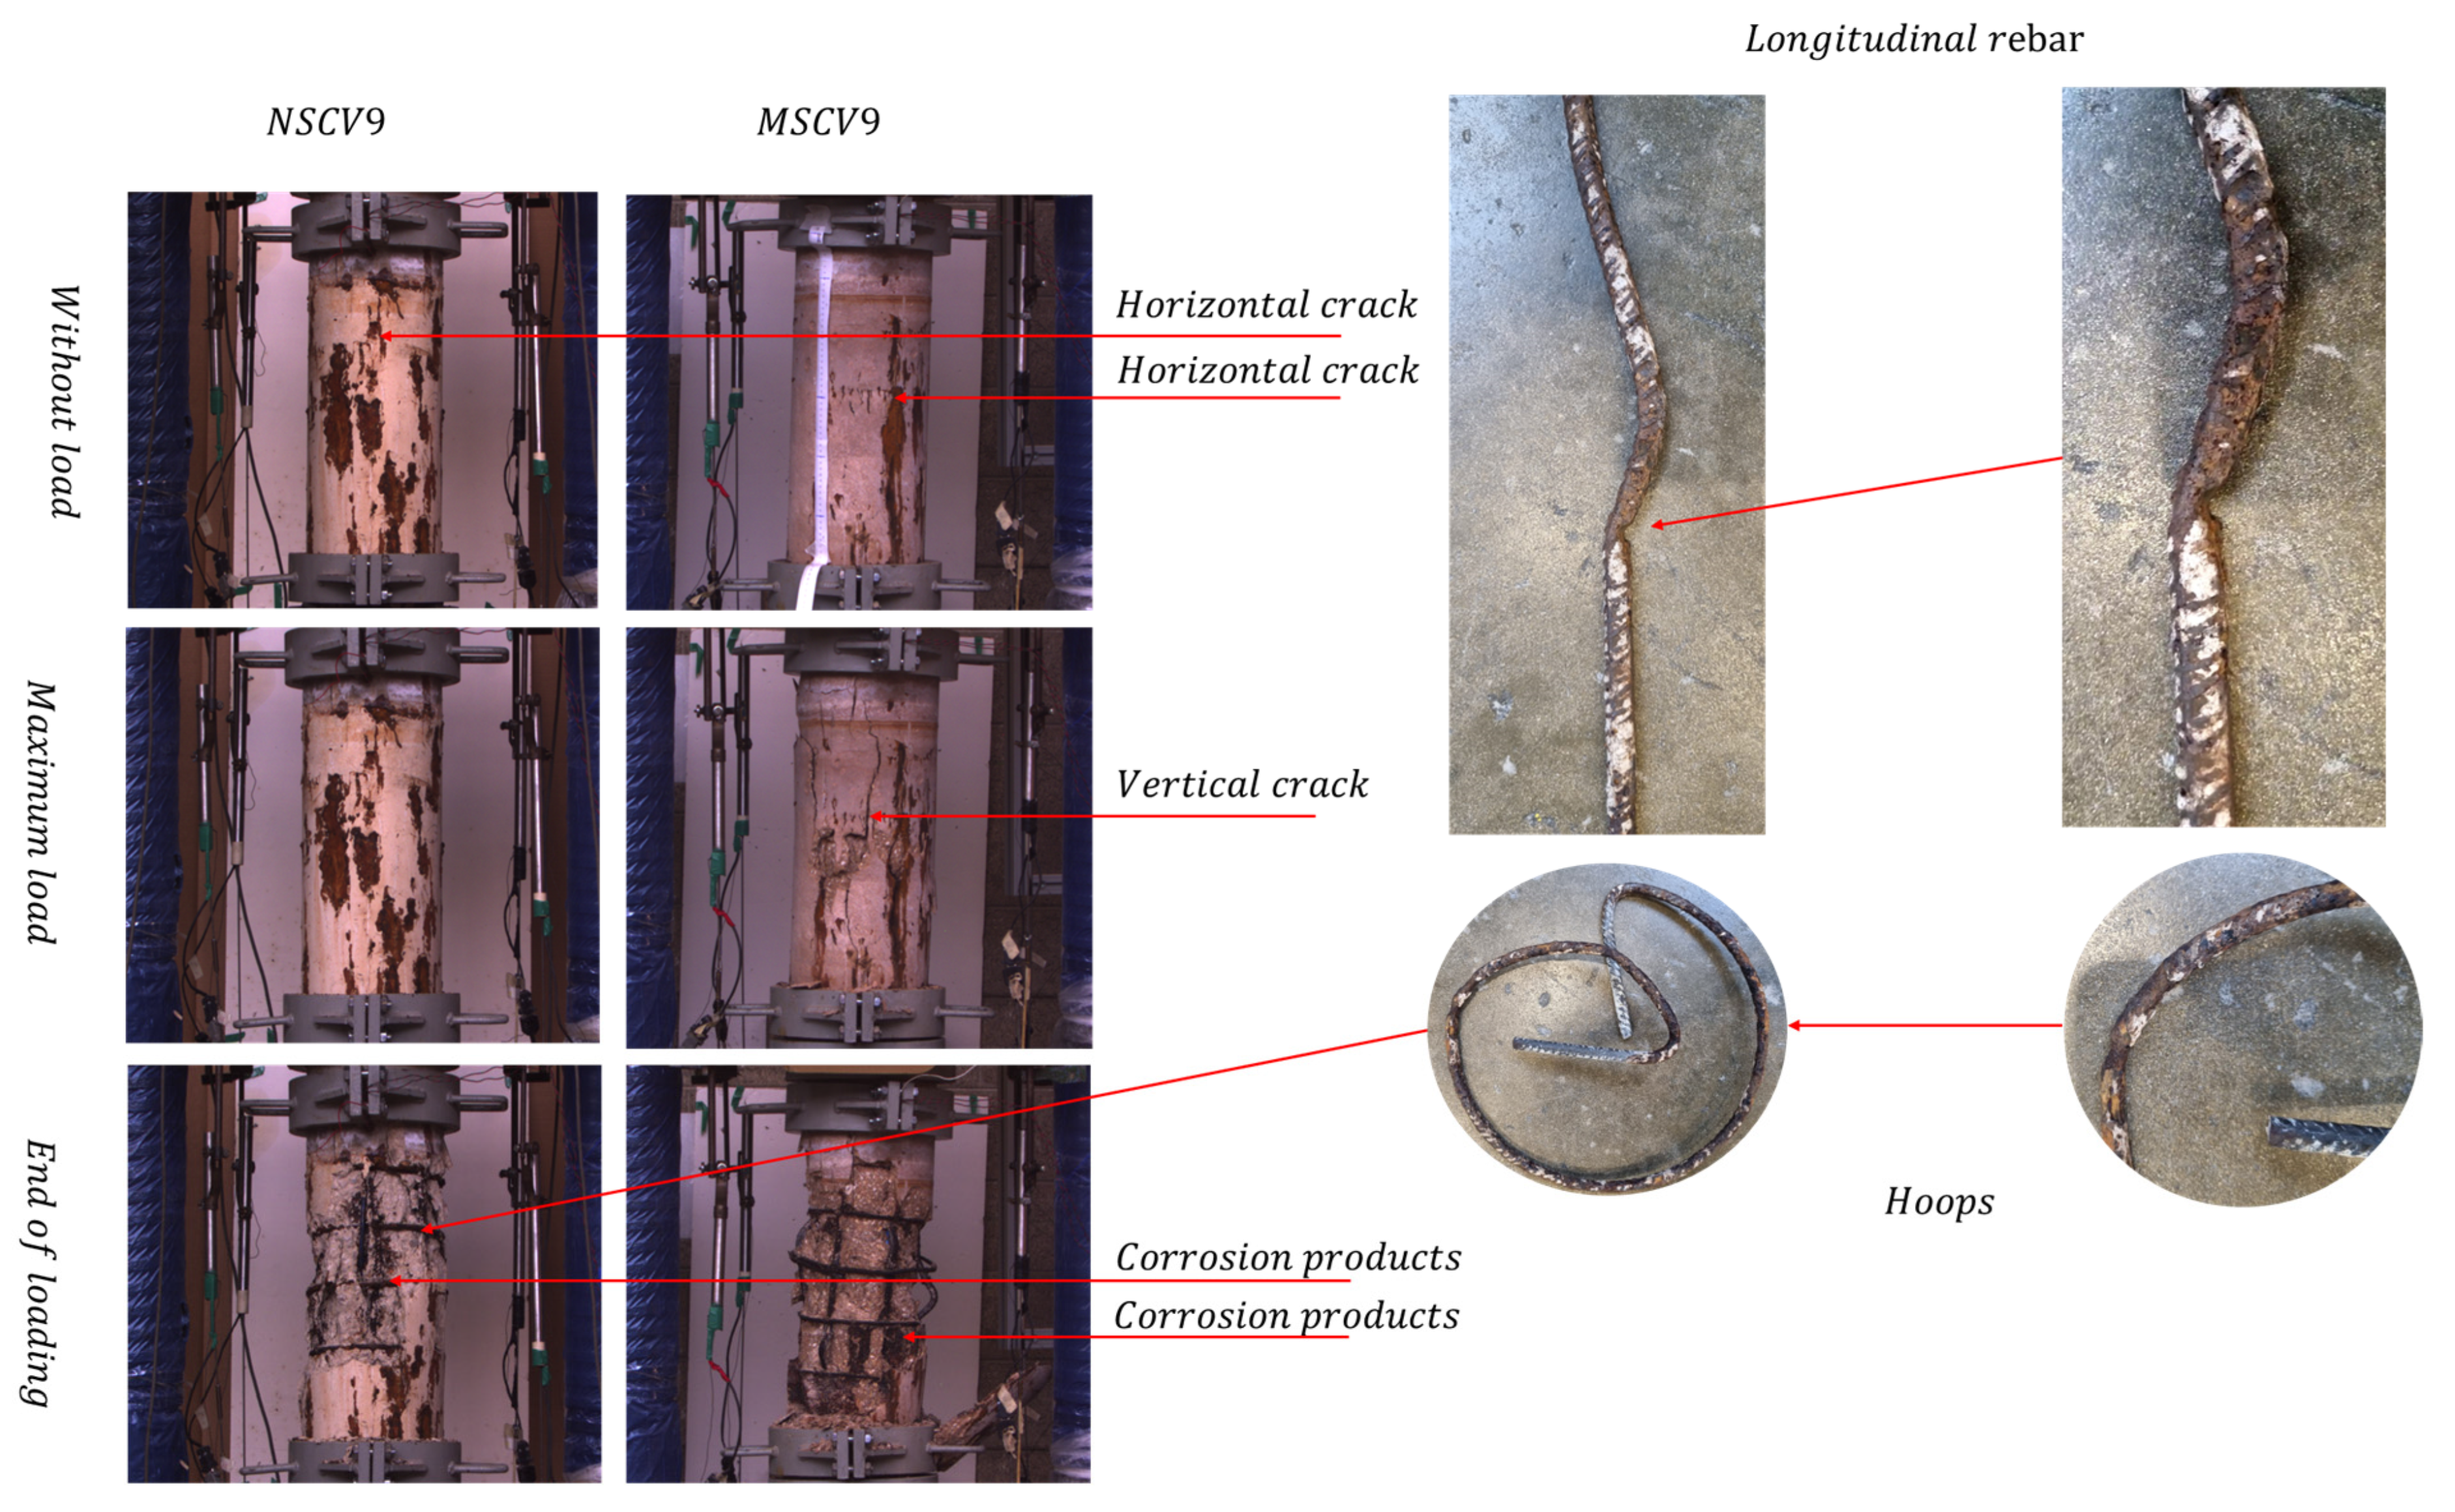
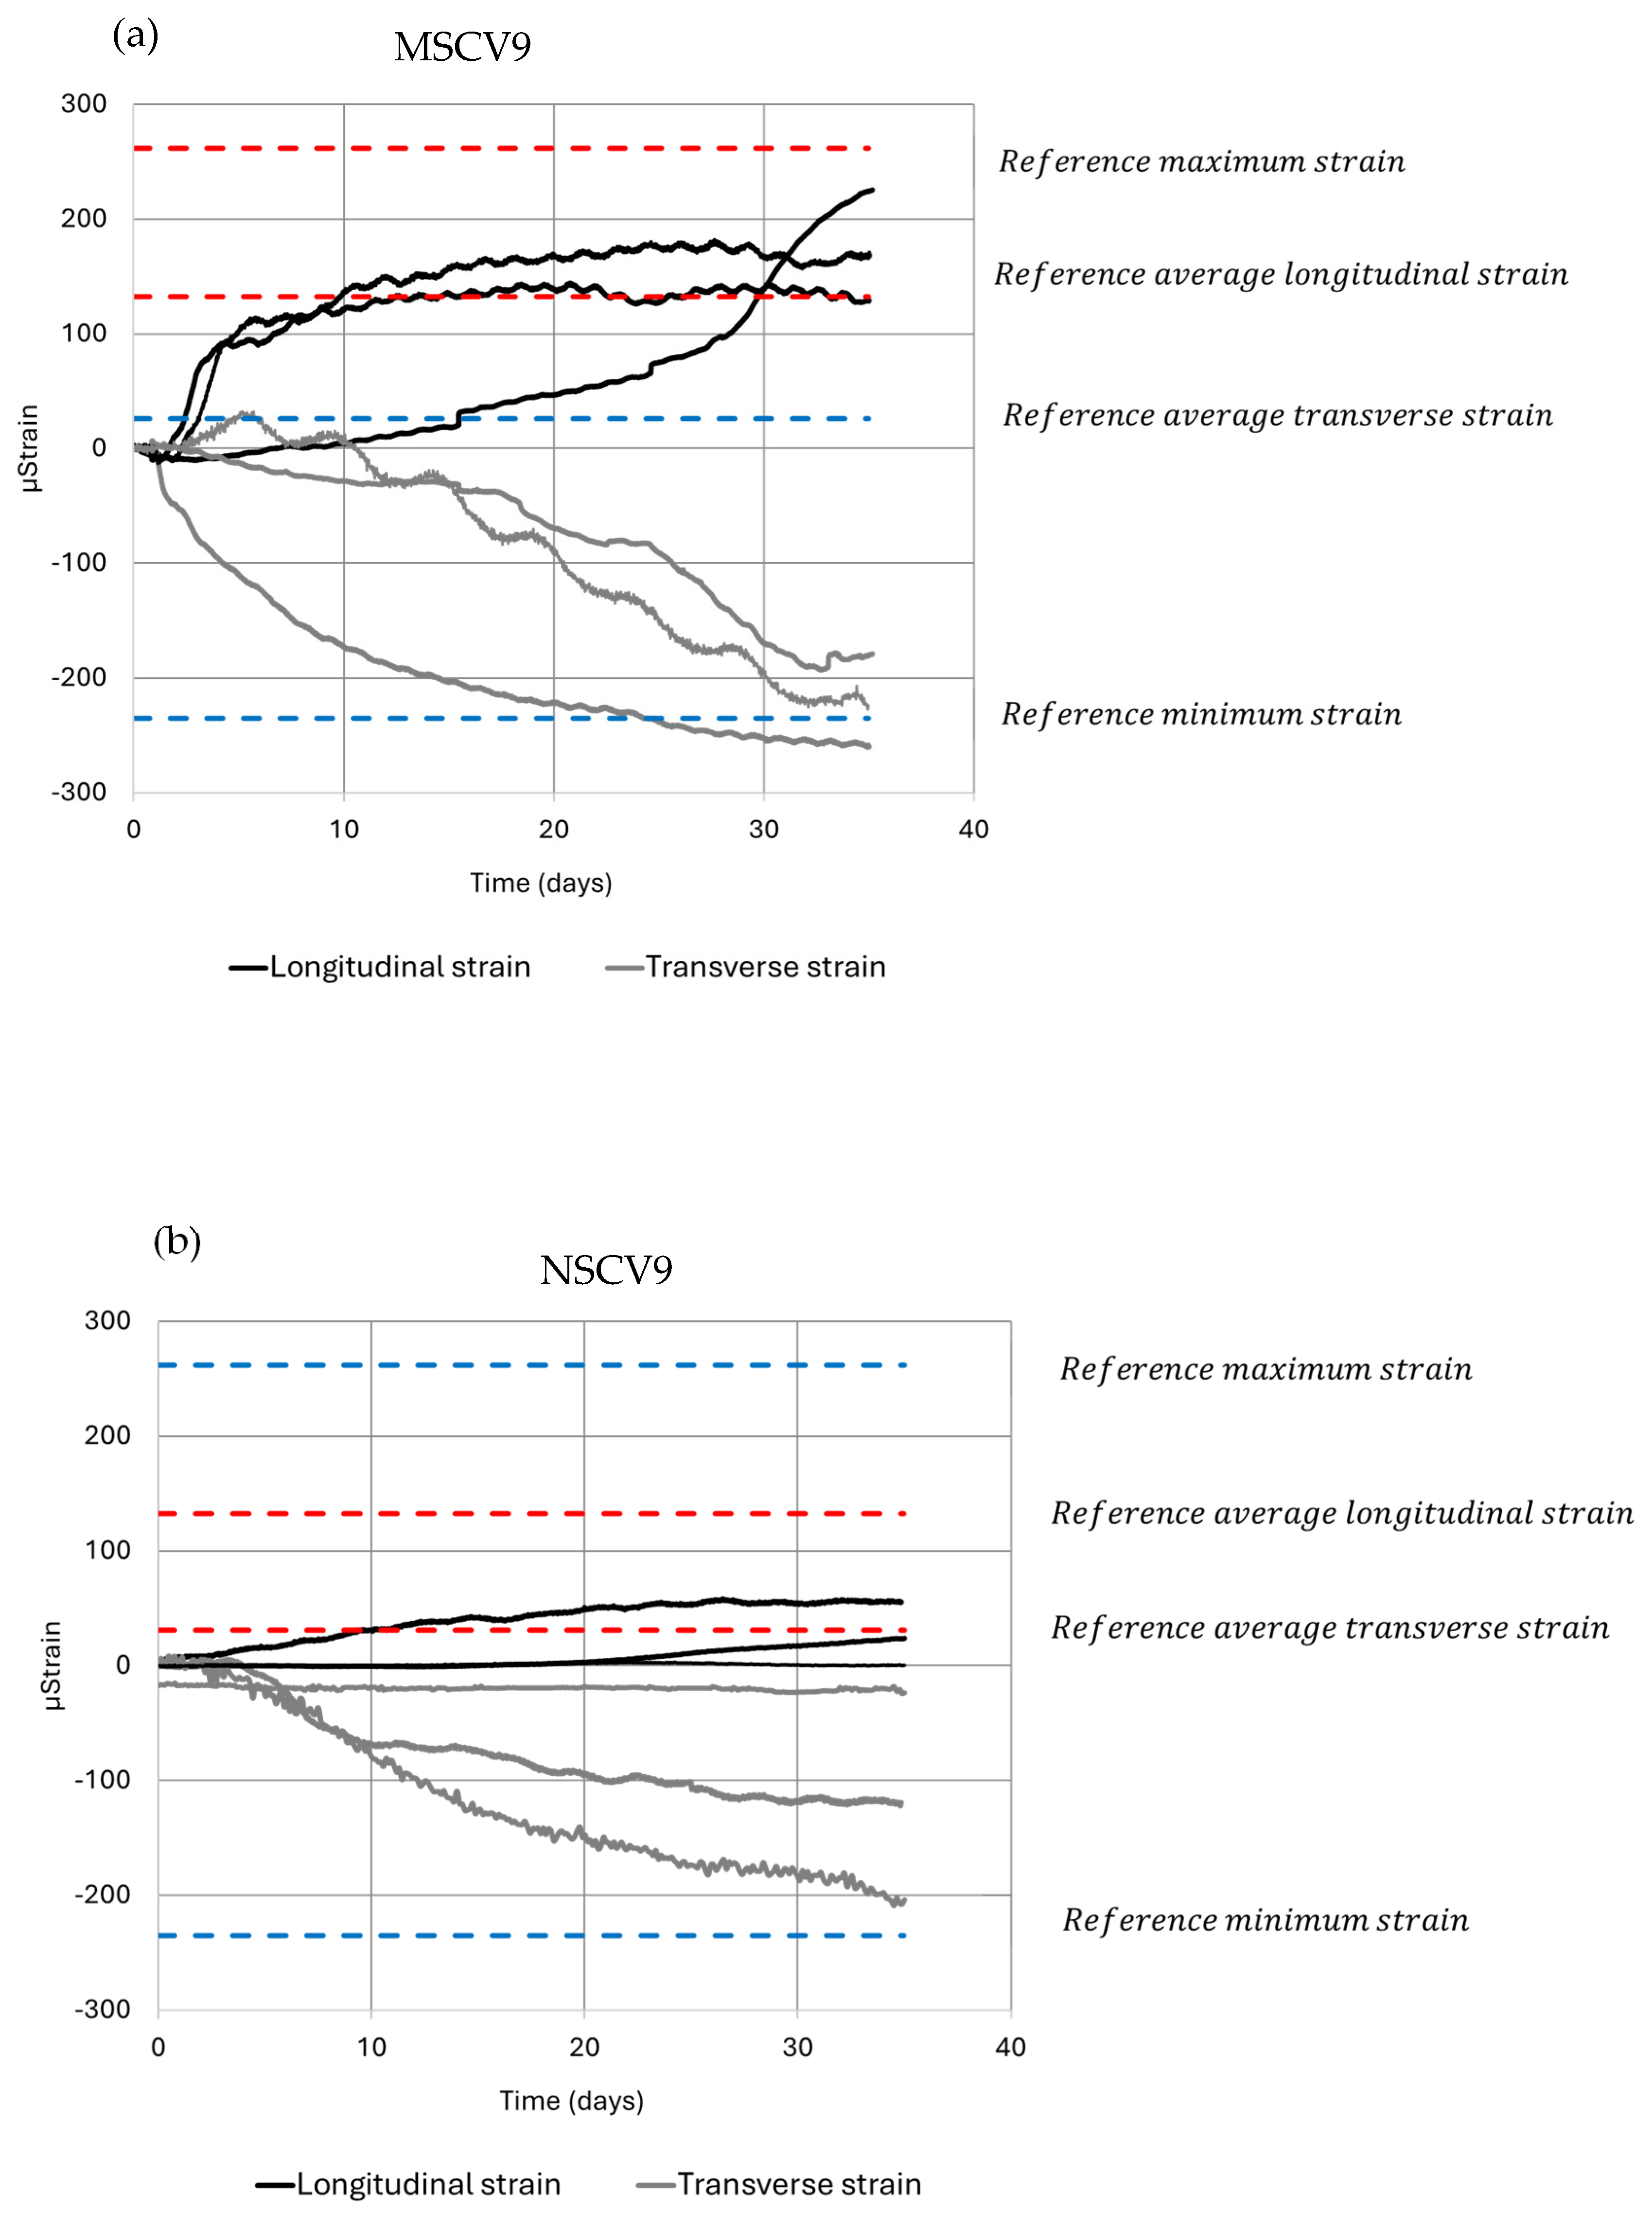
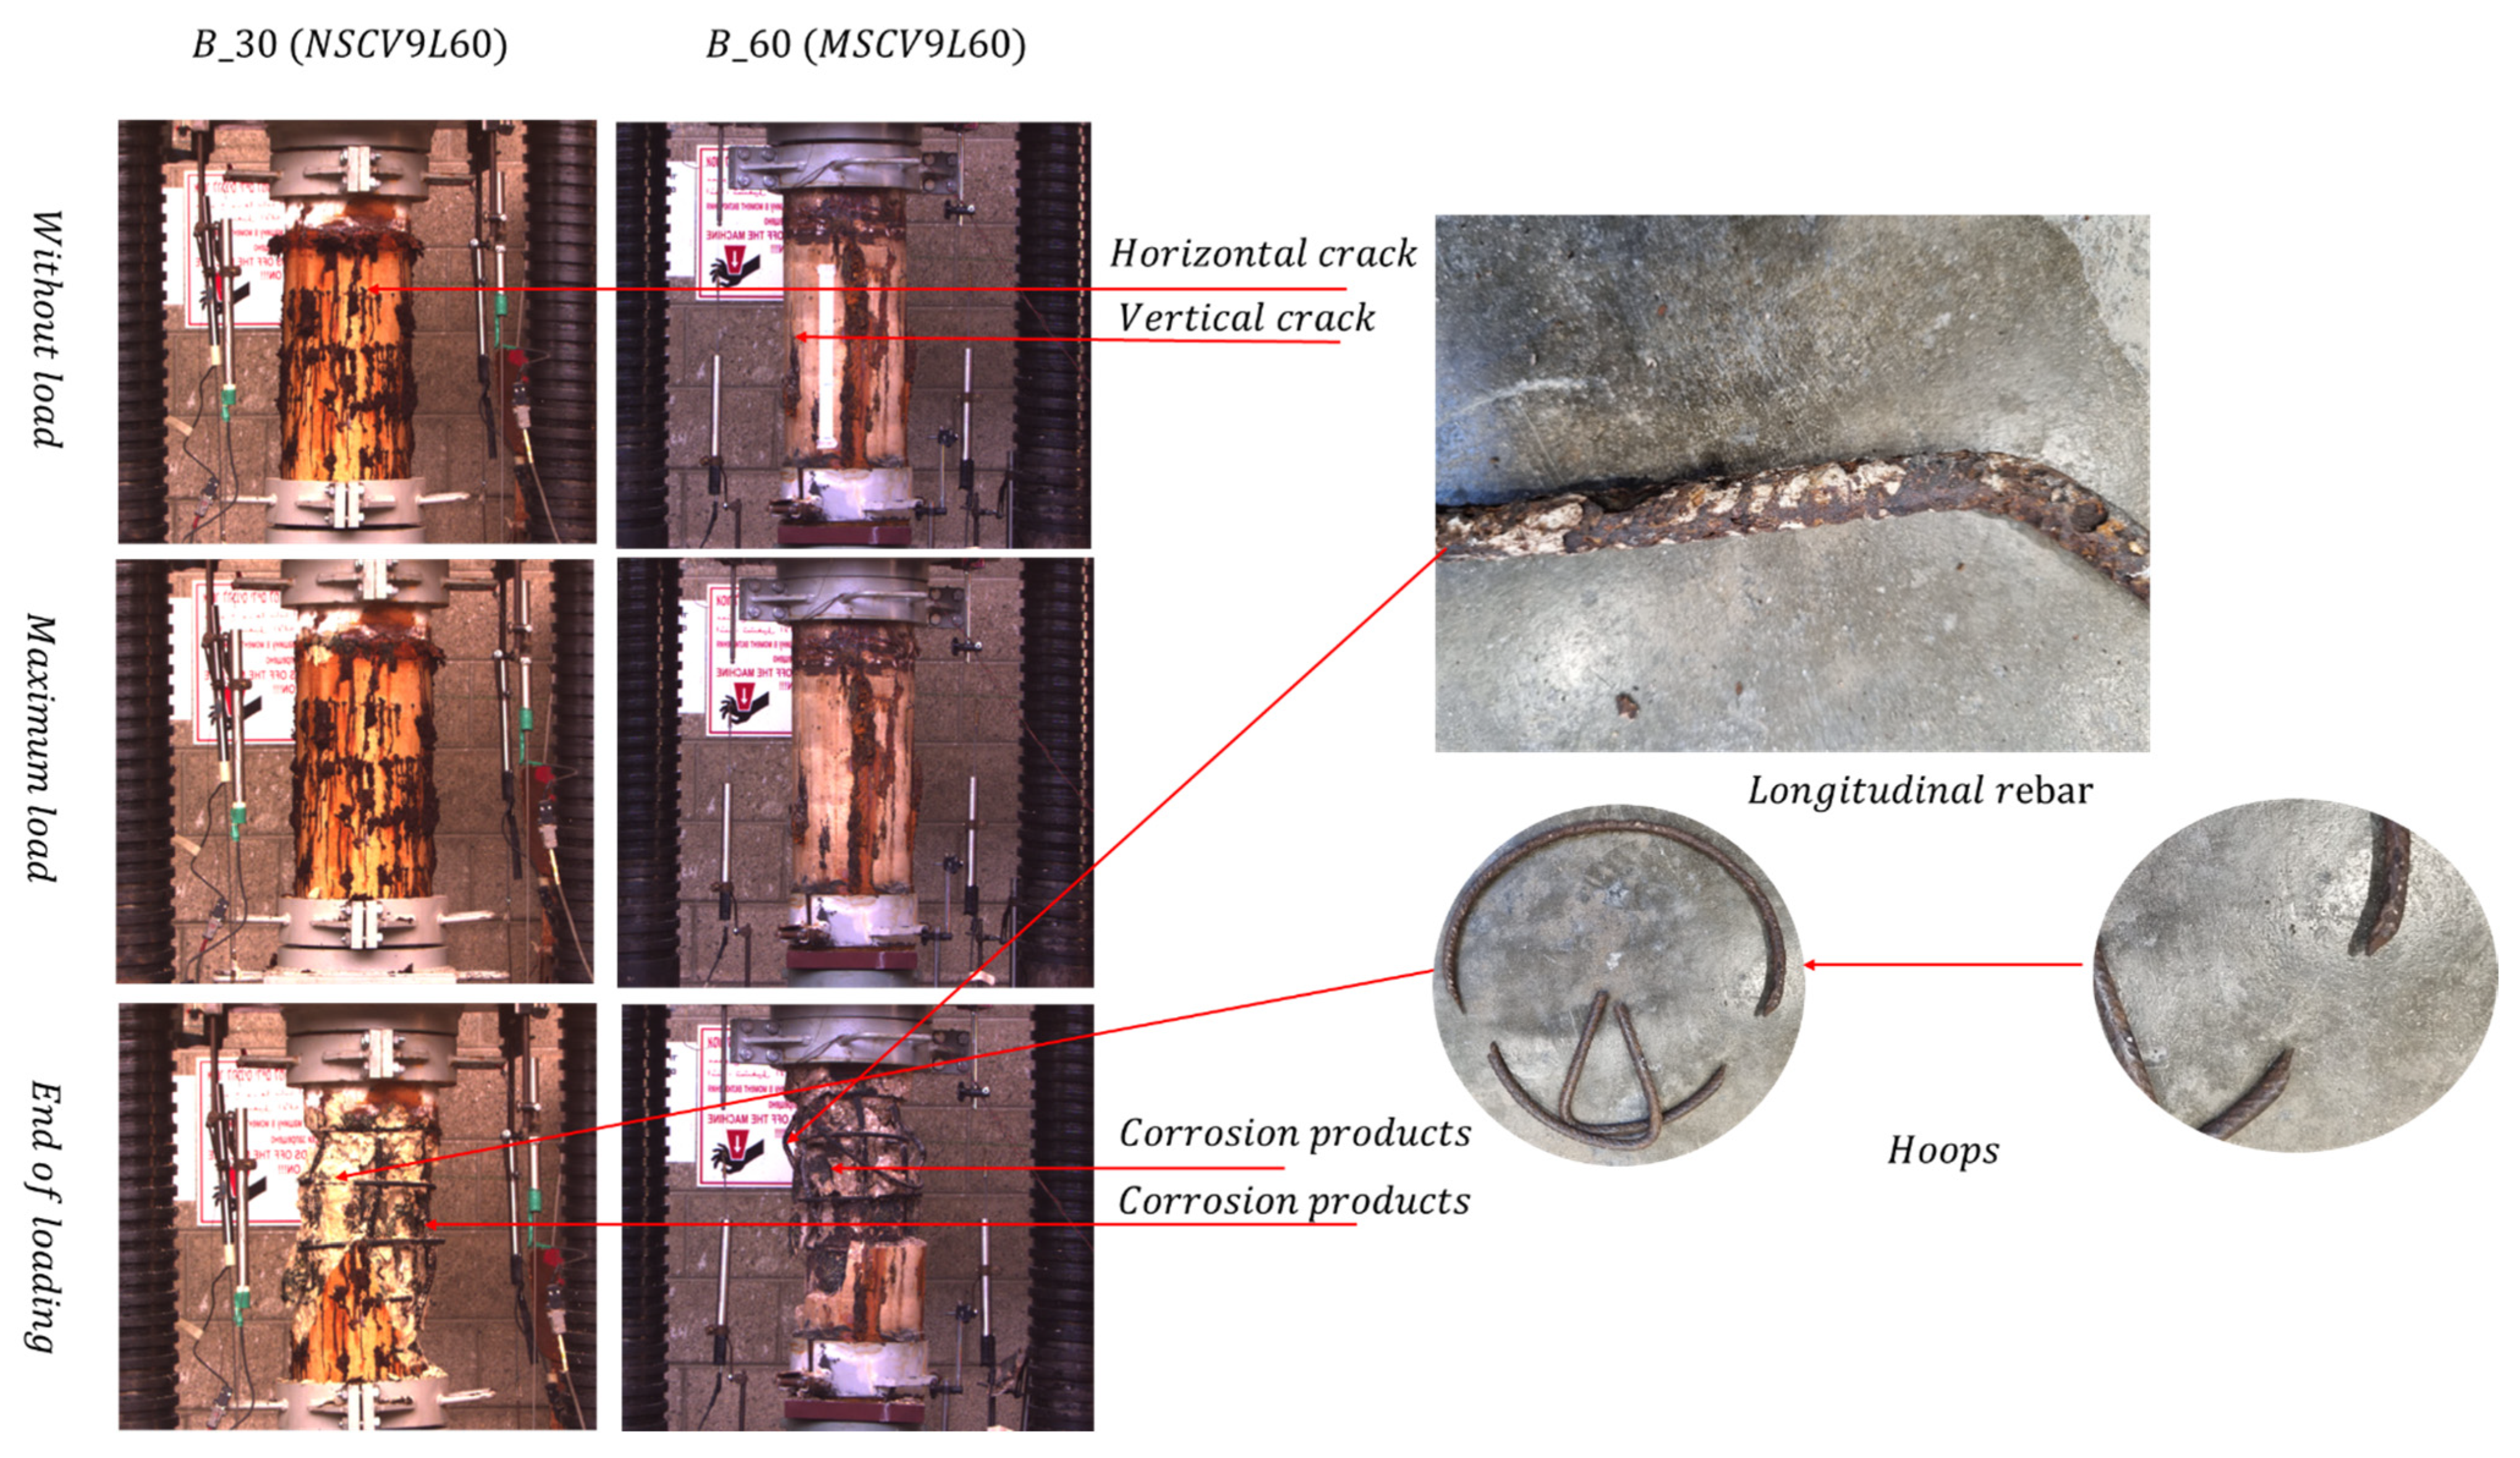
Concrete specimens exposed to a potential of 9 V in a salt solution for 28 days exhibited transverse and longitudinal strains, as illustrated in Figure 8. The behavior observed in these samples differed from that of specimens subjected to wetting and drying cycles. While the wetting and drying process produced fewer cracks, the electrochemically accelerated corrosion led to the formation of multiple cracks, often accompanied by the release of corrosion byproducts, as shown in Figure 9.
The release of these byproducts from the concrete matrix results in a reduction in internal stresses or their stabilization at a steady state. As corrosion products build up and initiate a crack, the concrete’s capacity to accommodate additional byproducts diminishes. This mechanism leads to lower internal stresses compared to the wetting and drying process, where corrosion products are less mobile, allowing them to accumulate and expand within the pores. This effect is particularly prominent in high-strength concrete due to its lower porosity, which restricts the expansion of byproducts and forces their release more readily.
As seen in Figure 9, transverse and longitudinal cracks formed due to the accelerated corrosion, regardless of the concrete’s strength. After the compression test, the longitudinal bars and hoops were removed for visual inspection. Holes were found at the connection points between the hoop and the longitudinal bar. This occurred as the electrical current passing through the longitudinal bars exits at the interface with the hoop, where electrical resistance is lower; as a result, accelerated corrosion takes place in this area. In the hoops, corrosion is concentrated in cracked areas, and a reduction in the hoop diameter can be observed. Regarding mass retention, the longitudinal bars retained 96.7% of their original mass in high strength concrete and 94.6% in normal strength concrete. The hoops retained 88.4% of their mass in the MSC compared to 80% in NSC specimens.
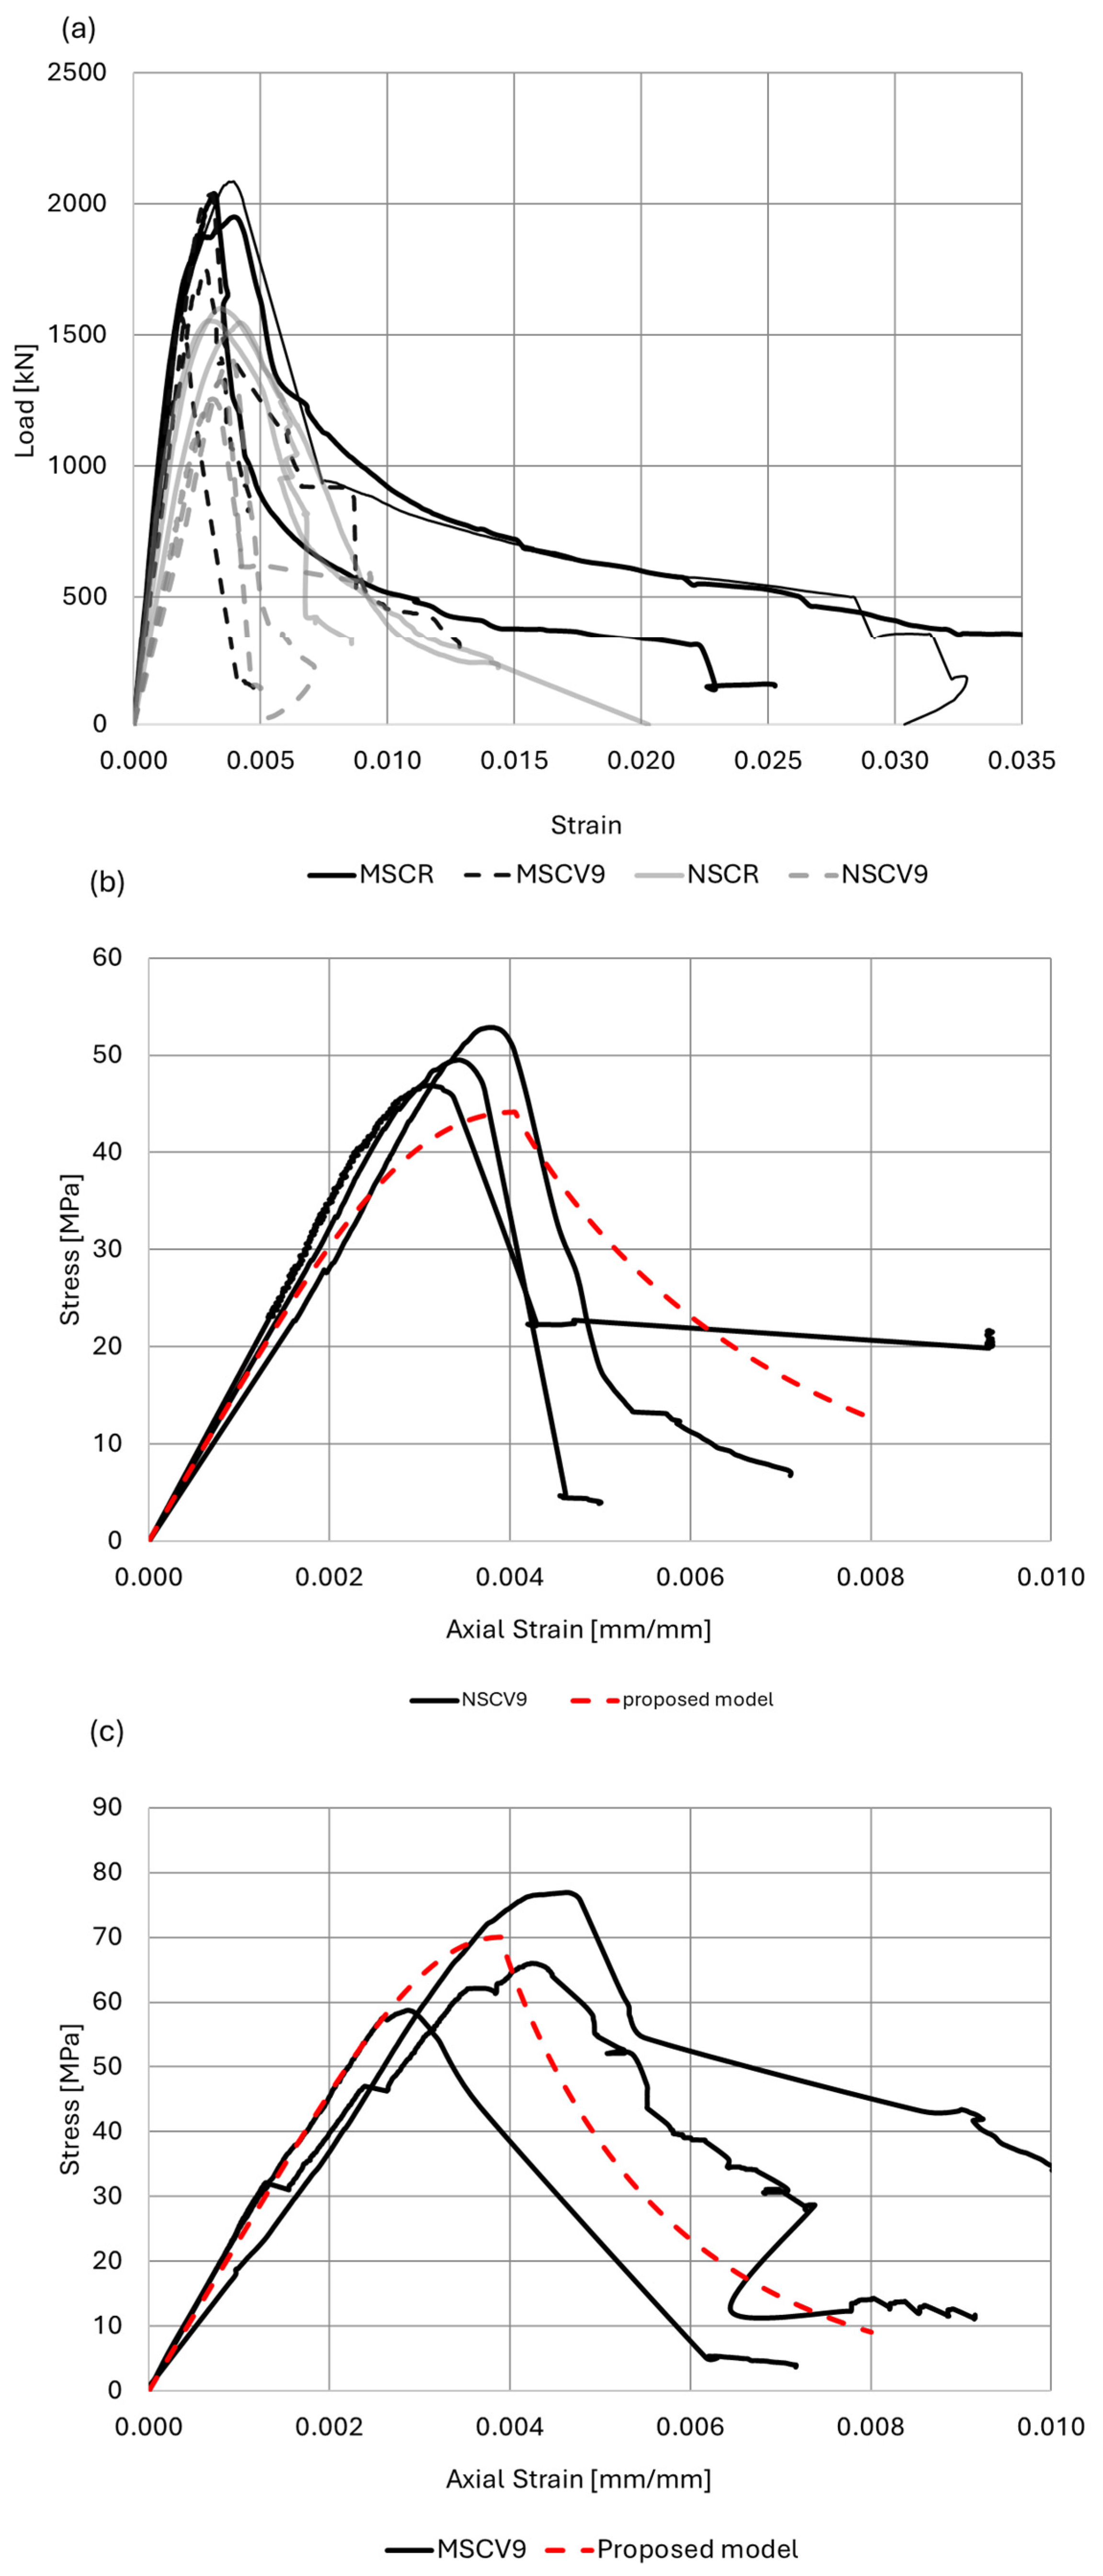
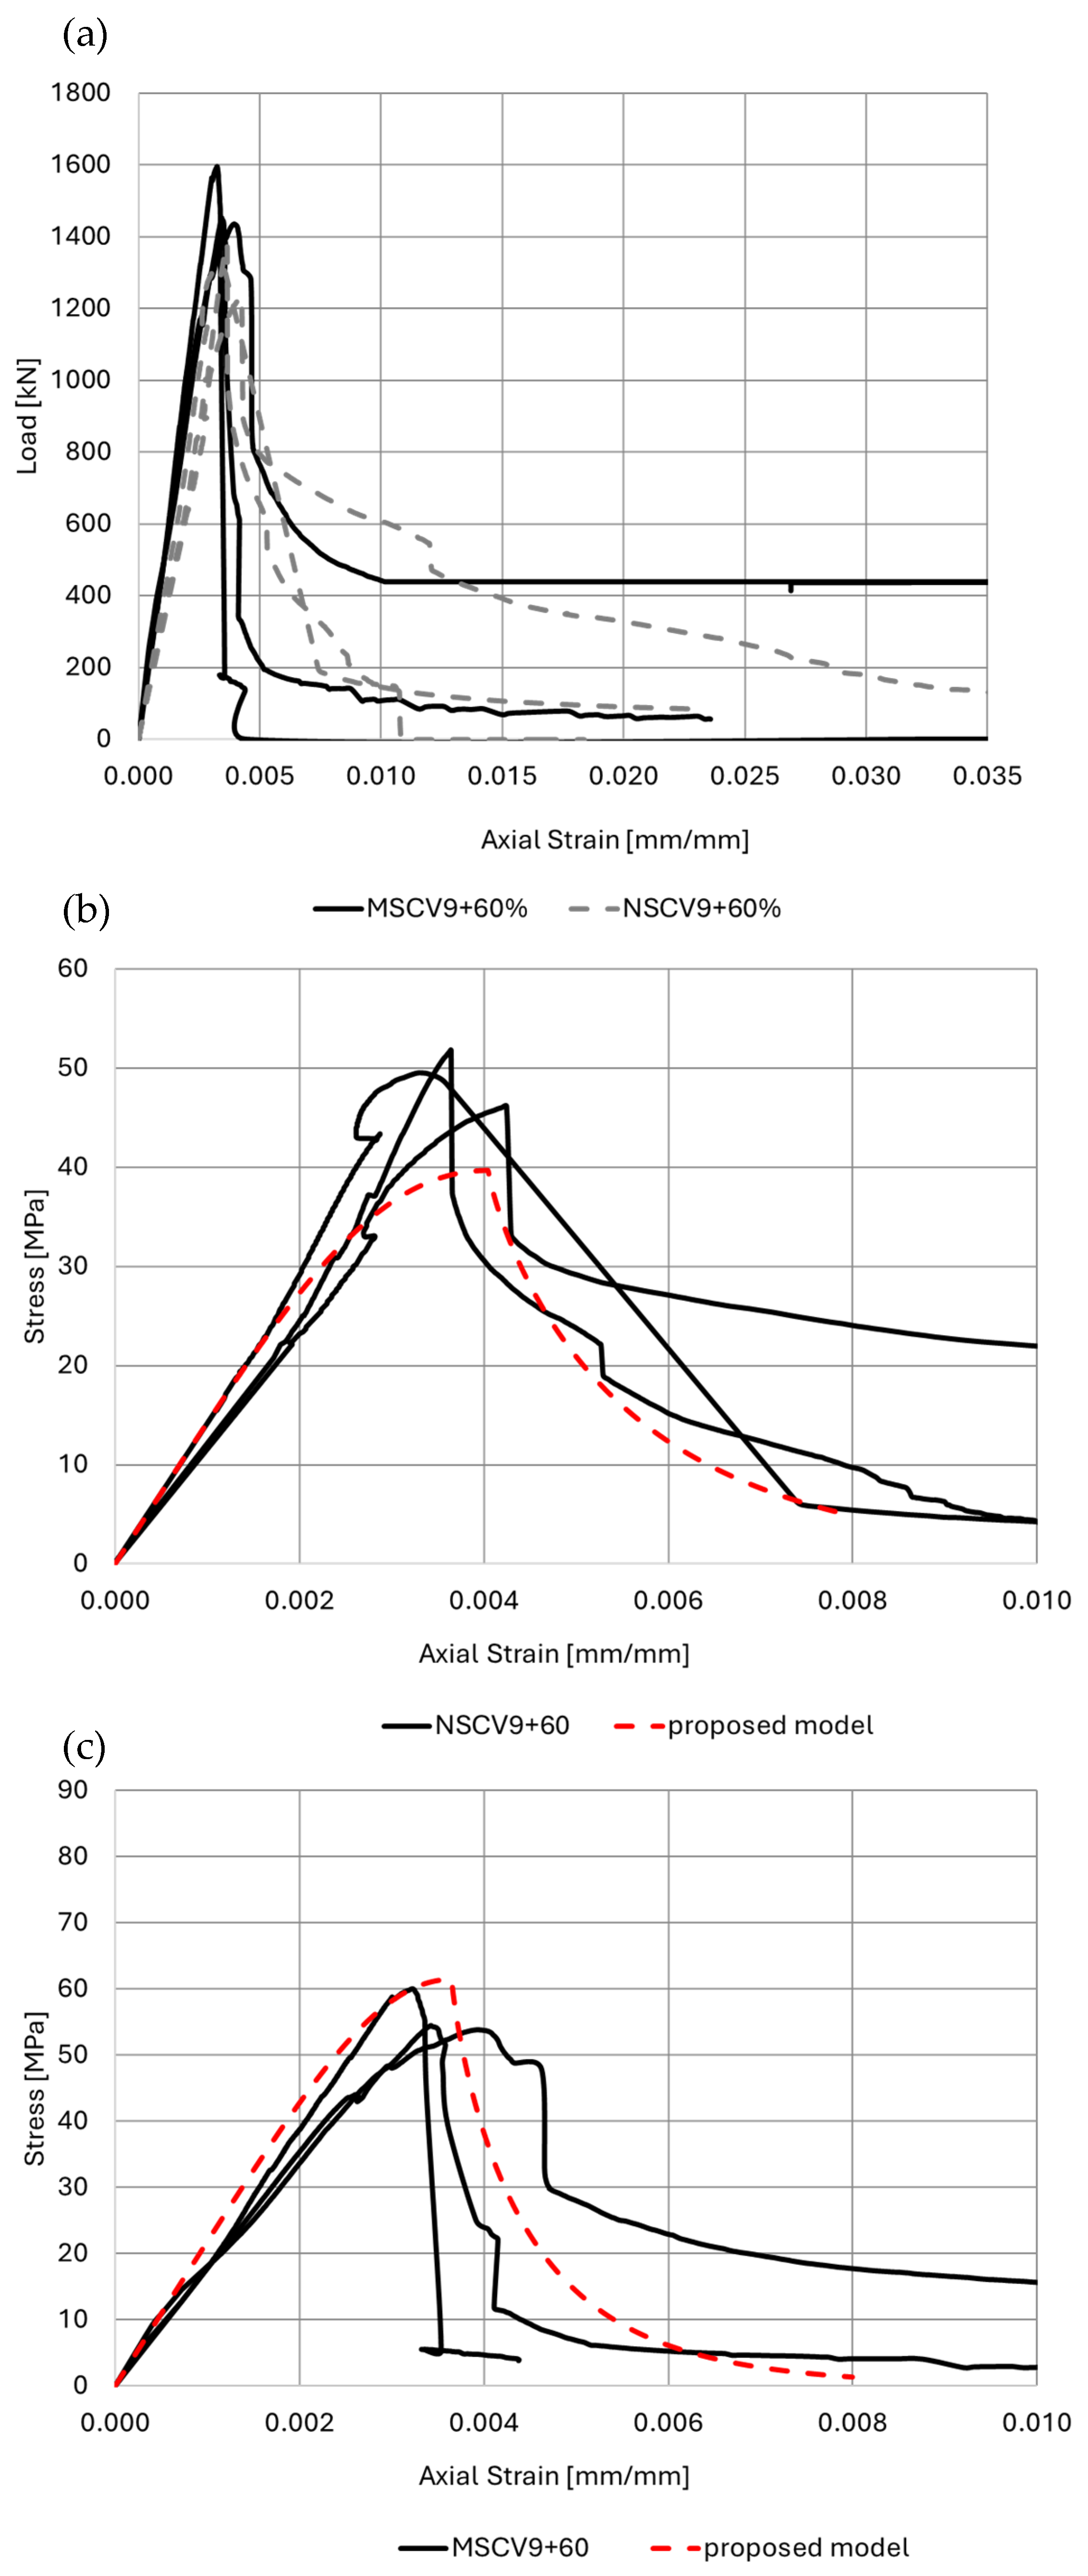
After the application of a 9 V electrical voltage for 28 days in a 3.5% salt solution, the compressive behavior of the reinforced concrete specimens was tested, with Figure 10 illustrating the axial load versus axial strain behavior of the specimens. The average maximum load of the three reference MSC column specimens (not exposed to aggressive environmental conditions) was 2122 kN (Figure 5). However, after electrical stress in the aggressive, chloride-rich environment, the average maximum load for these specimens dropped to 1785.4 kN, representing an 11.85% decrease in axial compressive strength. For NSC column specimens, the average maximum strength of the reference specimens was 1678 kN. Following the same environmental exposure, their maximum load was 1330 kN, a more significant decrease of 20.73%. Moreover, a decrease in the axial stiffness was observed. This decrease can be attributed to the closing of cracks during the application of increased load and displacement, which is a result of the reduction in the active cross-sectional area (the area without cracks).
Corrosion that causes a loss of more than 10% of the steel cross-sectional area can lead to cracking of the concrete cover, particularly when the ratio of cover thickness to bar diameter is approximately 2 [50,52,53]. It is important to note that this ratio primarily applies to simple models with a single reinforcing bar. In practical reinforced concrete structures, the interaction between multiple corroding bars significantly affects the crack pattern [50,52,53]. Furthermore, the presence of perpendicular bars, even with less severe corrosion, can increase the expansion of corrosion products and influence overall crack development. As illustrated in Figure 9, specimens exhibiting corrosion-induced cracks clearly show longitudinal and transverse cracks forming along the reinforcing bars. Therefore, for practical structural design, it is often advisable to disregard the contribution of the concrete cover to the cross-section’s load-bearing capacity and consider only the core area bounded by the reinforcement (A2 in Figure 4).

4.2.2. Exposure Conditions: 9 Volts and Salt Solution Combined with Compressive Loading (NSCV9+60% and MSCV9+60%)

Figure 11 illustrates specimens exposed to the combined effects of a 9 V voltage, a chloride environment at a concentration of 3.5%, and an additional service load of 60% of their estimated bearing capacity (based on the reference specimens—NSCR and MSCR). After the loading process, the reinforcing bars were extracted from the specimens to estimate their weight, which provides insight into the extent of corrosion and material degradation under the combined effects of electrical voltage, chloride environment, and applied service load, as for the previous specimens.
In NSC, the weight retention was 92.6% for longitudinal bars and 79.5% for transverse bars. In MSC, the weight retention was slightly higher, with 94.2% for longitudinal bars and 84.2% for transverse bars.
Service loads, especially at lower levels, play a critical role in the development of microcracks in reinforced concrete beams, which in turn accelerate both the initiation and propagation of steel corrosion in chloride-rich environments. These microcracks act as pathways for chloride ions, which enhances their migration towards the reinforcement and accelerates the corrosion process [54].
Under a load of 60% of the bearing capacity, the strain development was not significantly affected by the formation of corrosion products, as observed from the strain gauges. However, cracks still formed, which led to the release of corrosion products. Additionally, a creep transition was observed, with movements of approximately 0.0001 in all specimens. Furthermore, since the loading was applied using a hydraulic piston, the varying piston load likely obscured the effects of corrosion stress, making it difficult to directly observe the effect of corrosion on the stress measurements.
Figure 12a illustrates the axial load versus axial strain relationship. For the MSC column specimens exposed to electrical stress in an aggressive chloride-rich environment and loaded to 60% of their bearing capacity, the maximum load recorded was 1494 kN. This result indicates a 30% reduction in axial compressive strength (compared to the reference specimen). For the NSC column specimens with a similar exposure, the maximum load was measured at 1329 kN. This corresponds to a 21% reduction in compressive strength. The effect of concrete strength on chloride migration is particularly significant, especially under loaded conditions. Higher strength concrete exhibits variable chloride migration coefficients, which tend to increase significantly when applied stress levels exceed 50% of the ultimate load capacity [55]. Thus, in NSC, the applied load did not significantly affect the ultimate load-carrying capacity, indicating that its structural integrity remained relatively stable under such conditions. However, this stability may indicate the threshold beyond which further reductions in capacity occur due to potential failure of the reinforcing bars; particularly in cases of severe local corrosion where the transverse reinforcement has been completely compromised at specific points.
Figure 12b,c show the experimental stress–strain behavior of the specimens and the comparison with the proposed model prediction. The experimental results for MSC specimens deviate from those predicted by the model, probably due to the limited effect of the applied service load. This discrepancy is likely due to prior cracking in MSC specimen, which caused it to act more brittle compared to NSC, where the model prediction and the experimental results show better consistency (as shown by the red line in Figure 12). In MSC specimens, corrosion appears to be more concentrated in smaller areas. After an initial crack has formed, corrosion in that specific area progressed faster than in other areas. This resulted in extensive damage to the cross-sectional area of the reinforcing bar at that location (see Figure 11), leading to significant material loss and, in some cases, complete deterioration. However, it is important to note that the average corrosion percentage did not significantly differ between the two types of concrete. The average corrosion value may mask local corrosion concentrations and introduce bias into the results. Nevertheless, from a design perspective, the use of the mean remains both practical and useful for simplifying the model, and is therefore taken into account through use of the α parameter.

4.2.3. Exposure Conditions: 18 Volts in Salt Solution (MSCV18 and NSCV18)

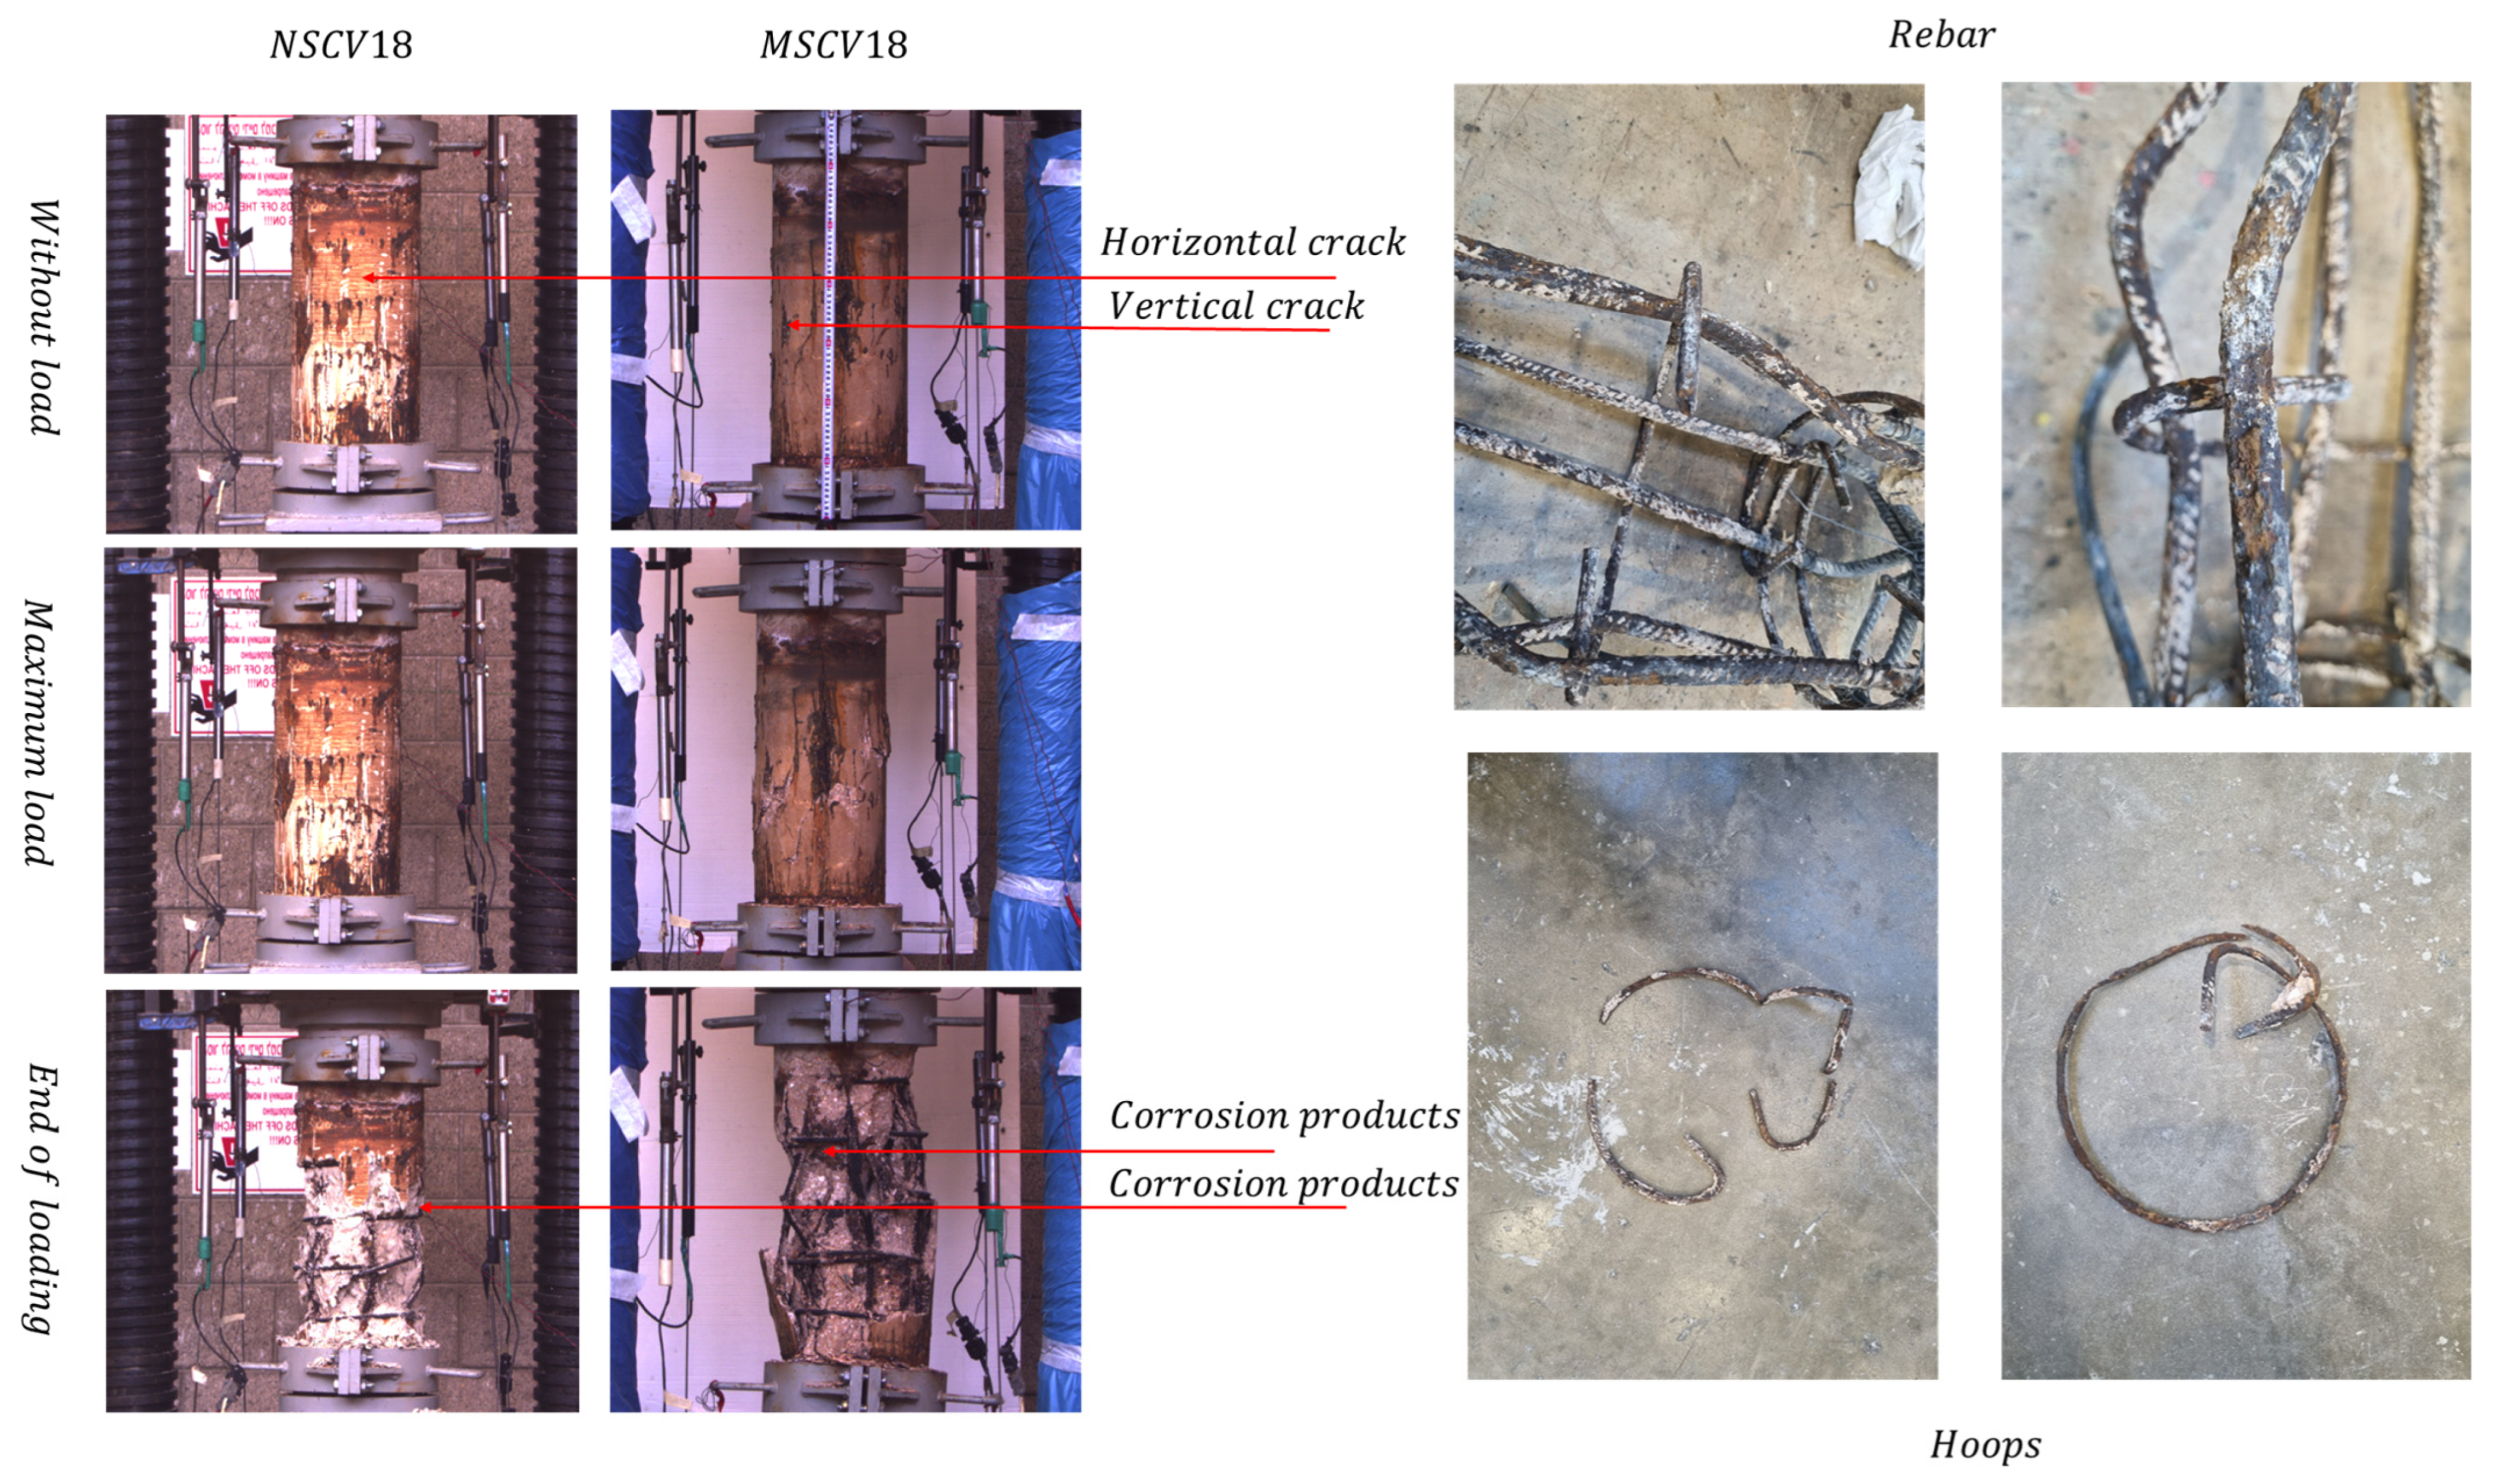
Figure 13 displays specimens subjected to 18 V in a salt solution for 28 days. Increasing the applied voltage to 18 V serves to confirm two primary phenomena. First, reinforced concrete under high voltage loses its protective capacity once cracks develop. Initially, before cracking, the concrete may offer some resistance due to the confinement and storage of corrosion products. However, following crack formation, the concrete no longer contributes to preventing the flow of electrons. The second phenomenon observed is that the electrical voltage and the resulting corrosion affect not only the steel reinforcement, reducing its mass, but also directly reduce the effective cross-sectional area of the concrete due to massive cracking. Additionally, the application of a higher voltage accelerates the corrosion process, allowing for faster observation and comparison of the model’s behavior under different degrees of corrosion in both the longitudinal and transverse reinforcing bars.
Regarding the corrosion concentration, there was no significant difference in the weight change between the reinforcing bars. In NSC, the weight retention was 95.2% for longitudinal bars and 78.9% for transverse bars. In MSC, the weight retention was slightly higher, reaching 95.9% for longitudinal bars and 84.6% for transverse bars. The decrease in reinforcing bar mass under a voltage of 9 V and 60% of the load-bearing capacity is similar to the decrease observed under a voltage of 18 V. This similarity is due to the immediate loss of concrete strength and crack formation in the initial stage of exposure to a voltage of 9 V. This is in contrast to the 18 V specimens, where a short delay occurred before crack formation. Despite this short delay, the higher voltage (18 V) makes the damage more pronounced over a shorter period. Corrosion development in the bars was observed, leading to pits with a radius of up to 0.5 cm. In areas where the transverse bars (transverse bars) were completely consumed by corrosion, this deterioration led to the collapse of the longitudinal bars. Previous studies have indicated that the corrosion morphology of steel bars that have undergone electrochemically accelerated corrosion closely matches that observed in naturally corroded bars [56]. A 20% loss in the mass of reinforcing bars due to corrosion results in a 35% to 38% decrease in tensile strength, depending on the strength grade of the reinforcing bar. In addition, a 33% and 28% decrease in bending stress were also observed [56]. This fact strongly reinforces the results of the present study, indicating that stray current corrosion is largely similar to natural corrosion.
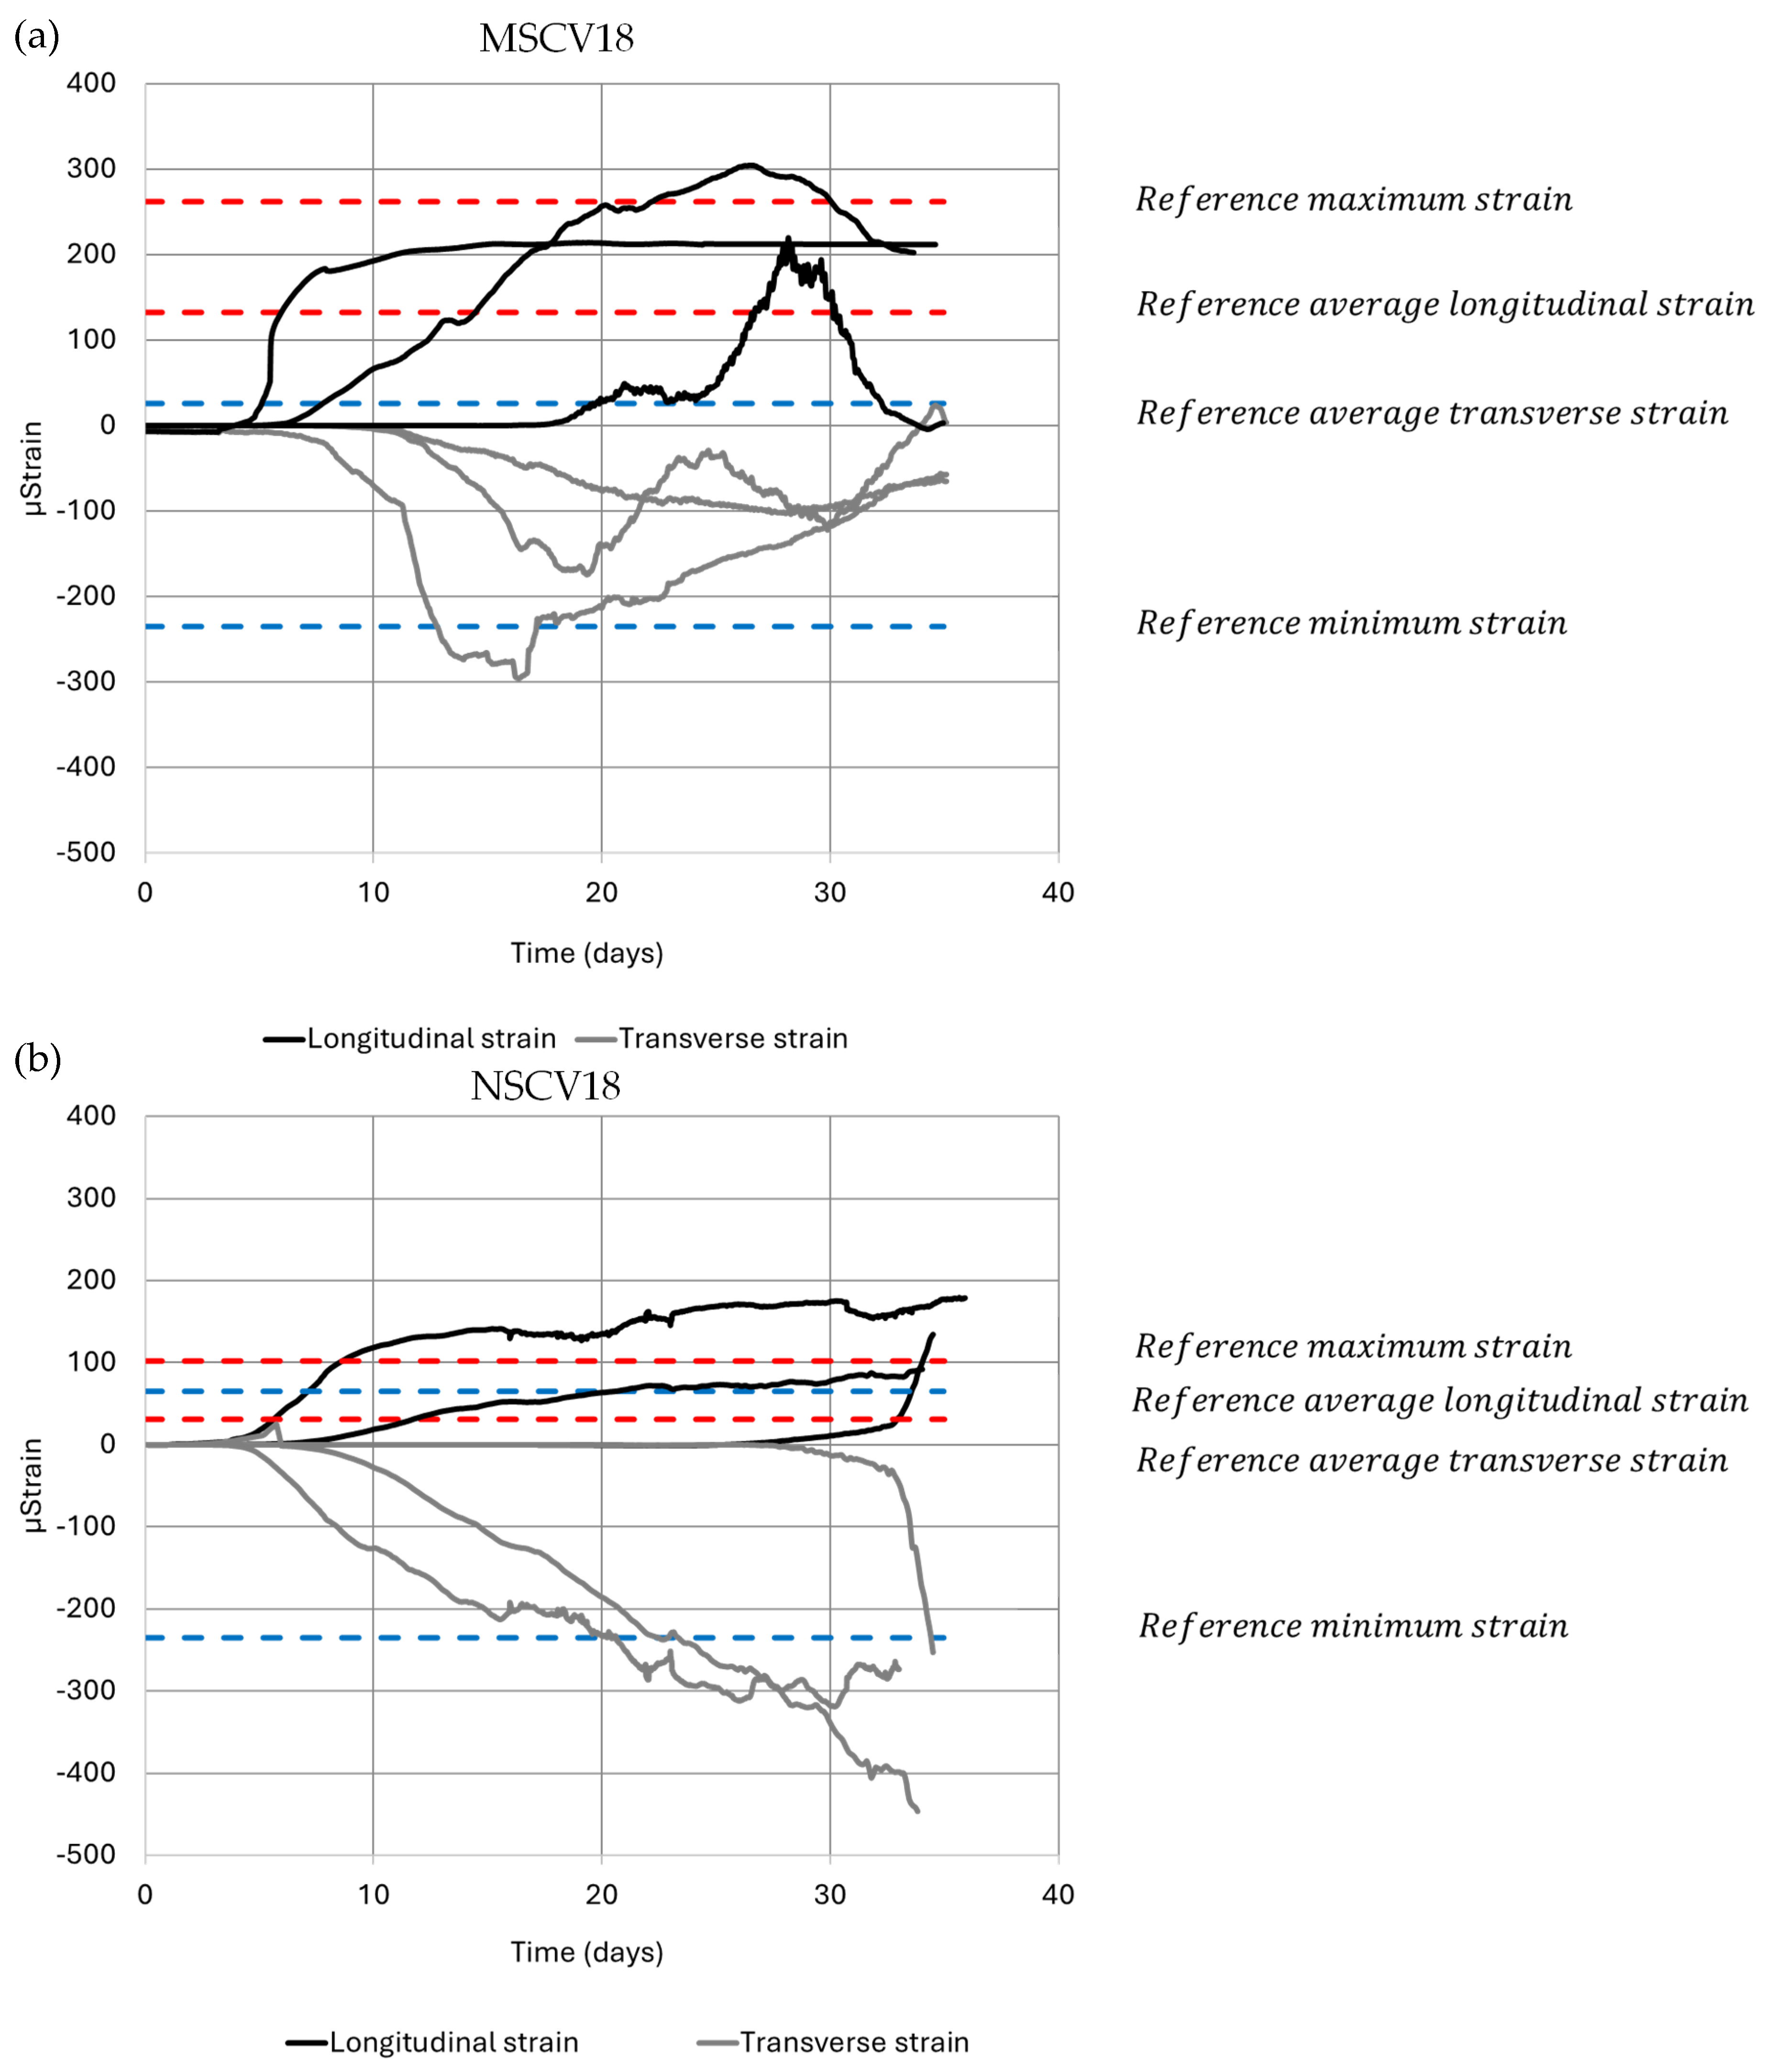
Figure 14 illustrates the stress behavior of specimens exposed to 18 V for 28 days, with an additional 5 days of prior exposure to salt water. The data reveals a clear trend: the corrosion products formed under high voltages of 18 V exhibit a different behavior than those exposed to chloride conditions alone or to a voltage of 9 V in combination with salt water, indicating that they are not fully embedded in the pores or cracks. This leads to a temporary reduction in stress after a certain period, as evidenced by the level observed in the graph. One possible explanation is that these corrosion products contain a significant amount of water, which makes them behave as a liquid or semi-liquid mass inside the cracks. Under the combined effect of the mechanical resistance of the concrete and the electric current, this results in their easier release from the concrete, thus reducing the internal stresses they generate within the concrete cross-section.
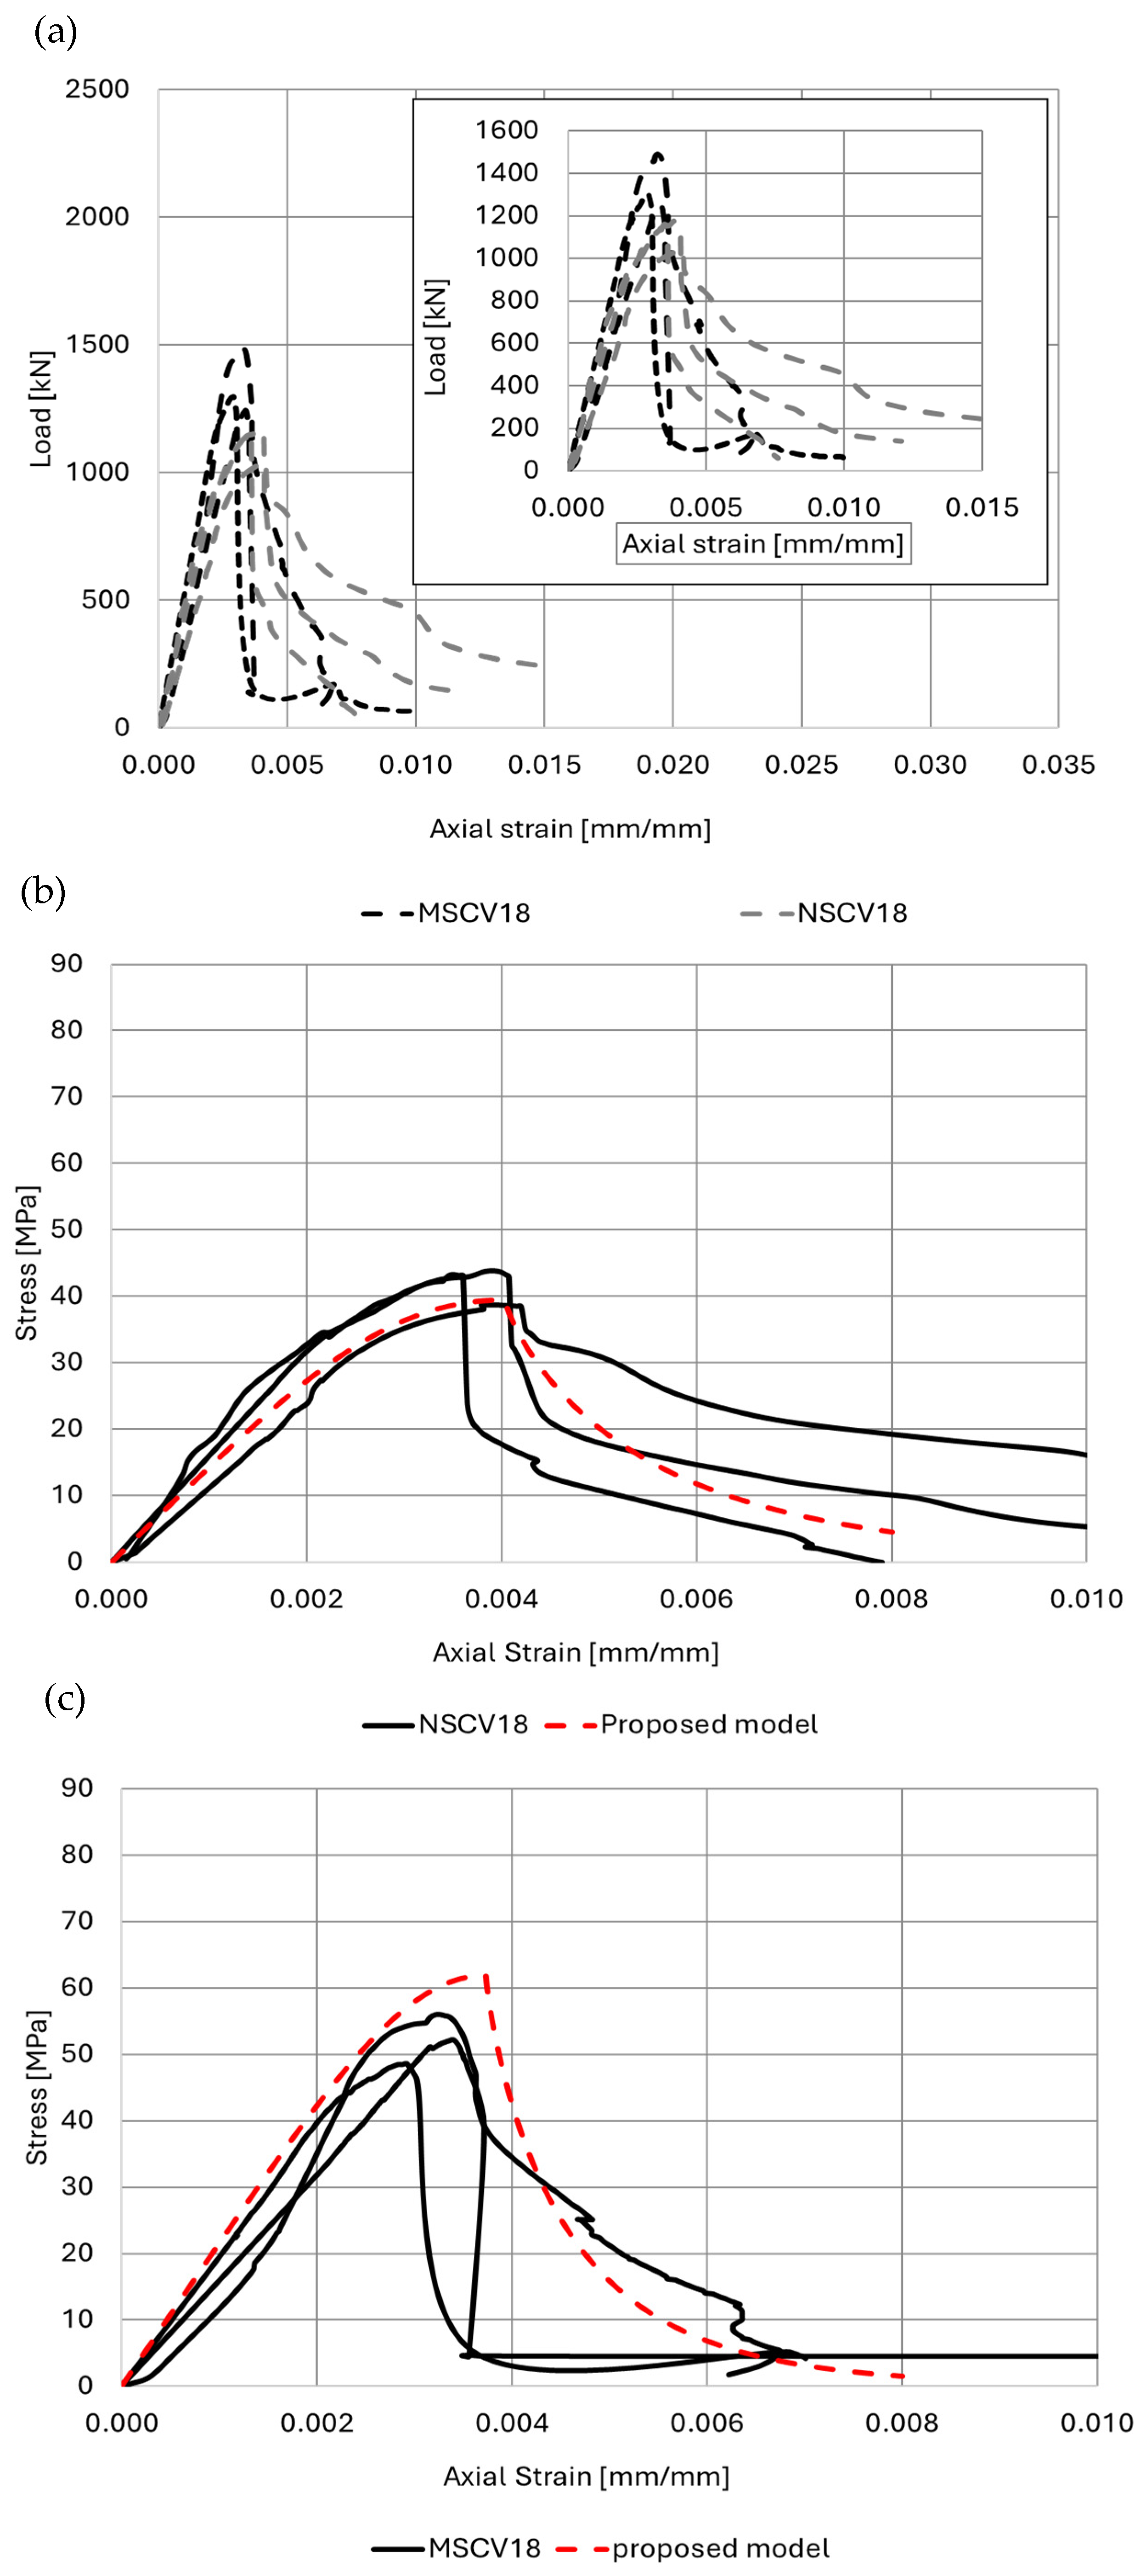
Figure 15a shows the relationship between force and strain, highlighting the impact of applying 18 volts over 28 days on the load-bearing capacity of the concrete samples. For the NSC samples, the average fracture strength was recorded at 1127 kN, representing a 32.8% reduction compared to the reference samples. Meanwhile, in the MSC samples, the average fracture strength was 1345 kN, showing an even larger reduction of 36.5%. This suggests that the strength of the concrete does not significantly inhibit the degradation caused by corrosion under high electrical voltages such as 18 volts. Figure 15b,c show the stress–strain curves of concrete columns after accounting for the reduced contribution of the reinforcing bars in comparison to those obtained with the proposed model. The model shows strong agreement with the behavior of the columns containing corroded reinforcement, particularly in the post-peak region, which highlights the reduction in the element ductility.

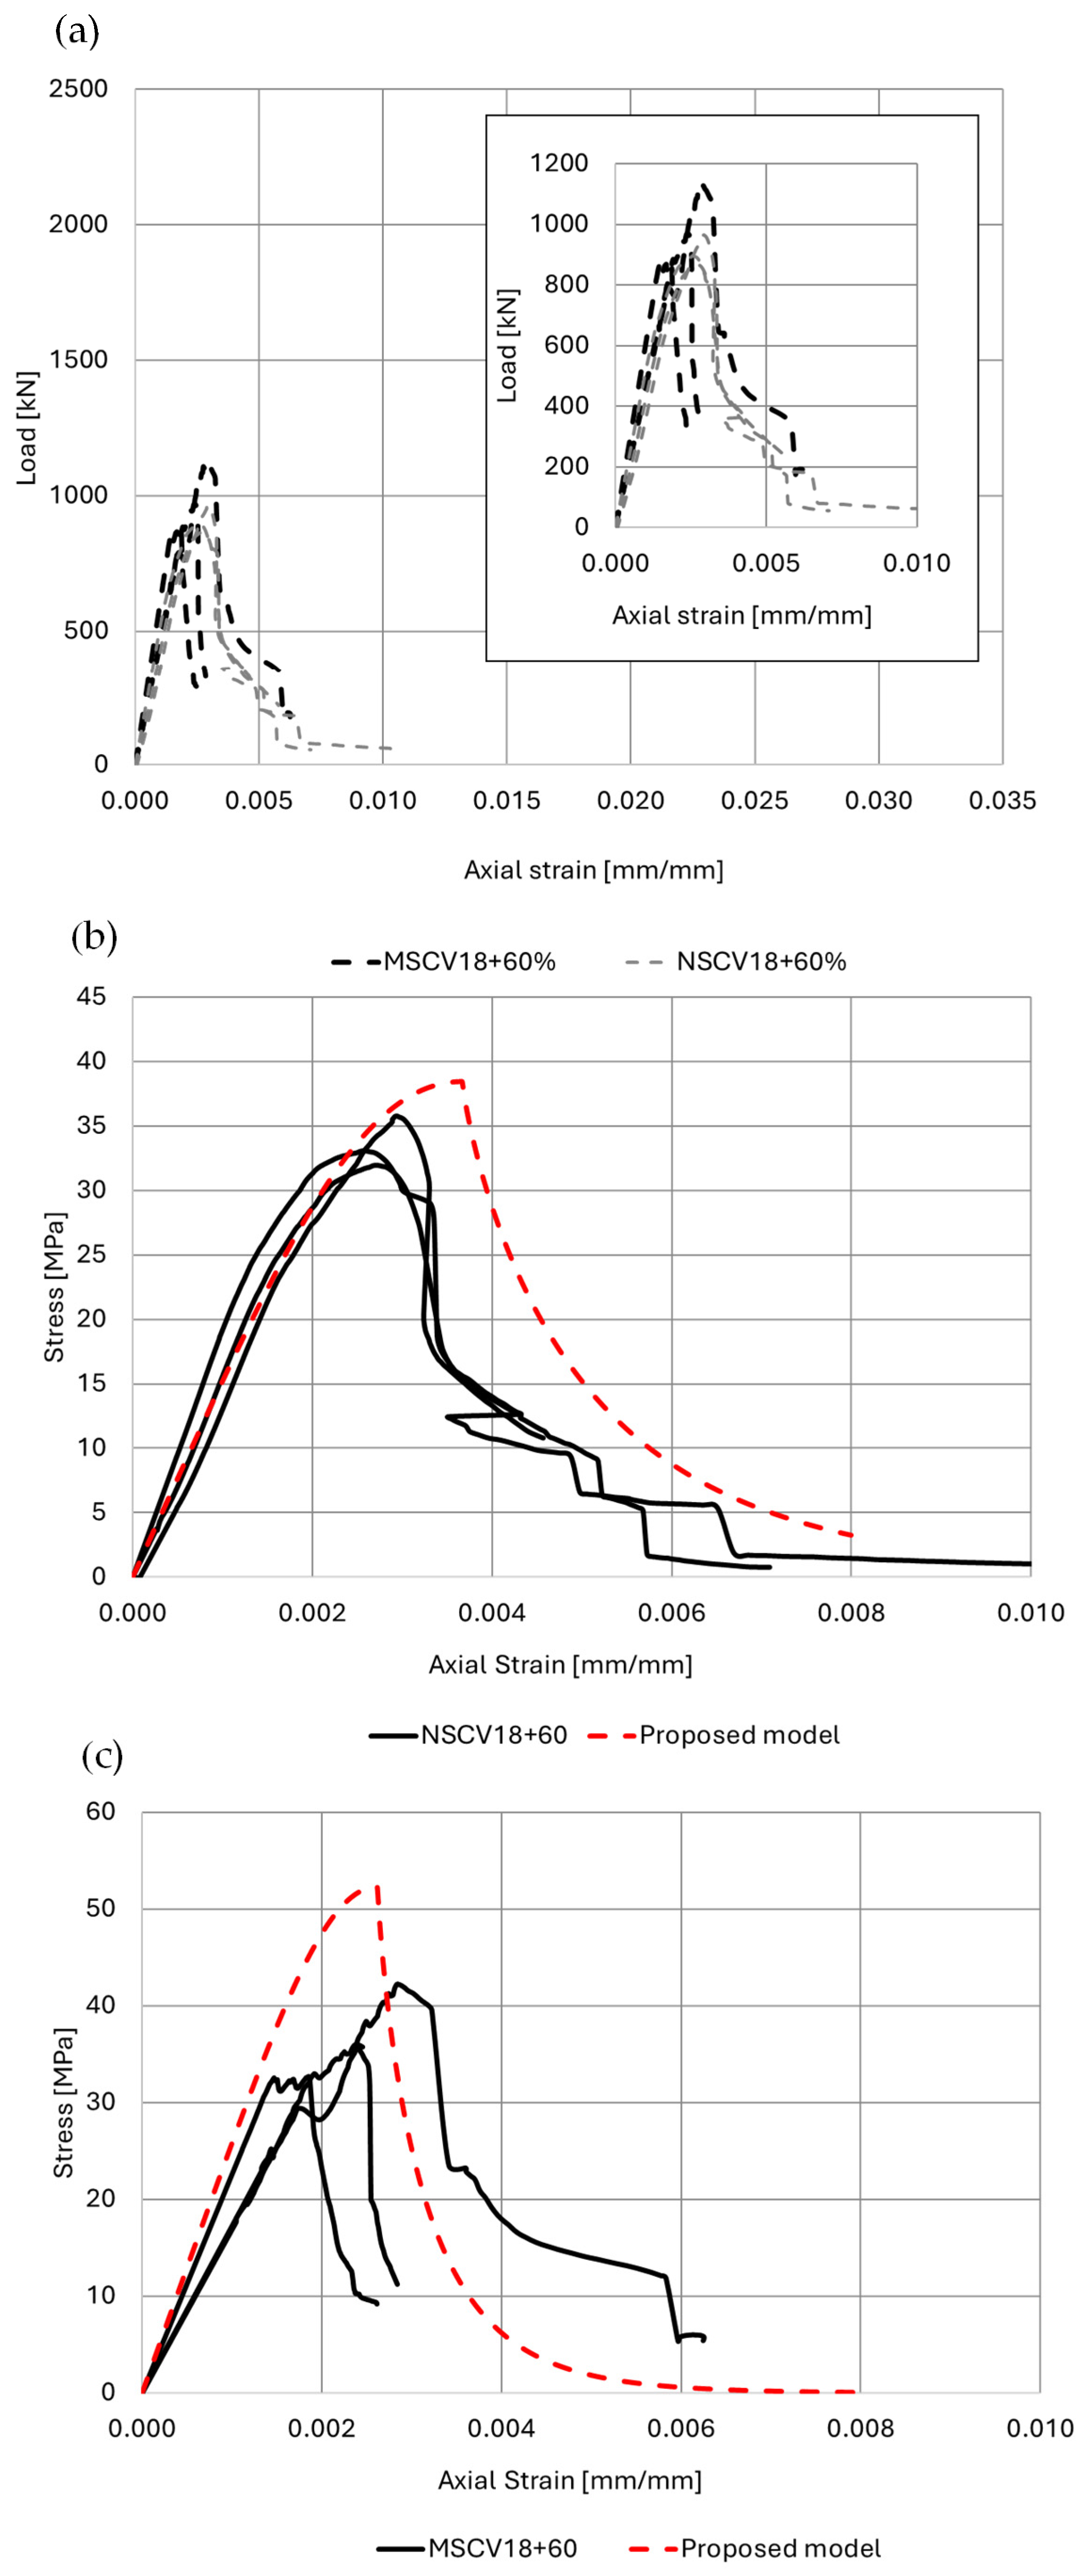
4.2.4. Exposure Conditions: 18 Volts and Salt Solution Combined with Compressive Loading (NSCV18+60% and MSCV18+60%)

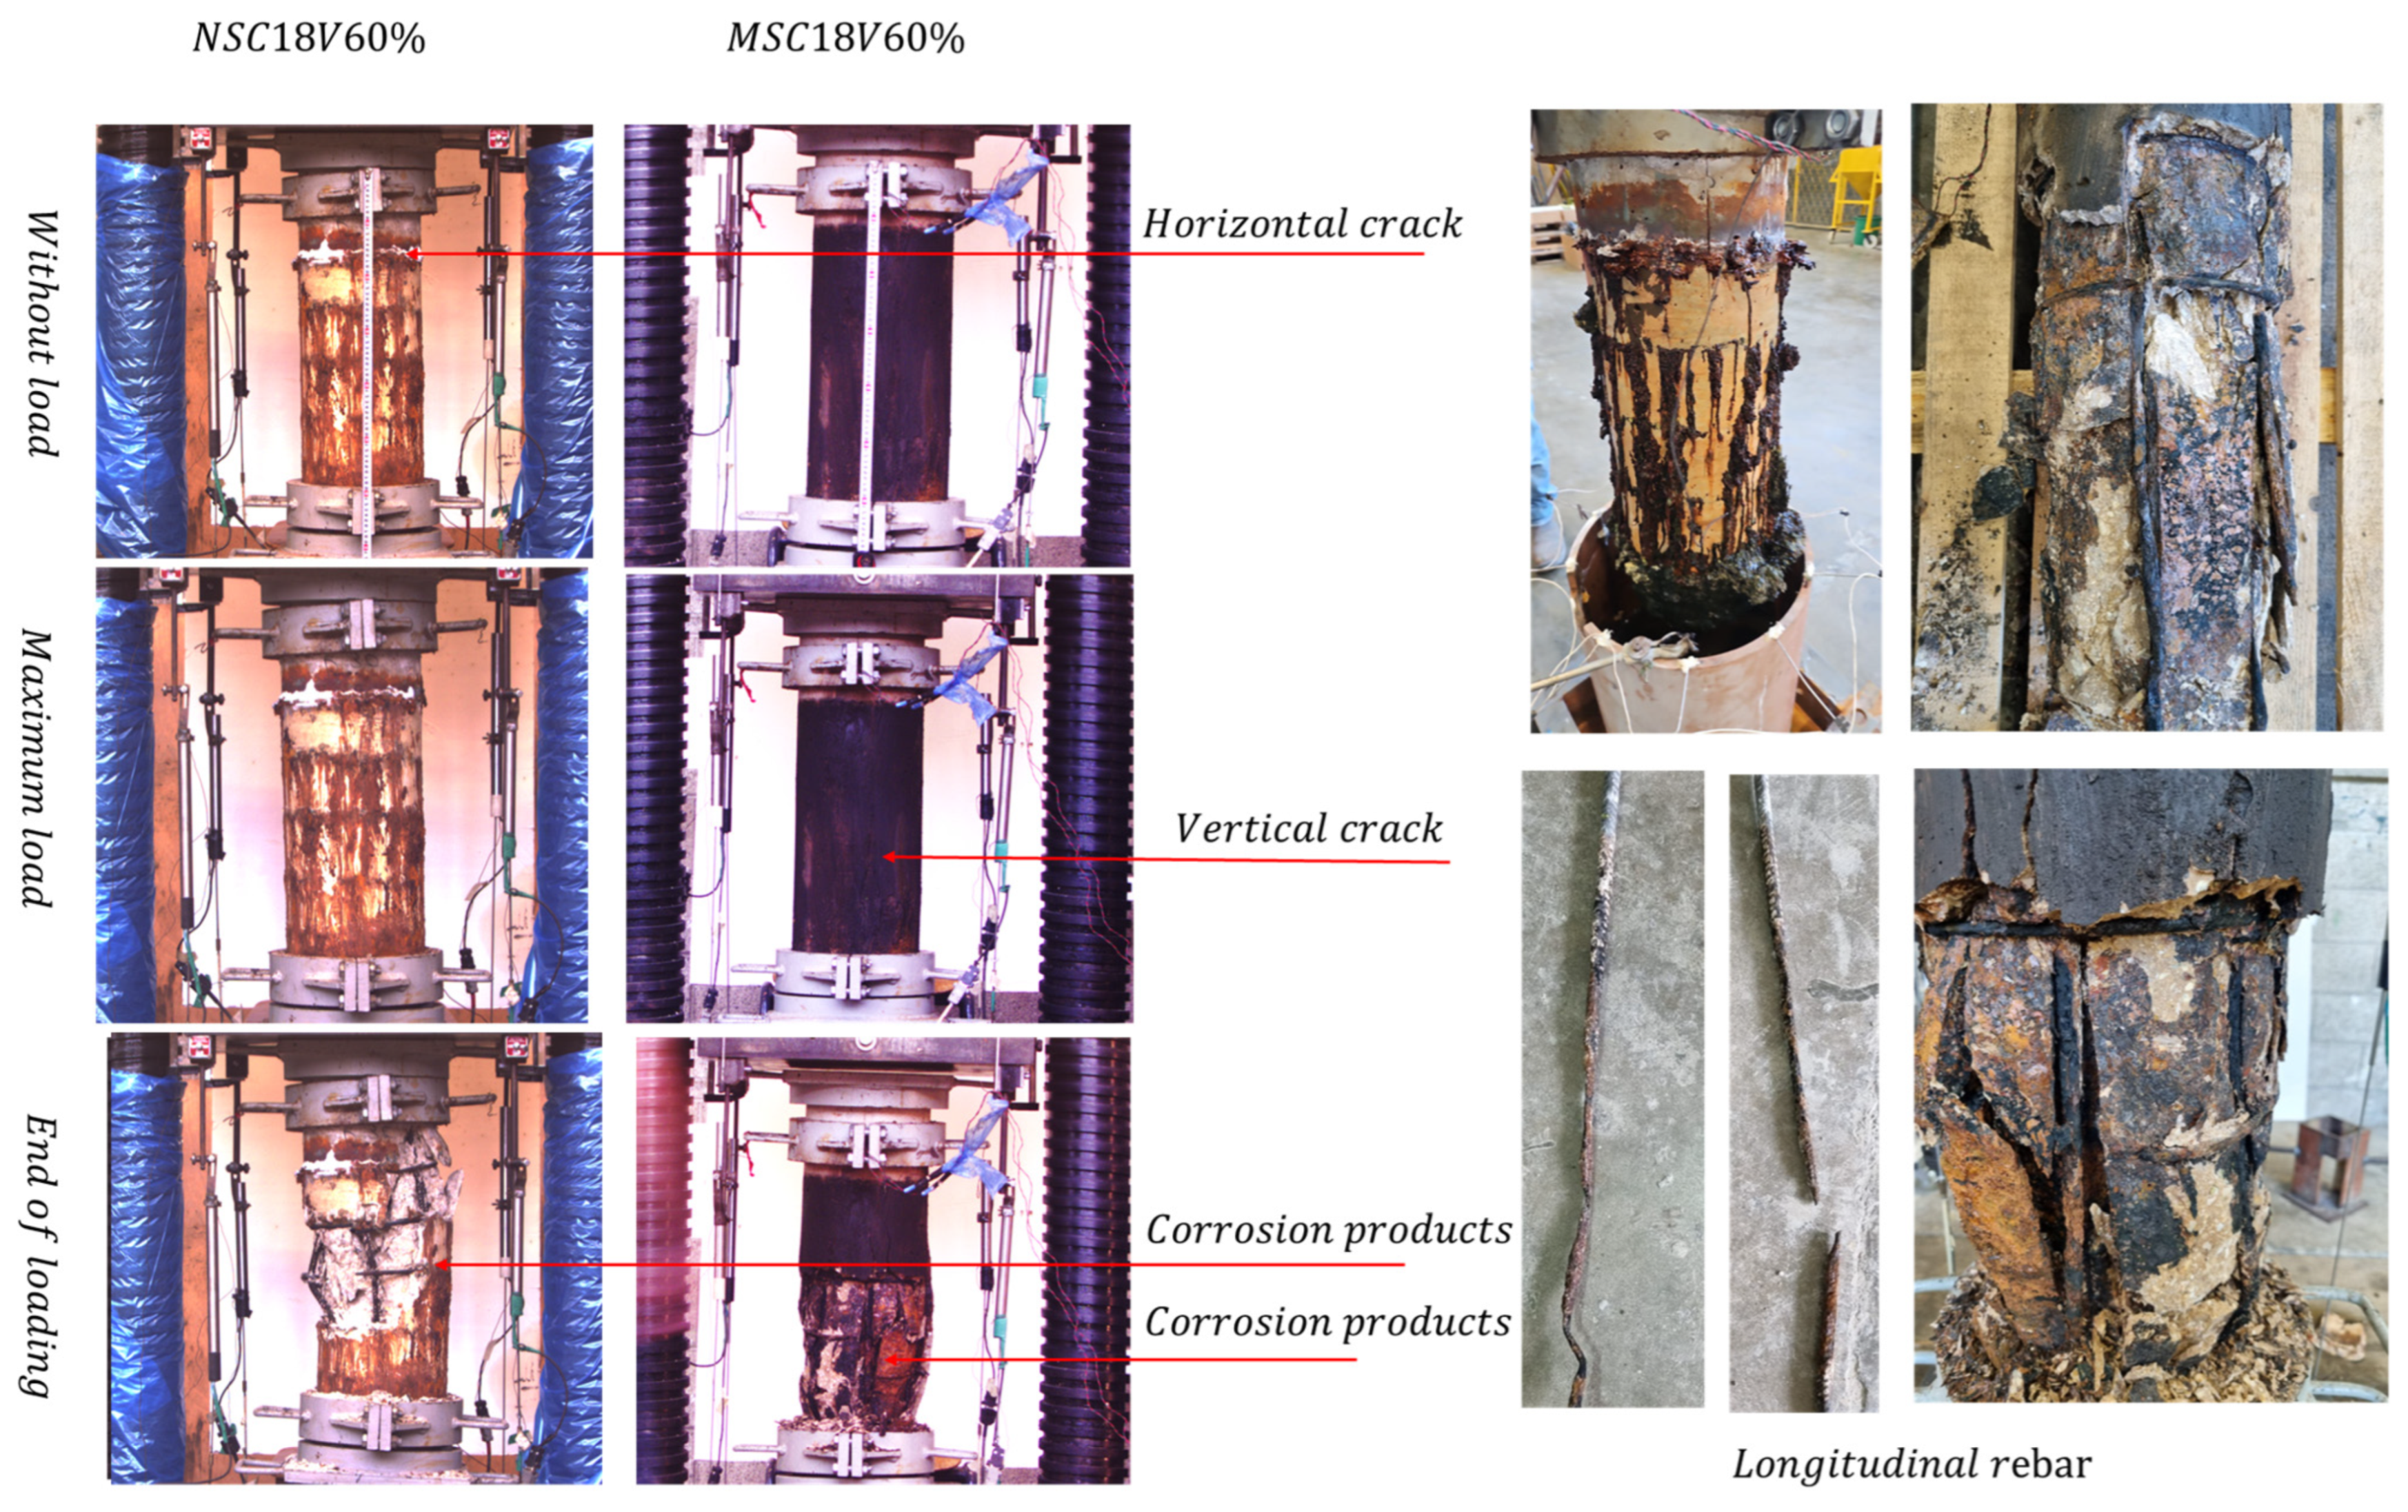
Figure 16 shows specimens exposed to the combined effects of an 18 V electrical voltage, a 3.5% chloride environment, and an applied service load equal to 60% of their design capacity. After loading, the reinforcing bars were extracted to estimate their weight, which provides insight into corrosion and material deterioration under these combined conditions. The results indicate that in NSC, the longitudinal reinforcing bars retained 86.7% of their weight, while the transverse bars retained 67.9%. In MSC, weight retention was slightly higher for the longitudinal bars, at 87.9%, but lower for the transverse bars, at 65.4%. This pattern occurs because—unlike natural corrosion, which is usually more uniform—stray current corrosion is mainly concentrated at the point of exit of the current from the metallic material, and the flow is characterized by low electrical resistance. As a result, the transverse bars (stirrups) are usually damaged to a greater extent than the longitudinal bars. Furthermore, once a crack forms parallel to the longitudinal bars, the electrical resistance of the concrete in this area drops significantly, and these bars also begin to corrode, regardless of their distance from the edge of the element (thickness of the concrete cover). As can be seen in Figure 16, no transverse reinforcement (hoop) remained at the center of the samples. This loss of confinement effectively doubled the unsupported length of the longitudinal reinforcing bars, thereby significantly increasing the risk of buckling.
After exposing the specimens to an electrical voltage in a chloride-rich environment and applying 60% of the load-bearing capacity of the MSC, the maximum breaking load recorded was 814 kN, reflecting a 61.73% reduction in axial compressive strength. In comparison, the NSC control column exposed to the same conditions exhibited a maximum breaking load of 901 kN, corresponding to a 46.3% reduction (Figure 17a). The difference in performance between MSC and NSC is mainly due to the distribution of corrosion. In the weaker concrete (NSC), the corrosion was more uniform, leading to extensive cracking that allowed the electrical current to pass freely along the entire surface of the reinforcing bars. In contrast, the stronger concrete (MSC) exhibited more localized cracks, resulting in discontinuities in the longitudinal bars and a complete absence of transverse bars in the central areas (Figure 17b,c). The upper and lower edges of the specimens remained largely free of corrosion damage. Furthermore, corrosion products were observed beyond the longitudinal bars, reaching closer to the core of the specimen. This finding indicates a crack depth of up to twice the thickness of the concrete cover, which significantly reduces the effective cross-section of the concrete. The resulting discontinuities in the reinforcing bars resulted in internal eccentricity, which further increased the stress distribution within the concrete. As a result, the previously symmetrical cross-section no longer behaves as such.

4.3. Effect of Exposure Conditions on Ductility and Load Carrying Capacity of Concrete Columns

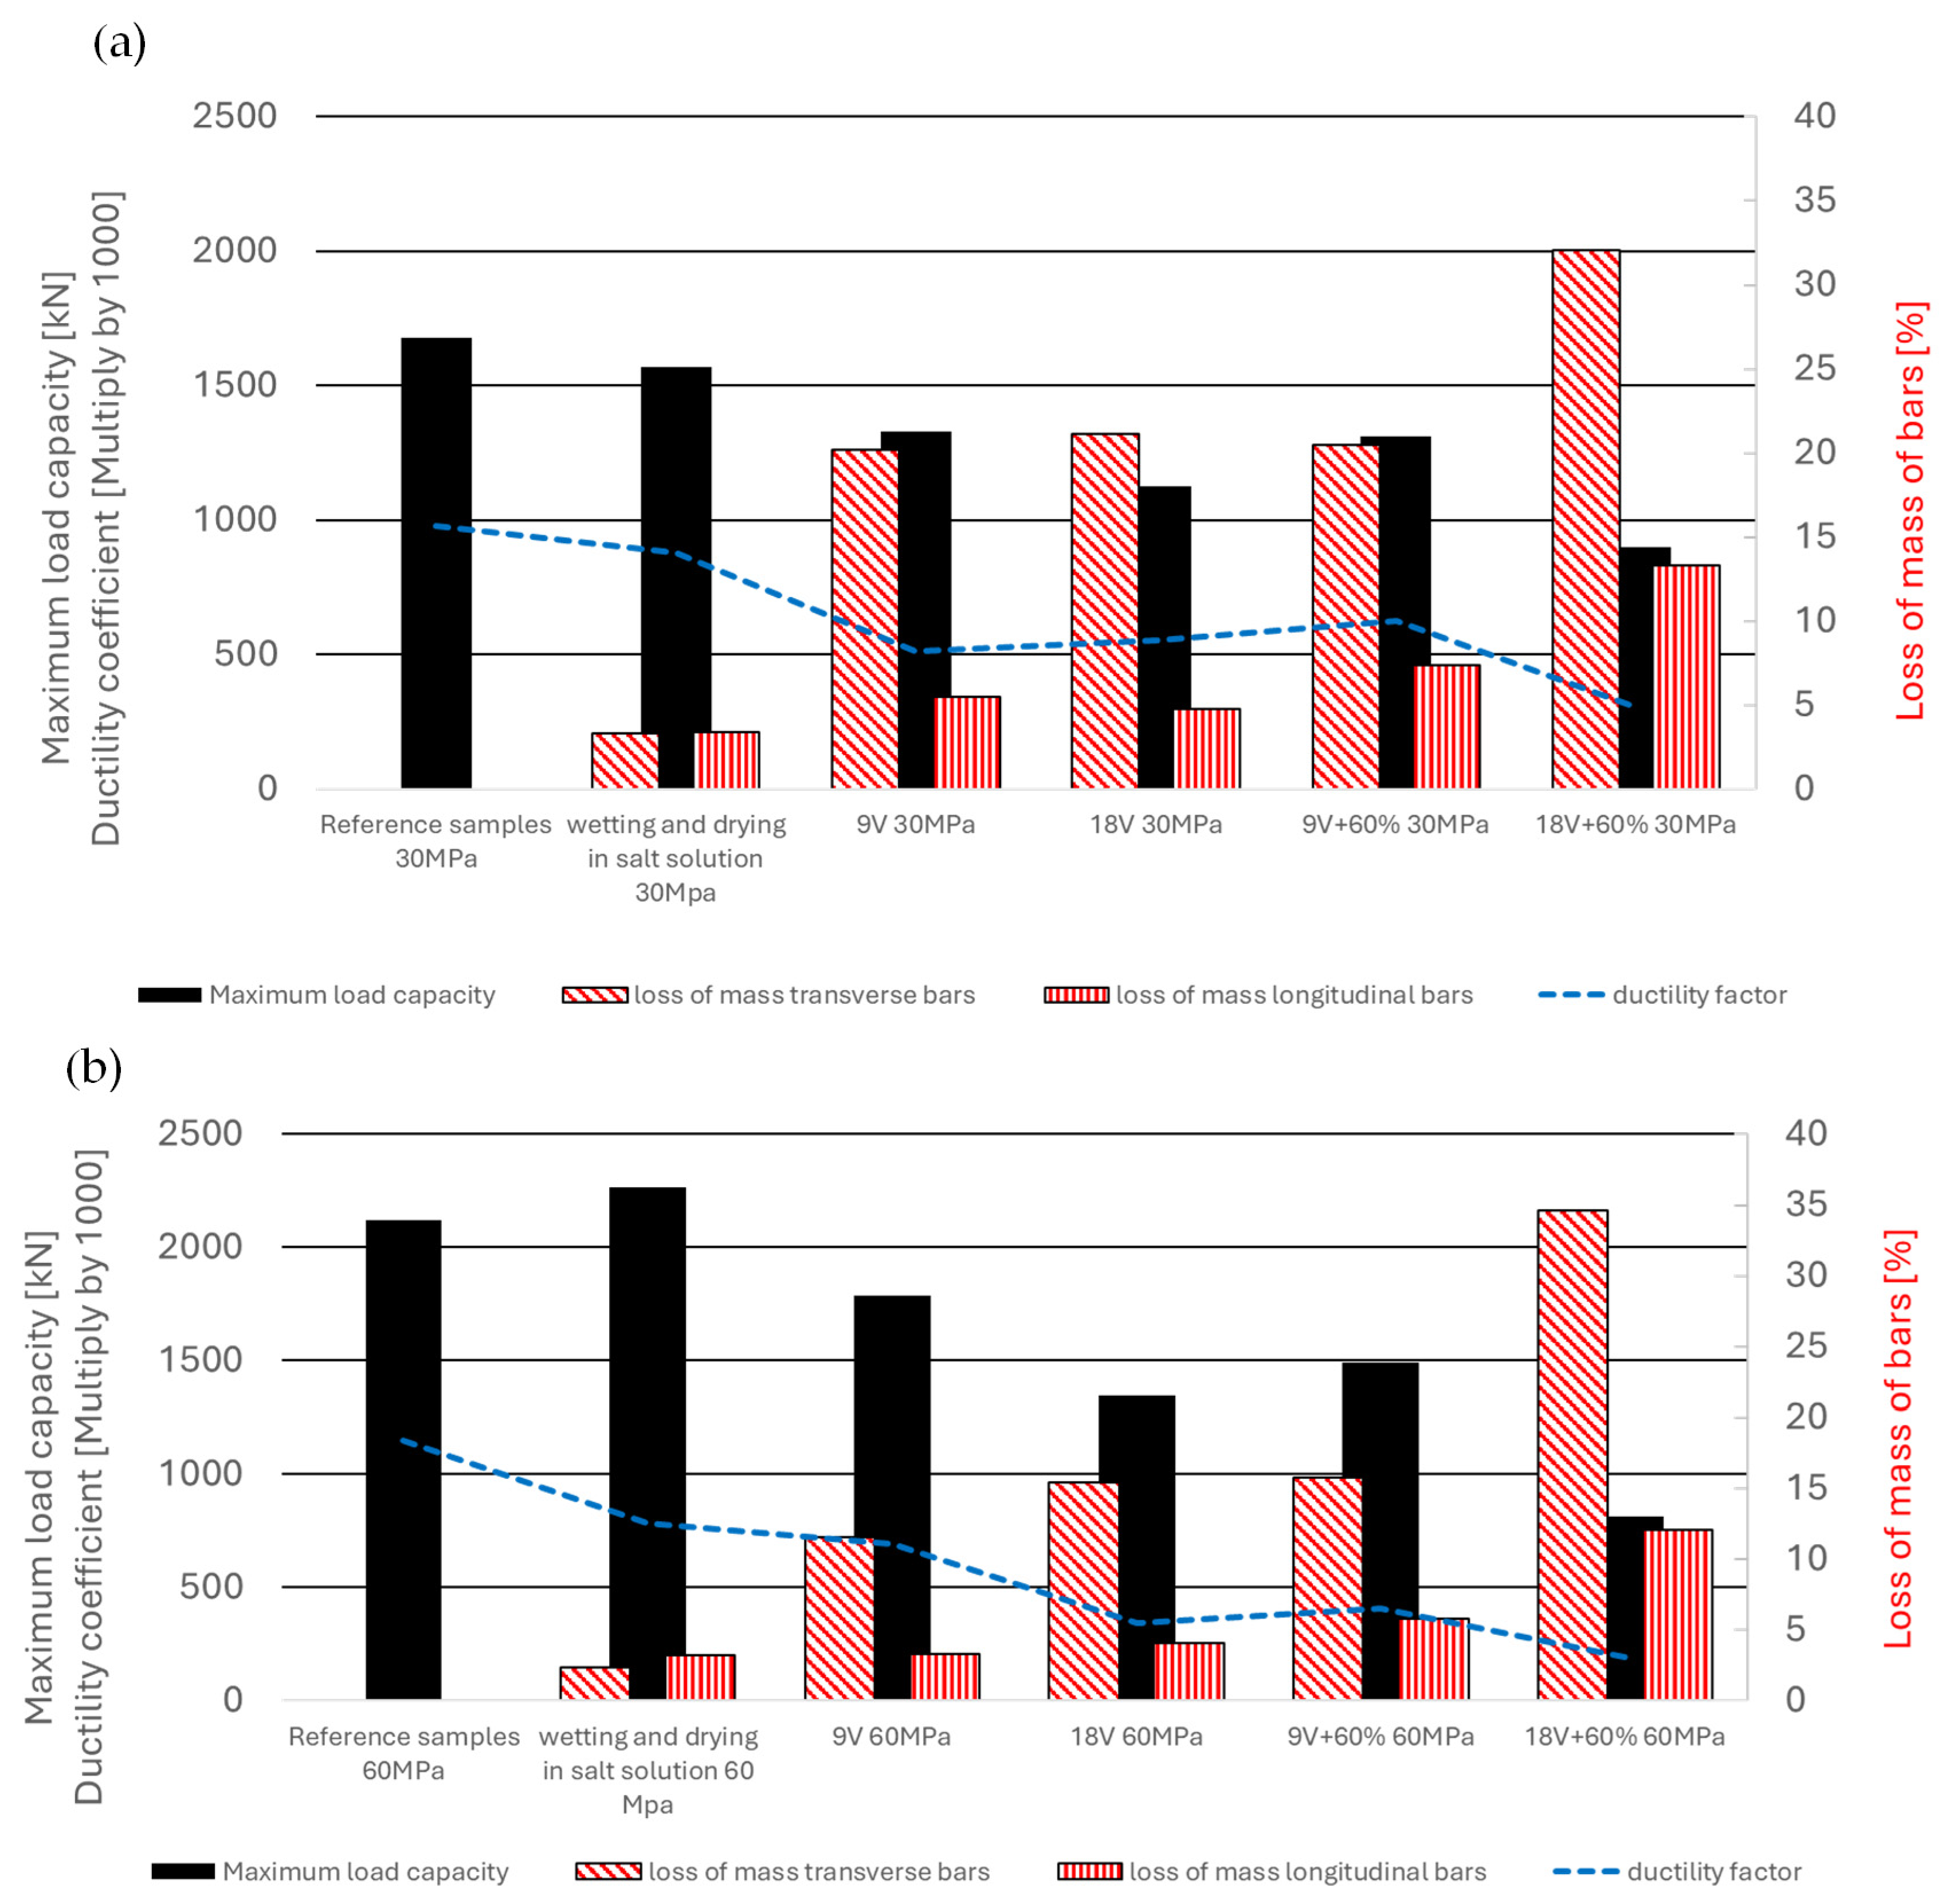
Figure 18 illustrates the relationship between the ductility, strength reduction, and mass loss due to corrosion in normal strength concrete (NSC) and moderate strength concrete (MSC) specimens.
The displacement ductility factor, denoted as μ, is defined by the equation:
μ =   A ( ε c f 50 ) / A ( ε f 50 )
where ε c f 50 is the post peak strain corresponding to 50% of the maximum load in specimens subjected to corrosion, and the strain   ε f 50 represents the compressive post peak strain corresponding to 50% of the peak compressive strength in the reference (uncorroded) concrete specimens. The letter A in Equation (21) represents the area under the stress–strain graph [57]. The factor μ provides a measure of the ductility of concrete, indicating how much deformation the concrete can undergo beyond its peak strength before a significant reduction in load-bearing capacity occurs. The average ductility factor for the control MSC reference specimens was μ = 1.14, while that for the control NSC reference specimens was μ = 0.98. For the MSC and NSC samples subjected to wetting and drying cycles, the ductility coefficients were μ = 0.783 and 0.882, respectively. For the samples subjected to an external voltage of 9 volts, the ductility coefficient for MSC samples was μ = 0.694 and that for NSC samples was μ = 0.513. For the MSC and NSC samples that were also subjected to a constant load of 60% and 9 volts, which affected the amount of corrosion, the ductility coefficients were 0.407 and 0.628, respectively. As far as the NSC samples subjected to an external voltage of 18 volts are concerned, the average ductility factor was μ = 0.553 and that for MSC was μ = 0.345. For the MSC samples that were also subjected to a constant load of 60% and 18 volts, which affected the amount of corrosion, the ductility coefficient was 0.191, and that for the NSC samples subjected to a constant load of 60% and 18 volts was 0.305.
A clear trend can be observed: as corrosion reduces the strength of the specimen, the axial stiffness decreases. In NSC, this decrease in elasticity becomes more moderate with increasing corrosion, while MSC exhibits a steeper decrease. The data reveals that the accumulation of corrosion products, combined with service loads under an applied electrical voltage, behaves proportionally to a higher electrical voltage. This suggests that service loads accelerate the corrosion of the reinforcing bars, further reducing their cross-sectional area. The values obtained support this: specimens exposed to 18 V show a corrosion effect similar to those exposed to 9 V with an applied 60% service load. Furthermore, a clear trend shows a more significant mass loss in the transverse bars (stirrups) of NSC compared to MSC under all exposure conditions. Conversely, the longitudinal bars showed relatively similar levels of mass loss regardless of the concrete type. This can be explained by the mechanism of the electric current: the current passing directly from the longitudinal bars to the transverse bars does not cause significant mass loss in the longitudinal bars. The mass loss occurs primarily where the current exits the transverse bars into the surrounding concrete, leading to localized corrosion at these exit points.
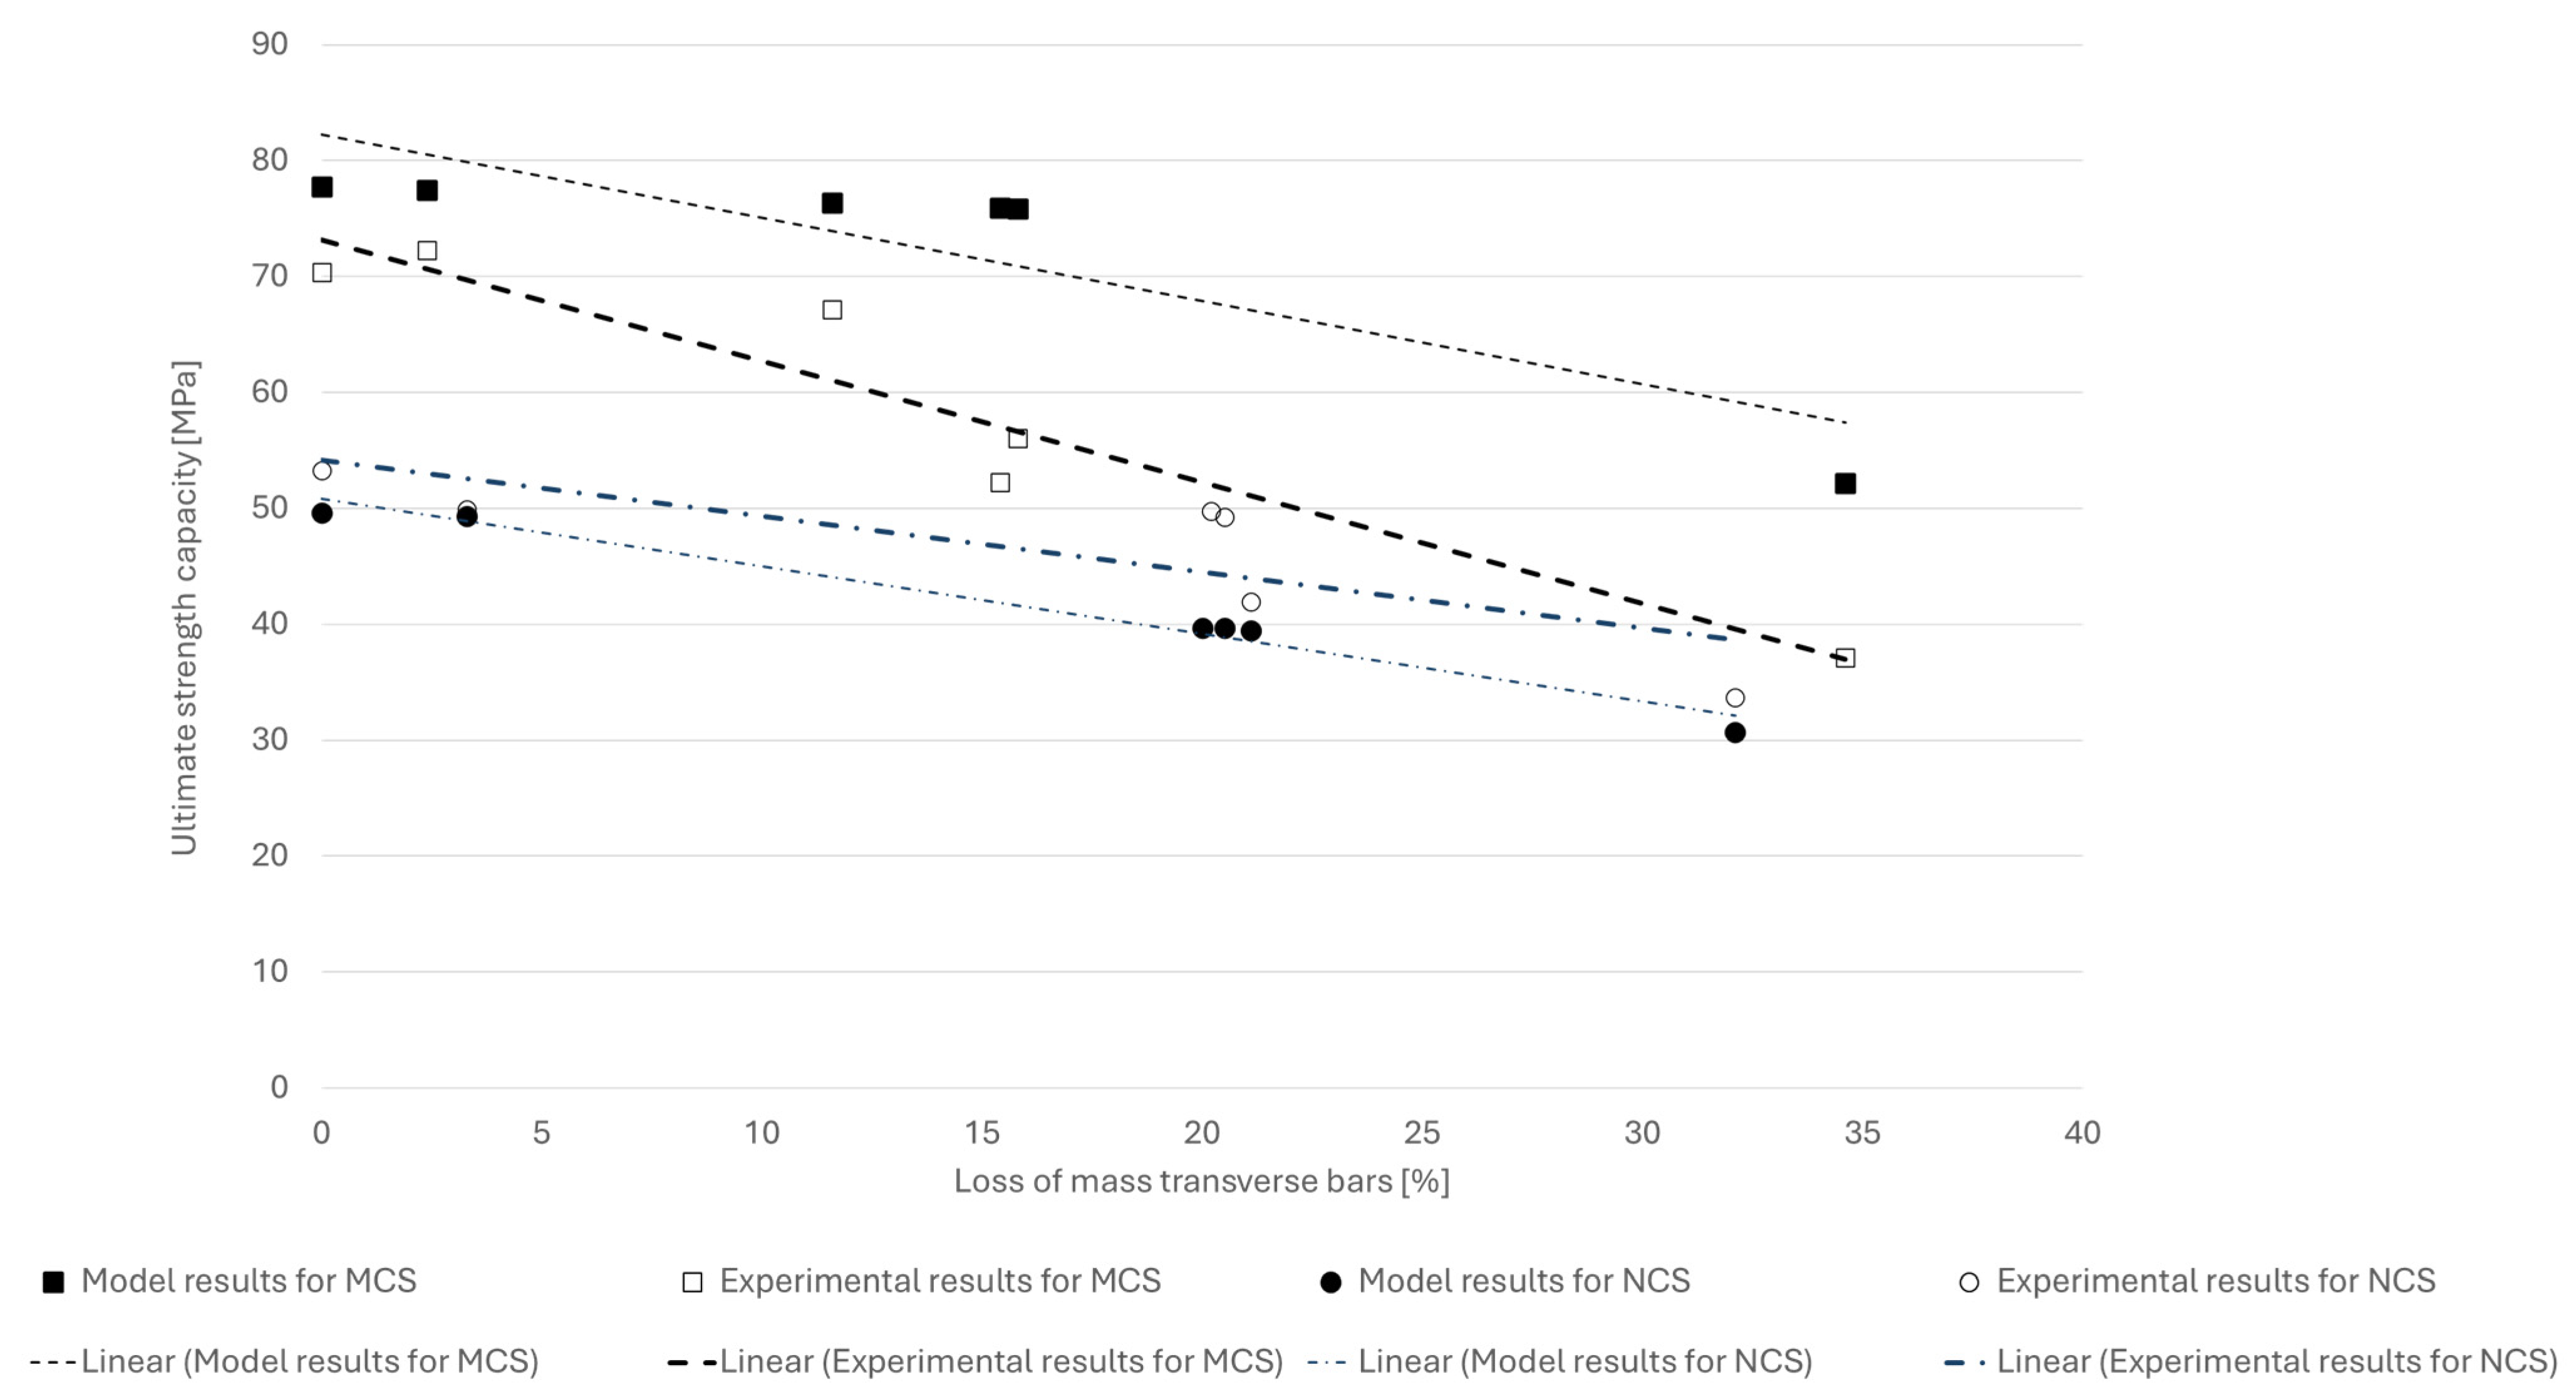
Figure 19 presents a comparison between the theoretical model and experimental results for the confined strength of the concrete columns. Despite the model not accounting for the strengthening effect of concrete when exposed to water, it conservatively and consistently predicts the load capacity across two different concrete strength levels. The model is also effective in addressing the challenge posed by the localized nature of corrosion products. The model’s accuracy is comparable to that observed in predictions of maximum failure strength when comparing confined versus unconfined concrete models. The maximum difference between the theoretical model and the experimental results is 29%, even without explicitly accounting for the influence of confinement. Furthermore, the model’s accuracy approaches the same magnitude (around the 30% difference range) when the mass loss due to corrosion approaches 30%.

5. Conclusions

In this study, the effects of corrosion on the reinforcing bars and its impact on the axial compressive structural behavior of reinforced concrete columns were evaluated. Two strength levels of concrete were tested under varying corrosion conditions to assess their influence on the column’s performance. Additionally, the effect of service load on the extent of corrosion was examined. Subsequently, a model was developed to evaluate the maximum load-carrying capacity of the columns under these conditions. The main conclusions identified from the study are as follows:
  • Corrosion of the reinforcing bars can significantly reduce the load bearing capacity of reinforced concrete columns and may impair their ability to support the loads that the reinforcement addition was supposed to carry the load they were originally designed for.
  • Corrosion products can exert tensile forces on the structural elements, resulting in the formation of cracks. This cracking occurs as the volume of corrosion products increases, creating internal stresses within the concrete. When compressive loads are subsequently applied, these pre-existing cracks can lead to an increase in strain within the elements.
  • The application of a 60% service load doubled the corrosion rate, when compared to the specimens exposed only to electrical voltage.
  • Corrosion of reinforcing bars leads to a change in the axial stiffness of reinforced concrete columns. Specifically, for medium strength concrete (MSC), subjecting the columns to 18 V coupled with a 60% service load caused severe corrosion, with mass losses of 12.1% in longitudinal bars and 34.6% in transverse bars. This deterioration led to critical reductions of 61.6% in bearing capacity and 83.3% in the ductility index. In comparison, the normal strength concrete (NSC) specimens under similar conditions—exhibiting comparable mass losses of 13.3% (longitudinal) and 32.1% (transverse)—resulted in lower, yet significant, reductions of 46.3% in capacity and 68.9% in ductility.
  • The proposed model effectively predicts the axial behavior of reinforced corroded concrete columns.

Author Contributions

Conceptualization, K.K. and R.E.; methodology, K.K., R.E. and I.L.; software, I.L.; validation, K.K., R.E. and I.L.; formal analysis, I.L.; investigation, I.L.; resources, K.K.; data curation, K.K., R.E. and I.L.; writing—original draft preparation, I.L.; writing—review and editing, K.K. and R.E.; visualization, I.L.; supervision, K.K. and R.E.; project administration, K.K.; funding acquisition, K.K. All authors have read and agreed to the published version of the manuscript.

Funding

This study was funded by the Ministry of Construction and Housing, State of Israel (grant number 2031518).

Data Availability Statement

Dataset available on request from the authors.

Acknowledgments

The authors would like to express their sincere gratitude for the financial support provided by the Ministry of Construction and Housing, State of Israel. Special thanks are extended to E. Itzhak and E. Gershengoren for their invaluable assistance in laboratory experiments investigations.

Conflicts of Interest

The authors declare that they have no conflicts of interest.

References

  1. Avesh, M.; Hossain, I.; Sharma, R.C. Revolutionizing Transportation: The Future Impact of Green Energy. In Dynamics of Transportation Ecosystem, Modeling, and Control; Sharma, S.K., Upadhyay, R.K., Kumar, V., Eds.; Energy, Environment, and Sustainability; Springer Nature: Singapore, 2024; pp. 261–293. [Google Scholar]
  2. Luvisetto, L.; Ricci, S. Free-Fare Public Transport: Economic, Environmental, and Social Sustainability. Transp. Res. Procedia 2025, 86, 716–723. [Google Scholar] [CrossRef] [Scilit]
  3. World Metro Figures—UITP. Available online: https://www.uitp.org/publications/world-metro-figures/ (accessed on 7 September 2025).
  4. The Global Tram and Light Rail Landscape 2019-21—UITP. Available online: https://www.uitp.org/publications/the-global-tram-and-light-rail-landscape-2019-21/ (accessed on 7 September 2025).
  5. Jin, H.; Yu, S. Effect of DC Stray Current on Rebar Corrosion in Cracked Segment of Shield Tunnel. Constr. Build. Mater. 2021, 272, 121646. [Google Scholar] [CrossRef] [Scilit]
  6. Lapiro, I.; Eid, R.; Kovler, K. Passive Protection of Reinforced Concrete Columns against Stray Currents and Chloride Attack. Constr. Build. Mater. 2025, 472, 140814. [Google Scholar] [CrossRef] [Scilit]
  7. Prediction of Deterioration of Concrete Bridges|TU Delft Repository. Available online: https://repository.tudelft.nl/record/uuid:dd1aba11-8e05-490d-957c-3566a1101a95 (accessed on 11 November 2025).
  8. Kunawisarut, A.; Iwanami, M.; Chijiwa, N.; Nakayama, K. Assessment of Bond Deterioration in Corroded RC Members Incorporating Cracking Response and Tension Stiffening. Struct. Infrastruct. Eng. 2022, 20, 581–593. [Google Scholar] [CrossRef] [Scilit]
  9. Hussein, A.; Huang, H.; Wu, Z. Modelling of Long-Term Performance of RC Beams under Coupling Steel Corrosion and Bond Deterioration. Structures 2023, 57, 105159. [Google Scholar] [CrossRef] [Scilit]
  10. Feng, W.; Tarakbay, A.; Ali Memon, S.; Tang, W.; Cui, H. Methods of Accelerating Chloride-Induced Corrosion in Steel-Reinforced Concrete: A Comparative Review. Constr. Build. Mater. 2021, 289, 123165. [Google Scholar] [CrossRef] [Scilit]
  11. Torres-Luque, M.; Bastidas-Arteaga, E.; Schoefs, F.; Sánchez-Silva, M.; Osma, J.F. Non-Destructive Methods for Measuring Chloride Ingress into Concrete: State-of-the-Art and Future Challenges. Constr. Build. Mater. 2014, 68, 68–81. [Google Scholar] [CrossRef] [Scilit]
  12. Chen, Z.; Koleva, D.A.; Schlangen, E. Cement and Concrete Research Bond of Steel-Mortar Interface Interfered by Stray Current. Cem. Concr. Res. 2021, 150, 106591. [Google Scholar] [CrossRef] [Scilit]
  13. Qiang, L. Bearing Capacity of Corroded RC Columns. In Proceedings of the 2010 Third International Conference on Information and Computing; IEEE: New York, NY, USA, 2010; pp. 233–236. [Google Scholar]
  14. Smith, J.; Virmani, Y.P. Materials and Methods for Corrosion Control of Reinforced and Prestressed Concrete Structures in New Construction; Federal Highway Administration: Washington, DC, USA, 2000.
  15. Rajput, A.S.; Sharma, U.K. Corroded Reinforced Concrete Columns under Simulated Seismic Loading. Eng. Struct. 2018, 171, 453–463. [Google Scholar] [CrossRef] [Scilit]
  16. Matthews, B.; Palermo, A.; Scott, A. Overview of the Cyclic Response of Reinforced Concrete Members Subjected to Artificial Chloride-induced Corrosion. Struct. Concr. 2023, 24, 100–114. [Google Scholar] [CrossRef] [Scilit]
  17. Zeris, C.; Batis, G.; Mouloudakis, V.; Marakis, J. Accelerated Corrosion Investigation of Axially Loaded Reinforced Concrete Elements. Anti-Corros. Methods Mater. 2014, 61, 215–223. [Google Scholar] [CrossRef] [Scilit]
  18. Zhang, W.Y.; Zhang, R.Y.; Xi, L. Corrosion of Reinforced Concrete in Accelerated Tests. Adv. Mater. Res. 2012, 610–613, 485–489. [Google Scholar] [CrossRef] [Scilit]
  19. Ma, Y.; Che, Y.; Gong, J. Behavior of Corrosion Damaged Circular Reinforced Concrete Columns under Cyclic Loading. Constr. Build. Mater. 2012, 29, 548–556. [Google Scholar] [CrossRef] [Scilit]
  20. Yalciner, H.; Kumbasaroglu, A. Experimental Evaluation and Modeling of Corroded Reinforced Concrete Columns. Struct. J. 2020, 117, 61–76. [Google Scholar] [CrossRef] [Scilit]
  21. Hameed, A.; Afzal, M.F.U.D.; Javed, A.; Rasool, A.M.; Qureshi, M.U.; Mehrabi, A.B.; Ashraf, I. Behavior and Performance of Reinforced Concrete Columns Subjected to Accelerated Corrosion. Metals 2023, 13, 930. [Google Scholar] [CrossRef] [Scilit]
  22. Yalciner, H.; Eren, O.; Sensoy, S. An Experimental Study on the Bond Strength between Reinforcement Bars and Concrete as a Function of Concrete Cover, Strength and Corrosion Level. Cem. Concr. Res. 2012, 42, 643–655. [Google Scholar] [CrossRef] [Scilit]
  23. EN 12390-1:2012; Testing Hardened Concrete—Part 1: Shape, Dimensions and Other Requirements for Specimens and Moulds. BSI: London, UK, 2012.
  24. Lapiro, I.; Eid, R.; Kovler, K. Degradation of RC Columns under Combined Exposure to Axial Loading, Stray Currents, and Chloride Ingress. Materials 2024, 17, 1295. [Google Scholar] [CrossRef] [Scilit]
  25. Nossoni, G.; Harichandran, R. Current Efficiency in Accelerated Corrosion Testing of Concrete. Corrosion 2012, 68, 801–809. [Google Scholar] [CrossRef] [Scilit] [PubMed]
  26. Afifi, M.Z.; Mohamed, H.M.; Chaallal, O.; Benmokrane, B. Confinement Model for Concrete Columns Internally Confined with Carbon FRP Spirals and Hoops. J. Struct. Eng. 2015, 141, 04014219. [Google Scholar] [CrossRef] [Scilit]
  27. Xiao, Q.G.; Teng, J.G.; Yu, T. Behavior and Modeling of Confined High-Strength Concrete. J. Compos. Constr. 2010, 14, 249–259. [Google Scholar] [CrossRef] [Scilit]
  28. Eid, R.; Paultre, P. Compressive Behavior of FRP-Confined Reinforced Concrete Columns. Eng. Struct. 2017, 132, 518–530. [Google Scholar] [CrossRef] [Scilit]
  29. Légeron, F.; Paultre, P. Uniaxial Confinement Model for Normal-and High-Strength Concrete Columns. J. Struct. Eng. 2003, 129, 241–252. [Google Scholar] [CrossRef] [Scilit]
  30. Cusson, D.; Paultre, P. Stress-Strain Model for Confined High-Strength Concrete. J. Struct. Eng. 1995, 121, 468–477. [Google Scholar] [CrossRef] [Scilit]
  31. Sargin, M.; Handa, V. A General Formulation for the Stress-Strain Properties of Concrete; SM Report Solid Mechanics Division; University of Waterloo: Waterloo, ON, Canada, 1969; Volume 3. [Google Scholar]
  32. Eid, R.; Paultre, P. Analytical Model for FRP-Confined Circular Reinforced Concrete Columns. J. Compos. Constr. 2008, 12, 541–552. [Google Scholar] [CrossRef] [Scilit]
  33. Xiao, Y.; Wu, H. Compressive Behavior of Concrete Confined by Carbon Fiber Composite Jackets. J. Mater. Civ. Eng. 2000, 12, 139–146. [Google Scholar] [CrossRef] [Scilit]
  34. ACI 318R-19; Building Code Requirements for Structural Concrete (ACI 318-19): An ACI Standard: Commentary on Building Code Requirements for Structural Concrete (ACI 318R-19). American Concrete Institute: Farmington Hills, MI, USA, 2019.
  35. Poursaee, A.; Angst, U.M. Principles of Corrosion of Steel in Concrete Structures. In Corrosion of Steel in Concrete Structures; Elsevier: Amsterdam, The Netherlands, 2023; pp. 17–34. [Google Scholar]
  36. Chen, H.-P.; Jiang, Y.; Li, W.-B. Residual Load-Bearing Capacity of Corroded Reinforced Concrete Columns with an Annular Cross-Section. Ocean Eng. 2023, 286, 115519. [Google Scholar] [CrossRef] [Scilit]
  37. Lu, C.H.; Liu, R.G.; Jin, W.L. A Model for Predicting Time to Corrosion-Induced Cover Cracking in Reinforced Concrete Structures. J. Fract. Mech. Concr. 2010, 53, 967–976. [Google Scholar]
  38. Lu, C.; Jin, W.; Liu, R. Reinforcement Corrosion-Induced Cover Cracking and Its Time Prediction for Reinforced Concrete Structures. Corros. Sci. 2011, 53, 1337–1347. [Google Scholar] [CrossRef] [Scilit]
  39. Liang, Y.; Wang, L. Prediction of Corrosion-Induced Cracking of Concrete Cover: A Critical Review for Thick-Walled Cylinder Models. Ocean Eng. 2020, 213, 107688. [Google Scholar] [CrossRef] [Scilit]
  40. Shaikh, F.U.A. Effect of Cracking on Corrosion of Steel in Concrete. Int. J. Concr. Struct. Mater. 2018, 12, 3. [Google Scholar] [CrossRef] [Scilit]
  41. Jamali, A.; Angst, U.; Adey, B.; Elsener, B. Modeling of Corrosion-Induced Concrete Cover Cracking: A Critical Analysis. Constr. Build. Mater. 2013, 42, 225–237. [Google Scholar] [CrossRef] [Scilit]
  42. Rossi, E.; Zhang, H.; Garcia, S.J.; Bijleveld, J.; Nijland, T.G.; Çopuroğlu, O.; Polder, R.B.; Šavija, B. Analysis of Naturally-Generated Corrosion Products Due to Chlorides in 20-Year Old Reinforced Concrete: An Elastic Modulus-Mineralogy Characterization. Corros. Sci. 2021, 184, 109356. [Google Scholar] [CrossRef] [Scilit]
  43. Miao, Z.; Liu, Y.; Chen, K.; Niu, X. Modification of Uniaxial Stress–Strain Model of Concrete Confined by Pitting Corroded Stirrups. Materials 2024, 17, 6014. [Google Scholar] [CrossRef] [Scilit]
  44. Vu, N.S.; Yu, B.; Li, B. Stress-Strain Model for Confined Concrete with Corroded Transverse Reinforcement. Eng. Struct. 2017, 151, 472–487. [Google Scholar] [CrossRef] [Scilit]
  45. Rodríguez-Martín, M.; Lagüela, S.; González-Aguilera, D.; Martinez, J. Prediction of Depth Model for Cracks in Steel Using Infrared Thermography. Infrared Phys. Technol. 2015, 71, 492–500. [Google Scholar] [CrossRef] [Scilit]
  46. Bertolini, L.; Pedeferri, P.; Redaelli, E.; Polder, R. Corrosion of Steel in Concrete: Prevention, Diagnosis, Repair; John Wiley & Sons: Hoboken, NJ, USA, 2013. [Google Scholar]
  47. Bertolini, L. Steel Corrosion and Service Life of Reinforced Concrete Structures. Struct. Infrastruct. Eng. 2008, 4, 123–137. [Google Scholar] [CrossRef] [Scilit]
  48. Maruyama, I. Impact of Drying on Concrete and Concrete Structures. RILEM Tech. Lett. 2022, 7, 1–11. [Google Scholar] [CrossRef] [Scilit]
  49. Shao, H.; Li, Z.; Xiao, S.; Yao, X.; Zhang, N. Mechanical Properties and Microstructure of Concrete under Drying-Wetting Cycles. Bull. Chin. Ceram. Soc. 2021, 40, 2948. [Google Scholar]
  50. Alonso, C.; Andrade, C.; Rodriguez, J.; Diez, J.M. Factors Controlling Cracking of Concrete Affected by Reinforcement Corrosion. Mat. Struct. 1998, 31, 435–441. [Google Scholar] [CrossRef] [Scilit]
  51. Alexander, M. Marine Concrete Structures: Design, Durability and Performance; Woodhead Publishing: Cambridge, UK, 2016. [Google Scholar]
  52. Bhargava, K.; Ghosh, A.K.; Mori, Y.; Ramanujam, S. Model for Cover Cracking Due to Rebar Corrosion in RC Structures. Eng. Struct. 2006, 28, 1093–1109. [Google Scholar] [CrossRef] [Scilit]
  53. Bhargava, K.; Ghosh, A.K.; Mori, Y.; Ramanujam, S. Modeling of Time to Corrosion-Induced Cover Cracking in Reinforced Concrete Structures. Cem. Concr. Res. 2005, 35, 2203–2218. [Google Scholar] [CrossRef] [Scilit]
  54. Wang, J.; Nanukuttan, S.; Basheer, P.A.M.; Bai, Y. Influence of Micro and Macro Cracks Due to Sustained Loading on Chloride-Induced Corrosion of Reinforced Concrete Beams. In Proceedings of the 4th International Conference on the Durability of Concrete Structures; Purdue University Libraries Scholarly Publishing Services: West Lafayette, IN, USA, 2014. [Google Scholar]
  55. Wang, J.; Basheer, P.A.M.; Nanukuttan, S.V.; Long, A.E.; Bai, Y. Influence of Service Loading and the Resulting Micro-Cracks on Chloride Resistance of Concrete. Constr. Build. Mater. 2016, 108, 56–66. [Google Scholar] [CrossRef] [Scilit]
  56. Wu, D.; Ding, Y.; Su, J.; Li, Z.-X.; Zhao, B. Experimental Investigation into Corrosion Effect on Buckling and Low-Cycle Fatigue Performance of High-Strength Steel Bars. Eng. Struct. 2024, 312, 118230. [Google Scholar] [CrossRef] [Scilit]
  57. Paultre, P.; Asce, M.; Eid, R.; Langlois, Y.; Lévesque, Y. Behavior of Steel Fiber-Reinforced High-Strength Concrete Columns under Uniaxial Compression. J. Struct. Eng. 2010, 136, 1225–1235. [Google Scholar] [CrossRef] [Scilit]
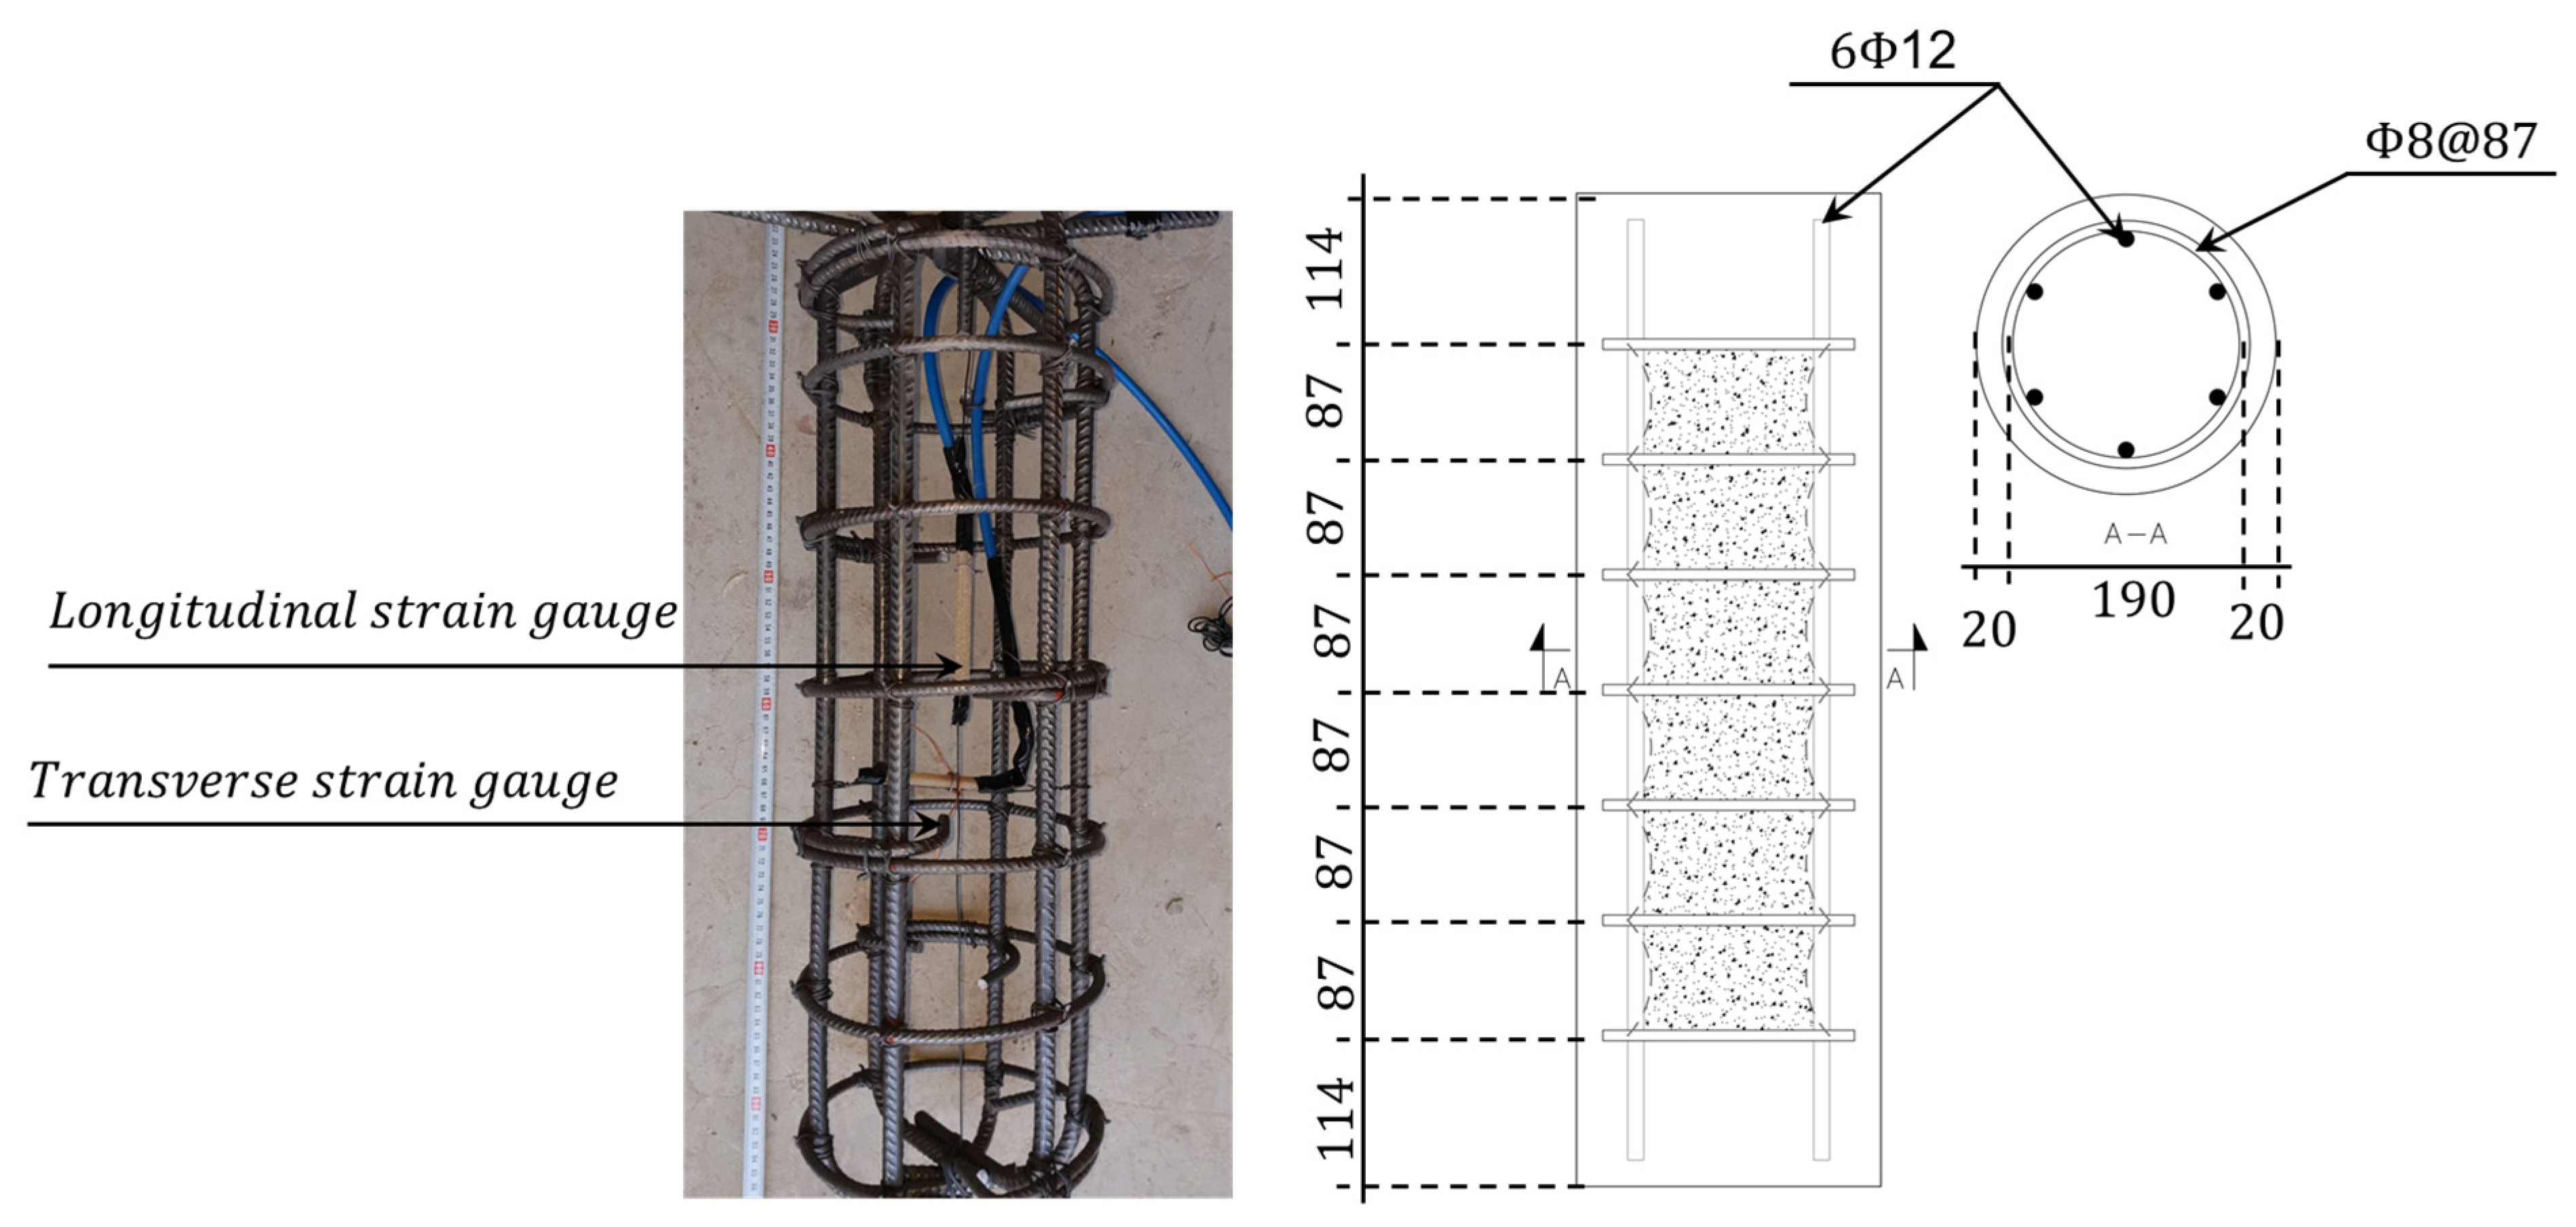
Figure 1. Dimensions of the samples. Dimensions (in mm) of the samples. A-A marking the cross section of the sample.
Buildings 16 00654 g001
Figure 2. Experimental setups for examining the effect of electric voltage on the degradation of rebars (a) and for axial compression test (b).
Buildings 16 00654 g002
Figure 3. Concrete confinement model considering corrosion initiation time (a) and its impact on stress–strain behavior in unconfined and confined specimens (b).
Buildings 16 00654 g003
Figure 4. Stress–strain curve of confined concrete.
Buildings 16 00654 g004
Figure 5. (a) Visual documentation of reference column specimens before, at maximum load, and after testing; (b) Compressive axial load versus axial strain behavior of the reference column specimens; and experimental and predicted stress–strain diagrams of (c) normal strength concrete (NSC) specimens and (d) moderate strength concrete (MSC) specimens.
Buildings 16 00654 g005
Figure 6. Strain change inside the core of the sample: NSCWD (a) and MSCWD (b).
Buildings 16 00654 g006
Figure 7. Specimens exposed to wetting/drying cycles: (a) visual documentation before, at maximum load, and after testing; (b) axial load versus axial strain; and experimental and predicted stress–strain diagrams of (c) normal strength concrete (NSC) specimens and (d) moderate strength concrete (MSC) specimens.
Buildings 16 00654 g007
Figure 8. Strain development in the samples made of (a) MSC and (b) NSC exposed to combined chloride attack and external voltage of 9 V applied for 28 days after an initial 5 days without exposure.
Buildings 16 00654 g008
Figure 9. Specimens exposed to a voltage of 9 V in a salt solution for a period of 28, visual documentation before, at maximum load, and after testing.
Buildings 16 00654 g009
Figure 10. (a) Axial load versus stress diagrams of concrete columns, after 28 days of exposure to 9 volts and 3.5% chloride environment; and experimental and predicted stress–strain diagrams of the exposed (b) NSC specimens and (c) MSC specimens.
Buildings 16 00654 g010
Figure 11. Specimens exposed to the combined effects of 9 V voltage, a chloride environment at a concentration of 3.5%, and an additional service load of 60% of their bearing capacity.
Buildings 16 00654 g011
Figure 12. (a) Axial load versus stress diagrams of concrete columns, after 28 days exposure under 9 V voltage, 3.5% chloride conditions, and a service load of 60% of their bearing capacity; and experimental and predicted stress–strain diagrams of the exposed (b) NSC specimens and (c) MSC specimens.
Buildings 16 00654 g012
Figure 13. Appearance of samples exposed to a voltage of 18 V in a salt solution for a period of 28 days.
Buildings 16 00654 g013
Figure 14. Strain development over time (initial 5 days without exposure to external voltage, followed by 28 days under 18 V): (a) MSC and (b) NSC.
Buildings 16 00654 g014
Figure 15. (a) Axial load versus stress diagrams of concrete columns, after 28 days exposure under 18 V voltage and 3.5% chloride conditions; and stress-straincomparison diagrams for (b) normal strength concrete (NSC) and (c) moderate strength concrete (MSC).
Buildings 16 00654 g015
Figure 16. Specimens exposed to the combined effects of a 18 V voltage, a chloride environment at a concentration of 3.5%, and an additional service load of 60% of their bearing capacity.
Buildings 16 00654 g016
Figure 17. (a) Axial load versus stress diagrams of concrete columns, after 28 days exposure under 18 V voltage, 3.5% chloride conditions, and service load of 60% of their bearing capacity; and stress-strain comparison diagrams for (b) normal strength concrete (NSC) and (c) moderate strength concrete (MSC).
Buildings 16 00654 g017
Figure 18. Relationship between ductility coefficient, strength reduction, and mass loss due to corrosion: NSC (a); MSC (b).
Buildings 16 00654 g018
Figure 19. Comparison of model predictions vs. experimental results for ultimate strength capacity of concrete columns.
Buildings 16 00654 g019
Table 1. Concrete compositions.
SampleContent (kg/m3)W/C 3Air Content (%)Unit Weight (kg/m3)Slump 4 (mm)Compressive Strength
(MPa)
C 1W 1S 1Aggregates 2 Days
FineCoarseMaximum Aggregate Size 2890
(mm)
MSC5001955110050090.391.9 2281 S5 (138)48 ± 2.863 ± 1.7
NSC4001954120050090.481.8 2360 S4 (89)33 ± 0.737 ± 0.7
1 C—Cement; W—Water; S—Superplasticizers. 2 Type of Aggregates—coarse: limestone, fine: quartz. 3 W/C—water to cement ratio. 4 Based on the IS 26 standard (Testing concrete: Fresh concrete—Consistency—Slump test).
Table 2. Summary of the number of reinforced concrete samples and their treatment.
Sample TypeNumber of SamplesTreatment
Reference columns—NSCR4Curing for 90 days
Reference columns—MSCR4
Wetting and drying cycles, NSCWD columns3Wetting and drying cycles (52 weeks)
Wetting and drying cycles, MSCWD columns3
NSC—columns exposed to stray electric voltage (NSCV9)3Stray voltage of 9 V + 3.5% NaCl solution
(curing 90 days + 28 days exposure)
MSC—columns exposed to stray electric voltage (MSCV9)3
NSC—columns exposed to stray electric voltage (NSCV9+60%)3Stray voltage of 9 V + 3.5% NaCl solution + 60% ultimate load
(curing 90 days + 28 days exposure)
MSC—columns exposed to stray electric voltage (MSCV9+60%)3
NSC—columns exposed to stray electric voltage (NSCV18)3Stray voltage of 18 V + 3.5% NaCl solution
(curing 90 days + 28 days exposure)
MSC—columns exposed to stray electric voltage (MSCV18)3
NSC—columns exposed to stray electric voltage (NSCV18+60%)3Stray voltage of 18 V + 3.5% NaCl solution + 60% ultimate load
(curing 90 days + 28 days exposure)
MSC—columns exposed to stray electric voltage (MSCV18+60%)3
NSC = Normal Strength Concrete; MSC = Moderate Strength Concrete; R = Reference (control); WD = Wetting and Drying cycles; V9/V18 = Applied voltage of 9 V or 18 V; +60% = Sustained axial load of 60% of ultimate capacity.
Table 3. Mechanical properties of the uncorroded transverse and longitudinal rebars.
Rebar Diameter8 mm12 mm
Yield Strength, fy (MPa)508514
Ultimate strength, fu (MPa)642624
Modulus of Elasticity, E (MPa)198,988208,198
Yield Strain, εy = fy/E0.002550.00247
Ultimate strain, εu0.04360.0610
Strain ratio, εuy17.0924.69
Strength ratio, fu/fy1.261.20
Total elongation at maximum force (%)4.565.98
Total elongation at failure, λf (%)6.9716.4
Unit mass, m (kg/m)0.3940.876
Disclaimer/Publisher’s Note: The statements, opinions and data contained in all publications are solely those of the individual author(s) and contributor(s) and not of MDPI and/or the editor(s). MDPI and/or the editor(s) disclaim responsibility for any injury to people or property resulting from any ideas, methods, instructions or products referred to in the content.