Article

Road-Type-Specific Streetscape Renewal Effects on Urban Beauty Perception: A Spatiotemporal SHAP Analysis Using Historical Street Views


1
College of Landscape Architecture, Henan Agricultural University, Zhengzhou 450002, China
2
Department of Art and Design, Zhengzhou Business University, Gongyi 451200, China
3
Department of Architecture, Henan Technical College of Construction, Zhengzhou 450002, China
4
Zhengzhou Key Laboratory for the Digital Protection of Historical and Cultural Heritage, Zhengzhou 450002, China
*
Author to whom correspondence should be addressed.
Buildings 2026, 16(3), 653; https://doi.org/10.3390/buildings16030653
Submission received: 4 January 2026 / Revised: 31 January 2026 / Accepted: 1 February 2026 / Published: 4 February 2026
(This article belongs to the Special Issue Advanced Study on Urban Environment by Big Data Analytics)

Abstract

Amid China’s shift from a model of urban “incremental expansion” to one focused on “stock optimization”, the renewal of streetscapes has taken center stage as a critical approach to improving the human experience within urban environments. However, empirical insight into how visual interventions affect aesthetic perception across different road types remains notably limited. This study addresses that gap through a spatiotemporal investigation of Zhengzhou’s streetscape transformations between 2017 and 2022. Major roads were categorized into four functional types—freeway, under-freeway, regular road, and tunnel—to better capture perceptual variation. Leveraging a Fully Convolutional Network (FCN), we extracted nine visual components from historical street views and paired them with crowd-sourced “beauty” ratings from the MIT Place Pulse 2.0 dataset. Statistical analyses, including paired t-tests and Kernel Density Estimation (KDE), indicated marked improvements in perceived beauty following renewal, with the exception of tunnel segments. Through Random Forest (RF) regression and SHapley Additive exPlanations (SHAP) interpretation, greening emerged as the most influential driver of aesthetic enhancement—most prominently on regular roads (SHAP = 2.246). The impact of renewal was found to be context-specific: green belts were most effective in under-freeway areas (SHAP = +0.8), while improvements to pavement (SHAP = +0.97) and street vitality were key for regular roads. Notably, SHAP analysis revealed non-linear relationships, such as diminishing perceptual returns when green coverage exceeded certain thresholds. These findings inform a “visual renewal–perceptual response” framework, offering data-driven guidance for adaptive, human-centered upgrades in high-density urban settings.

1. Introduction

Following a period of rapid urbanization, China’s urban development has entered a new phase characterized by a shift from “incremental renewal” to “stock renewal” [1]. This transition places greater emphasis on the efficient use of existing urban resources and adopts a more human-centered perspective by prioritizing the experiences and needs of urban residents [2,3]. Within this context, street space has emerged as a crucial medium through which urban life is experienced and interpreted. It serves not only as a transportation corridor but also as a vital platform for engaging with the city from a humanistic perspective [2,4,5]. Consequently, streetscape renewal has become a key strategy in the sustainable transformation of high-density urban environments in China. In response, numerous cities have introduced street design guidelines aimed at shifting roadways away from vehicle-centric models toward people-oriented spaces that enhance urban quality and vibrancy [5,6,7,8].
In tandem with these policy and design efforts, technological advances have transformed how scholars study urban streets [8]. The rise in big data—with its volume, variety, and velocity—has made it the backbone of modern urban analysis [5,6,8]. Platforms such as Google Street View and Baidu Street View provide extensive visual datasets that allow for large-scale, spatially precise investigations [9]. With the support of advanced image analysis techniques [10,11], researchers can now extract a range of features from street view imagery, including spatial layout, architectural styles, greening conditions, and public amenities [12]. Over time, the focus of street landscape research has evolved—from early studies centered on green coverage [7,13,14] to more comprehensive inquiries into human behaviors and spatial perception [15], supported by increasingly diverse data sources [16]. However, significant limitations remain: most existing research examines the relationship between current spatial configurations and landscape quality [17,18], without adequately quantifying perceptual change before and after renewal or differentiating between perceptual experiences across distinct road types. Nonetheless, ongoing urban renewal practices have generated a large volume of relevant case data, enabling more robust spatiotemporal comparative analyses.
In this regard, subjective perception is just as essential as objective physical metrics in understanding how urban environments are experienced. Kevin Lynch’s seminal “urban image” theory emphasized that people’s mental maps of cities are formed through a dynamic interplay between spatial form and personal interpretation [19]. In recent years, perception-based research has grown increasingly sophisticated, thanks to big data methodologies [20,21]. By integrating multiple data sources—such as social media, location data, and point of interests (POIs)—scholars are now able to examine how urban landscapes are perceived emotionally and cognitively [22]. Some studies have even begun to target specific demographic groups [23,24], exploring perception in dimensions like safety, comfort, and convenience [25]. Yet, the majority of current studies rely on data from a single time point, lacking longitudinal comparisons that would allow for analysis of perceptual change before and after physical upgrades. This temporal blind spot limits our understanding of how urban renewal actually reshapes user perception.
Developments in deep learning have introduced new tools for studying perception in urban spaces [11,26]. Convolutional Neural Networks (CNNs) and Fully Convolutional Networks (FCNs) are now widely used for parsing street view imagery [26], while ensemble models like Random Forest (RF) and Extreme Gradient Boosting (XGBoost) have proven effective in revealing the relationships between visual features and subjective responses [21,27]. More recently, SHapley Additive exPlanations (SHAP) has emerged as a powerful interpretive technique that assigns feature-level importance scores and helps unpack complex, nonlinear relationships in predictive models [18,28]. The integration of deep learning and SHAP has already improved the interpretability of street view analyses [29,30]. This integration enables researchers to unpack complex urban data structures and accurately capture the non-linear dynamics embedded within them [31]. However, the use of SHAP in analyzing renewal effects across different road types remains notably absent from the current literature, highlighting a key methodological gap. Considering that biophilic design theory identifies natural elements (e.g., vegetation) as fundamental drivers of urban aesthetic preference [32], the absence of such analysis becomes significant. Additionally, this combined approach—merging interpretable machine learning with street view analytics—has yet to be systematically applied in urban perception studies.
Against this backdrop, the present study leverages historical street view big data in combination with deep learning techniques to quantify the spatiotemporal dynamics linking visual elements and subjective perceptions across various road types. This is the first research effort to propose a perception-oriented classification of urban roads, introduce a SHAP-based framework stratified by road type for analyzing heterogeneous effects, and develop tailored renewal strategies accordingly. The resulting dataset lays a solid foundation for future multi-objective optimization efforts that integrate visual comfort, daylighting performance, and energy efficiency considerations [33]. Using the city of Zhengzhou, China—which recently completed a significant phase of urban street renewal—as a case study, the research establishes a four-stage methodological framework: (1) the acquisition of street view imagery, (2) the quantification of perceptual responses, (3) the classification of renewal components, and (4) the interpretive modeling of perceptual outcomes using machine learning. By combining traditional statistical approaches with explainable artificial intelligence techniques, the study enables a structured and interpretable assessment of how visual interventions influence urban perception, thereby offering more nuanced support for data-informed, human-centered street renewal policies.

2. Study Area and Data Collection

2.1. Study Area

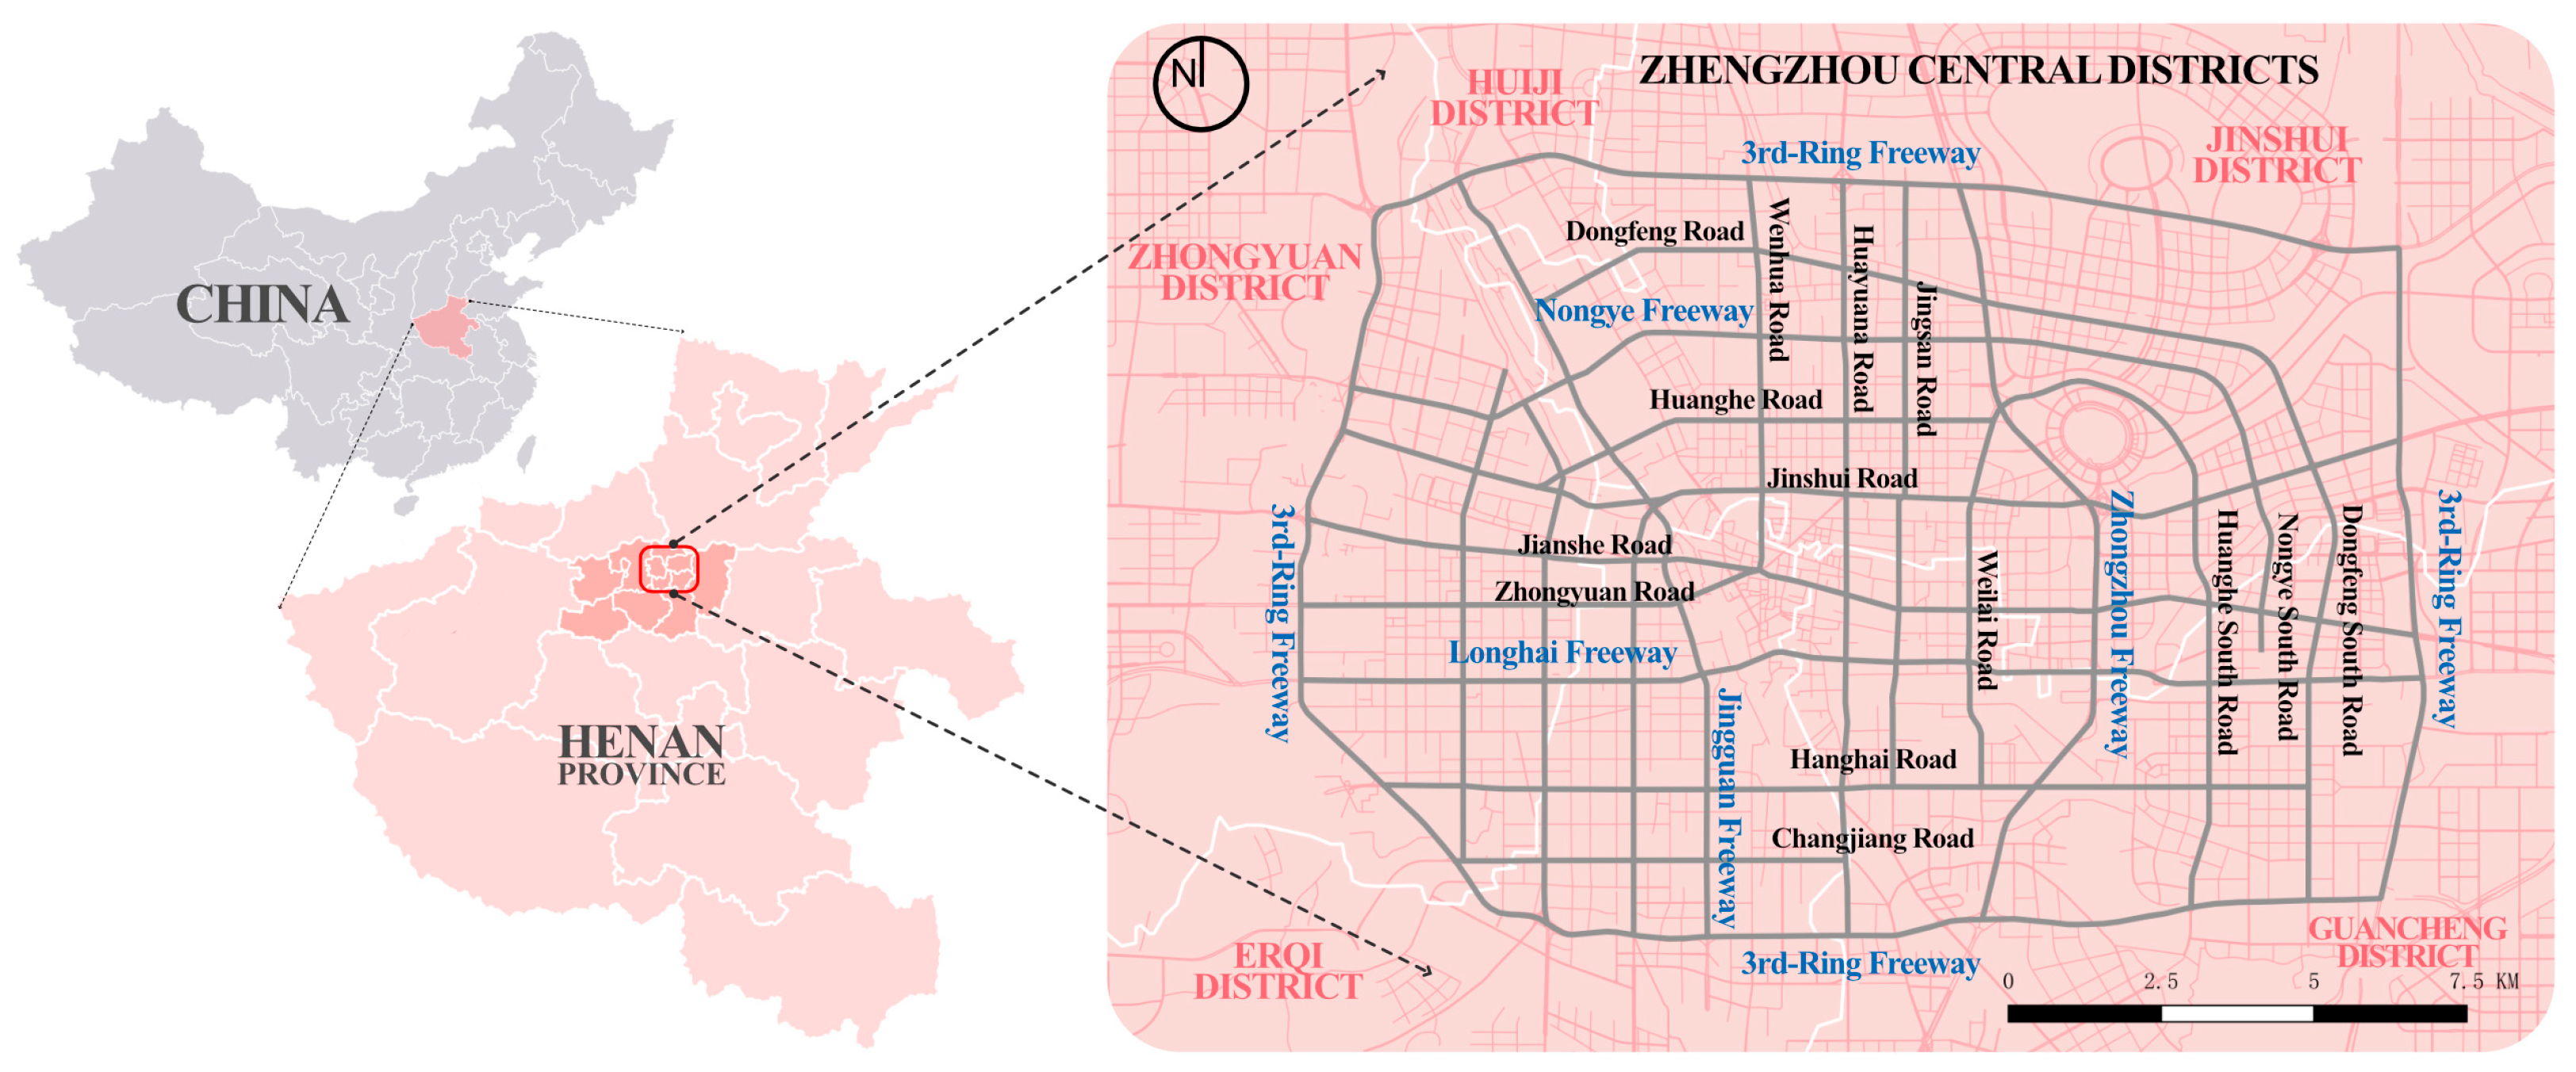
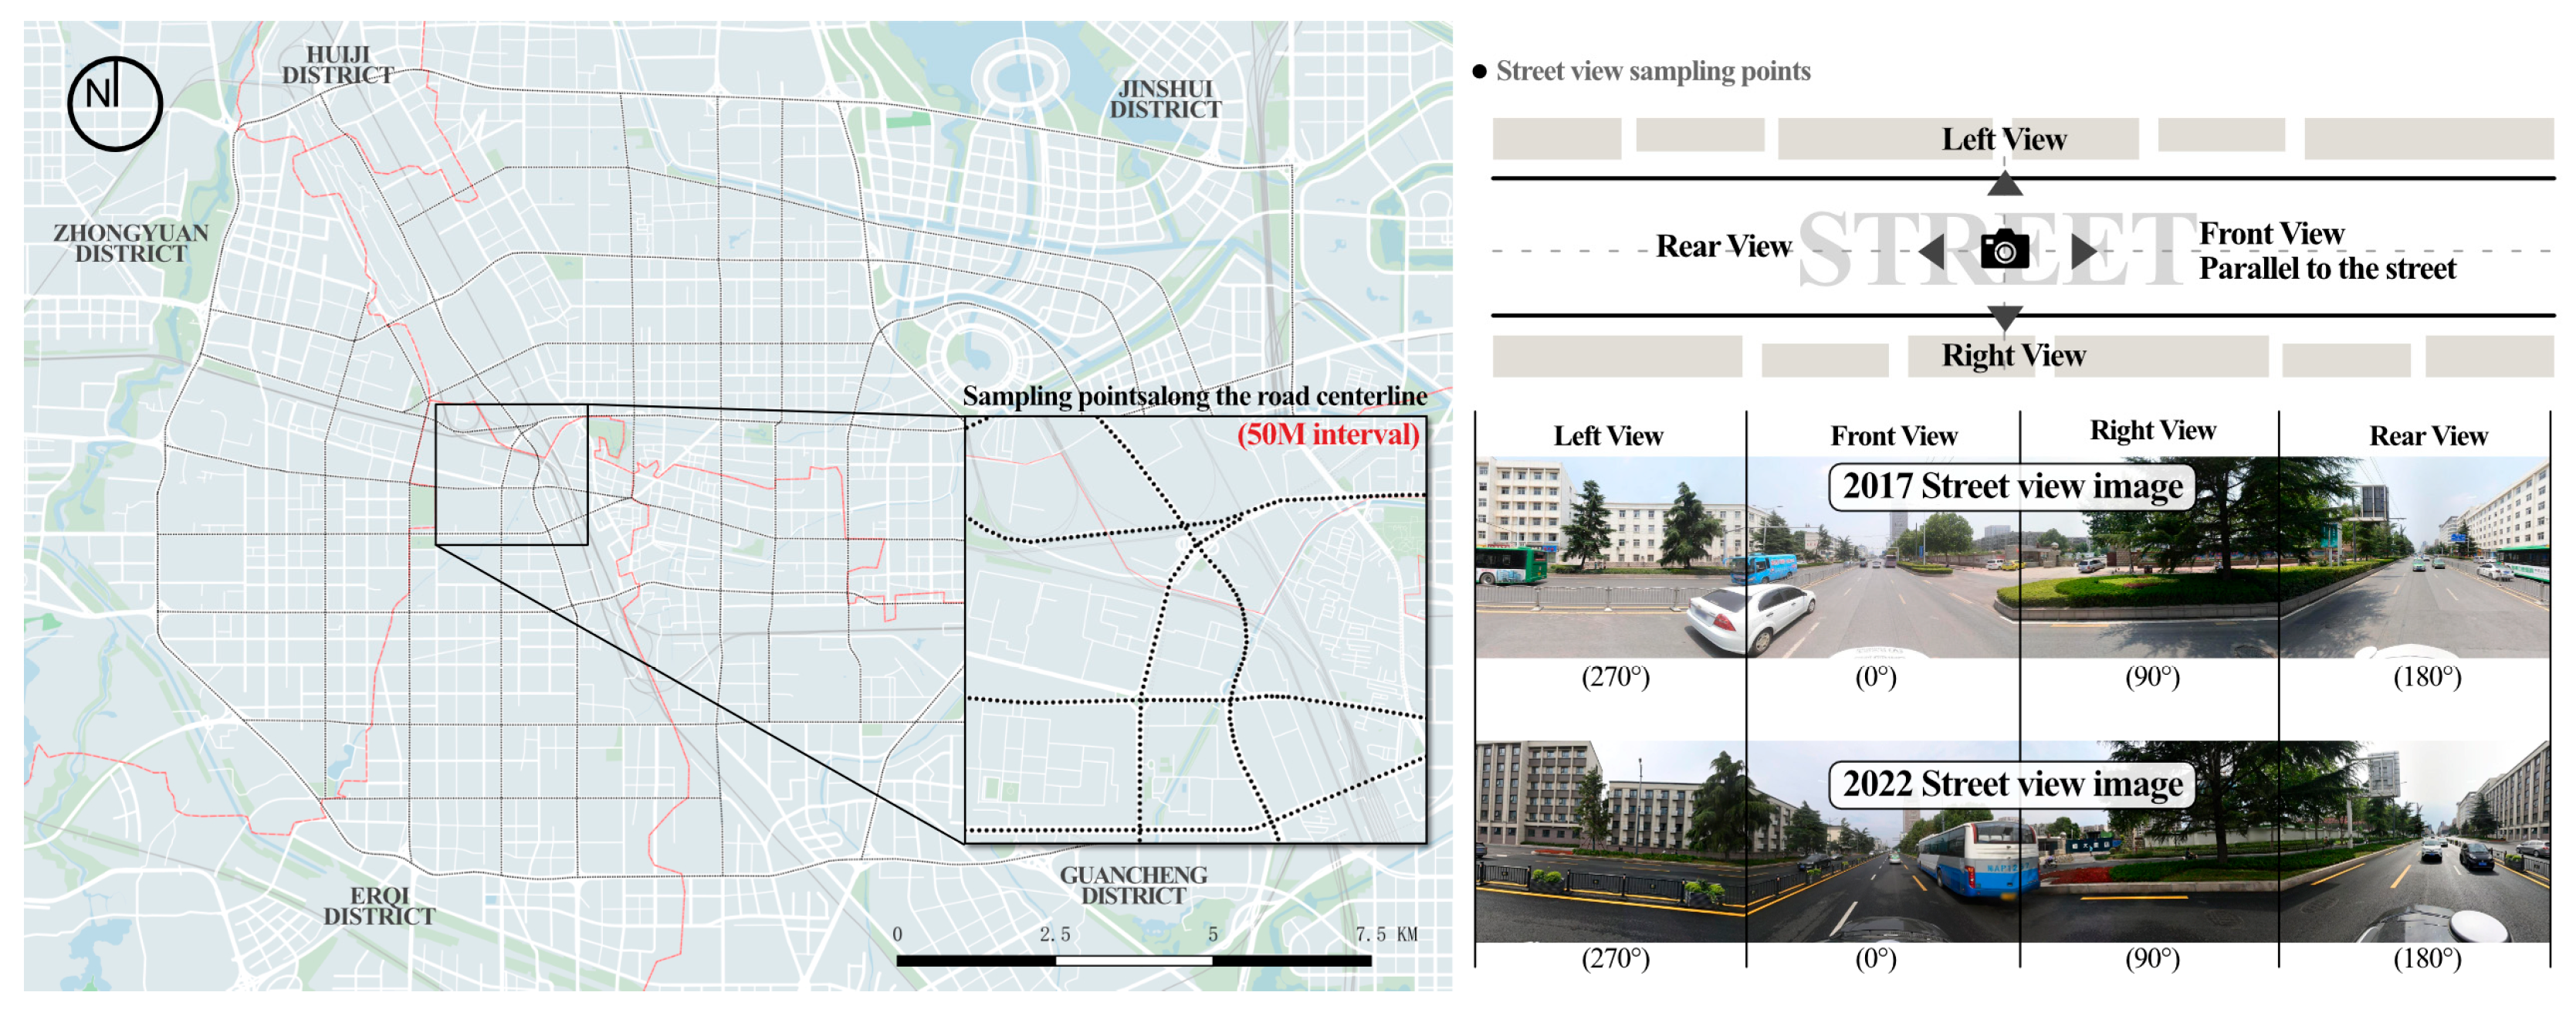
Zhengzhou, a major urban center in central China, was selected as the focal area for this study (Figure 1). The city recently completed a comprehensive renewal of its primary arterial roads within the urban core, thereby offering a robust case dataset that meets the study’s analytical needs. Guided by the Zhengzhou Street Design Guidelines, the renewal efforts were designed to achieve multiple objectives: enhancing traffic safety, promoting ecological street design, strengthening street vitality, and creating distinctive urban corridors. By 2021, most of the key renewal projects across the city’s main roads had been completed, generating a substantial body of practical outcomes that provide a solid empirical foundation for the present analysis.

2.2. Baidu Street View Image Data

Street view imagery used in this study was obtained from the Baidu Maps street view platform (https://lbsyun.baidu.com). Initial geospatial data on Zhengzhou’s primary urban roads were retrieved using OpenStreetMap (https://www.openstreetmap.org) and processed with QGIS software (3.28.0). To define the study area, renewal sections within the city’s third ring road were identified via API access, with sampling points systematically distributed at 50 m intervals. In alignment with prior studies, images were captured in four directions—0°, 90°, 180°, and 270°—using a fixed 90° field of view to ensure consistency and comparability [17,18] (Figure 2). A total of 57,536 street view images were collected for the years 2017 and 2022 (28,768 per year), covering 7210 georeferenced sampling locations. Of these, 18 sites lacked valid imagery due to unavailable street view access, resulting in 7192 usable points. For each valid point, four directional images were stitched together to create a single panoramic view, ultimately yielding 7192 matched panoramic image pairs for longitudinal spatiotemporal analysis.
To account for potential variability in road features and their perceptual effects, roads were classified into four functional types to enable more accurate analysis of renewal outcomes. Classification focused on five major expressways in Zhengzhou—3rd-Ring, Jingguang, Longhai, Nongye, and Zhongzhou—where freeway, under-freeway, and tunnel segments are prevalent (Figure 1). All remaining roads were designated as “regular” based on field observations and expert judgment. Road type classification was independently conducted by five academic annotators with backgrounds in urban planning, achieving full agreement (100%) across all 7192 sampling points. This rigorous protocol ensured the consistency and reliability of the typology used in subsequent analysis.

3. Method

3.1. Conceptual Framework

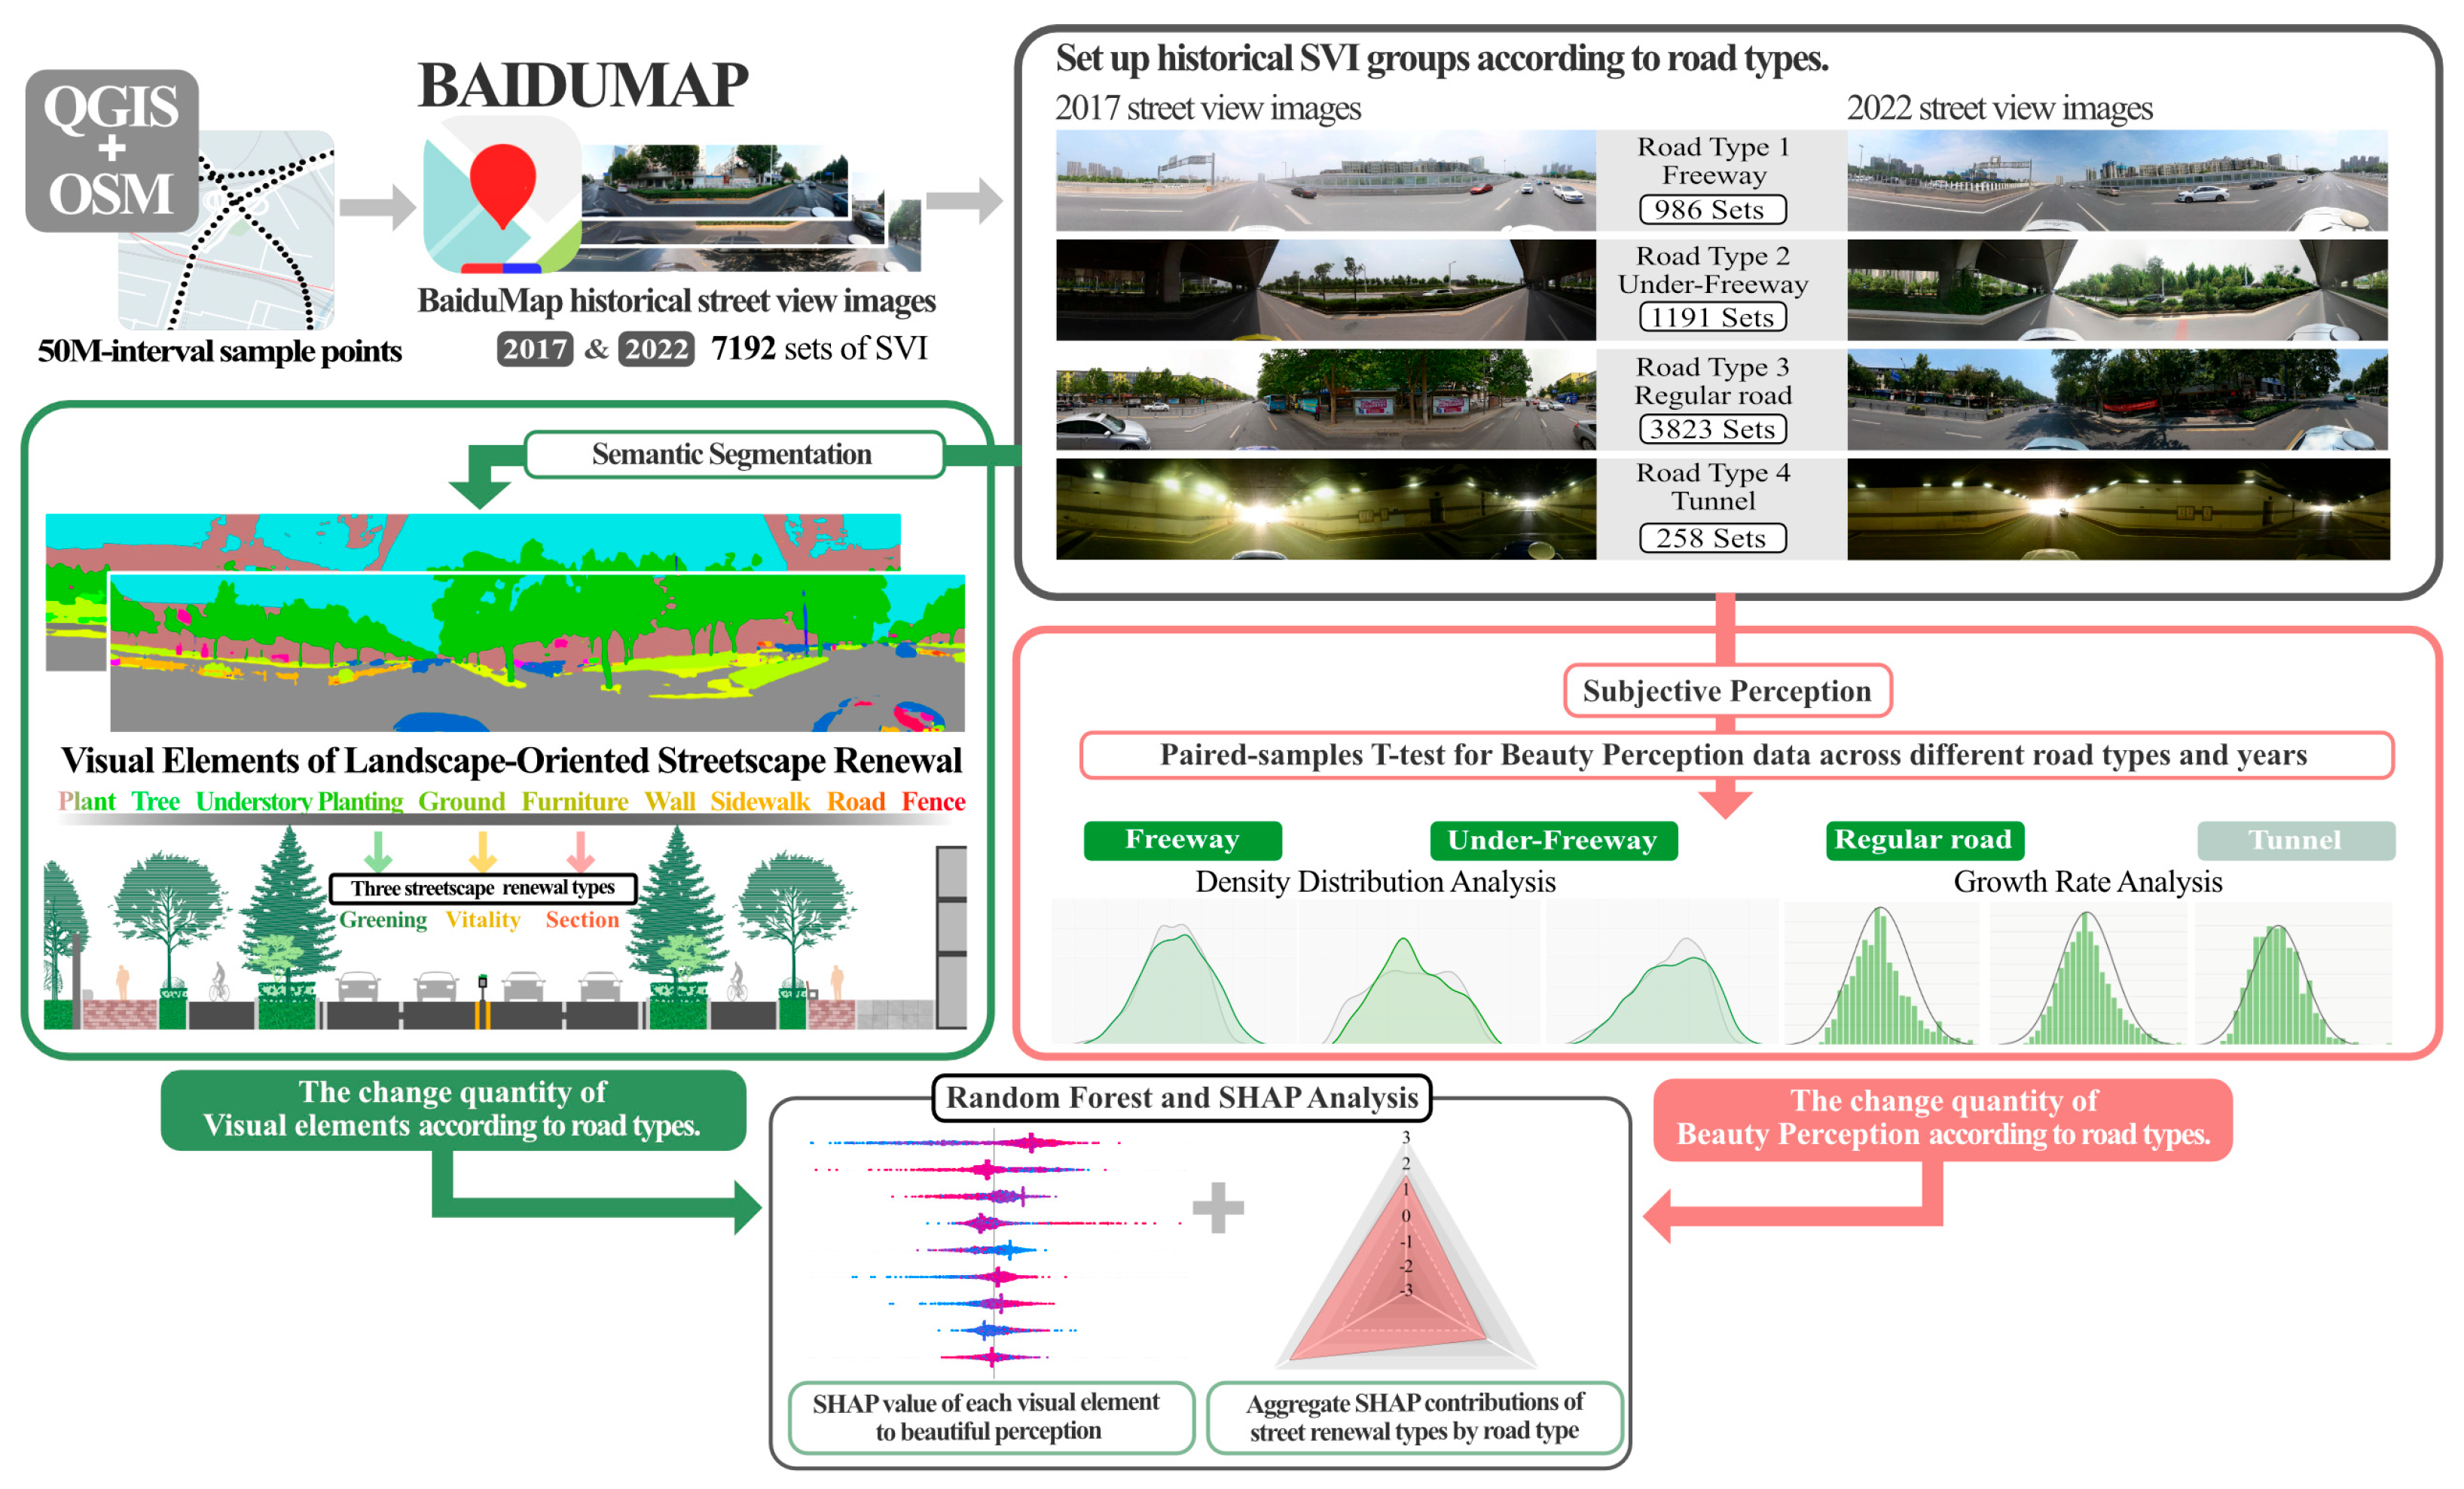
The analytical framework proposed in this study illustrates the relationship between streetscape renewal—specifically, changes in visual elements—and shifts in perceived beauty across different road types (Figure 3). This framework consists of four sequential stages. Firstly, historical street view imagery is collected to construct a comparative dataset spanning different time points. Secondly, both visual element indices and beauty perception scores are extracted and organized for analysis. Thirdly, the temporal dynamics between visual transformations and perceptual change are quantitatively assessed. Finally, interpretable machine learning techniques are employed to determine the relative influence of each visual element on beauty perception, disaggregated by road type. Together, these steps offer both methodological innovation and practical insight for more nuanced, data-driven approaches to human-centered street renewal.

3.2. Statistical Analysis of Semantic Segmentation Data

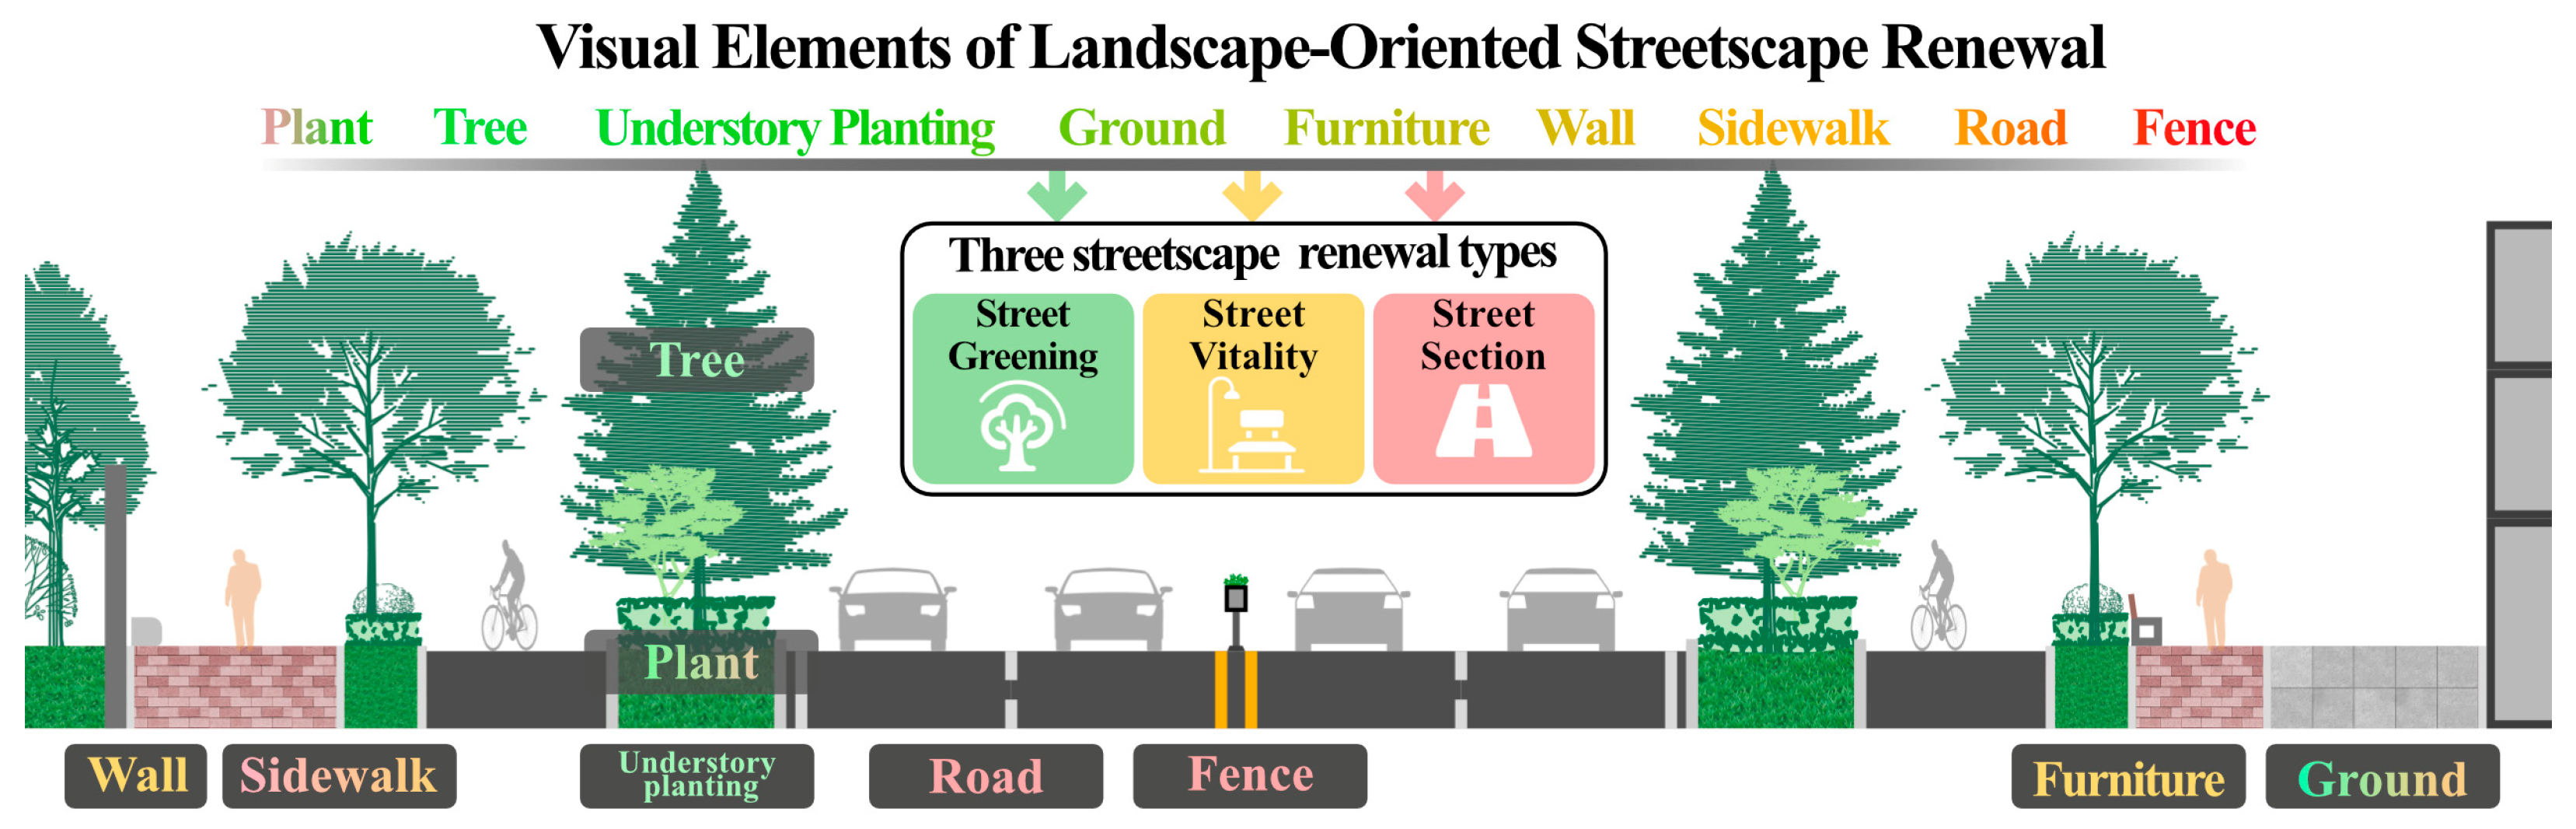
This study utilizes the ADE20K dataset in conjunction with a FCN model to convert street view images into semantic segmentation maps. The proposed segmentation architecture employed (ADE20K-resnet50dilated-ppm_deepsup) features a DilatedResNet-50 backbone integrated with a Pyramid Pooling Module (PPM) and Deep Supervision (DeepSup), achieving a mean Intersection over Union (mIoU) of 34.90% on the 150-class ADE20K validation set (n = 2000 images). This performance surpasses the commonly accepted 30% threshold for reliable semantic index generation [34,35], thereby ensuring robust segmentation accuracy and minimal error propagation in the derivation of visual element metrics. This study focuses on visual features associated with three major categories of streetscape renewal in Zhengzhou: street section upgrades, greening improvements, and vitality enhancements. Specifically, nine non-traffic-related visual elements were extracted: road, fence, plant, tree, understory planting, sidewalk, ground, furniture, and wall (Table 1 and Figure 4). These features were selected based on their relevance to the visual and landscape functions of the street environment, while excluding transportation-specific components such as streetlights, signage, and vehicles, in order to focus solely on aesthetic attributes linked to urban renewal.
To examine the characteristics of change resulting from the 2017–2022 streetscape renewal, the study calculates descriptive statistics—including mean values and standard deviations—for a range of visual indices. In addition, the distributional properties of the data are analyzed across multiple dimensions to capture broader patterns and variations. The results are presented in a visually intuitive manner.

3.3. Statistical Analysis of Subjective Perception Data

Statistical analysis of perception data serves as a critical foundation for understanding individuals’ subjective responses to urban street views [18,36]. In this study, perceived “beauty” was quantified using a deep learning model built upon the Ranking Siamese (RSS)-CNN architecture, as introduced in prior research [37]. The model was trained on the MIT Place Pulse 2.0 dataset, which contains approximately 111,000 street-view images from around the world, annotated through more than 1.2 million pairwise comparisons conducted by human raters. These annotations span six perceptual dimensions: beautiful, safe, lively, wealthy, boring, and depressing. As reported in the original study [37], the RSS-CNN model achieved a pairwise prediction accuracy of 64.2% on held-out Google Street View images, demonstrating strong cross-platform generalizability in estimating relative perceptual judgments. Given its methodological rigor and broad applicability, the Place Pulse 2.0 framework has since become a widely recognized benchmark in both domestic and international research on urban visual perception [26,28,36,38].
To apply the RSS-CNN model to Baidu Street View panoramas, the frontal view (azimuth = 0°) was extracted from each equirectangular image (Figure 2) and resized to 224 × 224 pixels using ImageNet-style normalization, strictly adhering to the input protocol outlined in the original study [37]. No fine-tuning or domain adaptation was applied. All Baidu Street View images collected between 2017 and 2022 were processed using the same pipeline to generate continuous beauty scores, which were subsequently scaled to a 0–100 range to improve interpretability. To reduce potential bias introduced by transient visual artifacts—such as construction barriers, parked vehicles, or suboptimal lighting conditions—initial model outputs were calibrated following best practices in urban visual analytics [39]. Specifically, images exhibiting more than 30% visual occlusion or captured under non-daylight conditions (e.g., dawn, dusk) or in poor illumination (e.g., heavy cloud cover) were either excluded or adjusted based on contextual evaluation, ensuring that the resulting scores more accurately reflected the underlying streetscape quality. The “beauty” dimension was selected as the primary perceptual indicator in this study, as it most directly captures visual transformations associated with urban renewal interventions. This conceptual focus is informed by established theories in environmental psychology, where aesthetic preference is consistently associated with perceptual qualities such as naturalness, coherence, and visual complexity [40]. Such attributes are more reflective of public sensibilities rather than formal or industrial aesthetics, especially in infrastructural settings like freeways.
Following the generation of “beauty” perception scores using the prediction model, the study proceeds to analyze four distinct road types. The analysis begins with a paired-sample t-test to assess whether streetscape renewal leads to significant differences in perceived aesthetic quality as reflected in street view imagery. For road types exhibiting notable perceptual changes, a combined approach (1)integrating Kernel Density Estimation (KDE) and growth rate statistics (2) is adopted to examine the distributional patterns and change characteristics of beauty perception scores. Finally, spatial variations in perceptual change are visualized through perception difference maps generated using QGIS software.
f ( x ) = 1 n h i = 1 n K x x i h
where x is the density point to be estimated; x i is the “beauty” value of the i-th sample ( i = 1, …, n); K is the kernel function; and h is the bandwidth parameter.
r = x - 2022 x - 2017 x - 2017 × 100 %
where x - 2022 and x - 2017 are the sample means of “beauty” values for a certain type of road in the corresponding year; and r is the percentage growth rate.

3.4. RF Regression+ SHAP Method

This study employs a RF regression model in combination with SHAP to examine the relationship between changes in street view visual elements and shifts in subjective aesthetic perception. As an ensemble learning technique [41], RF has become a widely used method in the analysis of large-scale street view datasets [18,42].
SHAP, a model interpretability tool grounded in Shapley value theory from cooperative game theory [43], enables the decomposition of model outputs by quantifying the individual contribution of each feature to a given prediction. By calculating SHAP values, the approach offers transparent insight into the decision-making process of complex machine learning models [44,45]. Notably, the application of SHAP to road-type-specific renewal evaluation has yet to be systematically addressed in existing street view research, representing a methodological gap that this study seeks to fill.
To facilitate interpretation, SHAP values for the nine individual visual elements were aggregated into three overarching renewal categories: street section renewal, street greening renewal, and street vitality renewal (Table 2). This aggregation produced the net SHAP contribution of each renewal type to changes in perceived “beauty”. To further illustrate these findings, radar charts were constructed to visualize the relative magnitude and directional influence (positive or negative) of each renewal type across the different road classifications.

4. Results

4.1. Descriptive Statistics of the Segmented Results

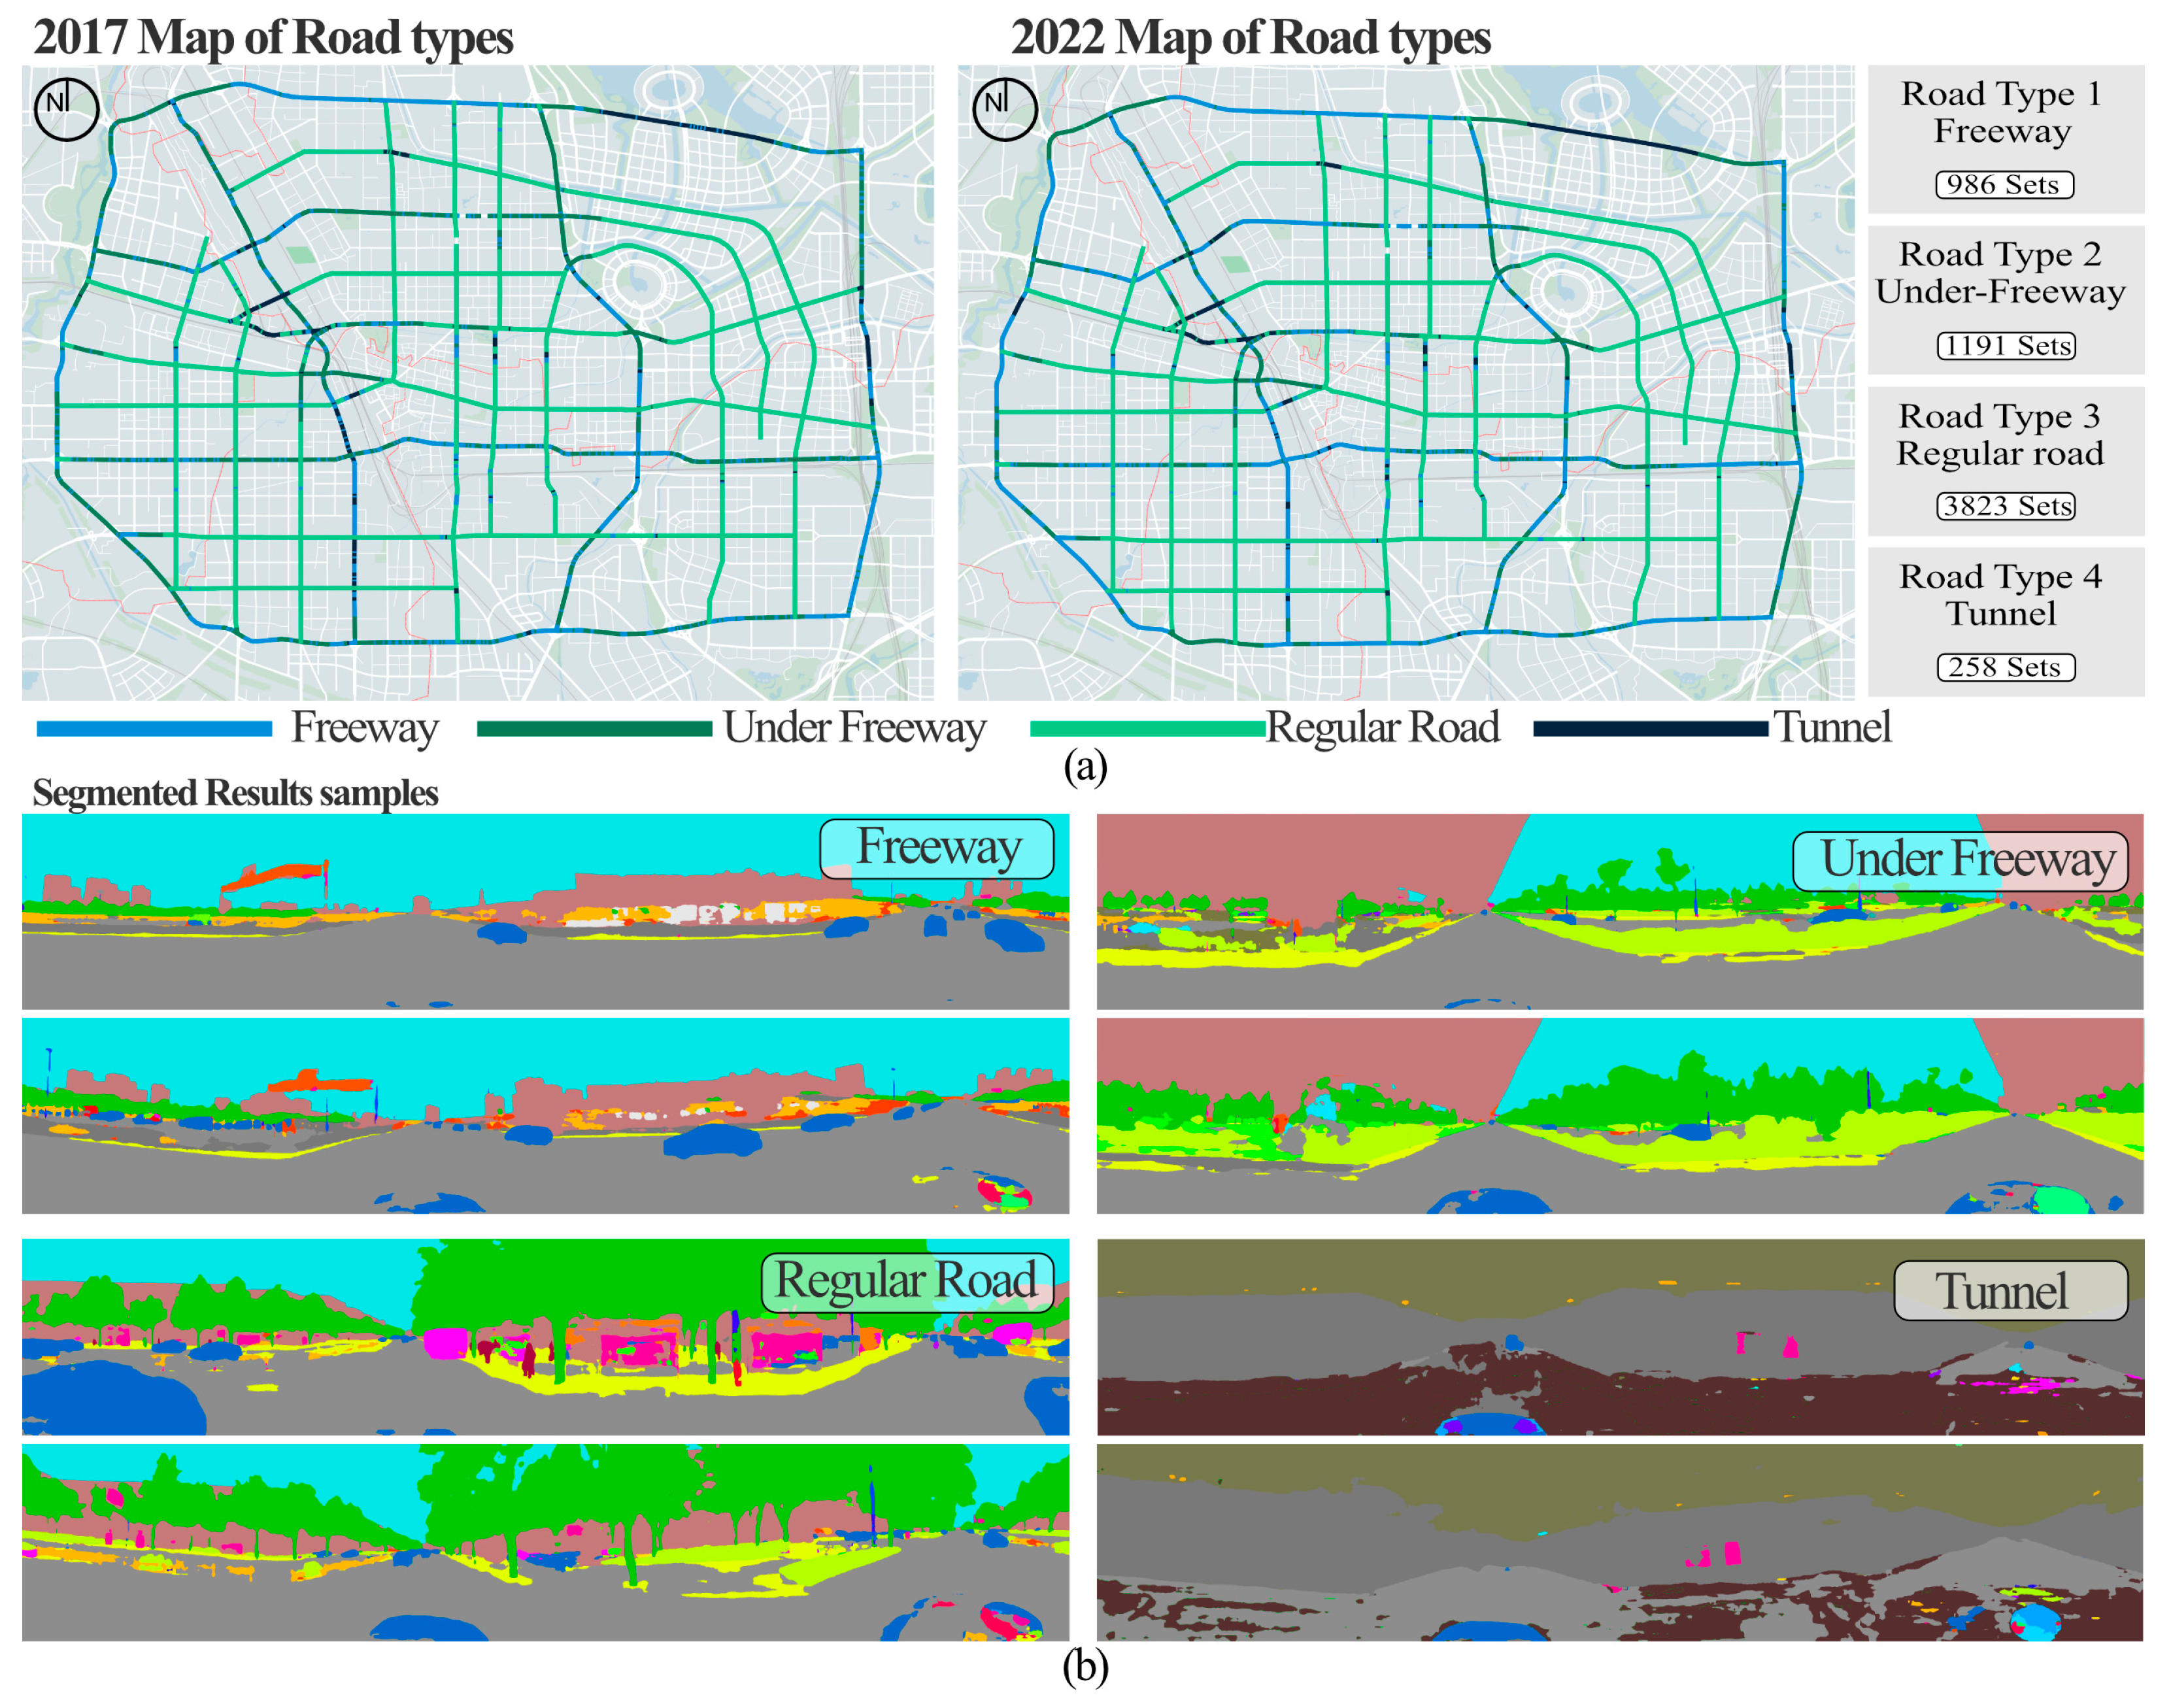
Due to the data acquisition mechanism of Baidu Street View, images are captured from randomly distributed positions near the designated sampling points along the road centerline. This randomness is particularly evident in complex road environments such as overpasses and underpass tunnels, where captured images may originate from freeway surfaces, beneath elevated segments, or within enclosed tunnel structures. As a result, freeway segments required careful manual screening and classification to ensure road-type accuracy. In the complete dataset comprising 7192 groups of paired panoramic images, road-type statistics for 2017 included 313 tunnel images, 1637 freeway images, 1393 under-freeway images, and 3849 regular road images. By 2022, the distribution had shifted to 317 tunnel images, 1167 freeway images, 1875 under-freeway images, and 3833 regular road images. After implementing a road-type matching and verification process, the final dataset used for analysis included 258 groups of tunnel images, 986 freeway groups, 1191 under-freeway groups, and 3823 regular road groups (Figure 5a).
Figure 5b presents the results of semantic segmentation performed using the FCN model, which effectively categorizes a range of visual components into distinct classes, each represented by a unique color for clear identification. This visual output illustrates the model’s ability to differentiate elements such as vegetation, built features, and surfaces within the streetscape. Building on this, the study conducts a statistical analysis of the variation patterns of nine visual elements—namely, road, fence, plant, tree, understory planting, sidewalk, wall, furniture, and ground—across different road types (Table 3).
In Table 3, the analysis reveals nuanced changes in visual element composition across different road types between 2017 and 2022. In the Freeway section, the mean value of the Road element experienced a marginal decline (0.331704–0.331157), while the Plant element decreased more noticeably (0.003117–0.002450). Conversely, the Fence element showed an upward trend (0.025943–0.029974). Other elements, such as Tree and Understory planting, exhibited varying degrees of fluctuation, collectively reflecting the dynamic adjustment of visual components in this segment. In Under-Freeway sections, the mean value of the Plant element increased (0.032390–0.034237), accompanied by a substantial reduction in the Fence element (0.024559–0.016756) and a marked increase in Tree coverage (0.065359–0.080756). These shifts indicate a clear enhancement in green coverage and vegetation structure in shaded or transitional spaces. In Regular Road areas, the mean value of the Road element declined slightly (0.331109–0.330373), while both Tree (0.176513–0.182190) and Understory planting (0.034815–0.041105) continued to rise, underscoring a growing visual emphasis on green infrastructure. In contrast, the Tunnel segment displayed limited change. Although the Plant element declined significantly (0.001632–0.000788), all other visual components exhibited changes below 5%, suggesting a relatively stable visual composition over time.
Overall, the comparative results from 2017 to 2022 demonstrate divergent patterns of visual element adjustment across road types, reflecting the differentiated strategies and impacts of streetscape renewal efforts in Zhengzhou [46]. Prior to incorporating visual element variables into the RF model, a rigorous data preprocessing step was conducted. Specifically, Min–Max Normalization was applied to standardize the dataset. This method is well-suited for ensuring comparability across heterogeneous, multisource data inputs and is widely adopted in machine learning workflows [47].

4.2. Analytical Description of Subjective Perception Result

In Table 4, the results of the paired-samples t-test indicate that the streetscape renewal program in Zhengzhou had no statistically significant effect on the perceived “beauty” of tunnel segments (t = 0.226, p = 0.821, Cohen’s d = −0.014, 95% CI [−0.660, 0.831]). The effect size was negligible (d < 0.2), and the confidence interval included zero, both of which confirm the absence of any meaningful perceptual change—despite the relatively large sample size (n = 258). This null finding supports the hypothesis that physical transformation of the spatial entity is a necessary condition for altering aesthetic perception [5,46]. In this case, the lack of visual or structural intervention in tunnel areas corresponded to a stable perceptual outcome.
In sharp contrast, all other road types that underwent renewal exhibited statistically significant and practically meaningful improvements in beauty perception (all p < 0.001). Specifically, effect sizes exceeded the threshold for practical significance (Cohen’s d ≥ 0.2) across all categories: freeways (d = 0.261), under-freeway spaces (d = 0.273), and regular roads (d = 0.325). These results affirm that targeted physical interventions were associated with positive shifts in aesthetic perception—an outcome of relevance for evidence-based urban design and policy-making.
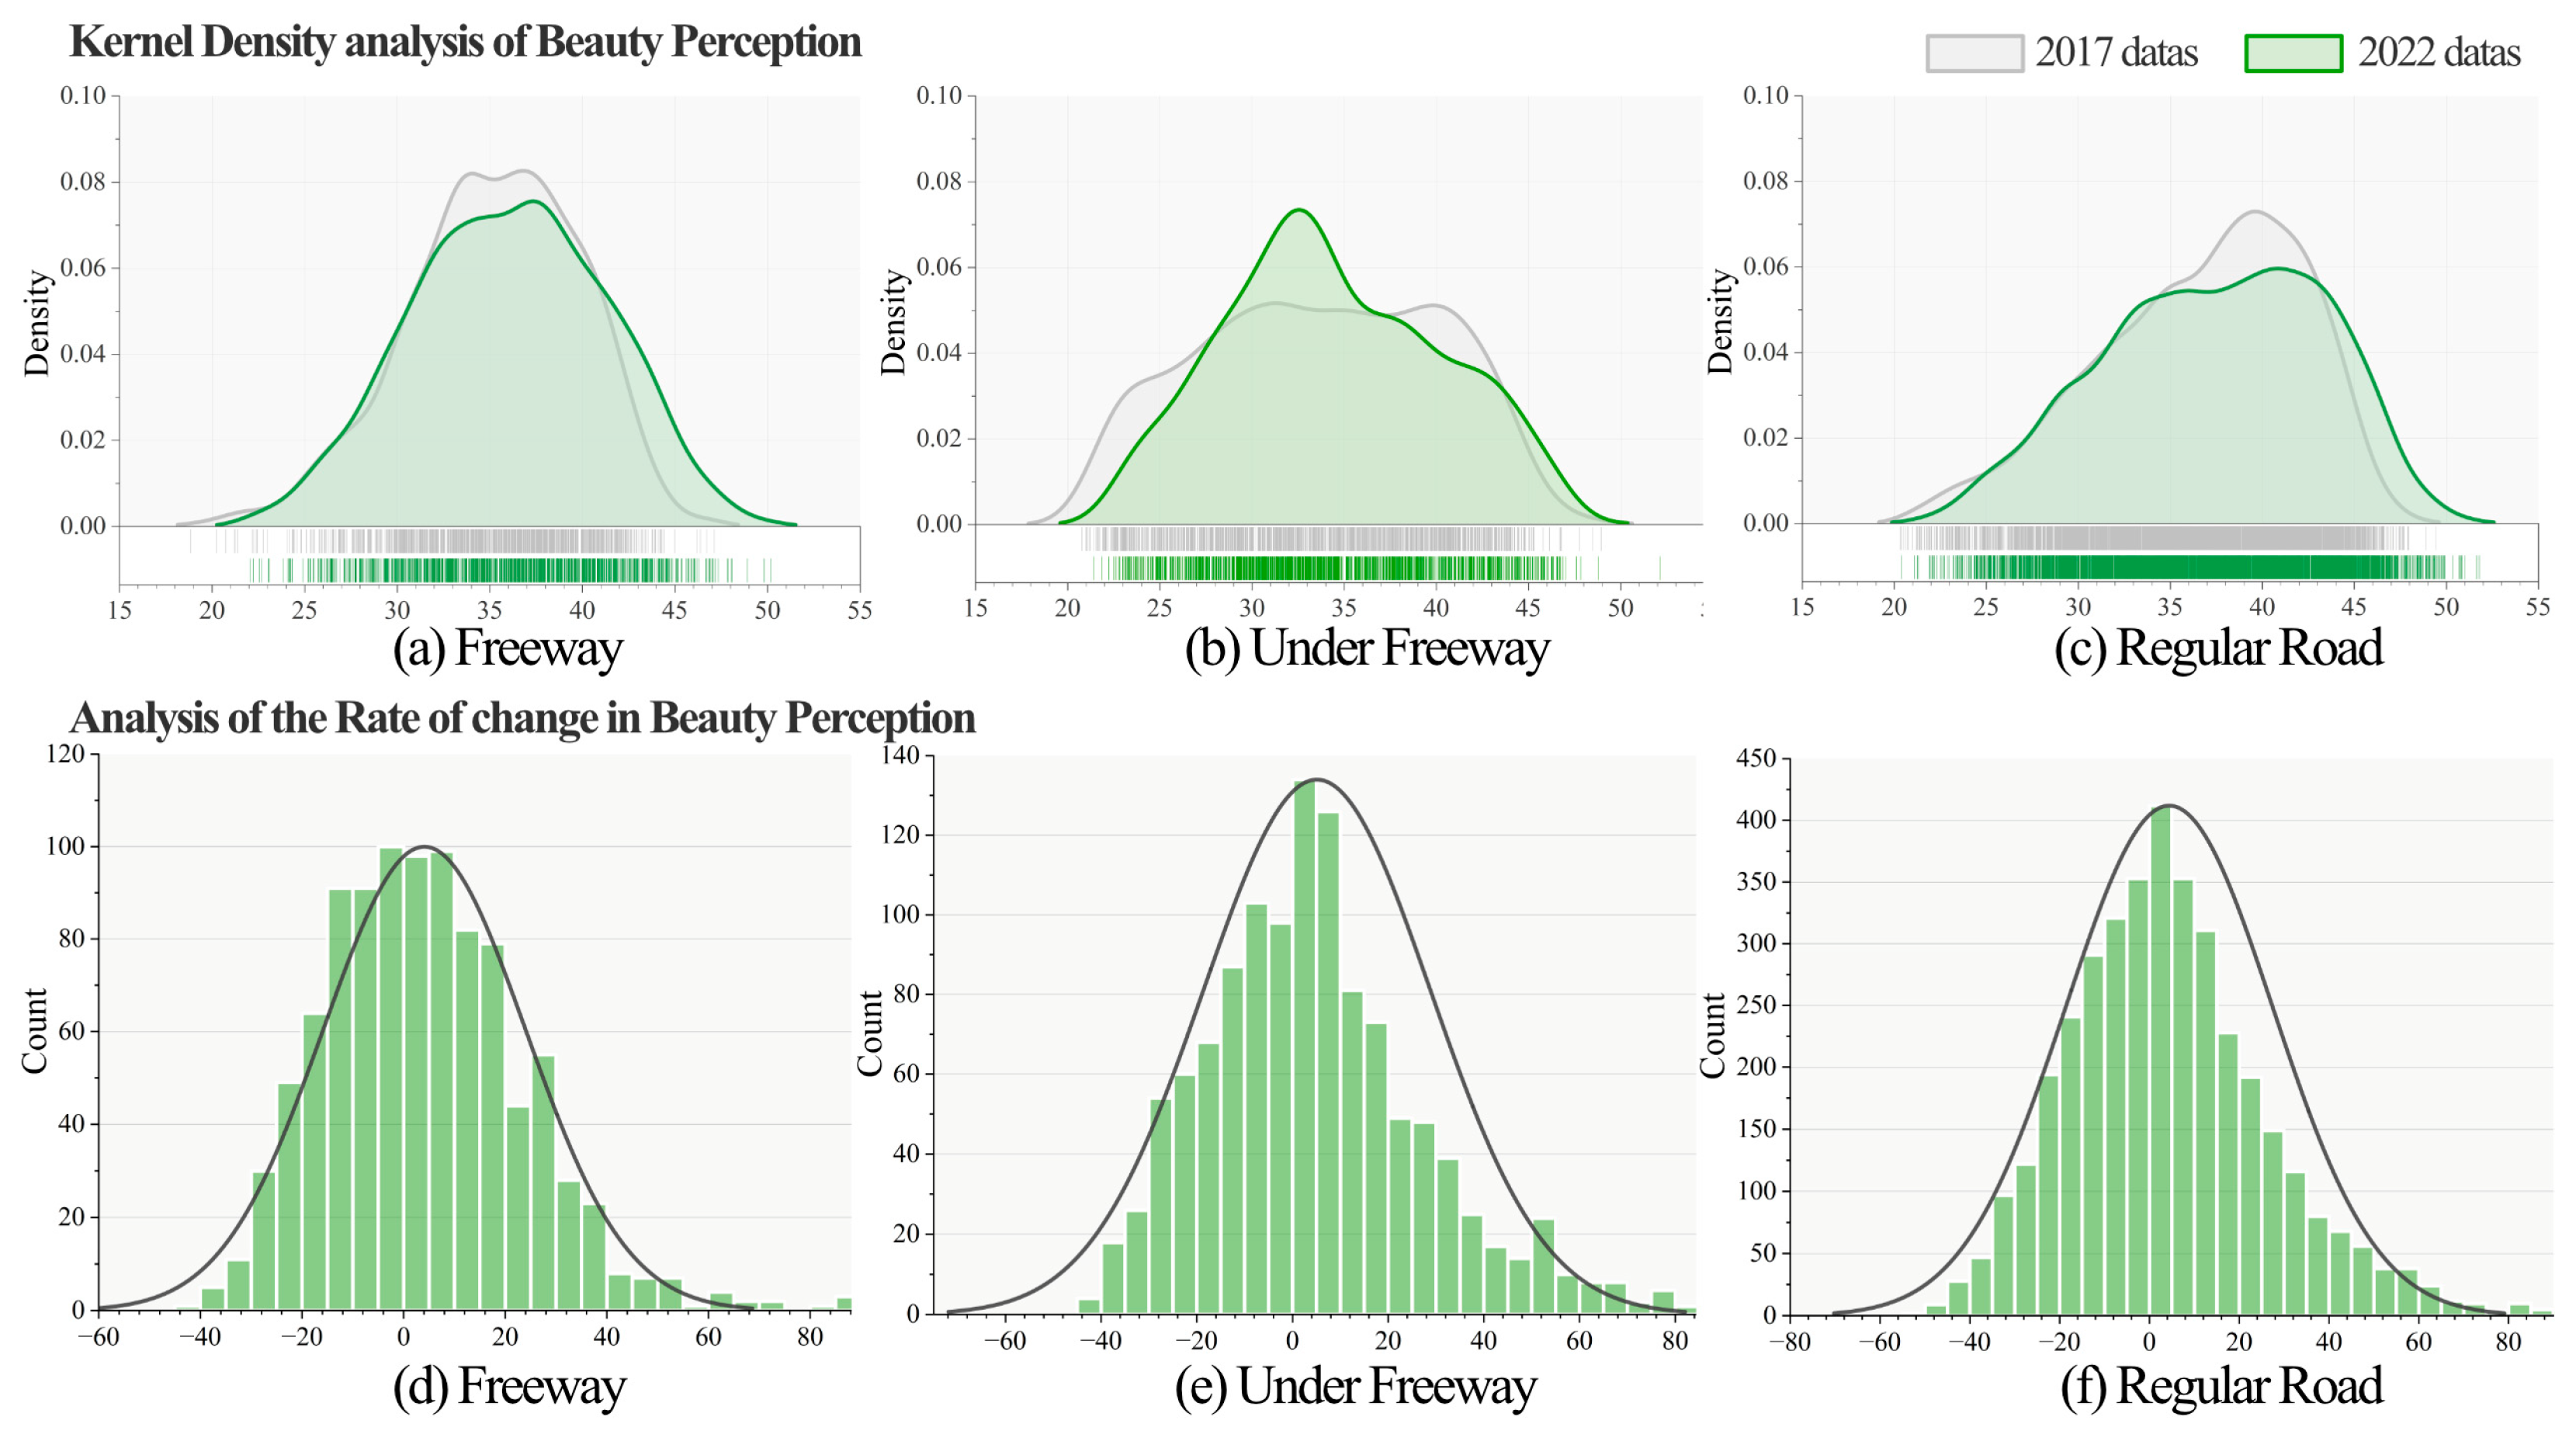
The analysis of beauty perception density curves across different road types reveals substantial differences in distribution patterns between 2017 and 2022 (Figure 6a). For freeway sections, both years exhibited a unimodal, approximately normal distribution. In 2022, the peak value was slightly lower than in 2017; however, the distribution was more concentrated around the mean, with a noticeable extension at the upper end of the value range. This shift indicates an increased likelihood of higher beauty scores. In contrast, the 2017 data were more dispersed, with a broader distribution and fewer samples in the high-value range, suggesting lower overall perceptual quality. For under-freeway sections (Figure 6b), the 2017 density curve displayed a flat and wide profile, indicative of high dispersion and limited clustering. In 2022, the curve became significantly taller and narrower, with values more tightly grouped around the mean. The peak shifted toward a higher score range, and the high-value tail extended further, resulting in a greater probability of high beauty scores. Although the 2017 data covered a wider overall range, the proportion of high-quality values was notably lower compared to 2022, which showed a clear positive trend. A similar pattern was observed in regular road segments (Figure 6c). The 2017 data exhibited a broad, low-density distribution with considerable variability. By 2022, the curve had become taller and more centralized, with the peak shifting toward higher values and the upper tail extending, indicating improved perceptual outcomes. While the earlier data showed greater value dispersion, the density of high beauty scores in 2022 was markedly higher. Overall, the 2022 data reflect a reduction in dispersion and a pronounced concentration of scores within higher-value intervals. This observed trend suggests that streetscape renewal efforts yielded significant improvements in the visual quality of urban roads, particularly in areas where targeted interventions were implemented.
Perception data from 2017 and 2022 were used to calculate the growth rates of beauty perception across different road types. In Figure 6d, the growth rate for freeway sections ranged from −60% to 80%, with most values concentrated between −20% and 30%. The right side of the distribution—representing positive growth—showed a significantly higher frequency than the left, indicating that increases in beauty perception were more prevalent and that the overall trend was upward. Figure 6e shows similar results for under-freeway sections, where growth rates also ranged from −60% to 80%, with a primary concentration between −20% and 40%. Once again, right-sided bars dominated the histogram, suggesting that the majority of samples experienced perceptual improvement. Although negative growth existed, instances of increasing beauty perception were more frequent and pronounced, highlighting a clear overall positive trend. In regular road segments (Figure 6f), the growth rate distribution ranged from −80% to 80%, with most observations falling between −20% and 20%. As in the other categories, right-side bars (indicating perceptual gains) significantly outnumbered those on the left, reinforcing the finding that visual improvements were more common than deterioration. The growth pattern here was particularly stable, albeit with slightly narrower concentration around the mean.
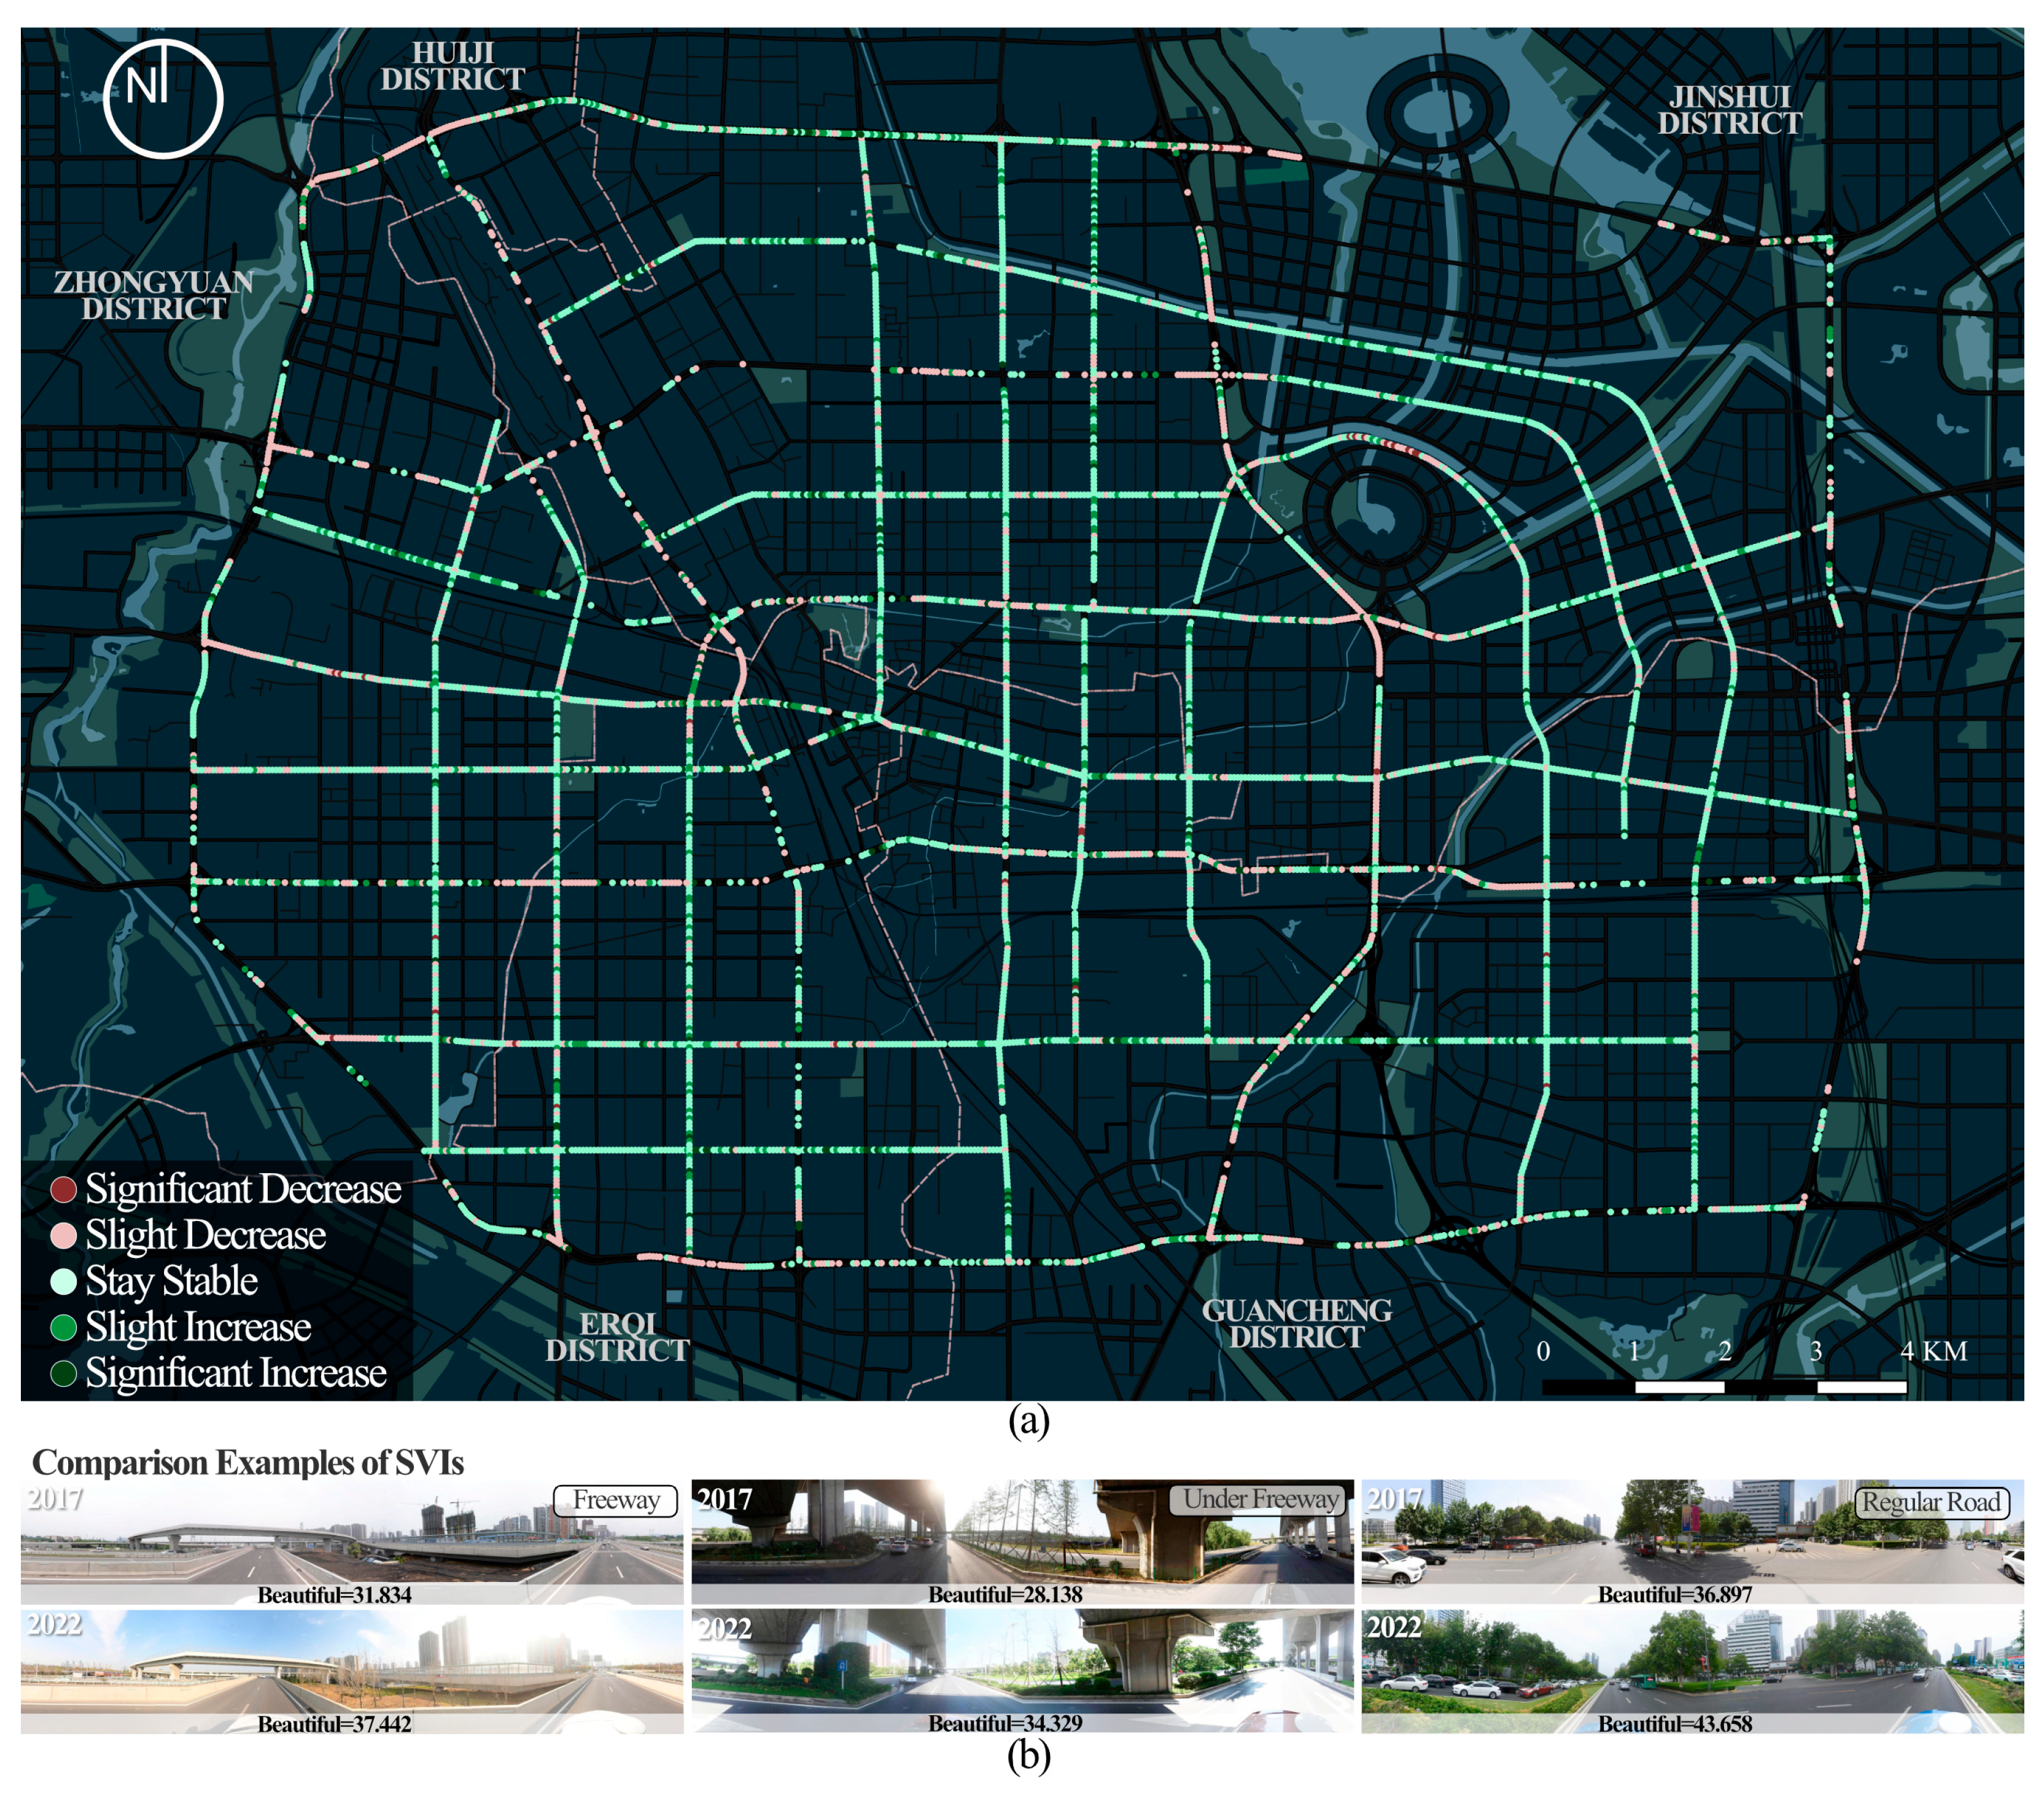
Temporal trends are further visualized in Figure 7a. Regular roads demonstrated a steady and consistent increase in beauty perception over time following the renewal process. In contrast, freeways and under-freeway sections showed greater variability and fluctuation in growth patterns. A detailed case analysis (Figure 7b) further illustrates how different spatial contexts benefited from tailored interventions. For instance, overpasses achieved effective “non-structural beautification” through the addition of surrounding green elements, while under-overpass spaces improved their visual coherence via upgrades to public facilities and vegetation design. Regular roads followed differentiated renewal trajectories: some segments enhanced quality through pavement restructuring, greening, and fence installation; others emphasized safety features, vertical landscaping, or the integration of public amenities. Overall, these findings underscore that both infrastructural and non-infrastructural improvements led to marked enhancements in the perceived aesthetic quality of urban streetscapes. The results affirm the necessity of implementing context-sensitive, road-type-specific renewal strategies to achieve meaningful perceptual gains in varied urban environments [2,48].

4.3. Effects of Street Visual Elements on Beauty Perception

In this study, a series of RF regression models were constructed to explore the relationship between streetscape changes and shifts in beauty perception. The models used the change in visual element indices between 2017 and 2022 as the independent variables (x), and the corresponding change in beauty perception scores as the dependent variable (y). The tunnel category (n = 258) was excluded from modeling, as no statistically significant perceptual changes were observed in this group over the study period (paired t-test, p = 0.821; Table 4). The RF models developed for the three remaining road types—Freeway, Under-Freeway, and Regular Road—exhibited strong and differentiated predictive performance (Table 5), consistent with prior findings on the model’s robustness in high-dimensional perception data analysis [41] (Table 5). The Freeway model demonstrated excellent explanatory power, with an R2 of 0.8291, a Mean Absolute Error (MAE) of 2.0113, and a Root Mean Square Error (RMSE) of 2.6736. The Under-Freeway model explained 76.77% of the variance in perceptual change (R2 = 0.7677), with an MAE of 2.5288 and an RMSE of 3.0000, indicating a slightly higher degree of residual variation but still strong overall performance. The Regular Road model achieved the highest predictive accuracy, with an R2 of 0.8408, an MAE of 2.3428, and an RMSE of 3.0254, highlighting the considerable influence of specific visual element modifications—such as green belt additions and paving improvements—on perceived beauty. Collectively, the three models demonstrate high predictive reliability and model stability across diverse street typologies.
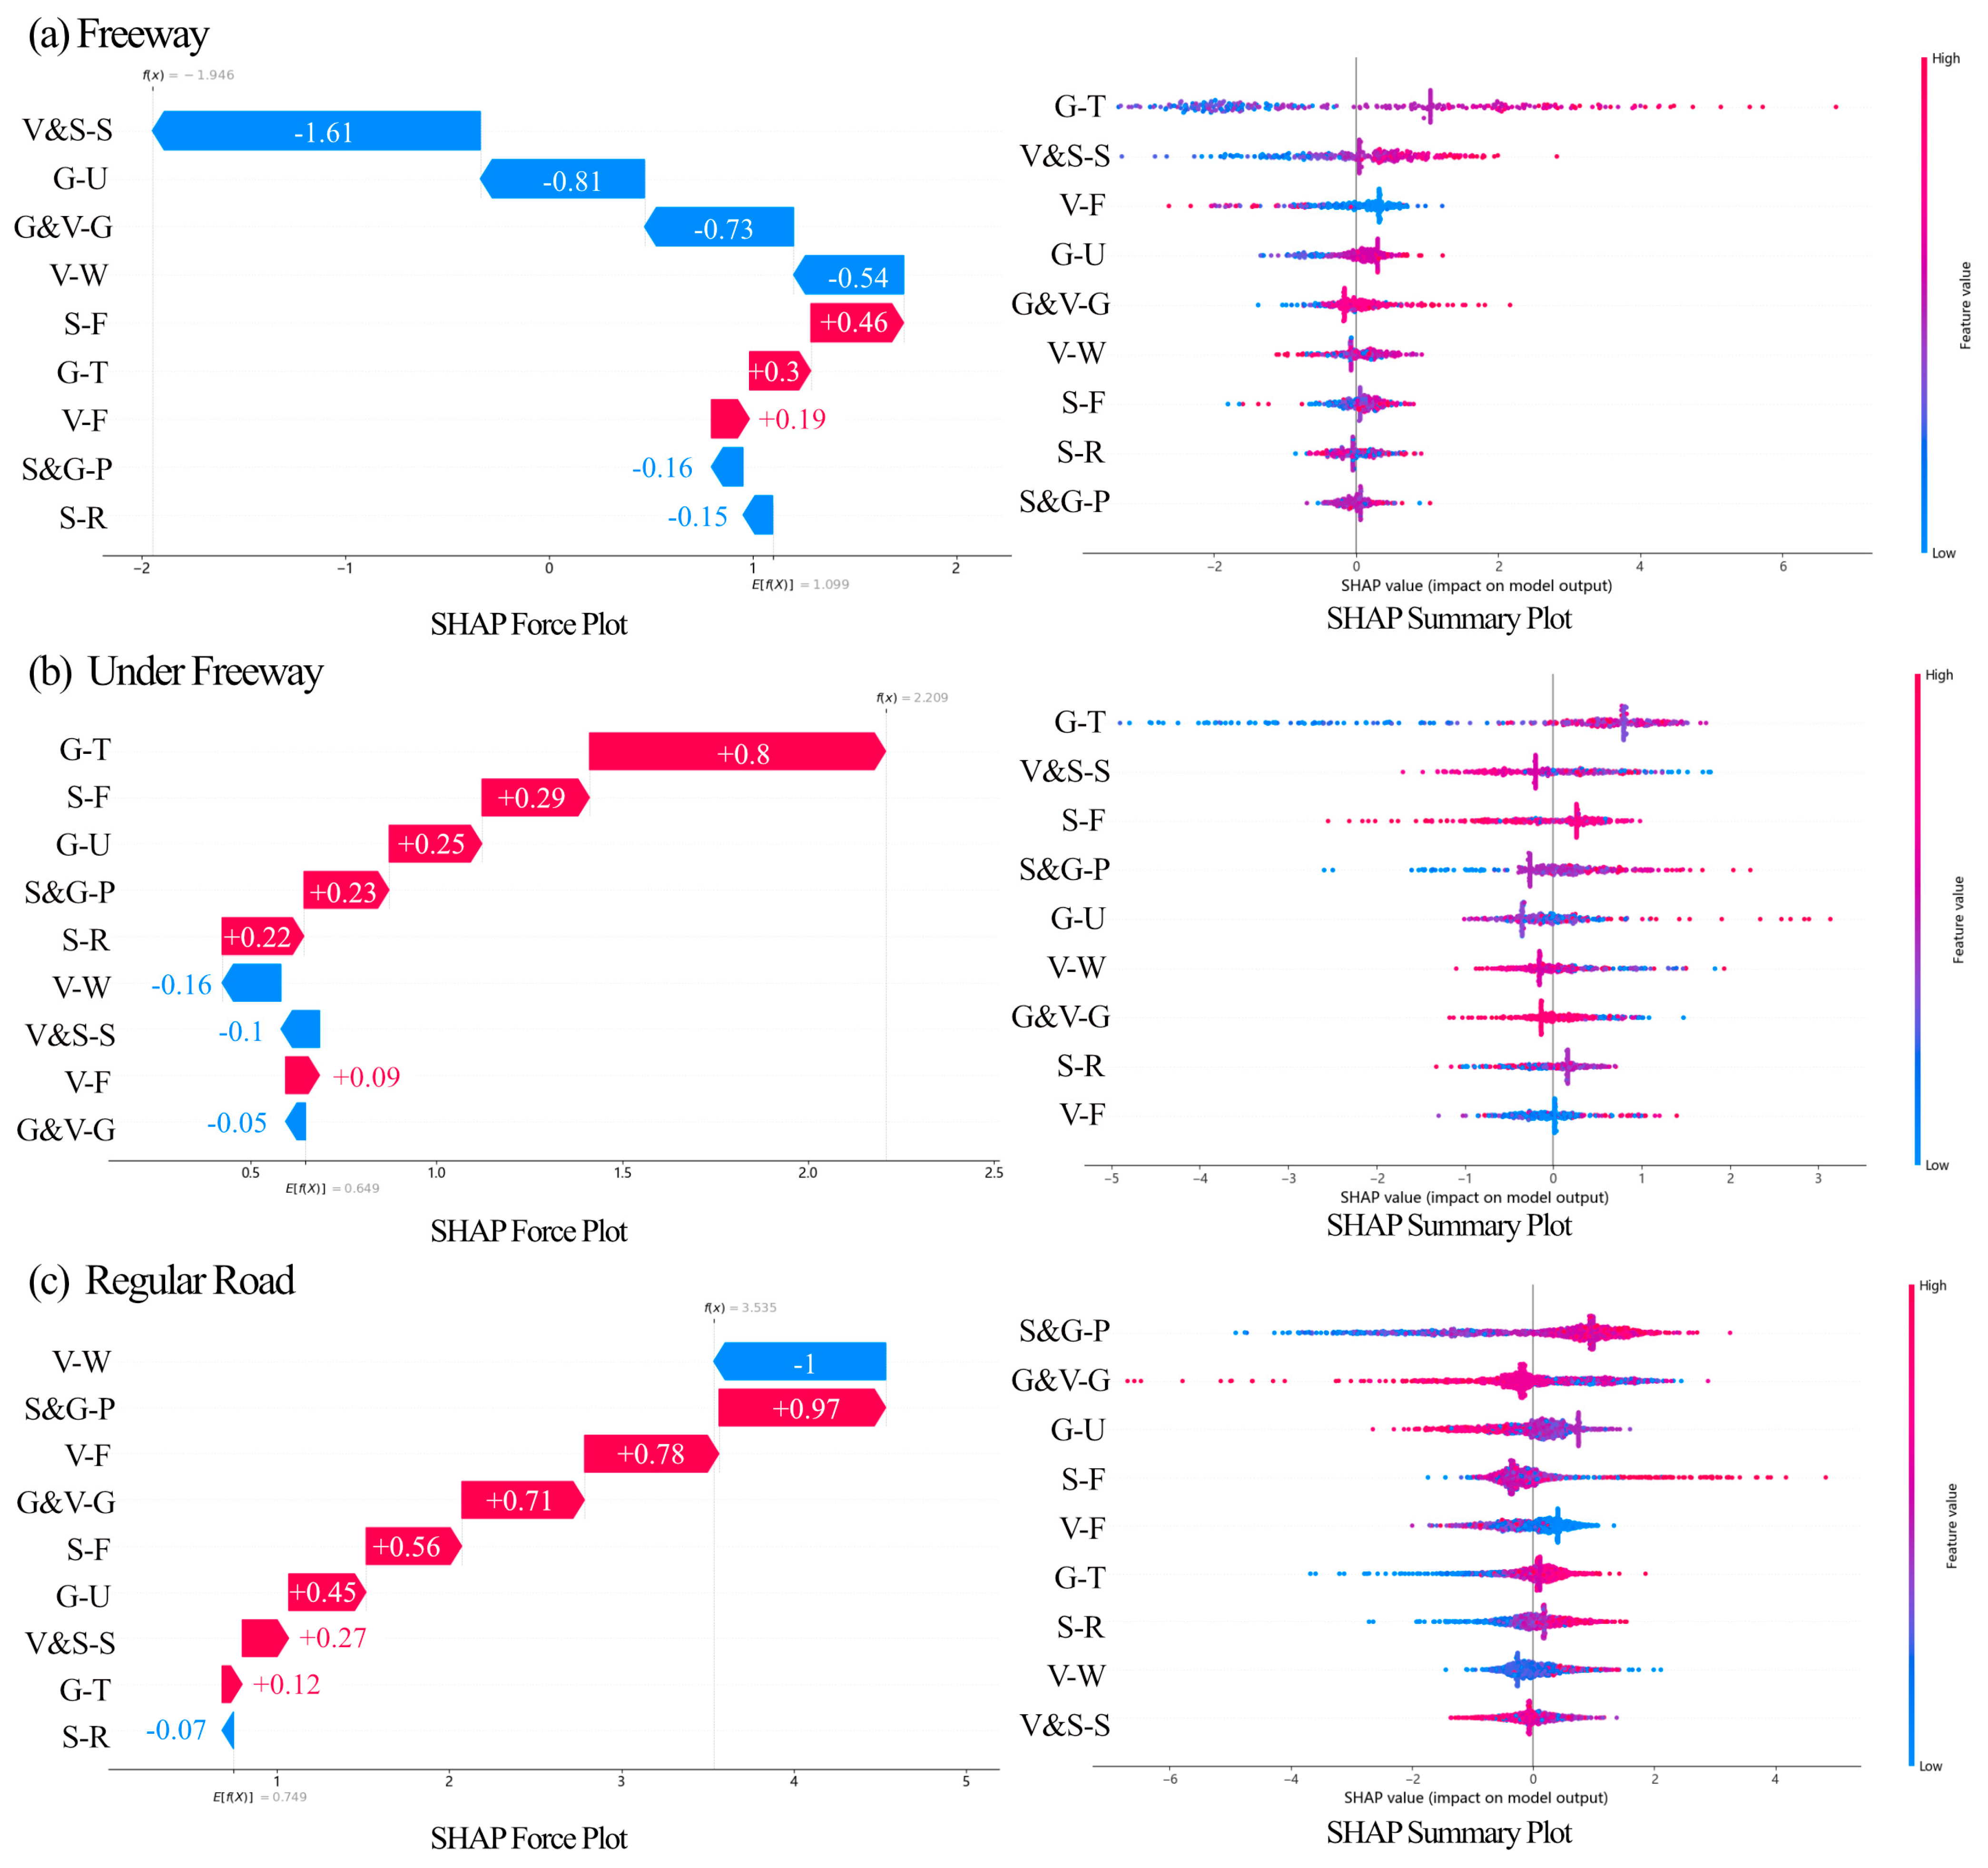
The SHAP analysis reveals that changes in the characteristics of various visual elements exert complex, non-uniform influences on the predicted changes in beauty perception, with effects varying in both direction and magnitude (Table 6). Some features contribute positively to perceptual enhancement, while others are associated with reductions in perceived aesthetic quality. In the SHAP summary plots, feature contributions are color-coded to indicate their directional impact: red denotes a positive contribution to the model output, while blue represents a negative contribution [45,49].
For the Freeway section (Figure 8a), the SHAP force plot indicates that the S-F feature (SHAP = +0.46) is the most influential positive predictor, contributing most substantially to the increase in the model’s predicted beauty perception score. Additional features, such as G-T (SHAP = +0.30) and V-F (SHAP = +0.19), also show positive effects, though with lower intensities. In contrast, V&S-S (SHAP = −1.61) emerges as the strongest negative contributor, exerting a substantial downward effect on the model output. The SHAP summary plot further reveals that high-value samples of G-T, V&S-S, G-U, and G&V-G are predominantly distributed to the right of the SHAP baseline (x = 0) and appear in red, indicating strong positive contributions. In comparison, V-F displays a more complex distribution: low values (blue) contribute negatively, while high values (red) contribute positively—highlighting variability in both direction and magnitude. A comprehensive interpretation suggests that features such as street trees, pavement improvements, understory planting, and public plazas tend to enhance perceived aesthetic quality along freeway corridors.
For the Under-Freeway section (Figure 8b), the most significant positive predictor is G-T (SHAP = +0.80), followed by S-F (SHAP = +0.29) and G-U (SHAP = +0.25), all of which contribute meaningfully to the model output. On the negative side, V-W (SHAP = −0.16) and V&S-S (SHAP = −0.10) exhibit relatively modest adverse effects. The SHAP summary plot shows that high-value samples of features such as G-T, S-F, G-U, and S&G-P are concentrated on the right side of the SHAP axis and marked in red, signifying strong positive influence. In contrast, low-value samples of V&S-S (blue) appear on the left, indicating negative effects at low presence levels. These findings suggest that vegetation elements—especially street trees, fences, and green infrastructure—play a vital role in improving perceived beauty in under-freeway spaces. However, sidewalk elements may exert mild negative effects, possibly due to visual disorder or functional conflict in constrained environments.
For the Regular Road section (Figure 8c), S&G-P (SHAP = +0.97) stands out as the most influential positive factor, followed by V-F (SHAP = +0.78), both contributing significantly to perceptual improvement. Among the negative contributors, V-W (SHAP = −1.00) exerts the strongest negative influence, while S-R (SHAP = −0.07) shows only a minor effect. The SHAP summary plot illustrates that high-value samples of S&G-P, G&V-G, G-U, and S-F are strongly associated with positive outcomes, appearing to the right of the SHAP baseline in red. For V-F, the contribution again varies by value: low-value samples reduce perception scores (blue, left of zero), while high-value samples enhance them (red, right of zero). These patterns indicate that green belts, public plazas, understory planting, and roadside fences positively influence perception in regular street environments, while urban furniture may detract from visual appeal, possibly due to clutter or outdated design.
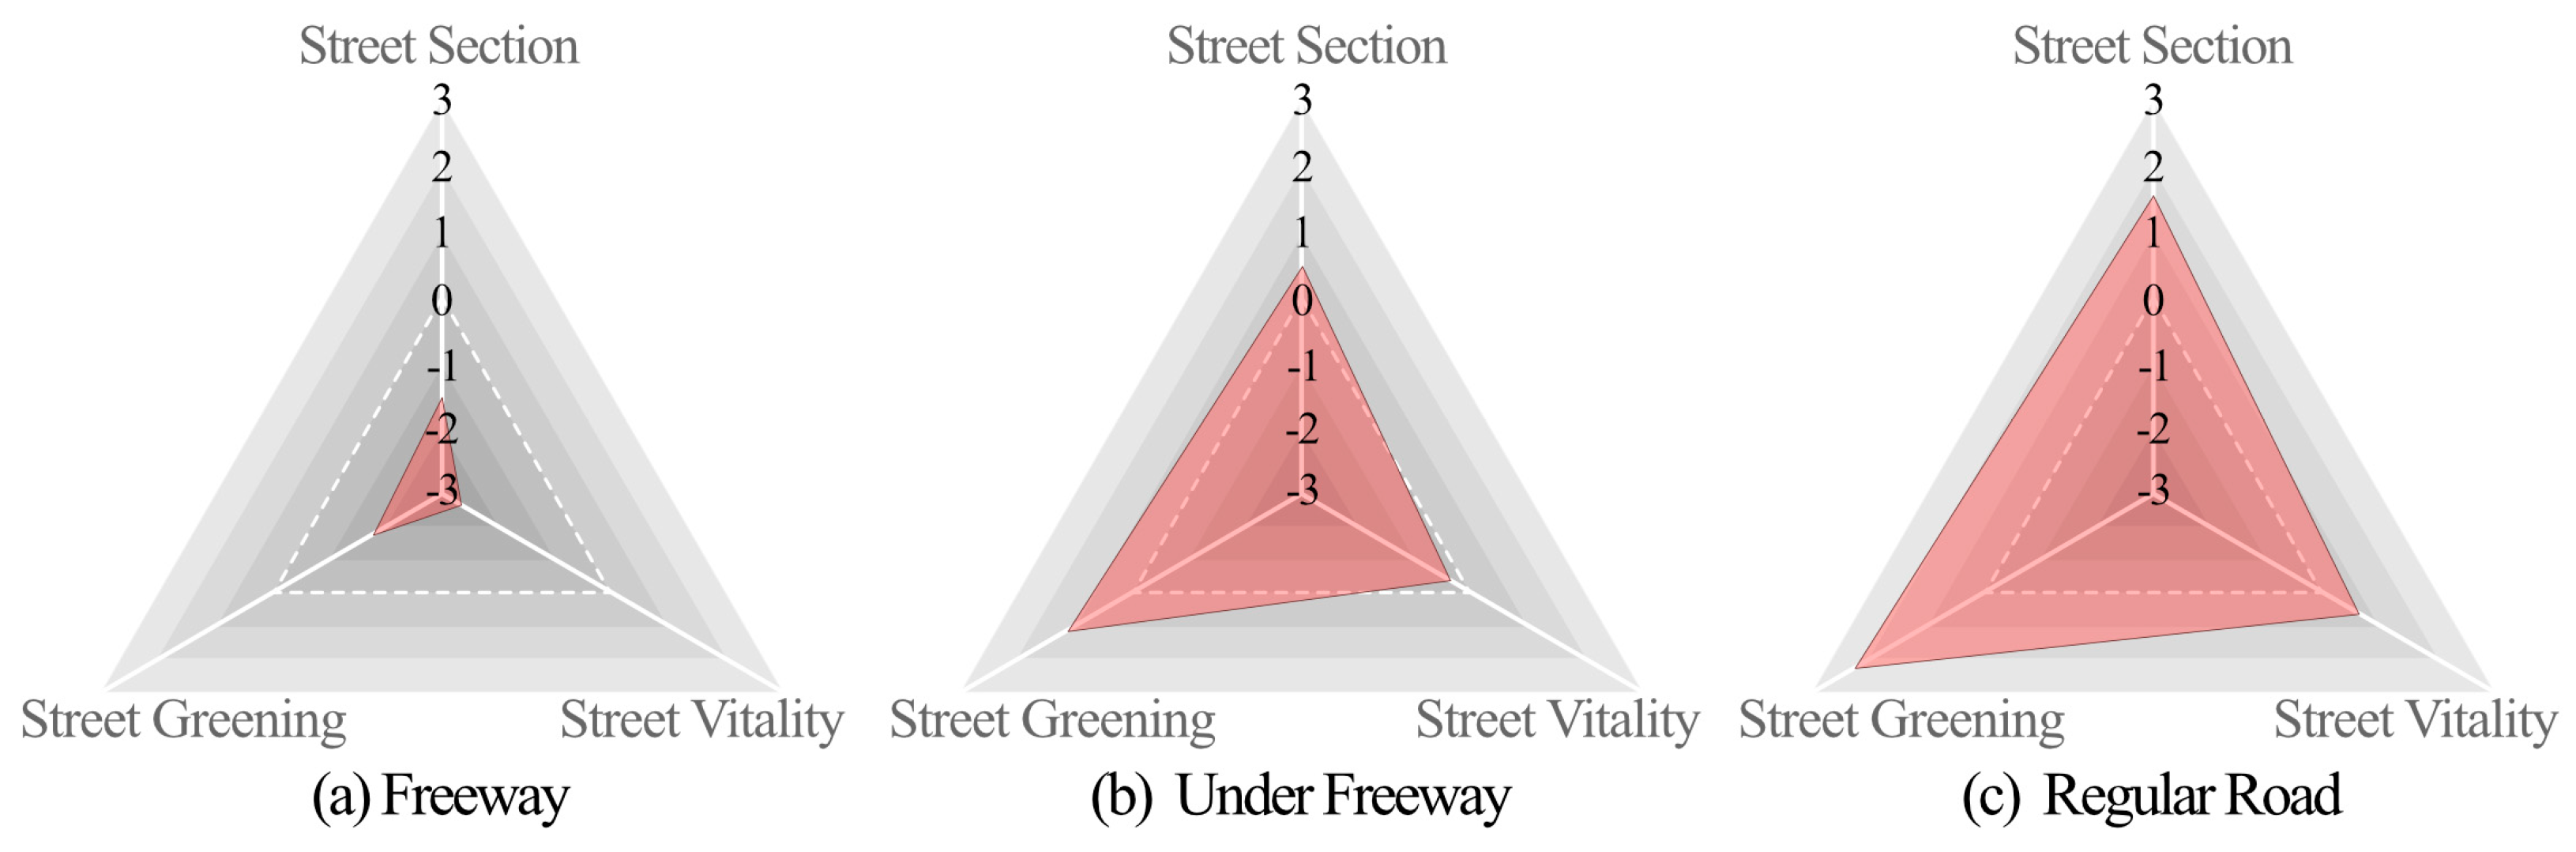
Across all road types, SHAP values enable a nuanced understanding of how individual visual features affect beauty perception—both in terms of direction (positive vs. negative) and intensity. By statistically aggregating SHAP values across the three major renewal categories (Table 7), this study quantifies the relative contribution of each design strategy—including street section, greening, and vitality upgrades—while accounting for variation across distinct road typologies.
In the Freeway segment (Figure 9a), the aggregate SHAP contribution of Street Section features is −1.455, indicating an overall negative impact on aesthetic perception. Street Vitality exhibits the most pronounced negative contribution (−2.695), suggesting that current vitality-related elements—such as signage, lighting, or public furniture—exert a strong inhibitory effect on perceived beauty. Street Greening contributes −1.392, representing the least negative influence among the three categories. These findings imply that, in the absence of large-scale structural reconstruction, aesthetic improvements in freeway corridors may be more effectively achieved through targeted greening strategies—such as optimizing vegetation layout and ensuring clear visibility of green elements. For the Under-Freeway section (Figure 9b), Street Section features yield a moderate positive contribution (0.635), while Street Vitality shows a minor negative effect (−0.225). In contrast, Street Greening demonstrates the strongest positive contribution (1.221), confirming its pivotal role in enhancing aesthetic perception in shaded or spatially constrained environments. These results point to a potential synergistic strategy—by enhancing both greening and spatial configuration—through the addition of green belts and improved plant layering to increase visual coherence and perceived quality. In the context of Regular Roads (Figure 9c), all three feature categories contribute positively to beauty perception. Street Section upgrades show a strong impact (1.726), indicating that recent interventions—such as pavement improvements, curb adjustments, or spatial refinements—have significantly enhanced visual quality. Street Vitality also exerts a meaningful positive effect (0.763), highlighting that active street elements (e.g., public amenities, vertical landscaping, small-scale facilities) positively influence the pedestrian experience. Most notably, Street Greening emerges as the dominant contributor (2.246), providing robust evidence of the substantial role of vegetation in elevating the perceived aesthetics of regular street environments.
In summary, these findings confirm that street greening remains the most effective intervention for enhancing perceived street beauty across all road types [50,51], though its impact varies by spatial context. In Regular Roads, the contribution of street section design is also substantial, supporting the efficacy of conventional geometric and structural upgrades. In contrast, for Freeway and Under-Freeway sections, the effect of section-level renovation is limited—likely due to a mismatch between road design logic and the goals of human-centered urban renewal. Despite its relatively smaller share among visual elements, Street Vitality can still positively influence aesthetic perception in certain contexts, particularly in regular street environments. This suggests that once the internal structure of the roadway reaches a saturation point in terms of perceptual benefit, enhancements to external or peripheral visual elements—such as plantings, furniture design, or surface finishes—may provide additional avenues for visual improvement [52].

5. Discussion

5.1. Contribution of Precise Classification Research to Streetscape Renewal

This study establishes a comprehensive analytical framework that integrates the evolution of visual elements, the quantitative evaluation of subjective perception, and correlation analysis using interpretable machine learning techniques. By incorporating spatiotemporal street view data from Zhengzhou, the framework enables a systematic examination of the relationships between changes in physical design elements and the perception of beauty in the context of urban street renewal. Empirical findings highlight the predominant role of street greening—particularly the presence of street trees and green belts—in enhancing aesthetic perception across different road typologies. Among all feature categories, greening demonstrates the strongest contribution in regular road environments, with a SHAP value of 2.246 (Figure 9c), significantly exceeding that observed in under-freeway spaces (1.221). This result is consistent with existing theoretical perspectives, which suggest that greater vegetation stratification improves visual quality [50,53]. This finding substantiates the argument that the synergistic optimization of vertical vegetation structure and interface permeability can effectively enhance the quality of spatial perception [30]. Simultaneously, it affirms the applicability of the street-view-based greening classification model as a viable analytical tool for guiding stock-oriented urban renewal strategies [29]. Importantly, the results also provide empirical support for the Zhengzhou Street Design Guidelines (2020), which emphasize the creation of “ecological streets” through multi-layered greening interventions. Our SHAP-based analysis confirms that this approach yields substantial improvements in perceived street beauty—particularly in regular road segments, where greening contributes the highest marginal gains. This convergence between policy direction, theoretical perspective, and machine learning interpretation highlights the effectiveness and relevance of evidence-based design strategies in contemporary urban regeneration practices. Collectively, these results offer empirical support for the Biophilic city, where natural elements are not only visible and accessible but embedded as essential components of everyday urban life [54].

5.2. Mechanistic Analysis of Road Type Differential Impacts

The analysis reveals that due to inherent differences in function, spatial scale, and user composition across road typologies, the behavioral pathways through which visual elements influence perceived aesthetics exhibit distinct contextual characteristics. For the Under-Freeway sections, a 40% increase in beauty perception was achieved primarily through greening interventions (Figure 8b). This improvement can be attributed to two key mechanisms: (1) the marginal utility gained from transforming residual or negative spaces, and (2) the visual focusing effect of vegetation in semi-enclosed environments, which enhances spatial legibility and perceptual coherence [7]. This outcome supports the argument that street greening in overlooked urban areas should be recognized as fundamental components of public infrastructure rather than optional discretionary amenity [55]. However, the negative SHAP value associated with sidewalk elements in this segment (SHAP = −0.16) suggests that greening upgrades alone are insufficient; concurrent improvements to infrastructural elements are necessary to avoid perceptual dissonance caused by aging or poorly integrated hardscape features. This highlights the imperative to embed human-scale design principles—particularly perceptual integration and visual continuity—into the maintenance and renewal of urban infrastructural corridors. In Freeway segments, the guardrail element yields a comparatively modest positive SHAP contribution (+0.19), markedly lower than that of greening-related components. This disparity is likely attributable to the limited visual engagement from a pedestrian perspective in high-speed, vehicle-dominated environments, where opportunities for immersive spatial experience are inherently constrained [56]. In the case of Regular Roads, both street vitality elements (SHAP = +0.763) and paved ground improvements (SHAP = +0.97) make substantial positive contributions to perceived aesthetic quality. These findings are in line with established academic viewpoints, namely that the density of street-level activity correlates positively with perceived visual richness [5,46], and that material renewal—independent of greenery—can directly influence visual experience by enhancing textural quality, spatial rhythm, and user engagement [2].

5.3. SHAP-Based Interpretable Modeling for Assessing Streetscape Renewal Outcomes

This study introduces the SHAP technique into the domain of urban renewal assessment, enabling the identification of non-linear and context-dependent effects of visual element modifications on aesthetic perception. For instance, the SHAP value associated with green belt enhancements reaches +0.8 in under-freeway segments, signifying a strong positive impact. However, in regular road environments, the marginal effect of similar greening interventions is considerably reduced. This variation underscores the importance of functional spatial context, suggesting that the effectiveness of visual elements is not static but rather dynamically adjusted in relation to their environmental positioning [49]. Based on these differentiated patterns of contribution, the study proposes a set of tailored renewal strategies. For traffic-oriented corridors, non-structural beautification—such as vertical greening or façade treatments—may offer perceptual enhancement without extensive physical reconstruction [2]. For life-oriented streets, a composite approach integrating greening with rest-oriented infrastructure (e.g., benches, shade elements, or social spaces) is recommended to support both environmental aesthetics and functional use [4]. These insights contribute to the development of evidence-based decision-making frameworks that support fine-grained, typology-specific street renewal.

5.4. Practical Design Guidelines for Different Road Types

Building upon the differentiated mechanisms identified through SHAP analysis, this section translates empirical findings into actionable design guidelines for precision-oriented street renewal across distinct road typologies. For under-freeway spaces—areas that are often visually marginalized—priority should be given to the deployment of continuous green belts to activate residual or negative space. Simultaneously, visual clutter caused by fencing, utility cabinets, or disorganized infrastructure should be minimized. This strategy is empirically supported by the high SHAP contribution of greening in this context (+0.8), indicating its strong potential to elevate aesthetic perception in constrained environments. In regular road segments, a combinatory strategy is recommended: the integration of high-quality paved surfaces with understory planting—such as shrubs, flower beds, or low-height vegetation—can simultaneously enhance material texture and spatial vitality. This approach is substantiated by elevated SHAP values for paved ground (+0.97) and street vitality features (+0.76), confirming their joint effect in reinforcing visual richness and user engagement. For freeway corridors, where pedestrian access is inherently limited, indirect aesthetic improvements are more appropriate. Specifically, the application of vertical greening on noise barriers and the visual upgrading of safety infrastructure—including guardrails and retaining walls—can improve the peripheral visual experience for adjacent residential or institutional zones. Collectively, these differentiated guidelines promote a context-sensitive, perception-informed approach to street renewal. They provide a data-driven foundation for enhancing urban livability and spatial quality in high-density Chinese cities.

5.5. Limitations and Future Work

Despite its contributions, this study is subject to several limitations that warrant consideration and suggest directions for future research. Firstly, the analysis focuses solely on the perceptual dimension of “beauty”, which, while significant, does not fully capture the multidimensional nature of human spatial experience. Future studies are encouraged to construct multi-dimensional perceptual evaluation frameworks, encompassing attributes such as safety, thermal and visual comfort, vitality, and accessibility to enable more comprehensive assessments of streetscape quality [36,57]. Secondly, although this study successfully quantifies the individual contributions of visual elements, it does not account for potential interactions between elements—such as synergistic or offsetting effects among greening, paving, and street furniture. Future research could explore these relationships using SHAP interaction values, which offer the potential to uncover more nuanced mechanisms of perceptual influence. Thirdly, the five-year observation window (2017–2022) may be insufficient to capture long-term effects, particularly those associated with vegetation maturation and landscape establishment cycles. To address this, future studies should consider extending the temporal scope and establishing longitudinal data collection protocols to support continuous monitoring and temporal trend analysis [58]. Fourthly, the data sample is confined to Zhengzhou’s central urban area, which may limit the spatial representativeness of the findings. To enhance external validity and test the generality of the conclusions, future research should include a broader set of cities—across regions, sizes, and typologies—for comparative or cross-sectional studies [13]. Finally, this study does not disaggregate perceptual responses by demographic groups, nor does it address the distinct needs of special user populations such as older adults, children, or individuals with limited mobility. Incorporating user-specific perception data and conducting targeted subgroup analysis represents an important direction for future inquiry, particularly in the context of inclusive and age-friendly urban design [15,24].

6. Conclusions

This study integrates street view big data with interpretable machine learning techniques to quantitatively examine the dynamic relationship between visual elements and subjective perception in the context of Zhengzhou’s street renewal. The results underscore the dominant role of street greening as a driver of aesthetic enhancement, with greening elements achieving a SHAP value of 2.246 in regular road segments—demonstrating the critical influence of vegetation visibility in shaping urban aesthetic perception [50]. The findings also highlight the necessity of implementing typology-specific renewal strategies. In under-freeway environments, targeted greening interventions can substantially improve visual quality. In contrast, regular roads require integrated design approaches that combine greening with vitality-enhancing features such as street furniture and public amenities [46]. The application of SHAP has proven effective in capturing the heterogeneous and non-linear contributions of streetscape elements—particularly features like green belts—thus offering robust technical support for refined, data-driven decision-making [49].
From a theoretical standpoint, this research provides empirical validation for Kevin Lynch’s “Image of the City” theory in the era of big data, reaffirming that the interaction between physical form and subjective perception remains central to urban spatial quality [19]. The strong contributions of greening (SHAP = 2.246) and vitality facilities (SHAP = 0.763) in regular road contexts offer quantitative evidence for the “human-oriented street” design paradigm [3,5], reinforcing the foundational role of greenery in fostering positive urban experience.
In practical applications, these findings are highly relevant in the context of China’s ongoing shift from incremental urban expansion to stock-oriented urban renewal [1]. It is recommended that urban planners develop functionally classified renewal guidelines based on road typology, leverage machine learning and street view data to pre-assess design outcomes, and allocate resources with greater precision. By aligning urban transformation with a people-centered renewal philosophy, cities can achieve more sustainable, inclusive, and perceptually engaging public spaces.

Author Contributions

Conceptualization: W.L.; Methodology: W.L. and L.Z.; Software: Y.L. and J.G.; Validation: L.Z. and J.G.; Formal Analysis: W.L. and Y.L.; Investigation: L.Z. and S.X.; Data Curation: W.L. and Y.L.; Writing—Original Draft: W.L.; Writing—Review & Editing: Y.F. and S.X.; Visualization: Y.L.; Supervision: Y.F. All authors have read and agreed to the published version of the manuscript.

Funding

This research did not receive any specific grant from funding agencies in the public, commercial, or not-for-profit sectors.

Institutional Review Board Statement

Street view imagery used in this study was obtained via Baidu Maps’ publicly available API (https://lbsyun.baidu.com (accessed on 28 October 2024)), collected at predefined sampling points. All efforts were made to avoid the capture of personally identifiable information (e.g., faces, license plates). Perception scores (i.e., beauty ratings) were derived from the MIT Place Pulse 2.0 dataset, which has received prior ethical approval for crowdsourced annotations [26]. As no direct human subjects were involved in this study, additional ethical review was not required.

Data Availability Statement

The processed datasets generated during this study, including segmented visual element indices, perception scores, and SHAP values, are available in the Zenodo repository: [10.5281/zenodo.15747784]. It is not possible to share raw Baidu Street View images publicly due to restrictions imposed by the API. However, they can be re-crawled in accordance with the methodology outlined in Section 2.2. Code for FCN segmentation, RF regression, and SHAP analysis is accessible at: [https://github.com/LevonLEE-1989/Streetscape-FCN.git; https://github.com/LevonLEE-1989/Streetscape-RF-SHAP.git (accessed on 26 June 2025)].

Acknowledgments

The authors gratefully acknowledge Baidu Maps [v2.0] for providing the Street View API service. We also extend our appreciation to the open-source community for sharing code and datasets that contributed to this study. Special thanks are owed to colleagues at Henan Agricultural University for their valuable support in data preprocessing and technical validation.

Conflicts of Interest

The authors declare no competing financial or non-financial interests that could have influenced the outcome of this research.

Correction Statement

This article has been republished with a minor correction to the correspondence contact information. This change does not affect the scientific content of the article.

References

  1. Wang, L.; Han, X.; He, J.; Jung, T. Measuring Residents’ Perceptions of City Streets to Inform Better Street Planning through Deep Learning and Space Syntax. ISPRS J. Photogramm. Remote Sens. 2022, 190, 215–230. [Google Scholar] [CrossRef] [Scilit]
  2. Istrate, A.-L.; Chen, F. Liveable Streets in Shanghai: Definition, Characteristics and Design. Prog. Plan. 2022, 158, 100544. [Google Scholar] [CrossRef] [Scilit]
  3. Bertolini, L. From “Streets for Traffic” to “Streets for People”: Can Street Experiments Transform Urban Mobility? Transp. Rev. 2020, 40, 734–753. [Google Scholar] [CrossRef] [Scilit]
  4. Angel, A.; Cohen, A.; Nelson, T.; Plaut, P. Evaluating the Relationship between Walking and Street Characteristics Based on Big Data and Machine Learning Analysis. Cities 2024, 151, 105111. [Google Scholar] [CrossRef] [Scilit]
  5. Carmona, M.; Gabrieli, T.; Hickman, R.; Laopoulou, T.; Livingstone, N. Street Appeal: The Value of Street Improvements. Prog. Plan. 2018, 126, 1–51. [Google Scholar] [CrossRef] [Scilit]
  6. Biljecki, F. Street View Imagery in Urban Analytics and GIS: A Review. Landsc. Urban Plan. 2021, 215, 104217. [Google Scholar] [CrossRef] [Scilit]
  7. Li, X.; Ratti, C.; Seiferling, I. Mapping Urban Landscapes along Streets Using Google Street View. In Proceedings of the Advances in Cartography and Giscience; Peterson, M.P., Ed.; Springer International Publishing: Cham, Switzerland, 2017; pp. 341–356. [Google Scholar]
  8. Lu, Y. Assessing Urban Greenery by Harvesting Street View Data: A Review. Urban For. Urban Green. 2023, 83, 127917. [Google Scholar] [CrossRef] [Scilit]
  9. Anguelov, D.; Dulong, C.; Filip, D.; Frueh, C.; Lafon, S.; Lyon, R.; Ogale, A.; Vincent, L.; Weaver, J. Google Street View: Capturing the World at Street Level. Computer 2010, 43, 32–38. [Google Scholar] [CrossRef] [Scilit]
  10. Badrinarayanan, V.; Kendall, A.; Cipolla, R. SegNet: A Deep Convolutional Encoder-Decoder Architecture for Image Segmentation. IEEE Trans. Pattern Anal. Mach. Intell. 2017, 39, 2481–2495. [Google Scholar] [CrossRef] [Scilit]
  11. Yao, Y.; Liang, Z.; Yuan, Z.; Liu, P.; Bie, Y.; Zhang, J.; Wang, R.; Wang, J.; Guan, Q. A Human-Machine Adversarial Scoring Framework for Urban Perception Assessment Using Street-View Images. Int. J. Geogr. Inf. Sci. 2019, 33, 2363–2384. [Google Scholar] [CrossRef] [Scilit]
  12. Szcześniak, J.T.; Ang, Y.Q.; Letellier-Duchesne, S.; Reinhart, C.F. A Method for Using Street View Imagery to Auto-Extract Window-to-Wall Ratios and Its Relevance for Urban-Level Daylighting and Energy Simulations. Build. Environ. 2022, 207, 108108. [Google Scholar] [CrossRef] [Scilit]
  13. Biljecki, F. Sensitivity of Measuring the Urban Form and Greenery Using Street-Level Imagery: A Comparative Study of Approaches and Visual Perspectives. Int. J. Appl. Earth Obs. Geoinf. 2023, 122, 103385. [Google Scholar] [CrossRef] [Scilit]
  14. Li, T.; Zheng, X.; Wu, J.; Zhang, Y.; Fu, X.; Deng, H. Spatial Relationship between Green View Index and Normalized Differential Vegetation Index within the Sixth Ring Road of Beijing. Urban For. Urban Green. 2021, 62, 127153. [Google Scholar] [CrossRef] [Scilit]
  15. Chen, Y. A Study on Street Walkability for Older Adults with Different Mobility Abilities Combining Street View Image Recognition and Deep Learning—The Case of Chengxianjie Community in Nanjing (China). Comput. Environ. Urban Syst. 2024, 112, 102151. [Google Scholar] [CrossRef] [Scilit]
  16. Chen, M.; Cai, Y.; Guo, S.; Sun, R.; Song, Y.; Shen, X. Evaluating Implied Urban Nature Vitality in San Francisco: An Interdisciplinary Approach Combining Census Data, Street View Images, and Social Media Analysis. Urban For. Urban Green. 2024, 95, 128289. [Google Scholar] [CrossRef] [Scilit]
  17. Wen, D.; Liu, M.; Yu, Z. Quantifying Ecological Landscape Quality of Urban Street by Open Street View Images: A Case Study of Xiamen Island, China. Remote Sens. 2022, 14, 3360. [Google Scholar] [CrossRef] [Scilit]
  18. Xu, J.; Xiong, Q.; Jing, Y.; Xing, L.; An, R.; Tong, Z.; Liu, Y.; Liu, Y. Understanding the Nonlinear Effects of the Street Canyon Characteristics on Human Perceptions with Street View Images. Ecol. Indic. 2023, 154, 110756. [Google Scholar] [CrossRef] [Scilit]
  19. Lynch, K. The Image of the City; MIT Press: Cambridge, MA, USA, 1964; ISBN 978-0-262-62001-7. [Google Scholar]
  20. Chen, C.; Li, H.; Luo, W.; Xie, J.; Yao, J.; Wu, L.; Xia, Y. Predicting the Effect of Street Environment on Residents’ Mood States in Large Urban Areas Using Machine Learning and Street View Images. Sci. Total Environ. 2022, 816, 151605. [Google Scholar] [CrossRef] [Scilit]
  21. Kruse, J.; Kang, Y.; Liu, Y.-N.; Zhang, F.; Gao, S. Places for Play: Understanding Human Perception of Playability in Cities Using Street View Images and Deep Learning. Comput. Environ. Urban Syst. 2021, 90, 101693. [Google Scholar] [CrossRef] [Scilit]
  22. Bernetti, I.; Alampi Sottini, V.; Bambi, L.; Barbierato, E.; Borghini, T.; Capecchi, I.; Saragosa, C. Urban Niche Assessment: An Approach Integrating Social Media Analysis, Spatial Urban Indicators and Geo-Statistical Techniques. Sustainability 2020, 12, 3982. [Google Scholar] [CrossRef] [Scilit]
  23. Liu, D.; Wang, R.; Grekousis, G.; Liu, Y.; Lu, Y. Detecting Older Pedestrians and Aging-Friendly Walkability Using Computer Vision Technology and Street View Imagery. Comput. Environ. Urban Syst. 2023, 105, 102027. [Google Scholar] [CrossRef] [Scilit]
  24. Yang, Y.; Wang, Q.; Wu, D.; Hang, T.; Ding, H.; Wu, Y.; Liu, Q. Constructing Child-Friendly Cities: Comprehensive Evaluation of Street-Level Child-Friendliness Using the Method of Empathy-Based Stories, Street View Images, and Deep Learning. Cities 2024, 154, 105385. [Google Scholar] [CrossRef] [Scilit]
  25. Hu, Y.; Qian, F.; Yan, H.; Middel, A.; Wu, R.; Zhu, M.; Han, Q.; Zhao, K.; Wang, H.; Shao, F.; et al. Which Street Is Hotter? Street Morphology May Hold Clues -Thermal Environment Mapping Based on Street View Imagery. Build. Environ. 2024, 262, 111838. [Google Scholar] [CrossRef] [Scilit]
  26. Zhang, F.; Zhou, B.; Liu, L.; Liu, Y.; Fung, H.H.; Lin, H.; Ratti, C. Measuring Human Perceptions of a Large-Scale Urban Region Using Machine Learning. Landsc. Urban Plan. 2018, 180, 148–160. [Google Scholar] [CrossRef] [Scilit]
  27. Liu, C.; Yu, Y.; Yang, X. Perceptual Evaluation of Street Quality in Underdeveloped Ethnic Areas: A Random Forest Method Combined with Human–Machine Confrontation Framework Provides Insights for Improved Urban Planning—A Case Study of Lhasa City. Buildings 2024, 14, 1698. [Google Scholar] [CrossRef] [Scilit]
  28. Ma, Z. Deep Exploration of Street View Features for Identifying Urban Vitality: A Case Study of Qingdao City. Int. J. Appl. Earth Obs. Geoinf. 2023, 123, 103476. [Google Scholar] [CrossRef] [Scilit]
  29. Sun, Y.; Wang, X.; Zhu, J.; Chen, L.; Jia, Y.; Lawrence, J.M.; Jiang, L.; Xie, X.; Wu, J. Using Machine Learning to Examine Street Green Space Types at a High Spatial Resolution: Application in Los Angeles County on Socioeconomic Disparities in Exposure. Sci. Total Environ. 2021, 787, 147653. [Google Scholar] [CrossRef] [Scilit]
  30. Zhu, H.; Nan, X.; Yang, F.; Bao, Z. Utilizing the Green View Index to Improve the Urban Street Greenery Index System: A Statistical Study Using Road Patterns and Vegetation Structures as Entry Points. Landsc. Urban Plan. 2023, 237, 104780. [Google Scholar] [CrossRef] [Scilit]
  31. Gao, Y.; Zhao, J.; Han, L. Quantifying the Nonlinear Relationship between Block Morphology and the Surrounding Thermal Environment Using Random Forest Method. Sustain. Cities Soc. 2023, 91, 104443. [Google Scholar] [CrossRef] [Scilit]
  32. Kellert, S.R.; Heerwagen, J.; Mador, M. Biophilic Design: The Theory, Science and Practice of Bringing Buildings to Life; John Wiley & Sons: Hoboken, NJ, USA, 2011; ISBN 1-118-17424-0. [Google Scholar]
  33. Alsukkar, M.; Ibrahim, A.; Eltaweel, A. Multi-Objective Optimization of Daylighting Systems for Energy Efficiency and Thermal-Visual Comfort in Buildings: A Review. Build. Environ. 2026, 288, 113921. [Google Scholar] [CrossRef] [Scilit]
  34. Zhou, B.; Zhao, H.; Puig, X.; Xiao, T.; Fidler, S.; Barriuso, A.; Torralba, A. Semantic Understanding of Scenes through the ADE20K Dataset. Int. J. Comput. Vis. 2019, 127, 302–321. [Google Scholar] [CrossRef] [Scilit]
  35. Zhou, B.; Zhao, H.; Puig, X.; Fidler, S.; Barriuso, A.; Torralba, A. Scene Parsing Through ADE20K Dataset. In Proceedings of the IEEE Conference on Computer Vision and Pattern Recognition; IEEE: New York, NY, USA, 2017; pp. 633–641. [Google Scholar]
  36. Wei, J. Mapping Human Perception of Urban Landscape from Street-View Images: A Deep-Learning Approach. Int. J. Appl. Earth Obs. Geoinf. 2022, 112, 102886. [Google Scholar] [CrossRef] [Scilit]
  37. Min, W.; Mei, S.; Liu, L.; Wang, Y.; Jiang, S. Multi-Task Deep Relative Attribute Learning for Visual Urban Perception. IEEE Trans. Image Process. 2020, 29, 657–669. [Google Scholar] [CrossRef] [Scilit] [PubMed]
  38. Zhang, F.; Zhang, D.; Liu, Y.; Lin, H. Representing Place Locales Using Scene Elements. Comput. Environ. Urban Syst. 2018, 71, 153–164. [Google Scholar] [CrossRef] [Scilit]
  39. Salesses, P.; Schechtner, K.; Hidalgo, C.A. The Collaborative Image of the City: Mapping the Inequality of Urban Perception. PLoS ONE 2013, 8, e68400. [Google Scholar] [CrossRef] [Scilit]
  40. Joye, Y. Architectural Lessons from Environmental Psychology: The Case of Biophilic Architecture. Rev. Gen. Psychol. 2007, 11, 305–328. [Google Scholar] [CrossRef] [Scilit]
  41. Breiman, L. Random Forests. Mach. Learn. 2001, 45, 5–32. [Google Scholar] [CrossRef] [Scilit]
  42. Wu, B.; Yu, B.; Shu, S.; Liang, H.; Zhao, Y.; Wu, J. Mapping Fine-Scale Visual Quality Distribution inside Urban Streets Using Mobile LiDAR Data. Build. Environ. 2021, 206, 108323. [Google Scholar] [CrossRef] [Scilit]
  43. Wojtuch, A.; Jankowski, R.; Podlewska, S. How Can SHAP Values Help to Shape Metabolic Stability of Chemical Compounds? J. Cheminform. 2021, 13, 74. [Google Scholar] [CrossRef] [Scilit]
  44. Barredo Arrieta, A.; Díaz-Rodríguez, N.; Del Ser, J.; Bennetot, A.; Tabik, S.; Barbado, A.; Garcia, S.; Gil-Lopez, S.; Molina, D.; Benjamins, R.; et al. Explainable Artificial Intelligence (XAI): Concepts, Taxonomies, Opportunities and Challenges toward Responsible AI. Inf. Fusion 2020, 58, 82–115. [Google Scholar] [CrossRef] [Scilit]
  45. Iban, M.C. An Explainable Model for the Mass Appraisal of Residences: The Application of Tree-Based Machine Learning Algorithms and Interpretation of Value Determinants. Habitat Int. 2022, 128, 102660. [Google Scholar] [CrossRef] [Scilit]
  46. Tao, Y.; Wang, Y.; Wang, X.; Tian, G.; Zhang, S. Measuring the Correlation between Human Activity Density and Streetscape Perceptions: An Analysis Based on Baidu Street View Images in Zhengzhou, China. Land 2022, 11, 400. [Google Scholar] [CrossRef] [Scilit]
  47. Patro, S.G.K.; Sahu, K.K. Normalization: A Preprocessing Stage. arXiv 2015, arXiv:1503.06462. [Google Scholar] [CrossRef] [Scilit]
  48. Ma, X.; Ma, C.; Wu, C.; Xi, Y.; Yang, R.; Peng, N.; Zhang, C.; Ren, F. Measuring Human Perceptions of Streetscapes to Better Inform Urban Renewal: A Perspective of Scene Semantic Parsing. Cities 2021, 110, 103086. [Google Scholar] [CrossRef] [Scilit]
  49. Lundberg, S.M.; Lee, S.-I. A Unified Approach to Interpreting Model Predictions. In Proceedings of the Advances in Neural Information Processing Systems; Curran Associates, Inc.: Nice, France, 2017; Volume 30. [Google Scholar]
  50. Helbich, M.; Yao, Y.; Liu, Y.; Zhang, J.; Liu, P.; Wang, R. Using Deep Learning to Examine Street View Green and Blue Spaces and Their Associations with Geriatric Depression in Beijing, China. Environ. Int. 2019, 126, 107–117. [Google Scholar] [CrossRef] [Scilit]
  51. Wang, R.; Feng, Z.; Pearce, J.; Liu, Y.; Dong, G. Are Greenspace Quantity and Quality Associated with Mental Health through Different Mechanisms in Guangzhou, China: A Comparison Study Using Street View Data. Environ. Pollut. 2021, 290, 117976. [Google Scholar] [CrossRef] [Scilit]
  52. Zhu, J. Disentangling the Effects of the Surrounding Environment on Street-Side Greenery: Evidence from Hangzhou. Ecol. Indic. 2022, 143, 109153. [Google Scholar] [CrossRef] [Scilit]
  53. Chen, J.; Zhou, C.; Li, F. Quantifying the Green View Indicator for Assessing Urban Greening Quality: An Analysis Based on Internet-Crawling Street View Data. Ecol. Indic. 2020, 113, 106192. [Google Scholar] [CrossRef] [Scilit]
  54. Beatley, T. Biophilic Cities: Integrating Nature into Urban Design and Planning; Island Press: Washington, DC, USA, 2011; ISBN 1-59726-715-5. [Google Scholar]
  55. Greening Up—Create Streets. Available online: https://www.createstreets.com/greeningup/?spm=5176.28103460.0.0.1ce57d83gh3oVA (accessed on 29 January 2026).
  56. Cai, Q.; Abdel-Aty, M.; Zheng, O.; Wu, Y. Applying Machine Learning and Google Street View to Explore Effects of Drivers’ Visual Environment on Traffic Safety. Transp. Res. Part C Emerg. Technol. 2022, 135, 103541. [Google Scholar] [CrossRef] [Scilit]
  57. Zhang, X.; Lei, Y.; Li, R.; Ackerman, A.; Guo, N.; Li, Y.; Yang, Q.; Liu, Y. Research on Thermal Comfort of Underside of Street Tree Based on LiDAR Point Cloud Model. Forests 2022, 13, 1086. [Google Scholar] [CrossRef] [Scilit]
  58. Yu, X.; Her, Y.; Huo, W.; Chen, G.; Qi, W. Spatio-Temporal Monitoring of Urban Street-Side Vegetation Greenery Using Baidu Street View Images. Urban For. Urban Green. 2022, 73, 127617. [Google Scholar] [CrossRef] [Scilit]
Figure 1. Geographic location of study area in Zhengzhou, China.
Buildings 16 00653 g001
Figure 2. Baidu Street view image collection at sampling points for 2017 and 2022.
Buildings 16 00653 g002
Figure 3. Research framework.
Buildings 16 00653 g003
Figure 4. Three Street renewal types and associated visual elements.
Buildings 16 00653 g004
Figure 5. (a) Distribution map of road types; (b) Segmentation results for different road types.
Buildings 16 00653 g005
Figure 6. Result of “beauty” perception change.
Buildings 16 00653 g006
Figure 7. (a) Map of “beauty” perception change rate; (b) Comparison examples of SVIs.
Buildings 16 00653 g007
Figure 8. SHAP Analysis of visual elements and beauty perception.
Buildings 16 00653 g008
Figure 9. Radar chart of aggregate SHAP contributions to “beauty” perception across road types.
Buildings 16 00653 g009
Table 1. Formulae for nine visual element indices.
NameTypeAbbreviationFormulaExplanation
RoadStreet SectionS-R S R i = R i Ri: Road pixel ratio (0–1) in the i-th image.
FenceStreet SectionS-F S F i = F i Fi: Fence pixel ratio (0–1) in the i-th image.
PlantStreet Section
&
Street Greening
S&G-P S G P i = P i Pi: Plant pixel ratio (0–1) in the i-th image.
TreeStreet GreeningG-T G T i = T i Ti: Tree pixel ratio (0–1) in the i-th image.
Understory PlantingStreet GreeningG-U G U i = P i + G i Pi: Plant pixel ratio (0–1).
Gi: Grass pixel ratio (0–1).
GUi: Understory planting coverage for that individual image.
GroundStreet Greening
&
Street Vitality
G&V-G G V G i = G i Gi: Ground pixel ratio (0–1) in the i-th image.
FurnitureStreet VitalityV-F V F i = T i + C i + L i + S i Ti: Table pixel ratio (0–1).
Ci: Chair pixel ratio (0–1).
Li: Lounge pixel ratio (0–1).
Si: Seat pixel ratio (0–1).
VFi: Furniture coverage for that individual image.
WallStreet VitalityV-W V W i = W i Wi: Wall pixel ratio (0–1) in the i-th image.
SidewalkStreet Vitality
&
Street Section
V&S-S V S S i = S i Si: Sidewalk pixel ratio (0–1) in the i-th image.
Table 2. Definition of aggregate SHAP contributions for street renewal types.
TypeSHAP Aggregation
STREET SECTIONSHAPSECTION = SHAP(S-R) + SHAP(S-F) + SHAP(S&G-P) + SHAP(V&S-S)
STREET GREENINGSHAPGREENING = SHAP(G-T) + SHAP(G-U) + SHAP(S&G-P) + SHAP(G&V-G)
STREET VITALITYSHAPVITALITY = SHAP(V-F) + SHAP(V-W) + SHAP(V&S-S) + SHAP(G&V-G)
Table 3. Comparative statistics of semantic segmentation results from street view images across different road types.
Visual ElementsRoad TypeN2017 Mean2022 Trend Feature
RoadFreeway9860.331704Decreased to 0.331157
Under Freeway11910.315178Increased to 0.315550
Regular Road38230.331109Decreased to 0.330373
Tunnel2580.213788Increased to 0.227118
PlantFreeway9860.003117Decreased to 0.002450
Under Freeway11910.03239Increased to 0.034237
Regular Road38230.025301Slightly decreased to 0.025199
Tunnel2580.001632Decreased to 0.000788
FenceFreeway9860.025943Increased to 0.029974
Under Freeway11910.024559Decreased to 0.016756
Regular Road38230.019368Decreased to 0.017088
Tunnel2580.011873Decreased to 0.008987
Tree-Freeway9860.041102Decreased to 0.038730
Under Freeway11910.065359Increased to 0.080756
Regular Road38230.176513Increased to 0.182190
Tunnel2580.0061Increased to 0.008085
Understory plantingFreeway9860.005088Decreased to 0.004030
Under Freeway11910.040781Increased to 0.046818
Regular Road38230.034815Increased to 0.041105
Tunnel2580.014044Decreased to 0.008351
GroundFreeway9860.003477Decreased to 0.002266
Under Freeway11910.006448Decreased to 0.002376
Regular Road38230.001413Slightly decreased to 0.001289
Tunnel2580.004167Decreased to 0.003241
SidewalkFreeway9860.012302Slightly decreased to 0.012092
Under Freeway11910.022287Decreased to 0.019494
Regular Road38230.026448Decreased to 0.020221
Tunnel2580.006806Decreased to 0.005859
FurnitureFreeway9860.000059Significantly increased to 0.000428
Under Freeway11910.000496Increased to 0.001350
Regular Road38230.000089Significantly increased to 0.000753
Tunnel2580.000785Increased to 0.001680
WallFreeway9860.029852Slightly decreased to 0.028670
Under Freeway11910.024142Slightly decreased to 0.023503
Regular Road38230.00553Increased to 0.007493
Tunnel2580.319283Slightly decreased to 0.313546
Table 4. Paired-samples t-test results for “beauty” perception across different road types and years.
Road Type2017
Mean (SD)
2022
Mean (SD)
Paired
Differences 1
tdfP 2Cohen’s d 3
Freeway35.180 (4.688)36.859 (5.241)−1.678−8.193985<0.0010.261
Under-Freeway33.686 (6.449)35.671 (5.886)−1.985−9.4331190<0.0010.273
Regular Road36.620 (5.582)39.094 (5.964)−2.475−20.1103822<0.0010.325
Tunnel29.807 (5.005)29.721 (5.617)0.0860.2262570.821−0.014
1 Paired differences = 2017 score–2022 score; negative values indicate higher beauty in 2022. 2 95% confidence interval for the mean difference; intervals excluding zero indicate statistical significance at α = 0.05. 3 Cohen’s d ≥ 0.2 is considered the threshold for practical significance in urban perception studies.
Table 5. RF model performance.
Beauty PerceptionR2MAERMSE
Freeway0.82912.01132.6736
Under Freeway0.76772.52883.5012
Regular Road0.84082.34283.0254
Note: Tunnel samples (n = 258) were excluded from model construction due to absence of significant changes in beauty perception (paired t-test, p = 0.821).
Table 6. SHAP values for visual elements across road types.
Visual ElementFreewayUnder-FreewayRegular Road
S-R−0.1450.220−0.067
S&G-P−0.1560.2290.968
S-F0.4560.2890.555
G-T0.3010.7970.117
G-U−0.8060.2500.449
G&V-G−0.732−0.0540.712
V&S-S−1.610−0.1040.270
V-F0.1870.0920.780
V-W−0.540−0.159−0.998
Table 7. Aggregate SHAP contributions of street renewal types across different road categories.
Road TypeStreet SectionStreet GreeningStreet Vitality
Freeway−1.455−1.392−2.695
Under Freeway0.6351.221−0.225
Regular Road1.7262.2460.763
Note: Negative values indicate inhibitory effects on predicted “beauty”; positive values indicate enhancing effects.
Disclaimer/Publisher’s Note: The statements, opinions and data contained in all publications are solely those of the individual author(s) and contributor(s) and not of MDPI and/or the editor(s). MDPI and/or the editor(s) disclaim responsibility for any injury to people or property resulting from any ideas, methods, instructions or products referred to in the content.