Abstract
Since a significant part of the Italian territory was not seismically classified until 2003, most existing bridges have been designed—for decades—disregarding earthquake-induced excitations. In fact, this means that load-bearing devices and shear keys of presently in-service infrastructures may not be up to current codes, both in terms of resistance and displacement capacity. Robust investigations are hence required for verifications and possible retrofit. In this study, the seismic behaviour of a case study post-tensioned concrete bridge built in the 1980s is numerically analysed. The examined structure is 440 m long and composed of nine spans, built with precast segments using the balance cantilever construction method. The deck is divided into two parts connected by a hinged joint in the middle of the central span, obtained with three shear keys and originally designed to allow for thermal expansion only. Most importantly, the mid-span hinge, the end joints and the bearing devices were originally designed without considering the effects of seismic action. In order to preliminarily investigate the performance of devices and joints, the case study bridge is analysed by means of non-linear dynamic time history simulations, formulating different hypotheses about the non-linear behaviour of the load bearings. Forces and displacements over time are obtained for a set of seven accelerograms, and maximum values are compared to the capacity of the bridge devices. Results are then critically discussed.
1. Introduction
In several countries, a large proportion of existing road bridges were built during the 20th century. According to the literature, for example, in the United States, the average age of bridges is about 47 years [1], while in Germany, most bridges in the western German states date from 1960 to 1985 [2]. In Italy, most of the highway bridges were built between 1955 and 1975 [3], mainly from reinforced concrete (RC) or prestressed concrete (PC) [4]. In practical terms, this means that most of the existing structures were design following outdated codes, which usually required less severe design actions compared to the current standards [5]. Robust and extended verifications are hence required for safety purposes.
In Italy, the first seismic regulations were issued more than a century ago, in 1909, with provisions for equivalent static analysis, which remained the only calculation method available for the seismic design of civil structures for decades, and it is still widely used for simple structures [6]. More advanced numerical method such as non-linear static (pushover) analysis or non-linear time history analysis were developed starting from the 1980s [6]. However, most European countries issued seismic regulations starting in the 1950s, with low-level codes, which were updated to latest generation of seismic codes starting in the late 1990s [7]. Furthermore, the seismic hazard of earthquake-prone areas has been constantly updated over the years, requiring seismic design of structures in an ever-increasing number of regions [8]. For example, in Italy, a large part of the national territory was not seismically classified until 2003; therefore, most existing bridges were designed without considering the effects of earthquake excitations. Therefore, in-service bridges could have components such as load bearings or shear keys that were not originally design to withstand seismic actions, whose reaction forces and displacements should be investigated.
Seismic isolation is a well-known technique used to protect bridges from earthquake excitations [9,10], usually realised using various types of bearings such as rubber bearings [11,12] or friction pendulum bearings [13,14]. Since seismic isolation has been identified as one of the most effective and practical seismic protection strategies for civil engineering structures [15], resent research has focused a lot on these devices, looking for both better numerical models and better device performances in terms of damping, displacement capacity or re-centering capabilities, e.g., [15,16,17,18,19]. Less attention has been given to older types of bearings, which are, however, the most common among existing bridges.
Furthermore, most studies focus on structures located in medium- or high-seismicity areas, and few investigations in the literature concern bridges in areas of low seismic hazard, although their adequate resistance against earthquake excitations is not guaranteed.
In this study, the seismic behaviour of a case study post-tensioned concrete bridge built in the late 1980s in a low-seismicity site is numerically analysed, focusing the attention on load bearings and expansion joints, which were originally seized to allow for thermal expansions only. The case study bridge has a particular static scheme, with a mid-span hinge in the central span. The scheme is not very widespread and can represent an interesting practical application. Moreover, both the construction technique and the load bearings used were quite common at the time. In order to assess the seismic performance of the bridge, a preliminary finite element (FE) model of the structure is developed, and original non-linear time history analyses are performed. To investigate the influence of the load-bearing devices on the structural response, three different hypotheses about their non-linear behaviour are considered. Displacements induced by the selected ground motions are evaluated, focusing specifically on joints, load bearings and shear keys. Non-linear time history analyses are chosen among other types of analyses (e.g., pushover analysis [20], incremental modal pushover analysis [21] or incremental dynamic analyses [22]) because it is a good compromise between the accuracy of results and computational effort [23].
2. Case Study Bridge
2.1. Geometry and Materials
The case study structure—built in Italy in the late 1980s—is a post-tensioned concrete bridge with a total length of 440 m, subdivided in nine spans: the first and the last ones are 27.5 m long, while the inner spans are 55 m long. The deck of the bridge consists of a curved continuous concrete box girder on multiple supports, which was originally built with precast segments using the balance cantilever construction method. The box girder is divided into two parts of equal length, which are connected by a hinged joint in the middle of the central span (MSJ detail of Figure 1). More in detail, three steel shear keys are used: two of them are placed in the box web (details (1) and (3) in Figure 1), one each side, while the third one is placed in the bottom slab (detail (2) in Figure 1).
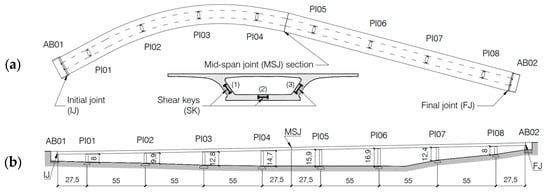
Figure 1.
Planimetric layout (a) and longitudinal cross-section (b) of the case study bridge. Dimensions are in meters.
The box girder section has an average height of 2.5 m and a total width of 17.9 m. The latter is measured on the top slab, whose thickness varies in the transversal direction between 0.25 m (at the ends) and up to 0.40 m (at the web intersections). The bottom slab is 7.0 m wide and 0.20 m thick, with the exception of the segments near each pier, where the thickness increases up to 0.60 m. Finally, the transversal slope of the top slab varies along the bridge due to the different curvature radius of the planimetric layout of the deck.
Similarly to the deck, the piers are also made of prestressed concrete and have a rectangular hollow section with stiffeners at the four edges. The outer dimensions of the pier section are 3.4 m in the transversal direction and 2.3 m in the longitudinal direction, while the inner dimensions are respectively 1.9 m and 1.5 m. The piers—from 8.0 to 16.9 m high—are characterised by slight modifications in the cross-section with elevation. They have in fact a slightly bigger section at the base (i.e., from the top surface of the foundations up to 3.0 m height). The upper part of the pier is made of solid concrete, with a constant thickness of 2.3 m and a transverse dimension which widens from 3.4 m up to 7.0 m in order to accommodate two load-bearing devices on top.
According to both design drawings and test certificates made during the construction phase of the bridge, the piers were cast using a concrete mix with a cubic compressive strength (Rc) of 40 N/mm2 (400 kg/cm2 in the design specifications), while for the precast segments of the box girder, a stronger concrete was chosen, with a cubic compressive strength of 50 N/mm2 (500 kg/cm2). Reinforcement bars in all the elements are made of FeB44K steel type, while prestressing steel with a tensile strength of 1800 N/mm2 was used for all the prestressed structural members. In Table 1, the nominal mechanical properties of the materials considered are reported.

Table 1.
Mechanical parameters of concrete, reinforcement steel and prestressing steel.
The case study bridge was designed according to [24] using the allowable stress method, taking into account dead loads, wind loads, thermal action and prestressing forces, as well as the traffic load model (for vertical vehicle loads, horizontal braking loads and centrifugal action due to the curved layout) according to [25].
2.2. Load-Bearing Devices
Different types of load-bearing devices are used along the bridge to restrain and support the curved deck. In particular:
- -
- The bearings on the abutments were chosen to allow for both longitudinal and transversal displacements (“multidirectional devices”);
- -
- The bearing on piers next to deck joints to allow only longitudinal displacements (“unidirectional devices”);
- -
- Other bearings were used to prevent all possible translations (“fixed devices”). All these devices are aluminium alloy spherical bearings that allow for small rotations and are bolted on top of the piers and to the bottom slab of the deck.
A schematic plan view is proposed in Figure 2.

Figure 2.
Plan view of the load-bearing devices. Arrows show the allowed displacements. M = multidirectional; U = unidirectional; F = fixed.
The three shear keys on the mid-span joint (see also the SK details of Figure 1) are steel pins rigidly connected to one side of the joint via Dywidag bars and inserted in special cavities, appropriately created on the other side of the joint. These pins restrain relative displacements along one direction between the two sides of the joint. Moreover, thanks to the different orientation of the three shear keys, both horizontal and vertical differential displacements are restrained, while both longitudinal displacements and rotations along vertical and horizontal axes are kept free. The role of the Dywidag bars was merely intended to anchor the metallic part to the concrete block. The prestress in the Dywidag bars, if present, has limited magnitude and does not significantly affect the shear strength of the device. As such, it can be neglected for the purposes of the present numerical investigation.
3. Structural Model and Seismic Analysis
In order to investigate the seismic behaviour of the case study bridge, a preliminary FE model of the entire structure was properly developed. Non-linear time history analyses were first performed to evaluate its structural response to several accelerogram records of historic earthquake events under different hypotheses about the load-bearing behaviour. Moreover, simplified pseudo-static analyses were also carried out to take into account the spatial variability in the seismic action.
3.1. Numerical Modelling
The reference FE model was built using the software package SAP2000® v25.2.0 [26]. More in detail, the box girder was described by using elastic frame elements, discretising the entire deck into 182 elements, one for each precast segment, with length varying from 0.75 m to 2.85 m. Both constant-section and tapered-section frame elements were used. The actual section of the deck in every segment was properly reproduced by taking advantage of the FE software Application Programming Interface (API) and Python to import the full geometry of the structure. Both node coordinates and cross-section geometry details were reproduced according to the original design drawings of the bridge. A general view of the FE model is reported in Figure 3.
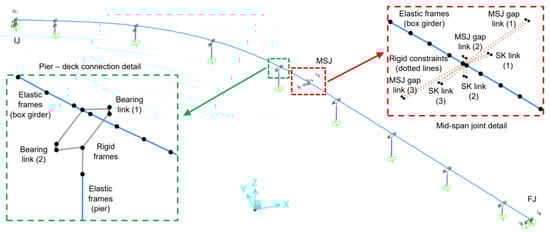
Figure 3.
General view of the FE model for the case study bridge.
The piers were modelled using elastic frame elements combined with non-linear hinges. More in detail, the elastic frames (with the actual cross-section of the piers) were used for the pier shaft, one for the bottom part (with the thicker section) and one for the remaining part of the shaft. At the same time, rigid elastic frames were used to model the pier cap. These rigid elastic frames were defined using a square cross-section (1.0 m × 1.0 m its size) and a “stiff” material. An elastic modulus of 2.1 × 10⁷ MPa (i.e., 100 times larger than the elastic modulus of steel) was considered, disregarding the material weight. The mass of the pier caps was in fact modelled using equivalent dead loads applied at the barycentric nodes.
The non-linear behaviour of the piers was modelled via fibre-based non-linear hinges in order to take into account the interaction between axial force and flexural behaviour. Fibre-based finite element analysis is a common and useful approach to model non-linear responses of RC and PC members [27], often used to study bridge piers [28]. The plastic length assigned to each hinge was equal to 1/10 of the pier height, as suggested by [29] for existing bridges (close to the plastic hinge length proposed by [30]). The hinges were placed at 1/20 of the pier height from the base. An elastic–plastic behaviour was assigned to each steel fibre representing the rebars, and a kinematic hysteresis model was chosen. Moreover, Mander’s constitutive law and Takeda hysteresis were used to define the non-linear cyclic behaviour of the concrete fibres. Each pier section was discretised into 92 steel fibres (one for each bar, as usually modelled for RC sections [31,32]) and 158 concrete fibres (with sections not larger than 0.20 m × 0.18 m), which was considered an acceptable compromise between accuracy and computational cost. The fibre section and the cyclic behaviour of the concrete and steel fibres are reported in Figure 4.
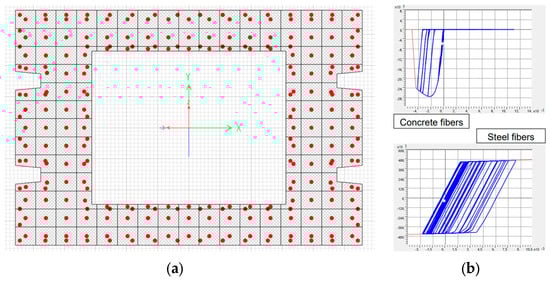
Figure 4.
Fibre section at the base of the pier (a) and cyclic behaviour of concrete and steel fibres (b).
Load bearings were model using link elements with non-linear behaviour, assuming an elastic–plastic constitutive law as in [33,34]. The vertical degree of freedom was fixed, and a high stiffness (1 × 10⁶ kN/m) was assigned to both horizontal directions, while a negligible stiffness value was considered for all the rotations (10 kNm/rad). Along the restrained directions, an elastic–plastic constitutive law with a “yielding” force (Fy) equal to the resistance of the devices was assigned. A similar behaviour, but with smaller forces along the free directions, was considered to model the friction between the sliding surfaces in a simplified way. The constitutive laws are shown in Figure 5.
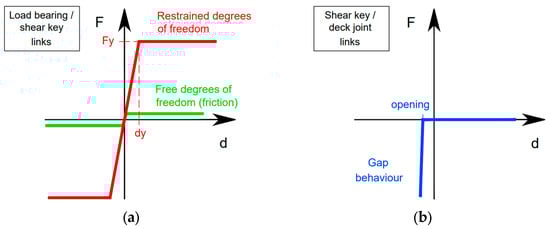
Figure 5.
Elastic–plastic constitutive law of load bearings and shear keys links (a) and gap behaviour of shear keys (axial direction) and deck joints (b).
To investigate the influence of the load-bearing devices on the structural response, three different hypotheses about their non-linear behaviour were considered:
- (a)
- Fy equal to 70% of the nominal resistance, i.e., as in the case of weak connections between the load bearings and the superstructure, or the supports;
- (b)
- Fy equal to the nominal resistance;
- (c)
- Fy equal to 150% of the nominal resistance, i.e., as in case of higher strength of both devices and connections, with respect to the declared nominal value.
Case “b” was calibrated accordingly to the design documentation, case “c” was defined assuming the nominal resistance as the serviceability limit and the ultimate strength equal to 3/2 times the nominal resistance, and case “a” was defined as the reciprocal of case “c”, assuming Fy equal to 2/3 ≈ 70% the nominal strength. The three scenarios were defined in order to simulate plausible conditions and not to represent exact physical states.
As described in the design drawings, two multidirectional load bearings were modelled on each abutment; two unidirectional load bearings were placed on top of the first, fourth, fifth and eighth piers, while the remaining piers were connected to the box girder with two fixed load bearings each.
Shear keys were also modelled with link elements using an elastic–plastic non-linear behaviour with a high stiffness and a “yielding” force equal to the nominal resistance along the only restrained degree of freedom, properly oriented in the direction in which the devices implement the constraint. Very low stiffnesses were assigned to all rotational degrees of freedom of the link representing the shear keys, as well as the transverse direction not restrained by the steel device. In the longitudinal direction of the bridge, aligned to the axial degree of freedom of the shear key link elements, a gap behaviour was implemented to represent local pounding between the steel pins and the concrete part of the deck (see Figure 5). The opening of the gap was defined to coincide with the clearance measured during visual inspection (0.08 m), while the initial stiffness was set equal to zero. This means that friction forces caused by the sliding movements of the shear keys were neglected, while a high stiffness after the gap closure was considered to model the pounding between elements.
Moreover, link elements with gap behaviour were placed at deck joints to model pounding between adjacent members. In particular, three gap links (at the left, middle and right side of each deck cross-section) with a 0.15 m opening, zero initial stiffness and rigid behaviour after gap closure were placed at the initial joint at the mid-span central joint and at the final joint.
Furthermore, since the bridge has deep foundations, with piles reaching a rigid rock layer under the shallow soft soil layer, soil–structure interaction was disregarded, using fix restraints at the base of the piers. Although neglecting the soil–structure interaction could underestimate displacements up to 10–15% [35,36], modelling piers with fixed restraint at the base is quite common [23,28], and the approximation was considered acceptable for a preliminary study. However, it is worth noting that further more detailed studies should take into account soil–structure interaction, e.g., explicitly modelling the soil [37]. Abutments represent very stiff elements rigidly connected to the ground; thus, they were not included in the FE model, assuming at the top of the abutments the same motion of the ground.
3.2. Non-Linear Time History Analyses
The structural response to seismic action was evaluated via non-linear dynamic time history analyses, which are the most refined tool to predict the behaviour of complex structures under dynamic actions. The seismic input was defined using records of past earthquake events, avoiding scaling accelerograms or creating synthetic accelerograms.
Although spatial variability should be modelled applying different seismic motions at each support [30,38], identical ground motion excitations at all supports were considered in this study, and spatial variability effects were taken into account in a simplified method, as described in the next two sections.
The case study bridge was considered as an ordinary structure, assuming a design working life of 100 years, as suggested in [39] for bridges. The seismic input was estimated for the life safety (LS) limit state, considering a probability of occurrence of 5% in the design working life, corresponding to a return period of 949 years. Sets of three accelerograms (two in orthogonal horizontal directions and one in the vertical direction) were selected from the Engineering Strong Motion Database [40], using the REXELweb tool [41], in order to get a group of seven signals with a mean pseudo-acceleration response spectrum matching the code-conforming LS spectrum (assuming a soil category B and a flat topography, since the terrain inclination in the site is under 15°). The seven triplets of records were selected among sites with a B soil class, with no limitation related to the type of faulting. The magnitude–distance criterion was used, filtering events with magnitude between 4.0 and 7.5 and epicentral distance between 0 km and 80 km.
The accelerogram records used for the non-linear time history analyses are listed in Table 2, while the target horizontal spectrum and the average horizontal spectrum of the selected accelerograms are represented in Figure 6.
Table 2.
Accelerogram records used in the time history analyses.
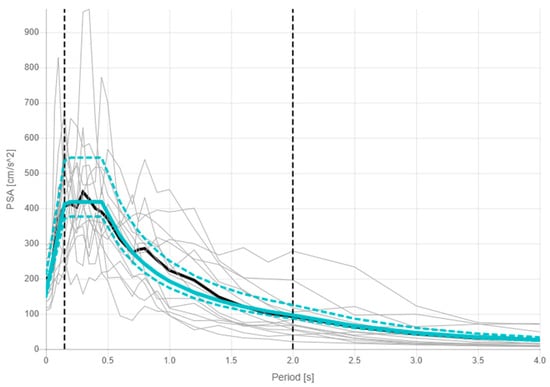
Figure 6.
Horizontal target spectrum (blue continuous line), lower and upper tolerance (blue dashed lines), average spectrum (black line) and two horizontal component spectrums (grey lines) of the seven selected events (both north and east directions, for a total of 14 accelerograms).
The masses considered in the analyses were calculated from the self-weight of structural elements (considering a density of 24 kN/m3 of RC members) and permanent weight of pavements and barriers, estimated equal to 43 kN/m. Pier prestressing was taken into account, modelling tendons with a cross-section of 12.5 cm2 (nine strands with 15.2 mm diameter, as reported in the design drawings), an initial stress equal to 1250 N/mm2 and total stress losses equal to 375 N/mm2 (30% of the initial stress) accounting for creep, shrinkage and steel relaxation. The residual prestressing level was thus quantified at 0.55 times the conventional yield strength of prestressing steel fp,01, estimated 0.90 times the tensile strength, which is within the range considered in [42] for existing Italian highway bridges.
Box girder prestressing was disregarded in the model because it was considered not relevant for the dynamic behaviour of the structure, since it was assumed that the deck remains within the elastic range during seismic events, as in [23,43]; therefore, the prestressing does not affect the stiffness of the elements.
The ground motion was uniformly applied at the base of the substructure in all three principal directions. A total of 14 time history analyses were performed, half of them obtained applying the east component of each recorded ground motion in the X direction, the north component in the Y direction and the vertical component in the Z direction and then rotating by 90° around the Z axis the horizontal components to get the other seven analyses. To take into account spatial variability in the ground motion, a simplified static analysis was performed, as described in Section 3.3. In the time history analyses, both geometric and material non-linearities were considered. According to [30], a 2% damping was used and modelled as viscous proportional damping between the first period (1.2 s) and the last significant period (0.2 s) of the case study bridge.
3.3. Spatial Variability in the Ground Motion
The spatial variability in the ground motion should account for the propagative character of the seismic waves, the progressive loss of correlation of motions at different locations due to the random non-homogeneity of the soil, and differences in the mechanical properties of the soil along the bridge. Soil properties along the bridge were assumed approximatively uniform, but the total length of the bridge exceeded the appropriate limit length Llim recommended by [30], equal to Lg/1.5. For the soil category B, which was assumed for the case study structure, the distance beyond which ground motion may be considered uncorrelated Lg is equal to 500 m; thus, the limit length Llim is equal to 333 m, smaller than the distance between the two abutments, which is 423 m. Although [30] requires considering the spatial variability in the seismic action only for continuous decks longer than Llim, while the case study bridge deck is divided into two continuous parts shorter than Llim by the mid-span hinge, the spatial variability was still taken into account in the structural analysis.
Even if it would be preferable to explicitly model the spatial variability in the ground motion [44,45], in the present preliminary study, its effects were taken into account using the simplified method proposed in [30] Section 3.3 by means of pseudo-static effects induced by appropriate displacement sets imposed at the foundations of the supports. According to the simplified method adopted, two sets of displacements were considered: a set of lateral displacements uniformly increasing with the distance to a reference point (conveniently selected as the first abutment of the bridge), applied with both a positive and negative sign (set A), and another set of lateral displacements proportional to the average distance of adjacent supports with opposite direction at adjacent supports (set B). Both set A and set B were applied along different directions (with an inclination of 0°, 45°, 90° and 135° with respect to the X direction of the FE model), since the bridge is curved. The most unfavourable effects of all equivalent displacements were then combined to the effects obtained by non-linear time history analyses with the square root of sum of squares rule.
Although spatial variability in the seismic action was considered, it is important to note that it has a limited influence over the total results in term of both forces and displacements of the structure, with noticeable effects only in longitudinal displacements of the mid-span joint.
4. Numerical Results
Maximum forces and displacements were evaluated via non-linear time history analyses and then combined with effects of ground motion spatial variability, focusing on load bearings, shear keys and deck joints. Mean maximum values among all the analyses were then analysed, comparing the different results obtained by the three different hypotheses about the load-bearing behaviour. More in detail, the numerical results are discussed in the following in terms of restrained displacements and free displacements for both load bearings and shear keys, while only negative displacements (closure) are considered for deck joints.
4.1. Restrained Displcements of Load Bearings and Shear Keys
For unidirectional bearings (“U” devices in Figure 2), the restrained displacement is equal to the transverse deformation of the bearings, while for fixed bearings (F), the maximum value between longitudinal and transversal displacements was considered, as both of them are restrained. For the shear keys (SK), the maximum displacement along the restrained direction was considered. The mean maximum values calculated for load bearings and shear keys, as well as their “yielding” displacement (dy), are reported in Figure 7 for the three examined models, labelled “a”, “b” and “c”.
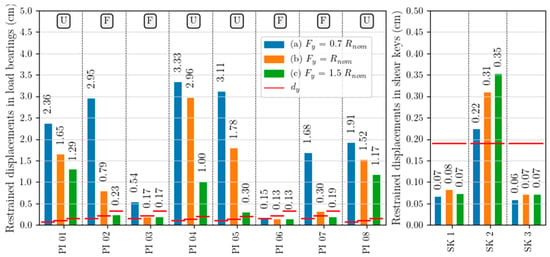
Figure 7.
Mean maximum restrained displacements in load bearings (on the left) and shear keys (on the right).
According to Figure 7, it can be noted that under the hypothesis of weak connections (model “a”), the mean restrained displacement exceeds dy in almost all the load bearings, with the exceptions of those on pier PI06, which is the tallest one. The highest displacement demands are concentrated on the piers next to the mid-span joint (PI04, PI05), while the lowest are on their adjacent piers (PI03, PI04). Under the hypothesis of nominal resistance of the load bearings (model “b”), the displacement demand decreases, with higher reduction in piers PI02, PI05 and PI07, while the displacement demand in the load bearings of PI04 are about 3 cm in both “a” and “b” models. Under the hypothesis of strong devices/connections (model “c”), all fixed bearings remain in the elastic field, while all the unidirectional devices exceed dy, with larger displacements in PI01 and PI08 than in PI04 and PI05.
The mean restrained displacement demand in the shear keys is less influenced by the load bearings’ behaviour, in particular for the two devices placed in the box webs, which show almost the same displacement, still in the elastic range, for the three different models “a”, “b”, and “c”. The most stressed element is represented by the shear key in the bottom slab, which restrains the relative transverse displacements of the two parts on the deck. On average, it exceeds dy in all the models, with increasing values from “a” to “c” and showing an opposite trend compared to the load bearings.
4.2. Free Displacements of Load Bearings
Longitudinal displacements of unidirectional (U) and multidirectional bearings (M), as well as transversal displacements of multidirectional bearings, were evaluated and compared to the nominal displacement limit specified in the design documentation of the bridge. The free displacement results of the load bearings are reported in Figure 8 for the three models assumed, labelled “a”, “b” and “c”.
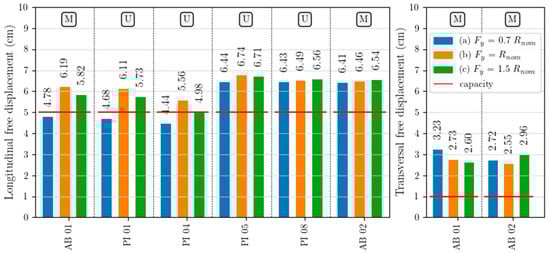
Figure 8.
Mean maximum free displacements in load bearings along longitudinal (on the left) and transversal (on the right) directions.
The mean longitudinal free displacement demand in the load bearings exceeds the nominal capacity in all devices of the second half of the bridge in the three examined models. Very similar results are found for models “a”, “b”, and “c”, with average values of about 6.4–6.7 cm and demand-to-capacity ratios equal to 1.3. In the load bearings in the first half of the bridge, the average free displacements vary from 4.4 cm to 6.2 cm, with a greater sensibility of measured displacements to the hypothesis about the description of the load bearings’ behaviour. In fact, the mean values in model “a” are below the nominal displacement capacity, while models “b” and “c” show greater demand values, which are close to the nominal limit at pier PI04 for model “c”, and larger values are found at abutment AB01 and at pier PI01.
The average transversal free displacements in the load bearings on the abutments also exceed the nominal capacity, showing demand-to-capacity ratios between 2.6 and 3.3 but with different influence from the load bearings’ behaviour. At abutment AB01, the load bearings show a decrease in displacement between model “a”, model “b” and model “c”, while at abutment AB02, the largest transversal displacements are recorded in model “c”. Both longitudinal and transversal displacements in load bearings are not large enough to physically induce loss of support of the deck, since the devices have dimensions of approximatively 0.7 m, but once the displacement capacity of the devices is exceeded, their load-bearing capacity is no longer guaranteed. More refined analyses should be carried out in order to investigate the interaction between transversal free displacements and the load-bearing capacity of the devices.
4.3. Displacements of Deck Joints and Shear Keys
Closure of all deck joints (IJ, MSJ, FJ) and longitudinal displacements in the shear keys (SK) were evaluated and compared to the capacity of each component. The nominal capacity of joint closure was assumed to be equal to the gap between the abutment rear wall and the deck for the initial and the final joint.
The gap between the two parts of the deck was instead taken for the mid-span joint, while the capacity of the shear key axial displacement was assumed to be equal to the nominal capacity specified in the design documentation of the bridge. Displacements of deck joints and shear keys are reported in Figure 9 for the three models “a”, “b” and “c”.
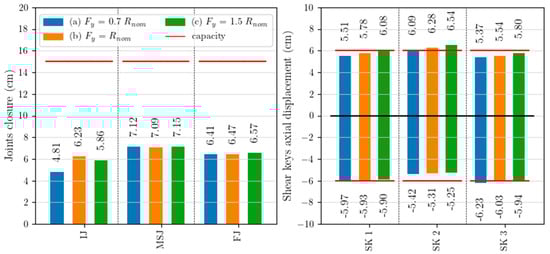
Figure 9.
Mean maximum deck joint closure (on the left) and axial displacements of shear keys (on the right).
Although in the design drawing very small gaps were reported between elements (only 0.03 m between the deck and the abutments and 0.06 m in the mid-span joint), a visual inspection showed gaps of 0.15 m at every joint (capacity reported in Figure 9).
The joint closure is influenced very little by the hypothesis about the load bearings’ behaviour, showing very similar results between models “a”, “b”, and “c”. In particular, the joint closure is slightly smaller in the initial joint (with mean values of about 5–6 cm and a noticeable dependence on the modelling hypotheses) compared to the other joints (with mean maximum values of about 7.1 cm at the mid-span joint and 6.5 cm at the final joint). These results are coherent with the larger displacements recorded in the second half of the bridge (straight part) compared to the first half (curved part), as also previously highlighted. In all the deck joints, the average maximum displacements are larger than the designed gap between the elements but still smaller than the actual gap. Consequently, the possible pounding between the structural elements does not represent an issue for the presented case study bridge.
The shear keys show similar axial displacements between models “a”, “b” and “c”. The mean maximum values range between −5.3 cm and −6.2 cm in the negative direction (i.e., joint closure) and between 5.4 cm and 6.5 cm in the positive direction (i.e., joint opening). In the central shear key (SK 2), negative displacements are slightly smaller than in the lateral shear keys (SK 1 and SK 3). The positive displacements are indeed slightly larger due to the section rotation induced by gravity loads. Accordingly, the local pounding is more likely to happen in the lateral shear keys, while a loss of support for the devices is more likely to happen in the central element. The mean displacements are comparable to the nominal displacement capacity of the shear keys, so local pounding or loss of support of the devices could represent an issue for the investigated case study system, although more refined analyses are needed to properly asses the actual displacement capacity of these elements.
5. Conclusions
The preliminary seismic analysis of an in-service curved PC box girder bridge with a mid-span hinge was performed, focusing on the load bearings, the shear keys and the deck joints. The primary goal was to investigate the influence of the load bearings on the structural response of the structure, in particular in terms of capacity of devices, of possible pounding between the bridge elements, or even of loss of support of the metal devices.
An FE numerical model of the bridge was developed, with frame elements for piers and the box girder, non-linear fibre-based hinges at the base of each pier, non-linear link elements for load bearings, gap link elements at deck joints and link elements with both elastic–plastic and gap behaviour to represent steel shear keys at the mid-span joint. Both non-linear time history analyses and simplified static analyses for the spatial variability in the seismic actions were performed for the LS limit state seismic intensity, analysing different models with three hypotheses about the non-linear behaviour of the load bearings. Accordingly, the corresponding maximum displacements were calculated for load bearings, shear keys and deck joints of each model. Then, seismic demands were compared to the nominal capacity of these elements, as derived by the original design drawings of the bridge, and the influence of different load bearings behaviours on the structural response was discussed.
The main results obtained of the present preliminary analyses can be summarised as follows:
- Many load bearings and shear keys showed restrained displacements beyond the elastic range, especially for the unidirectional bearings. Exceeding the elastic threshold was found highly dependent on the hypothesised behaviour of the load bearings.
- The predicted free displacements in all the bearings exceeded their nominal displacement capacity, with little influence of the assumed behaviour. The demand/capacity ratios were quantified up to 1.3 for the longitudinal direction and 3.6 in the transverse direction. This means that the vertical load-bearing capacity would be not guaranteed (even though the estimated displacements were found to be too small to induce a possible loss of support for the deck).
- The joint gaps were observed to be large enough to avoid pounding between the abutments and the deck girder, while axial displacements in the shear keys were comparable to their nominal capacity, suggesting that local pounding or loss of support for the devices could be an issue, although more refined analyses are needed.
Load bearings and shear keys exceeding the elastic limit could imply local damage of the devices, thus leading to the interruption of the functionality of the bridge for repairs, although no implications for safety aspects were highlighted, since loss of support of the deck was not reached. Thus, from preliminary analyses, devices retrofit could be useful but not necessary, and more risk-based analyses are suggested to properly evaluate retrofit prioritisation. Since load bearings and shear keys largely exceeded the elastic threshold, however, further investigations on the bridge should focus on the quantification of the ultimate displacement capacity of the devices in order to properly assess the seismic performance of the bridge.
Author Contributions
S.B., A.M. and M.F.: software, validation, formal analysis, investigation, data curation, visualisation, writing—original draft preparation. E.P., N.G. and C.B.: data curation, resources, writing—original draft preparation, supervision, project administration, funding acquisition. All authors have read and agreed to the published version of the manuscript.
Funding
This research received no external funding.
Data Availability Statement
The raw data supporting the conclusions of this article will be made available by the authors on request.
Acknowledgments
The authors gratefully acknowledge FABRE—“Research consortium for the evaluation and monitoring of bridges, viaducts and other structures” (http://www.consorziofabre.it/en, accessed on 21 January 2026) for providing partial financial support.
Conflicts of Interest
The authors declare no conflicts of interest.
References
- American Society of Civil Engineers. A Comprehensive Assessment of America’s Infrastructure. 2025. Available online: www.infrastructurereportcard.org (accessed on 8 August 2025).
- Marzahn, G.; Gunreben, Y.C. Brückenmodernisierung in Deutschland: Veranlassung und Umsetzung. Stahlbau 2017, 86, 557–561. (In German) [Google Scholar] [CrossRef]
- Pinto, P.E.; Franchin, P. Issues in the upgrade of Italian highway structures. J. Earthq. Eng. 2010, 14, 1221–1252. [Google Scholar] [CrossRef]
- Borzi, B.; Ceresa, P.; Franchin, P.; Noto, F.; Calvi, G.M.; Pinto, P.E. Seismic vulnerability of the Italian roadway bridge stock. Earthq. Spectra 2015, 31, 2137–2161. [Google Scholar] [CrossRef]
- Bozza, S.; Fasan, M.; Noè, S. Vulnerability to traffic loads of typical Italian bridges in relation to the evolution of the code framework. Ce/Papers 2023, 6, 760–767. [Google Scholar] [CrossRef]
- Fajfar, P. Analysis in seismic provisions for buildings: Past, present and future: The fifth Prof. Nicholas Ambraseys lecture. In Bulletin of Earthquake Engineering; Springer: Dordrecht, The Netherlands, 2018; Volume 16, pp. 2567–2608. [Google Scholar] [CrossRef]
- Crowley, H.; Despotaki, V.; Silva, V.; Dabbeek, J.; Romão, X.; Pereira, N.; Castro, J.M.; Daniell, J.; Veliu, E.; Bilgin, H.; et al. Model of seismic design lateral force levels for the existing reinforced concrete European building stock. Bull. Earthq. Eng. 2021, 19, 2839–2865. [Google Scholar] [CrossRef]
- Crowley, H.; Despotaki, V.; Silva, V.; Dabbeek, J.; Romão, X.; Pereira, N.; Castro, J.M.; Daniell, J.; Veliu, E.; Bilgin, H.; et al. Evolution of European Seismic Design Levels Data. Version 1.0. 2020. Available online: https://maps.eu-risk.eucentre.it/map/european-seismic-design-levels/#4/51.33/6.78 (accessed on 13 January 2026).
- Kunde, M.C.; Jangid, R.S. Seismic behavior of isolated bridges: A-state-of-the-art review. Electron. J. Struct. Eng. 2003, 3, 140–170. [Google Scholar] [CrossRef]
- Makris, N. Seismic isolation: Early history. In Earthquake Engineering and Structural Dynamics; John Wiley and Sons Ltd.: Hoboken, NJ, USA, 2019; Volume 48, pp. 269–283. [Google Scholar] [CrossRef]
- Kelly, J.M.; Konstantinidis, D.A.; Konstantinidis, K. Mechanics of Rubber Bearings for Seismic and Vibration Isolation; John Wiley & Sons: Hoboken, NJ, USA, 2011. [Google Scholar]
- Jangid, R.S. Optimum lead-rubber isolation bearings for near-fault motions. Eng. Struct. 2007, 29, 2503–2513. [Google Scholar] [CrossRef]
- Jangid, R.S. Optimum friction pendulum system for near-fault motions. Eng. Struct. 2005, 27, 349–359. [Google Scholar] [CrossRef]
- Fenz, D.M.; Constantinou, M.C. Behaviour of the double concave Friction Pendulum bearing. Earthq. Eng. Struct. Dyn. 2006, 35, 1403–1424. [Google Scholar] [CrossRef]
- Zheng, W.; Tan, P.; Li, J.; Wang, H.; Liu, Y.; Xian, Z. Superelastic Conical Friction Pendulum Isolator for Seismic Isolation of Bridges under Near-Fault Ground Motions. Struct. Control Health Monit. 2023, 2023, 5497731. [Google Scholar] [CrossRef]
- Zheng, W.; Tan, P.; Li, J.; Wang, H.; Liu, Y.; Yang, K. Seismic performance upgrading of bridges using superelastic pendulum isolators with variable stiffness considering temperature effects. Eng. Struct. 2023, 275, 115244. [Google Scholar] [CrossRef]
- Xiang, N.; Wang, J.; Xu, H.; Wu, X.; Wan, Z.; Chen, X. Seismic performance of continuous bridges under mainshock-aftershock-like sequences with rotatable bonded laminated rubber bearings accommodating support rotation. Soil Dyn. Earthq. Eng. 2025, 191, 109234. [Google Scholar] [CrossRef]
- Long, X.; Zhou, Q.; Ma, Y.; Gui, S.; Lu, C. Displacement-based seismic design of SMA cable-restrained sliding lead rubber bearing for isolated continuous girder bridges. Eng. Struct. 2024, 300, 117179. [Google Scholar] [CrossRef]
- Chen, X.; Wu, S.; Li, J.; Guan, Z.; Xiang, N. Seismic performance assessment and design procedure of base-isolated bridges with lead-rubber-bearing and negative stiffness springs (LRB-NS). Eng. Struct. 2024, 306, 117871. [Google Scholar] [CrossRef]
- Krawinkler, H.; Seneviratna, G.D.P.K. Pros and cons analysis of seismic evaluation. Eng. Struct. 1998, 20, 452–464. [Google Scholar] [CrossRef]
- Contiguglia, C.P.; Pelle, A.; Briseghella, B.; Nuti, C. IMPA versus Cloud Analysis and IDA: Different Methods to Evaluate Structural Seismic Fragility. Appl. Sci. 2022, 12, 3687. [Google Scholar] [CrossRef]
- Vamvatsikos, D.; Allin Cornell, C. Incremental dynamic analysis. Earthq. Eng. Struct. Dyn. 2002, 31, 491–514. [Google Scholar] [CrossRef]
- Zucca, M.; Crespi, P.; Stochino, F.; Puppio, M.L.; Coni, M. Maintenance interventions period of existing RC motorway viaducts located in moderate/high seismicity zones. Structures 2023, 47, 976–990. [Google Scholar] [CrossRef]
- Ministry of Public Works. Decreto Ministeriale 26 Marzo 1980: Norme Tecniche per L’esecuzione Delle Opera in Cemento Armato Normale, Precompresso e per le Strutture Metalliche; Ministry of Public Works: Roma, Italy, 1980. (In Italian)
- Ministry of Public Works. Decreto Ministeriale 2 Agosto 1980: Criteri Generali e Prescrizioni Tecniche per la Progettazione, Esecuzione e Collaudo di Ponti Stradali; Ministry of Public Works: Roma, Italy, 1980. (In Italian)
- CSI. SAP2000 Integrated Software for Structural Analysis and Design—Analysis Reference Manual. 2016. Available online: www.csiamerica.com (accessed on 13 January 2026).
- Di Re, P.; Bernardini, D.; Ruta, D.; Paolone, A. Pushover Analyses of Slender Cantilever Bridge Piers with Strength and Ductility Degradation. KSCE J. Civ. Eng. 2024, 28, 836–848. [Google Scholar] [CrossRef]
- De Domenico, D.; Messina, D.; Recupero, A. Seismic vulnerability assessment of reinforced concrete bridge piers with corroded bars. Struct. Concr. 2023, 24, 56–83. [Google Scholar] [CrossRef]
- MIT. Circolare 21 Gennaio 2019 n. 7. Istruzioni per L’applicazione dell’«Aggiornamento delle “Norme Tecniche per le Costruzioni”» di cui al Decreto Ministeriale 17 Gennaio 2018; MIT: Roma, Italy, 2019. (In Italian) [Google Scholar]
- EN 1998-2 (2005); Eurocode 8: Design of Structures for Earthquake Resistance—Part 2: Bridges. CEN: Brussels, Belgium, 2005.
- Kashani, M.M.; Lowes, L.N.; Crewe, A.J.; Alexander, N.A. Nonlinear fibre element modelling of RC bridge piers considering inelastic buckling of reinforcement. Eng. Struct. 2016, 116, 163–177. [Google Scholar] [CrossRef]
- Su, J.; Dhakal, R.P.; Wang, J. Fiber-based damage analysis of reinforced concrete bridge piers. Soil Dyn. Earthq. Eng. 2017, 96, 13–34. [Google Scholar] [CrossRef]
- Wei, B.; Zuo, C.; He, X.; Jiang, L.; Wang, T. Effects of vertical ground motions on seismic vulnerabilities of a continuous track-bridge system of high-speed railway. Soil Dyn. Earthq. Eng. 2018, 115, 281–290. [Google Scholar] [CrossRef]
- Jiang, L.; Yu, J.; Zhou, W.; Yan, W.; Lai, Z.; Feng, Y. Applicability analysis of high-speed railway system under the action of near-fault ground motion. Soil Dyn. Earthq. Eng. 2020, 139, 106289. [Google Scholar] [CrossRef]
- Diao, Y.C.; Li, C.; Li, H.N.; Dong, H.H.; Hao, E.T. A holistic seismic performance evaluation of irregular curved bridges with precast segmental piers considering SSI and depth-varying spatial motion inputs. Soil Dyn. Earthq. Eng. 2025, 196, 109488. [Google Scholar] [CrossRef]
- Diao, Y.; Li, C.; Li, H.; Dong, H.; Hao, E. Seismic performance assessment of a precast segmental column bridge considering soil–structure interaction and depth-varying multi-support ground motion inputs. Front. Struct. Civ. Eng. 2025, 19, 1478–1492. [Google Scholar] [CrossRef]
- Bagheri, M.; Ranjbar Malidarreh, N.; Ghaseminejad, V.; Asgari, A. Seismic resilience assessment of RC superstructures on long–short combined piled raft foundations: 3D SSI modeling with pounding effects. Structures 2025, 81, 110176. [Google Scholar] [CrossRef]
- Ramadan, O.M.O.; Mehanny, S.S.F.; Kotb, A.A.M. Assessment of seismic vulnerability of continuous bridges considering soil-structure interaction and wave passage effects. Eng. Struct. 2020, 206, 110161. [Google Scholar] [CrossRef]
- EN 1990 (2002); Eurocode—Basis of Structural Design. CEN: Brussels, Belgium, 2002.
- Luzi, L.; Lanzano, G.; Felicetta, C.; D’Amico, M.C.; Russo, E.; Sgobba, S.; Pacor, F.; ORFEUS Working Group 5. Engineering Strong Motion Database (ESM), Version 2.0; Istituto Nazionale di Geofisica e Vulcanologia (INGV): Rome, Italy, 2020.
- Sgobba, S.; Puglia, R.; Pacor, F.; Luzi, L.; Russo, E.; Felicetta, C.; Lanzano, G.; D’Amico, M.; Baraschino, R.; Baltzopoulos, G.; et al. REXELweb: A tool for selection of ground-motion records from the Engineering Strong Motion database (ESM). In Proceedings of the 7th International Conference on Earthquake Geotechnical Engineering (ICEGE), Rome, Italy, 17–20 June 2019. [Google Scholar]
- Miluccio, G.; Losanno, D.; Parisi, F.; Cosenza, E. Traffic-load fragility models for prestressed concrete girder decks of existing Italian highway bridges. Eng. Struct. 2021, 249, 113367. [Google Scholar] [CrossRef]
- Zucca, M.; Stochino, F.; Vecchi, E.; Crespi, P. On the seismic performance of existing RC motorway viaducts subject to corrosion effects. In Fib Conference on Capacity Assessment of Corroded Reinforced Concrete Structures: From Research to Daily Engineering Evaluation, CACRCS, Fib Symposium; International Federation for Structural Concrete Fédération Internationale du Béton: Lausanne, Switzerland, 2025; pp. 282–289. [Google Scholar]
- Li, C.; Li, H.N.; Hao, H.; Bi, K.; Chen, B. Seismic fragility analyses of sea-crossing cable-stayed bridges subjected to multi-support ground motions on offshore sites. Eng. Struct. 2018, 165, 441–456. [Google Scholar] [CrossRef]
- Li, C.; Diao, Y.; Li, H.N.; Pan, H.; Ma, R.; Han, Q.; Xing, Y. Seismic performance assessment of a sea-crossing cable-stayed bridge system considering soil spatial variability. Reliab. Eng. Syst. Saf. 2023, 235, 109210. [Google Scholar] [CrossRef]


Disclaimer/Publisher’s Note: The statements, opinions and data contained in all publications are solely those of the individual author(s) and contributor(s) and not of MDPI and/or the editor(s). MDPI and/or the editor(s) disclaim responsibility for any injury to people or property resulting from any ideas, methods, instructions or products referred to in the content. |
© 2026 by the authors. Licensee MDPI, Basel, Switzerland. This article is an open access article distributed under the terms and conditions of the Creative Commons Attribution (CC BY) license.