Abstract
The optimization of historic district form, given the coordinated relationship between global urbanization and sustainable development, faces the core contradiction between preservation and development. Taking Shenyang’s Nanshi area as a case study, this study aimed to construct a sustainable urban form evaluation system comprising 7 dimensions and 23 indicators by integrating multi-source geographic Big Data. A combination of a weighting approach in rank-order analysis and the entropy weight method was adopted, followed by spatial quantitative analysis conducted based on ArcGIS. The results showed that the sustainability of the area exhibited significant spatial differentiation: historic blocks became high-value areas due to their “small blocks, dense road network” fabric and high functional mix. However, newly built residential areas were low-value zones, constrained by factors such as fragmented green spaces, single-functional land use, and other limitations. Road network density and functional mixing were identified as the primary driving factors, while green coverage rate served as a secondary factor. Based on these findings, a three-tier “element–structure–system” optimization strategy was proposed, providing quantitative decision support for the low-carbon renewal of high-density historic urban districts.
1. Introduction
With accelerated global urbanization, urban spatial form has become a key lever for regulating energy consumption, carbon emissions, and social equity [1]. The United Nations Sustainable Development Goals explicitly advocate for “building inclusive, safe, resilient, and sustainable cities” [2]. Research on sustainable urban form (SUF) has advanced from macro-scale theoretical exploration to meso- and microscale empirical quantification, with its core objective being to optimize spatial organization for the synergistic development of resource efficiency, social equity, and ecological balance.
In terms of research progress, the international community has established a research system based on the Compact City Theory and the “urban form-economic and social-environment” framework. Among them, the Compact City Theory, proposed by scholars such as Jenks, emphasizes achieving urban sustainable development through mixed-use layout and transit-oriented development, laying a foundation for the research on the correlation between high-density development and sustainable urban form [3,4]. Building on this, Salat reconstructed the “urban form-economic and social-environment” framework, proposing seven core evaluation indicators including intensity, diversity, and proximity, which further clarified the core dimensions of urban form quantification [5]. With the development of information technology, scholars have gradually shifted towards technology-driven quantification, developing a series of advanced models with the aid of Python 3.7, Multi-Criteria Analysis (MCA), and Information and Communication Technology (ICT). For instance, Lohrey utilized Python to develop the “sustainability window” model, evaluating urban morphological thresholds from multiple dimensions such as greenhouse gas emissions and traffic congestion [6]; Pan proposed the “Adaptive Hybrid Urban Morphology Communities (HUMC)” model, emphasizing the close correlation between residents’ behaviors and spatial experiences, and improving sustainability through optimizing community spatial form [7]; Moroke established a community sustainability evaluation model using multi-criteria analysis, further improving the technical path of morphological evaluation [8]; Bibri integrated ICT to enhance the dynamics and accuracy of sustainable morphological evaluation [9]. In the field of historic urban district research, the international academic community focuses on the coordination of “morphological memory” and “dynamic adaptation”: based on the theories of the Conzenian School and the Italian Typological School, Kropf proposed a “hierarchy-type” analytical framework to interpret the evolutionary laws of historic district forms at multiple scales [10]; Serge Salat pointed out in Cities and Forms that the sustainable form of historic urban districts needs to balance resource efficiency and social equity through quantitative analysis to avoid cultural fragmentation during renewal [11].
Although domestic research on sustainable urban form started relatively late, it has always kept pace with international research trends, evolving from the early introduction of theories such as the “compact plus polycentric” model and the three-dimensional composite system to the recent promotion of multi-source data quantitative applications based on constrained Cellular Automata (CA) models and “form-energy consumption” coupling models. For example, taking Qingpu, Shanghai, as a case study, Dai Songzhuo proposed a “compact + multi-center” sustainable form model [12]; Lin Zhongyu constructed a composite system of sustainable urban form from three dimensions: physical space, social functions, and behavioral activities [13]. With the widespread application of digital technology, domestic research has gradually moved towards multi-source data integration and quantitative models. The team led by Li Xia developed a constrained Cellular Automata (CA) model based on GIS, realizing dynamic simulation of urban form and providing strong technical support for urban planning and development [14]. Hu Junhui constructed a “form-energy consumption” coupling model, deeply analyzing the correlation mechanism between spatial structure and sustainable development goals, and providing a new research perspective for urban sustainable development [15]. In terms of historic urban district research, domestic studies focus on the balance between protection and renewal, proposing interdisciplinary evaluation indicator systems and emphasizing the coordination of plot fabric and property right structure. For instance, based on a comprehensive ecological perspective, Hu Changjuan proposed that the revitalization of historic districts needs to integrate interdisciplinary evaluation indicators to achieve the sustainable development of historic districts [16]. Liu Peng et al. emphasized that the protection of plot fabric in historic cities should fully consider both property right structures and morphological characteristics, avoiding a one-size-fits-all renewal method, thereby better protecting the characteristics and styles of historic cities [17].
Existing research still has many significant gaps and limitations.
First, the localized measurement system integrating multi-source data is inadequate. Mainstream international models, such as the “sustainability window” and “Adaptive Hybrid Urban Morphology Communities (HUMC)”, are mostly constructed based on Western urban data and fail to fully adapt to the unique composite characteristics of “coexistence of colonial concession fabric and planned-economy residential areas” in Chinese historic urban districts. Domestic research, on the other hand, relies on remote sensing and statistical panel data, with insufficient data collection on “intangible morphological elements” such as property right boundaries and cultural identity. The low coupling degree of subjective and objective indicators makes it difficult to comprehensively and accurately reflect the real situation of historic urban districts.
Second, there are shortcomings in meso- and micro-scale measurement methods. Most existing studies focus on macro strategies or micro architectural technology optimization, lacking attention to the measurement of sustainable form at the meso- and micro-scale of “neighborhood-plot” in historic urban districts, which makes it difficult to match their spatial characteristics of “small scale and high complexity”. For example, although Lang Wei’s community living circle evaluation [18] and Xu Leiqing’s empirical research on 15-min living circles [19] focus on meso- and micro-scales, they fail to fully combine the morphological continuity of historic urban districts, making it difficult to accurately identify the core causes of spatial differentiation. In addition, existing measurement models lack dynamics and are mostly static evaluations, making it difficult to predict and simulate the evolution of historic urban district forms. For example, under the “dual carbon” goal, it is impossible to accurately quantify the long-term impact of morphological optimization on carbon emissions in Shenyang’s historic urban districts.
Third, the system optimization strategies have one-dimensional defects. Renewal strategies for historic urban districts at home and abroad are mostly limited to a single dimension: international strategies focus on the coordination of ecology and economy but lack sufficient attention to social equity in historic urban districts; domestic strategies focus on physical space renewal, lacking the systematic integration of “form–function–society”. Local research in Shenyang is even more lacking in “multi-source data-driven” precise strategies. Existing renewal plans are mostly based on empirical judgments, failing to fully utilize data such as POI kernel density and population heatmap to identify public service blind spots.
Historic urban districts serve as core carriers of urban culture, requiring a balance between protecting traditional fabric and integrating modern functions during renewal, thereby posing higher demands for the refined management of sustainable form. The rapid development of multi-source geographic Big Data [e.g., point of interest (POI), street-view imagery, and mobile phone signaling data] and spatial analysis techniques (e.g., GIS and space syntax) has provided a key technical path for accurately quantifying the correlations between morphological elements and sustainability performance, which can fill the methodological gap in SUF research at the meso- and microscale.
Shenyang’s Nanshi area is a typical concession-type historic urban district in Northeast China. Its spatial fabric integrates modern planning heritage and traces of contemporary renewal [20,21], presenting distinct spatial differentiation between “high-potential historic core areas” and “low-efficiency urban residential areas”. This makes it an ideal sample for meso- and microscale SUF research.
Based on the above, this study takes Shenyang’s Nanshi area as the research object, integrates multi-source data, constructs a SUF quantitative evaluation system adapted to historic urban districts, reveals its spatial differentiation characteristics and driving mechanisms, and proposes a data-driven “element–structure–system” renewal strategy, aiming to provide theoretical support and a practical paradigm for the sustainable development of similar historic urban districts.
2. Study Area and Methodology
2.1. Study Area Overview
The Nanshi area of Shenyang (41°46′ N, 123°24′ E) is situated at the core of Heping District, covering an approximate area of 3.2 km2 (Figure 1). Its uniqueness lies in the “overlap of spatial texture and functions under multi-layered historical stratification.” Beginning with the planning and construction of the Fengtian Self-open Commercial Port in 1906, the area has experienced three developmental stages: prosperity during the Republican era, reconstruction under the planned economy period, and market-oriented renewal [22]. This evolution has shaped a typical pattern of “symbiosis between modern planning heritage and contemporary urban space” in Northeast China.
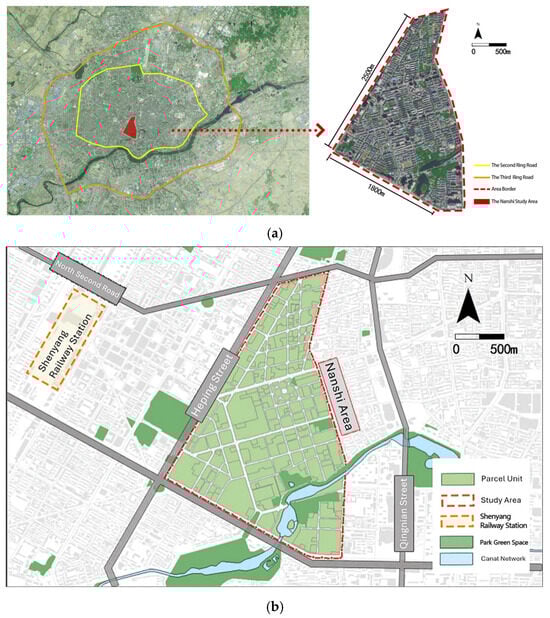
Figure 1.
(a) Location and urban form of the Nanshi study area. (b) Detailed plan of the study area at the block scale.
In the northern part, Bagua Street preserves the circular–radial road network (120 m × 120 m module) of China’s modern commercial port area and intact architectural complexes with Republican-era styles. In contrast, the southern part consists of modern residential districts with a regular grid layout [22]. The direct adjacency between traditional modular texture and modern standardized residential areas, coupled with the close superposition of the historic commercial core and contemporary residential functions, renders this area a unique sample—both contradictory and representative—for meso-/microscale SUF research.
2.2. Basic Data Sources
This study established a multi-source data fusion framework. Data sources and processing were as follows:
(1) Base geographic data: Street network data were sourced from OpenStreetMap (retrieved in March 2022) and subjected to GIS topological correction. Building footprints and floor counts were acquired via the Baidu Maps API, supplemented with drone imagery for validation. The study area boundary was determined based on the officially designated historic district unit by the government.
(2) The POI data in this study were collected via the Baidu Maps API in April 2022. The data scope was defined in accordance with the spatial characteristics of the historic district and the requirements of Sustainable Urban Form (SUF) evaluation, and data validity was ensured through spatial clipping, cleaning and deduplication. Initially, 187,995 POI records were collected in the core area within Shenyang’s Second Ring Road. The 14 selected POI categories are highly correlated with the daily life and production of local residents, and cover key public service facility types in the area such as education, medical care, commerce and transportation, which can fully reflect the functional layout characteristics of the historic district. The specific categories are as follows: medical services (general hospitals, clinics, etc.), educational services (kindergartens, primary and secondary schools, training institutions, etc.), commercial retail (shopping malls, department stores, supermarkets, etc.), catering services (Chinese restaurants, snack bars and fast-food restaurants, etc.), accommodation services (star-rated hotels, budget hotels, etc.), living services (post offices, housekeeping service agencies, beauty salons and barbershops, etc.), transportation facilities (bus stops, parking lots, metro stations, etc.), cultural facilities (art galleries, exhibition halls, etc.), sports and fitness facilities (stadiums, community fitness venues, etc.), administrative offices (administrative units, public security organs, procuratorates and courts, etc.), leisure and entertainment venues (cinemas, theaters, etc.), financial services (banks, investment and wealth management institutions, etc.), tourism services (parks, zoos, cultural relics and historic sites, etc.), and maintenance services (household appliance, automobile and bicycle repair shops, etc.).
Subsequently, through spatial clipping (focusing on the officially delineated boundary of the historic district), data cleaning (removing records with invalid or ambiguous coordinates), and deduplication (prioritizing unique platform identifiers (UIDs); for POIs without UIDs, duplicates were identified using the rule of “name–subcategory–spatial proximity”, where records with the same attribute and a distance ≤ 5 m were regarded as duplicates), a total of 4325 valid POIs were finally determined for this study.
The definition of POI types and scope in this study strictly serves the core goal of SUF evaluation in the historic district. First, it aligns with the requirements for constructing core SUF evaluation indicators, providing data support for the quantitative analysis of functional mix and accessibility, and laying a solid foundation for the SUF evaluation system. Second, by selecting POI data with accurate geographic locations and standardized category labels, it ensures data objectivity and refined characterization, avoids deviations in functional area identification caused by data errors, and accurately captures the “small-scale, high-complexity” spatial texture characteristics of the historic district. Third, it adopts the technical approach of “full-area collection first, followed by boundary clipping” to meet the targeted needs of meso-micro research scale: the POI data in the core area within Shenyang’s Second Ring Road are collected first to ensure the integrity of the original data, and then irrelevant data outside the study area are eliminated through boundary clipping, making the analysis results more consistent with the meso-micro research orientation of “block–plot” and matching the analysis needs of spatial differentiation characteristics of the historic district.
(3) Street-view imagery data: Based on the Baidu Maps API, 1874 street-view images were sampled every 100 m along roads at a fixed camera orientation. The street-view images used in this study have capture dates ranging from May 2019 to August 2022. Semantic segmentation was conducted using a PyCharm-integrated segmentation [PyCharm 2022.1] tool to extract indicators such as sky view factor (SVF) and green view index (GVI). Specifically, street-view images were segmented using a SAM-based tool (Segment Anything; pre-trained weights), and SVF/GVI were computed as pixel proportions of the sky and vegetation labels, respectively. The segmentation outputs were spot-checked by manual visual inspection on a random sample of images.
(4) Remote sensing data: Landsat 8 satellite imagery with a 30-m resolution was adopted (acquired on 23 June 2021). Green space distribution was extracted in ArcMap 10.8 using an unsupervised k-means (ISODATA-type) classification on Landsat 8 multispectral bands, followed by cluster interpretation and manual sample-based verification using high-resolution imagery. Green space coverage was then calculated.
(5) Questionnaire survey data: Stratified random sampling was used to deploy 39 sampling points in the area, with 366 valid questionnaires recovered (survey conducted in June 2024). These data quantified subjective perception indicators (e.g., place characteristics and path continuity) and were spatially extrapolated using Kriging interpolation.
(6) Space syntax data: Betweenness centrality (BtE) and closeness centrality of the road network were calculated using the sDNA (Spatial Design Network Analysis) plugin (based on the March 2022 street network), with analysis thresholds set at 400 m (pedestrian scale) and 800 m (non-motor vehicle scale).
All data were subjected to coordinate unification (WGS 1984 UTM Zone 51N) and spatial registration on the ArcGIS 10.8 platform.
2.3. Construction of the SUF Evaluation Index System
We constructed an SUF evaluation system comprising 7 first-level dimensions and an initial set of 23 second-level indicators, drawing on sustainable development theory and the “hierarchy–typology” framework of urban morphology, and guided by the goals of resource efficiency, social equity, and ecological balance (Table 1). The indicators were selected through a combination of literature review, Delphi expert consultation (30 experts), and consideration of data availability, resulting in the final index set.

Table 1.
Preliminary SUF evaluation index system for the Nanshi area (initial selection of indicators).
The detailed implementation process of the Delphi method is as follows: A panel of 30 experts was selected to form the consultation team, covering three categories of participants—university academic experts (specializing in architecture, urban–rural planning and related fields, responsible for the theoretical construction of indicators), planning and design experts (senior registered urban planners, responsible for screening implementable indicators), and policy management experts (staff from natural resource administration departments, responsible for ensuring the compatibility of indicators with local policies). Their professional backgrounds span core domains including urban planning and design, historic building conservation, geographic information science, sustainable development, and ecological planning.
The consultation was conducted in two rounds of formal surveys (Appendix A and Appendix B): In the first round, the initial indicator system was revised based on experts’ comments to prioritize the importance of indicators. In the second round, the focus was placed on assigning indicator weights and defining evaluation criteria. Discrepancies were resolved through special interviews, and the final evaluation indicator system was confirmed by the expert panel upon review.
A combined subjective–objective weighting approach was used to determine indicator weights. For subjective weights, we applied the rank-order method (G1 method) based on expert rankings of indicator importance. For objective weights, we applied the entropy method, calculating weights from the dispersion of each indicator’s data. This combined approach avoided the limitations of any single weighting method, achieving an integrated result reflecting both expert judgment and data-driven variance (Table 2).
Table 2.
Weighting results for the SUF evaluation indices (Shenyang Nanshi area).
A multiplicative synthesis method based on the principle of minimum information entropy was adopted to optimally integrate the subjective weight ωk and objective weight ωoj for each indicator [34].
We derived the comprehensive weight ωj for each evaluation indicator using this method (via a Lagrange multiplier optimization).
2.4. Research Methodology Framework
After clarifying the study area characteristics, organizing the baseline data, and constructing an evaluation index system adapted to the Nanshi area, this section further integrates the “index–method–strategy” logical chain to form a methodology framework covering “system construction, form evaluation, and optimization guidance,” which provides technical support for subsequent result analysis. First, the adaptive construction of the sustainable urban form (SUF) evaluation index system is completed through the “goal–data–index” linkage logic; second, a combination of weighting methods, spatial analysis, and regression models is integrated to achieve quantitative measurement of SUF and identification of key driving factors in the area; third, targeted optimization strategies are proposed at the element, structure, and system levels based on evaluation results and problem diagnosis. Details are elaborated as follows (Figure 2):
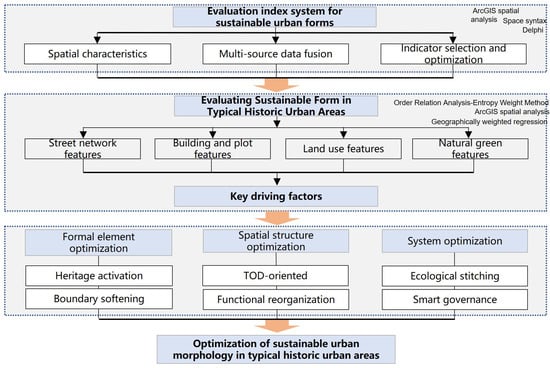
Figure 2.
Research methodology framework diagram.
(1) Construction of the SUF Evaluation Index System.
Combined with the regional characteristics of the Nanshi area (i.e., the coexistence of modern residential areas and relics of the modern commercial port) and constrained by the availability of multi-source data, a “goal–data–index” linked evaluation system was constructed. The specific process is as follows:
Regional characteristic anchoring: In response to the spatial differences between the “fine-grained street network of historic fabric” and “grid-patterned modern residential areas” in the study area, index dimensions suitable for the meso-micro scale were selected, focusing on the three goals of “resource efficiency, social equity, and ecological balance.”
Multi-source data matching: A “data-index” mapping relationship was established based on the sources of multi-source baseline data.
Index selection and validation: Through Delphi consultation with relevant industry experts and data integrity verification, an index system was formed that not only covers the needs of historical preservation and modern development in the area but also ensures data operability.
(2) SUF Evaluation Method for Typical Historic Urban Areas.
Centered on “quantitative measurement, key identification, and problem diagnosis,” a technology chain adapted to the Nanshi area was formed by integrating the order relation-entropy weight combination weighting method, ArcGIS spatial quantitative analysis, and geographically weighted regression (GWR) analysis to identify key driving factors.
(3) SUF Optimization Strategies.
Based on the “evaluation result–problem diagnosis–strategy matching” logic, combined with the key factors identified by the evaluation methods and problems in typical areas, a three-tier “element–structure–system” optimization system was constructed.
3. Results and Discussion
3.1. Spatial Differentiation Characteristics of SUF
The composite evaluation result of SUF in the Nanshi area was obtained through the weighted overlay analysis of the aforementioned indicators (Figure 3 and Figure 4), which intuitively reflected the spatial differentiation characteristics of the area. The natural breaks (Jenks) method was adopted to classify the composite scores into five levels, with higher levels indicating stronger overall resilience of the urban form. From Level 1 to Level 5, the areas were categorized into five cluster grades: “Level 1 low sustainability” “Level 2 moderately low sustainability,” “Level 3 medium sustainability,” “Level 4 moderately high sustainability,” and “Level 5 high sustainability.”
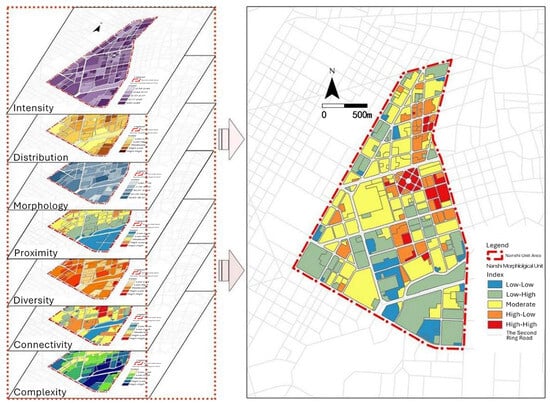
Figure 3.
Composite sustainable urban form evaluation map (grid-based) of Shenyang’s Nanshi area.
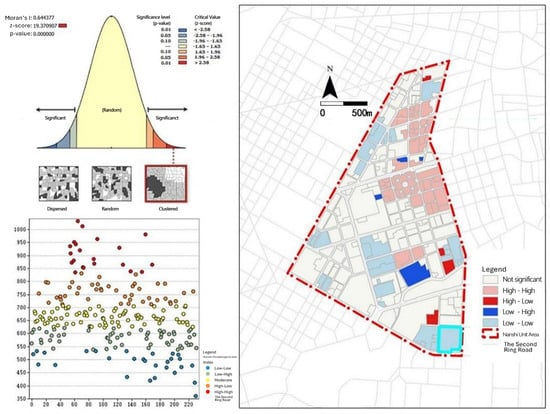
Figure 4.
Five-level clustering of sustainable urban form scores in Nanshi (natural break classification).
The spatial pattern can be summarized as follows:
(1) High-sustainability areas (Level 5, approx. 16% of the total area): These areas are concentrated in the Bagua Street Historic Block and along Bajing Street. They rely on the “small blocks, dense road network” fabric (road network density reaching 12 km/km2), high functional mix (mean SHDI = 1.62), and well-preserved historic interfaces, demonstrating outstanding performance in accessibility, connectivity, and diversity dimensions.
(2) Low-sustainability areas (Levels 1 and 2, 21% of the total area): These areas are mainly distributed in newly built residential areas along the Nanyun River (e.g., Luyuan Community and Ruifu Community) and the northwestern corner of the study area. These areas have significant shortcomings: fragmented green spaces (green coverage <12%), weak public transport services (bus route density 45% lower than the area’s average), and single functional type (mean SHDI = 0.78).
(3) Global spatial autocorrelation analysis: The global Moran’s I index of sustainability scores is 0.64 (z = 19.37, p < 0.05), indicating that the scores are not randomly distributed but exhibit significant positive spatial autocorrelation. Specifically, both high- and low-value areas exhibit an agglomerated distribution pattern.
3.2. Key Influencing Factors and Driving Mechanisms
A geographically weighted regression (GWR) model was employed to explore the determinants of the spatial pattern. The composite sustainability score served as the dependent variable, with three core variables—road network density, functional mix (Shannon’s diversity index, SHDI), and green space coverage—selected as independent variables for analysis (Table 3). The model’s goodness of fit (R2 = 0.68) indicated that these variables jointly explained 68% of the spatial differentiation in sustainability, thus demonstrating strong explanatory power.
Table 3.
Summary of GWR model results.
Based on the GWR results and further spatial analysis, the following drivers were identified:
(1) Road network density (β = 0.37, p < 0.01): As a primary positive driving factor, high road network density enables shorter travel distances and superior walkability. This aligned closely with the high scores of historic blocks and was consistent with the previous analysis of spatial differentiation characteristics (Figure 5).
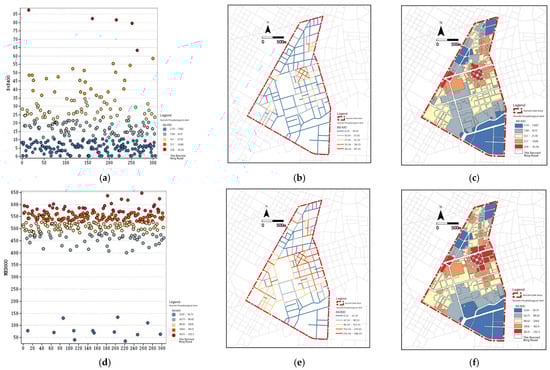
Figure 5.
Characteristics of betweenness centrality and closeness centrality in the Nanshi area. (a) BtE400 m Threshold scatter plot. (b) BtE400 m Threshold path diagram. (c) BtE400 m Threshold cell plot. (d) BtE800 m Threshold scatter plot. (e) BtE800 m Threshold path diagram. (f) BtE800 m Threshold cell plot.
(2) Functional mix (SHDI, β = 0.29, p < 0.05): This is another crucial positive driving factor. Mixed commercial-residential blocks (e.g., Bagua Street Historic Block) effectively reduce long-distance travel demand while simultaneously enhancing spatial vitality (Figure 6).
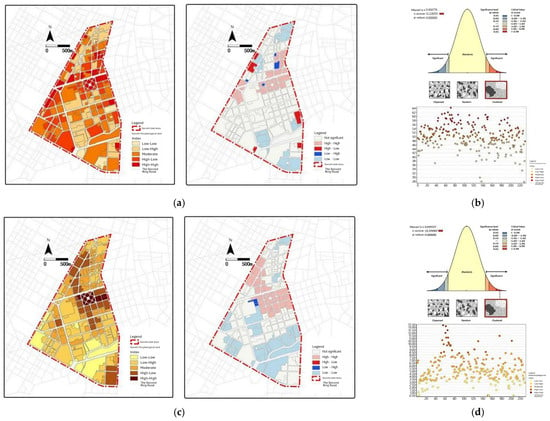
Figure 6.
Diversity and spatial distribution assignment and cluster analysis. (a) Representative areas for diversity metrics. (b) Representative areas for diversity metrics. (c) Representative areas for spatial distribution metrics. (d) Scatter plot of spatial distribution metrics.
(3) Green space coverage (β = 0.18, p < 0.05): It has a significant positive impact, although its influence intensity is relatively moderate with prominent spatial heterogeneity. The impact is more pronounced in areas along the Nanyun River (Figure 7).
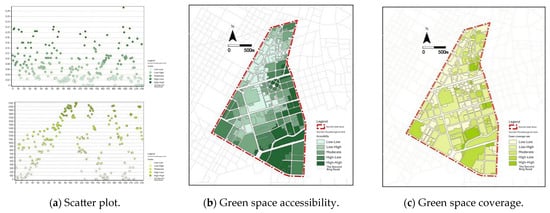
Figure 7.
Analysis of accessibility and hydrophilicity of park green spaces.
The aforementioned results indicated that the spatial pattern of sustainability in the Nanshi area was mainly dominated by historically inherited spatial fabric (high road network density) and functional layouts adapted to modern living needs (high functional mix). Ecological and transportation facilities served as important auxiliary driving factors, and their uneven spatial distribution further exacerbated the spatial differentiation of sustainability in the area.
3.3. Problem Diagnosis of Typical Areas
Based on the results of the comprehensive evaluation and cluster analysis, two typical areas were selected for in-depth diagnosis:
High–high cluster area (Bagua Street Historic Block): It has a high comprehensive sustainability score (0.82), with core advantages being high accessibility, high connectivity, and high diversity. However, it performs poorly in the complexity dimension, which is mainly reflected in an insufficient GVI (0.15). Given the impact of solid walls and building obstructions, ecological benefits have not been fully converted into residents’ perceived welfare.
Low–low cluster area (Luyuan Community): It has a relatively low comprehensive sustainability score (0.31), with core shortcomings focusing on the distribution and complexity dimensions. Insufficient accessibility to public service facilities (distance to the nearest hospital > 1200 m), fragmented green space distribution with poor accessibility (two-step floating catchment area, 2SFCA < 0.05), and a single building layout with low functional mix result in dual weaknesses in social and ecological benefits (Table 4).
Table 4.
Characteristics of typical clustered areas in the SUF evaluation.
4. Optimization Strategies for SUF
Based on the aforementioned quantitative diagnosis results, this study proposed a three-tier “element–structure–system” optimization strategy, aiming to systematically enhance the overall level of SUF in the Nanshi area.
4.1. Element Level: Historic Character Revitalization and Boundary Softening
Targeting high-value historic blocks (e.g., Bagua Street Historic Block), the strategy shifted focus from “strengthening advantages” to “addressing shortcomings,” by accurately responding to the inadequacy in the complexity dimension (Figure 8).
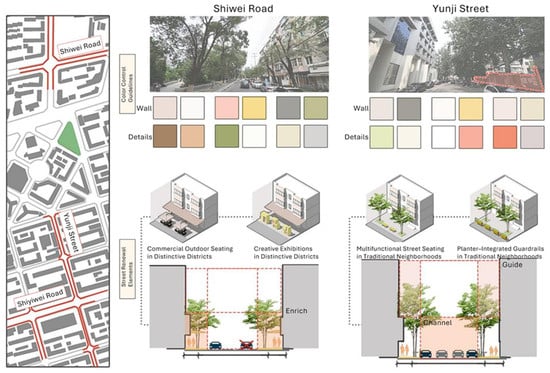
Figure 8.
Illustration of external space revitalization (façade improvements and greening elements) to enhance historic character and soften rigid boundaries.
Interface activation: This involves protective restoration of the facades of historic buildings and replacement of closed solid walls with permeable railings. The goal is to increase the GVI to above 0.25 while activating street interfaces and enhancing ecological perception and cultural vitality.
Flexible boundaries: This involves defining spaces within streets and lanes using movable flower boxes, vertical greenery, and other means. This not only preserves the historic charm but also improves ecological permeability and visual richness.
4.2. Structural Level: TOD-Oriented Development and Functional Restructuring
Targeting low-sustainability residential areas, the core strategy focused on structural reshaping, thereby addressing the two key shortcomings of transportation and functionality (Figure 9).
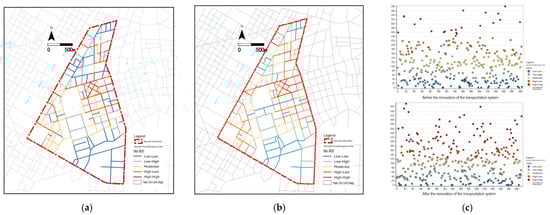
Figure 9.
Comparison of road network connectivity before and after intervention (permeability at 800-m radius), demonstrating the effect of adding links and increasing intersection density. (a) Pre-renovation street network integration (800 m). (b) Post-renovation street network integration (800 m). (c) Scatter plot comparing pre- and post-renovation street network integration.
Transportation structure optimization: This involved strengthening transit-oriented development (TOD) mode; densifying secondary road networks, opening up dead-end streets, and enhancing road network density and connectivity within the 500-m core zone around Heping Street Station; and promoting “demand-responsive transit” by dynamically increasing bus service frequency along the Nanyun River, thereby addressing the supply–demand mismatch in public transport accessibility.
Functional mix enhancement: This involves introducing convenient business formats, such as convenience stores and fresh food stalls, through “community micro-renewal” in the core areas of large residential communities (e.g., Luyuan Community). The goal is to raise the SHDI of the functional mix from 0.78 to above 1.0, thus establishing a comprehensive 15-min community life circle.
4.3. System Level: Ecological Connectivity and Smart Governance
From the perspective of the district’s overall system, this level focused on resolving core issues of ecological fragmentation and inadequate governance efficiency (Table 5).
Table 5.
Key nodes for green space system renewal in the Nanshi area.
Ecological corridor connectivity: This involves clearing illegal constructions along the banks, opening up continuous waterfront non-motorized corridors, and linking scattered green patches to build an integrated blue-green ecological network, with the Nanyun River serving as the core ecological axis. Integrated with the construction of “pocket parks,” green space services are extended to the high-density historic districts in the north, thereby enhancing the inclusiveness of ecological welfare.
Smart governance platform: This involves establishing a district-level City Information Modeling platform based on integrated GIS–BIM technology. This platform integrates multi-source real-time dynamic data to conduct dynamic simulation and effectiveness prediction of optimization strategies, ultimately forming an intelligent closed-loop governance system of “monitoring–evaluation–early warning–optimization.”
5. Discussion and Prospects
5.1. Discussion of Research Findings
Through the integration of multi-source data and quantitative analysis, this study establishes a sustainability evaluation system for historic urban areas at the meso-micro scale. It reveals the spatial differentiation characteristics and driving mechanisms of sustainable urban form in Shenyang’s Nanshi Area, and proposes a differentiated optimization strategy based on the “element-structure-system” framework.
Combined with the research process and outcomes, discussions are conducted from three dimensions: methodological applicability, core driving mechanisms, and the “protection-renewal” logic. This aims to provide more universal theoretical references and practical implications for analogous studies on historic urban areas.
(1) Applicability and Limitations of the Evaluation Method
The Jenks Natural Breaks method was employed in this study to classify comprehensive sustainability scores into five grades. By identifying the natural clustering characteristics of data to determine classification boundaries, this method maximizes the manifestation of the “high-low agglomeration” spatial differentiation pattern within the study area. Moreover, the classification results are highly congruent with the actual sustainability disparities between the historic Bagua Street and the newly built Luyuan Community, providing clear spatial guidance for subsequent problem diagnosis and strategy formulation.
However, its subjective limitations warrant objective acknowledgment. Firstly, the classification results are contingent upon data distribution characteristics; the presence of extreme values in the research data may compromise the rationality of classification boundaries. Secondly, although the number of grades references research conventions and expert opinions, sensitivity analysis has not been performed to verify the impact of different classification numbers on result interpretation. Moving forward, comparative studies could be conducted by introducing methods such as K-means clustering and equal-interval classification. Alternatively, Bootstrap sampling could be utilized to verify result stability, thereby mitigating subjective interference.
(2) Analysis of Core Driving Mechanisms
Results from the Geographically Weighted Regression (GWR) indicate that road network density, degree of functional mixing, and green space coverage are the key driving factors influencing the sustainable form of the Nanshi Area. Through the coordination and constraint of transportation, functionality, and ecology, these three factors collectively shape the spatial pattern of sustainability in the area. The specific mechanisms are as follows:
Road network density: A coupling medium of historical texture and modern travel demands. Areas with high sustainability in the Nanshi Area (e.g., Bagua Street) feature high road network density, and the historical “small-block, dense-road-network” texture is well-suited to modern low-carbon travel needs. On one hand, the dense branch road network shortens walking distances; the proportion of residents in this area who can reach bus stops within 5 min on foot is significantly higher than in newly built residential areas, effectively reducing motor vehicle dependence. On the other hand, road network connectivity enhances spatial permeability, linking commercial and cultural functions to form walkable, vibrant neighborhoods. In contrast, influenced by “courtyard-style” planning under the planned economy, newly built residential areas exhibit extremely low road network density, with numerous dead-end roads and gated communities. This increases travel costs, disrupts spatial continuity, and becomes a bottleneck for sustainability improvement.
Degree of functional mixing: A core pillar for spatial vitality and low-carbon transition. The positive driving effect of functional mixing essentially reflects a chain reaction of job-housing balance, reduced travel demand, and enhanced vitality. The Bagua Street area integrates commercial, residential, and cultural functions; a high proportion of residents have a commute distance of less than 1 km on workdays, and their leisure activities are concentrated within the area on weekends, effectively reducing long-distance motorized travel. Meanwhile, functional mixing extends the utilization time of neighborhoods, improving spatial vitality and resource efficiency. In contrast, newly built residential areas have a single functional orientation; residents must travel to commercial districts 2–3 km away for consumption, increasing carbon emissions and resulting in a “vitality vacuum” during non-peak residential hours.
Green space coverage: A link translating ecological benefits into residents’ well-being. Although the positive impact of green space coverage is relatively modest, its dual “ecological-social” value is significant. Areas with high green space coverage, such as the vicinity of Luxun Park, improve the microclimate through vegetation carbon sequestration, temperature reduction, and humidity enhancement, while providing leisure spaces—contributing to high levels of residents’ life satisfaction. However, the benefits of green space are also dependent on “accessibility and connectivity”. Although the green space coverage of newly built residential areas along the South Canal reaches 15%, the green space is fragmented and poorly accessible, preventing ecological benefits from being translated into perceptible well-being for residents. This also explains why some areas with high green space coverage still fall into the low-sustainability cluster.
(3) Practical Implications of the “Protection-Renewal” Mechanism
One of the values of this study lies in establishing a sustainable development mechanism of “protection-first, adaptation-oriented renewal” for historic urban areas, specifically reflected in the following aspects:
Protecting historical texture and consolidating the “spatial foundation” of sustainable form: Empirical findings from the Nanshi Area demonstrate that the historical “small-block, dense-road-network” texture is not an “outdated relic” but a high-quality resource compatible with modern low-carbon demands. Compared with newly built residential areas, historic blocks inherently excel in indicators such as road network density and spatial connectivity. Through protective renovation, sustainability can be enhanced at the lowest transformation cost. This protection-led renewal model not only avoids damage to historical context caused by “large-scale demolition and reconstruction” but also provides a low-cost pathway for the low-carbon transition of high-density historic urban areas.
Precisely addressing renewal shortcomings and resolving the contradiction between protection and development: Sustainable development of historic urban areas does not equate to “full-element protection”; instead, targeted renewal should be implemented for ecological and functional deficiencies on the basis of protecting core textures. For example, while Bagua Street retains intact historical texture, it suffers from insufficient green space and low ecological benefits. Through micro-renewal measures such as “flexible boundary renovation” and “pocket park insertion”, the green view index can be improved without compromising historical style and features. Newly built residential areas such as Luyuan Community need to compensate for planning flaws through “structural restructuring” to achieve coordinated development with the overall sustainability of the area. This “differentiated renewal” mechanism not only avoids the decline in spatial vitality caused by “rigid protection” but also prevents the disruption of historical context due to “excessive renewal”, thereby achieving a balance between protection and development.
5.2. Future Prospects
The primary innovation of this study lies in the in-depth integration of multi-source big data with urban morphology theory, enabling refined measurement and diagnosis of the sustainability of historic urban areas. Future research can be further advanced in the following directions:
(1) Dynamic simulation and prediction: Introduction of models such as Cellular Automata (CA) and Agent-Based Models (ABM) to simulate long-term sustainability effects under different renewal strategies.
(2) In-depth integration with “dual carbon” goals: Incorporation of carbon emission accounting into the evaluation system to explore the quantitative relationship between morphological indicators and carbon emissions in depth.
(3) Advanced research on social equity: Integration of more granular population and socioeconomic data to assess the differentiated impacts of morphological optimization on diverse social groups (e.g., the elderly, children), thereby enhancing the social inclusiveness of strategies.
Author Contributions
Conceptualization, J.Y., L.Z. and H.S.; Methodology, J.Y. and H.S.; Formal analysis, J.Y. and C.G.; Investigation, J.Y. and C.G.; Data curation, J.Y. and C.G.; Writing—review & editing, J.Y., C.G. and H.S. All authors have read and agreed to the published version of the manuscript.
Funding
This research was funded by (1) General Program of NSFC: Quantitative Analysis and Evaluation System of Cold-Region Resilient Urban Form from Meso-Micro Perspectives (Grant No. 52478024); (2) Key R&D Program of the Joint Program of Liaoning Provincial Science and Technology Plan: Research on Resilience Evaluation and Renewal Key Technologies of Existing Urban Spatial Form in Liaoning (Grant No. 2025JH2/101800278); (3) Basic Scientific Research Program of the Department of Education of Liaoning Province:Research on Thermal Regulation Efficiency and Optimization Strategies of Urban Green Space System Based on “Source-Sink” Theory (Grant No. LJ212510153016).
Data Availability Statement
The original contributions presented in this study are included in the article. Further inquiries can be directed to the corresponding author.
Conflicts of Interest
The authors declare no conflicts of interest.
Appendix A. Questionnaire on Living Environment in the Nanshi Area, Shenyang
- Dear Resident,
To improve the quality of the living environment in the Nanshi Area, we are conducting a survey on the sustainability of urban form. This questionnaire will take approximately 5–10 min to complete. Your honest feedback will serve as a crucial basis for the renewal of the area. The survey is conducted anonymously, and all data will be used exclusively for academic research. Thank you for your support!
- 1. Basic Information
- Age:
□ Under 18 □ 18–30 years old □ 31–50 years old □ 51–70 years old □ Over 70 years old
- Duration of Residence in the Nanshi Area:
□ Less than 1 year □ 1–3 years □ 3–5 years □ 5–10 years □ Over 10 years
- Occupation:
□ Student □ Office Worker □ Retired □ Freelancer □ Other
- Main Daily Activity Range (Multiple choices allowed):
□ Inside the residential area □ Surrounding commercial blocks □ Public green spaces/parks □ Transportation hubs □ Other
- 2. Evaluation of Subjective Indicators (Please choose based on your actual feelings)
- Path Continuity (A2):
- Do you think the walking routes from your home to surrounding destinations (e.g., supermarkets, parks) are smooth?
□ Very smooth (5 points) □ Relatively smooth (4 points) □ Average (3 points) □ Not very smooth (2 points) □ Not smooth at all (1 point)
- Are there dead-end roads or gated communities in your area that affect walking?
□ None at all (5 points) □ Few (4 points) □ Average (3 points) □ Many (2 points) □ Very many (1 point)
- Place Character (C3):
- Do you think the Nanshi Area has unique cultural or historical characteristics?
□ Very distinct (5 points) □ Relatively distinct (4 points) □ Average (3 points) □ Not very distinct (2 points) □ No characteristics (1 point)
- Can you perceive the historical context of the area through the existing architecture, streets, or public spaces?
□ Fully perceivable (5 points) □ Partially perceivable (4 points) □ Average (3 points) □ Hardly perceivable (2 points) □ Not perceivable at all (1 point)
- Spatial Richness (F2):
- Are you satisfied with the diversity of architectural styles, greening layouts, and public spaces in the area?
□ Very satisfied (5 points) □ Relatively satisfied (4 points) □ Average (3 points) □ Not very satisfied (2 points) □ Very dissatisfied (1 point)
- Do you think the spatial hierarchy in the area (e.g., the mix of high-rise and low-rise buildings, landscape nodes) is rich?
□ Very rich (5 points) □ Relatively rich (4 points) □ Average (3 points) □ Not very rich (2 points) □ Very monotonous (1 point)
- 3. Open-Ended Questions
- Which aspects of the Nanshi Area do you think need the most improvement? (Multiple choices allowed)
□ Traffic convenience □ Protection of historic buildings □ Green environment □ Public service facilities □ Other __________
Do you have any suggestions for the future development of the Nanshi Area?
- _____________________________________________________________________________
- End of Questionnaire. Thank you for your valuable opinions!
Appendix B. Expert Consultation Questionnaire for the Measurement and Evaluation Index System of Sustainable Urban Form in the Nanshi Area
- Dear Expert,
This study aims to construct a scientific and reasonable evaluation system for the measurement of sustainable urban form (SUF). We sincerely invite you to participate in the first round of Delphi expert consultation. Your professional opinions will play a pivotal role in index screening and weight determination. The questionnaire is conducted anonymously, and all data will be used exclusively for academic research. Thank you for your support!
- 1. Research Background and Explanation
Based on the preliminary achievements in constructing the SUF evaluation index system for the Nanshi Area of Shenyang, 23 evaluation indicators have been initially selected. Further expert scoring is now required to screen key indicators, ultimately forming a SUF assessment framework adapted to the renewal of historic urban districts. This round of the questionnaire requires you to score the importance of each indicator and put forward optimization suggestions.
- 2. Scoring Instructions
Scoring Criteria: A 5-point Likert scale is adopted, as follows:
□ 1 point (Not important at all) □ 2 points (Unimportant) □ 3 points (Average) □ 4 points (Important) □ 5 points (Very important)
Indicator Definitions: Please refer to the indicator explanations in Appendix A for scoring.
Screening Principles: Indicators will be retained if they meet the criteria of Relative Importance Index (RIIi) ≥ 0.80 and Coefficient of Variation (δi) ≤ 0.25.
- 3. Indicator Scoring Table
Based on your professional experience, please score the importance of the following indicators (Please tick √ in the corresponding box):
| Benchmark Layer | Criterion Layer | Indicator Layer | Score |
| Street Network Characteristics | Connectivity | A1 Plot Enclosure | □1 □2 □3 □4 □5 |
| A2 Path Continuity | □1 □2 □3 □4 □5 | ||
| A3 Road Network Density | □1 □2 □3 □4 □5 | ||
| Proximity | B1 Closeness Centrality | □1 □2 □3 □4 □5 | |
| B2 Betweenness Centrality | □1 □2 □3 □4 □5 | ||
| B3 Public Transport Accessibility | □1 □2 □3 □4 □5 | ||
| Building & Plot Characteristics | Morphology | C1 Interface Enclosure Degree | □1 □2 □3 □4 □5 |
| C2 Sky View Factor (SVF) | □1 □2 □3 □4 □5 | ||
| C3 Place Character | □1 □2 □3 □4 □5 | ||
| Intensity | D1 Floor Area Ratio (FAR) | □1 □2 □3 □4 □5 | |
| D2 Plot Compactness | □1 □2 □3 □4 □5 | ||
| D3 Building Compactness | □1 □2 □3 □4 □5 | ||
| Land Use Characteristics | Distribution | E1 Medical Service Centrality | □1 □2 □3 □4 □5 |
| E2 Daily Service Centrality | □1 □2 □3 □4 □5 | ||
| E3 Cultural & Educational Service Centrality | □1 □2 □3 □4 □5 | ||
| E4 Commercial Service Centrality | □1 □2 □3 □4 □5 | ||
| Diversity | F1 Functional Mixity | □1 □2 □3 □4 □5 | |
| F2 Spatial Richness | □1 □2 □3 □4 □5 | ||
| F3 Street Traditionality | □1 □2 □3 □4 □5 | ||
| Natural Green Space Characteristics | Complexity | G1 Street Green View Index | □1 □2 □3 □4 □5 |
| G2 Green Space Coverage Rate | □1 □2 □3 □4 □5 | ||
| G3 Green Space Accessibility | □1 □2 □3 □4 □5 | ||
| G4 Hydrophilic Index | □1 □2 □3 □4 □5 |
- 4. Open-Ended Suggestions
Which of the above indicators do you think need adjustments in definition or naming? Please explain the reasons.
____________________________________________________________________
Do you suggest adding other relevant indicators? Please list them and provide a brief explanation.
____________________________________________________________________
Do you have any other suggestions for the construction of the indicator system in this study?
____________________________________________________________________
- 5. Expert Information
- For the convenience of subsequent analysis, please provide the following information (to be anonymized):
- Field of Expertise:
□ Urban Planning □ Architecture □ Landscape Architecture □ Other __________
- Academic Title/Position:
□ Professor/Researcher □ Associate Professor/Associate Researcher □ Lecturer/Assistant Researcher □ Engineer □ Other __________
- End of Questionnaire. Thank you for your valuable opinions!
References
- Liu, X.Z.; Li, Y. Research Progress on the Relationship Between Urban Spatial Form and Carbon Emissions Based on Cite Space. J. Earth Environ. 2023, 14, 663–682. [Google Scholar]
- United Nations. Transforming Our World: The 2030 Agenda for Sustainable Development; United Nations: New York, NY, USA, 2015. [Google Scholar]
- Jenks, M.; Burgess, R. Compact Cities: Sustainable Urban Forms for Developing Countries; Spon Press: London, UK, 2000. [Google Scholar]
- Kropf, K. The Handbook of Urban Morphology; John Wiley & Sons: Hoboken, NJ, USA, 2018. [Google Scholar]
- Salat, S. Urban and Morphology: Towards a Sustainable Urbanisation; Presses de l’école Nationale des Ponts et Chaussées: Paris, France, 2013. [Google Scholar]
- Lohrey, S.; Creutzig, F. A “sustainability window” of urban form. Transp. Res. Part D Transp. Environ. 2016, 45, 96–111. [Google Scholar] [CrossRef]
- Pan, W.J. Self-adaptive hybrid urban morphologies community (HUMC, Its shared environment and soft intervention for sustainable urban governance. Build. Environ. 2023, 236, 110251. [Google Scholar] [CrossRef]
- Moroke, T.; Schoeman, C.; Schoeman, I. Developing a neighbourhood sustainability assessment model: An approach to sustainable urban development. Sustain. Cities Soc. 2019, 48, 101433. [Google Scholar] [CrossRef]
- Bibri, S.E.; Krogstie, J. ICT of the new wave of computing for sustainable urban forms: Their big data and context-aware augmented typologies and design concepts. Sustain. Cities Soc. 2017, 32, 449–474. [Google Scholar] [CrossRef]
- Kropf, K. Aspects of Urban Form. Urban Morphol. 2009, 13, 105–120. [Google Scholar] [CrossRef]
- Salat, S. Cities and Forms: Towards Sustainable Urbanization; Hong Kong International Culture Publishing Co., Ltd.: Hong Kong, China, 2013. [Google Scholar]
- Dai, S.Z. From “Dense/Dispersed” to “Compact/Loose”: Rethinking Sustainable Urban Form and the Planning of Qingpu, Shanghai. Time + Archit. 2005, 5, 90–95. [Google Scholar]
- Lin, Z. Construction of Sustainable Form for Suburban New Towns; Chongqing University: Chongqing, China, 2009. [Google Scholar]
- Li, X.; Ye, J.A. Constrained Cellular Automata (CA) Evolution Model and Simulation of Sustainable Urban Development Form. Acta Geogr. Sin. 1999, 4, 3–12. [Google Scholar]
- Hu, J.H.; Ren, L.J.; Liu, L.R.; Liu, D.F.; Yun, Y.X. Construction of Urban Morphological Evolution Model of Zhengzhou from the Perspective of Element Analysis. J. Guilin Univ. Technol. 2018, 38, 263–268. [Google Scholar]
- Hu, C. Research on Revitalization Strategies of Historic Districts Based on a Comprehensive Ecological Perspective; Southeast University: Nanjing, China, 2022. [Google Scholar]
- Liu, P.; Neppl, M. Research on Plot Fabric Protection of Historic Cities in China: Connotation, Evolution and Strategies. Urban Plan. Forum 2020, 5, 92–99. [Google Scholar] [CrossRef]
- Lang, W.; Li, X.; Chen, T. Assessing the Sustainability of Urban Renewal Modes in Hong Kong from a Social Perspective. Urban Plan. Int. 2018, 33, 63–67. [Google Scholar] [CrossRef]
- Zhong, L.; Xu, L. Research on the Matching Relationship Between Community Living Circle Service Facilities and Population Based on Multi-source Data—A Case Study of Central Ningbo. Shanghai Urban Plan. Rev. 2022, 2, 101–107. [Google Scholar]
- Lü, H.P.; Wang, H. Research on Shenyang’s Modern Concession Area and Its Urban Heritage Value. In Proceedings of the 8th Shenyang Science and Technology Academic Annual Conference, Shenyang, China, 30 September 2011. [Google Scholar]
- Guan, C.; Sun, H.; Yu, S. Research on the Spatial Differentiation and Causes of Spatial Vitality in Urban Core Areas Based on Multi-source Data—A Case Study Within the Second Ring Road of Shenyang. In Proceedings of the 2024 China Urban Planning Annual Conference, Qingdao, China, 7 September 2024. [Google Scholar]
- Shenyang Municipal Bureau of Planning and Natural Resources. Shenyang Historical and Cultural City Protection Plan (2011–2020); Shenyang Municipal Bureau of Planning and Natural Resources: Shenyang, China, 2011. [Google Scholar]
- Jiang, Z.D.; Yang, F. Simulation Study on the Impact of Urban Morphological Factors on Building Energy Consumption at the Block Scale. Build. Sci. 2022, 38, 140–149. [Google Scholar]
- Bian, J. Urban Form: Evolution and Development—Research on Xiamen’s Urban Spatial Development Planning; China Architecture & Building Press: Beijing, China, 2013. [Google Scholar]
- Frey, H. Designing the City: Towards a More Sustainable Form; E & FN Spon: London, UK, 1999. [Google Scholar]
- Leng, H.; Zhao, Y.; Yuan, Q. Carbon Reduction Paths and Strategies Through Urban Form Regulation. Urban Plan. Forum 2023, 1, 54–61. [Google Scholar]
- Wang, Y. Towards New Communities: Theory and Methods of Integrated Construction of Urban Residential Communities; Southeast University Press: Nanjing, China, 2003. [Google Scholar]
- Campos-Sánchez, F.S.; Abarca-Álvarez, F.J.; Reinoso-Bellido, R. Assessment of Open Spaces in Inland Medium-sized Cities of Eastern Andalusia (Spain) Through Complementary Approaches: Spatial-configurational Analysis and Decision Support. Eur. Plan. Stud. 2019, 27, 1270–1290. [Google Scholar] [CrossRef]
- Li, C. Research on Urban Block Spatial Renewal Mode of Xi’an Based on the Concept of “Small Blocks and Dense Road Networks”; Xi’an University of Architecture and Technology: Xi’an, China, 2022. [Google Scholar]
- Pili, S.; Grigoriadis, E.; Carlucci, M.; Clemente, M.; Salvati, L. Towards Sustainable Growth? A Multi-criteria Assessment of (Changing) Urban Forms. Ecol. Indic. 2017, 76, 71–80. [Google Scholar] [CrossRef]
- Xiao, H.; An, Q.; Sheng, Q. Carbon Emission Evaluation of Low-carbon Ecological Cities in the New Data Environment—A Case Study of Jinan Western New Town. Mod. Urban Res. 2019, 10, 65–74. [Google Scholar]
- Yang, T. Sustainable Urban Form from the Perspective of Space Syntax. Beijing Plan. Rev. 2008, 4, 93–100. [Google Scholar]
- Long, Y.; Zhou, Y. Street Urbanism: Urban Research and Design Practice in the New Data Environment. Time + Archit. 2017, 1, 6–13. [Google Scholar]
- Wang, F. Spatial Quantitative Evaluation and Planning Strategies of the Central Urban Area of Hancheng City from the Low-Carbon Perspective; Chang’an University: Chang’an, China, 2023. [Google Scholar]


Disclaimer/Publisher’s Note: The statements, opinions and data contained in all publications are solely those of the individual author(s) and contributor(s) and not of MDPI and/or the editor(s). MDPI and/or the editor(s) disclaim responsibility for any injury to people or property resulting from any ideas, methods, instructions or products referred to in the content. |
© 2026 by the authors. Licensee MDPI, Basel, Switzerland. This article is an open access article distributed under the terms and conditions of the Creative Commons Attribution (CC BY) license.