Abstract
The built environment is responsible for 40% of global energy demand, and, in line with urbanisation and population growth, this demand is expected to increase steadily. Urban areas are mostly composed of materials that can absorb energy from solar radiation and dissipate the accumulated energy in the form of heat. This study integrates a UAV-based Zenmuse XT S IR camera and handheld FLIR C5 thermal camera with ENVI-met microclimate simulation, providing quantitative insights for sustainable urban planning. From the 24 h experiment results, the characteristics of building surface materials are profiled for lowering energy use for internal thermal control during the operation stage of buildings. This study shows that building surface materials with the lowest solar reflectance and highest specific heat capacity reached a peak surface temperature of 73.5 °C in Jakarta (tropical hot climate) and 44.3 °C in Xiamen (subtropical late winter climate). In contrast, materials with the highest solar reflectance and lowest specific heat only reach a peak surface temperature of 58.1 °C in Jakarta and 27.9 °C in Xiamen. The peak surface temperature occurs at 2 PM in the afternoon. Moreover, we demonstrate the capability of an infrared drone to identify the peak surface temperatures of 55.8 °C at 2 PM in the study area in Xiamen. In addition, the ENVI-met validated model shows satisfactory correlation values of R > 0.9 and R2 > 0.8. This result demonstrates UAV-IR and ENVI-met simulation integration as a scalable method for city-level UHI diagnostics and monitoring.
1. Introduction
Urban heat island (UHI) is a serious threat that has been intensively investigated, impacting the well-being of urban dwellers, the environment, and energy consumption in major cities. This urban phenomenon has been observed in over four hundred major cities in the world [1]. The UHI effect is mostly influenced by the specific local climate, urban material composition, city layout, and urban landscape characteristics. It may increase the mean urban ambient temperature from 5 °C to 10 °C compared to the rural area in the vicinity [2]. The UHI effect is most pronounced in areas with low wind speed and clear sky conditions, while precipitation decreases the overheating effects in the urban environment. The overheating condition caused by UHI significantly impacts the energy demand and electricity generation in cities. It increases the mean energy requirements in cities close to 0.74 (±0.67) kWh per square metre and per degree temperature increase, which is equivalent to 237 (±130) kWh or 0.103 (±0.056) metric tons of CO2 [2]. In addition, the peak electricity requirements in cities are increased by 21 (±10.4) W per person and per degree Celsius [3]. The UHI has a high impact on human health and well-being. Studies show that some health issues are correlated to extreme urban ambient temperatures. Building exterior materials composing the urban fabric greatly influences the thermal balance of cities [2]. Materials that have high thermal radiation absorbance capabilities exhibit high surface temperatures (Ts) and release sensible heat to the environment, increasing the ambient air temperature (Ta). Therefore, it is important to have a system that is robust, practical, and efficient in monitoring and evaluating the thermal performance of building envelope materials.
In the past decade, there have been extensive studies regarding UHI mitigation strategies around the world [4,5,6,7,8,9]. These strategies include vegetation covers, evapotranspiration, water bodies, and high-albedo surface materials [10,11]. It has been shown using field measurements and simulations by computer that green infrastructure has a significant effect on reducing UHI effects. A recent study shows that urban vegetation has a cooling effect, potentially lowering air temperatures by as much as 3 °C [12]. Green infrastructure like green roofs, parks, and permeable surfaces has the capability of reducing heat and energy inputs using evapotranspiration that occurs within plants. It also can decrease roof surface temperature efficiently, as it provides shading and insulation from direct sunlight during the day by up to 24.0 °C to 33.4 °C [13]. In terms of surface materials, materials such as asphalt concrete with low solar reflectance and high solar absorbance could result in a surface temperature up to 60 °C in the hot summer season [14]. To mitigate this, building roofs and pavements could be coated or painted with cool materials that have higher albedo and lower solar absorbance to reflect solar radiation and reduce heat absorbance from the sun.
UHI has been monitored mainly using ground weather station data and remotely sensed data. Weather stations provide meteorological data such as wind speed, relative humidity (RH), air temperature, and precipitation. Remotely sensed data are gathered from satellite remote sensing, planes, and unmanned aerial vehicles (UAVs). These current methods have several limitations. For example, ground weather stations require a high cost to maintain the system, and their inability to access hard-to-reach areas results in uneven distribution. Increased distance from the weather station correlated with decreased data accuracy. Satellite remote sensing could measure surface temperature and quantify the impact of UHI on large urban areas. However, it has a low spatial data resolution (30 m), and data are not readily available for 24 h, making it hard to pinpoint the source of urban hot spots in detail during daylight and nighttime. Despite significant advances, few studies have directly validated UAV-IR temperature mapping with ENVI-met simulations under distinct climatic conditions. To bridge the gap in UHI monitoring, an infrared (IR) camera mounted on a UAV is proposed for urban hotspot identification in urban areas. IR cameras have become increasingly common in identifying thermal bridges and leakages on buildings [15]. The application of IR in monitoring urban environments is still underexplored. Some preliminary research shows that using thermal imaging technology to monitor the urban heat island effect could be more practical [16,17,18].
Regarding surface materials, temperature is directly linked to a larger urban scale case study. It is hypothesised that IR thermal imaging is a facile technique for urban hotspot identification, as guidance for weather station placements and comparison with ENVI-met microclimate simulations. By combining in situ measurements and simulation as a mixed approach, we proposed a method that allows active intervention on the urban hotspots, which represents a step forward in the field. This study applies IR thermal imagery to monitor the microclimate and temperature hot spots in a built environment, demonstrating the feasibility of the technology as a novel approach to improve UHI monitoring systems. By integrating the technologies into the empirical study, we address the following research questions:
(1) What is the impact of building surface materials’ colours and properties on the surface temperature of building surface materials?
(2) Do building surface materials, colours, and properties impact the surrounding microclimate (air temperature) on an urban scale?
The study proposes a validated workflow combining empirical UAV-IR data and ENVI-met simulations for urban material heat assessment. Urban planners, governments, and researchers could apply this as a rapid, low-cost approach to assess the current urban microclimate conditions and plan potential UHI mitigation strategies. The research objective of this study is to identify the effects of different surface materials on surface temperature and microclimate in the urban context.
2. Materials and Methods
This section presents the framework of this study, and then the selected materials and study area. According to the framework, the testing procedures are detailed: TASI TA612C K-type thermocouples (Suzhou TASI electronics, Suzhou, China) and an FLIR C5 IR camera (Teledyne FLIR, Wilsonville, OR, USA) were applied to monitor the temperature of the selected building surface materials. Then, DJI Mavic 3 Pro UAV (SZ DJI Technology, Shenzhen, China) and DJI Matrice RTK 200 Zenmuse XT S UAV-IR (SZ DJI Technology, Shenzhen, China) were applied to monitor the selected study area. Finally, the ENVI-met simulation combining in situ experiment data and a set of reasonable default parameters was performed to visualise the temperature distribution in the microclimate of the study area.
2.1. Study Framework
In this study, we proposed a novel method to evaluate the urban environment using a combination of field experiments and simulation studies. Initially, the building materials were evaluated using an IR camera and a thermocouple. Based on the results, we expanded the scale of the materials monitoring in our community-scale study area. Finally, using the validated simulation model, we evaluated the material performance and microclimate conditions in the area. The study steps are as follows (Figure 1).
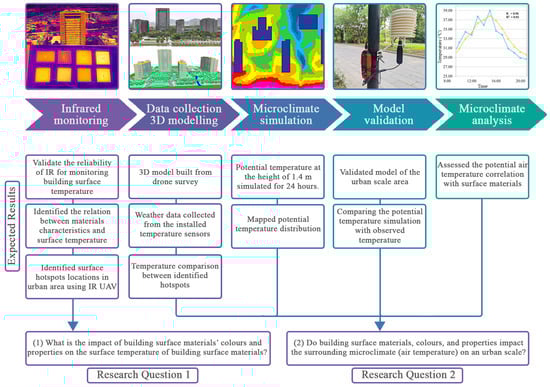
Figure 1.
Research framework.
(1) Different building surface materials were monitored using a handheld IR camera and a K-type thermocouple for 24 h during a typical hot (Jakarta, Indonesia) and mild cold weather (Xiamen, China). The results were evaluated to understand how the common materials perform under different climates and how accurate the IR thermal camera was compared to K-type thermocouples. Additionally, an IR UAV was used to capture aerial IR images of the IUE campus in Xiamen, China. (2) A combination of sensors and a UAV was used to perform data collection of the study area in the IUE campus, Xiamen, China. Aerial images were taken to generate a detailed 3D model of the study area showing the existing materials and vegetation. This model will be used as a reference during the ENVI-met modelling process. In addition, six ground temperature sensors were placed in the study area to gather weather data. The placement locations were based on the hotspots and cold spots identified in the captured IR aerial images of the study area. (3) The potential air temperature of the study area was generated using ENVI-met V5.6.1. The collected data from the previous steps were used as input data for the simulation. (4) The simulated model was validated using the previously gathered weather data. (5) Using the validated model, the current simulated microclimate was analysed and compared to observed temperature data.
2.2. Study Areas
In this study, we selected two study areas to monitor the building sample materials during mild and hot climatic conditions. The areas selected were Jakarta, Indonesia with tropical hot climate conditions (Köppen Am) and Xiamen in Fujian, China with a subtropical monsoon climate (Köppen Cfa). In addition to surface temperature monitoring, ambient temperature and relative humidity data from nearby weather stations in Jakarta (JK, 96745) and Xiamen (FJ, 59134) were used as a comparison. The material samples were monitored for 24 h on 8 February 2024 in Jakarta and 24 February 2024 in Xiamen. The monitoring results from both areas were compared and temperature trends were identified. The annual average temperature of Jakarta in 2024 was 29.1 °C, higher compared to Xiamen’s average annual temperature of 22.8 °C. During the experiment period in February 2024, Jakarta was experiencing hot and humid temperature with the average mean temperature of 28.5 °C compared to Xiamen’s mild winter with mean temperature of 15.7 °C. During this month, Jakarta has 0 heating degree days and 306 cooling degree days, while Xiamen has 29 cooling degree days and 42 heating degree days. Jakarta has a slightly higher annual solar irradiance of 1716 kWh/m2 compared to Xiamen 1493 kWh/m2 [19,20,21,22].
For the community-scale temperature monitoring, we selected the Institute of Urban Environment, Chinese Academy campus in Xiamen, China with the study area size of 228 m × 288 m, 65,664 m2 (Figure 2). The campus comprised five low- and high-rise buildings with local building surface materials (detailed in Section 2.2), local green vegetation, and a water body. This part of the experiment was conducted on 26 August 2024 during summertime in Xiamen. Multiple studies have also used Xiamen city as a case study for urban microclimate and UHI mitigation strategies, which were used as a reference with this study [21,22,23,24,25,26].
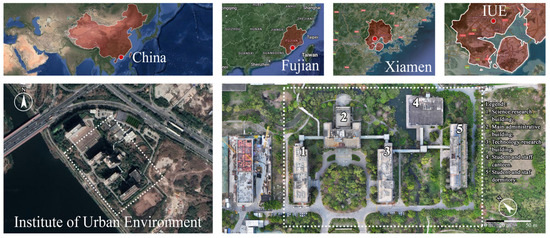
Figure 2.
Study area selected located in Xiamen, China Institute of Urban Environment.
2.3. Material Samples
The samples we selected for this study were based on field observation of the commonly used building surface materials in Xiamen (Figure 3). Samples such as ceramic (CR-WT), pinewood (WB-BG), concrete (C-GY), and andesite (A-BN) comprised different material compositions but identical thickness and size. The other set of samples were cement boards with identical dimensions, but with different colours which were light grey (CB-LG), brown (CB-BN), grey (CB-GY), and black (CB-BL). The material specifications, descriptions, and dimensions are detailed in Table 1. With the selected samples, the effects of colour and material composition on surface temperatures were studied thoroughly.
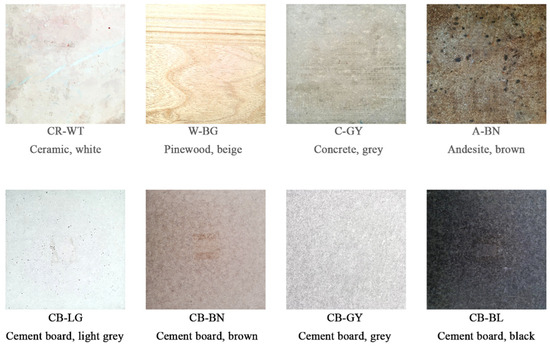
Figure 3.
Selected common building surface materials for surface temperature monitoring.

Table 1.
Specifications of the selected common building surface materials with different properties and usage in the building environment investigated in this study.
2.4. Experimental Setup
The selected samples were placed outdoors on 5 cm thick polystyrene to avoid heat transfer from the ground. The handheld FLIR C5 IR camera was placed on a tripod within 1 m distance aimed at the samples following the international standard for non-destructive IR camera measurement. In addition, two TA612C K-type thermocouples were installed with thermocouple adhesive tape at the centre point of each sample. K-type thermocouples were selected for their low cost and acceptable accuracy to measure surface temperatures of the samples ± (0.2% of reading +0.7 °C) in comparison to the FLIR C5 thermal camera (±3 °C). Measurements were conducted from 00:00 to 24:00 (24 h) using thermocouples and a thermal camera at 1 h intervals under clear weather with full solar radiation exposure (Figure 4a,c). FLIR thermal studio software version 1.9.70 was used to process the IR images. The collected data measurements were compared with nearby local weather stations to evaluate the temperature difference between the material surface and the ambient temperature.
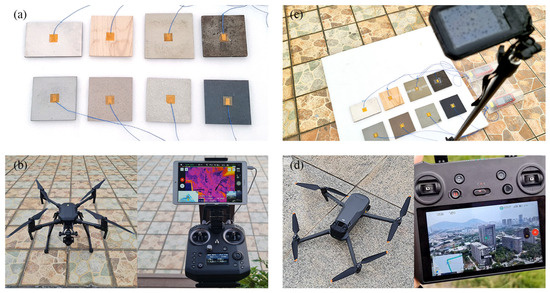
Figure 4.
(a) K-type thermocouple used to record building surface materials. (c) FLIR C5 handheld IR camera to monitor selected material samples. (b) DJI Matrice RTK 200 equipped with ZenMuse XT S IR camera to survey they study area (d) DJI Mavic 3 Pro to create study area 3D model.
Moreover, two types of UAV were utilised in this study to conduct a photogrammetry study on the urban community area. The first was the DJI Matrice RTK 200 UAV equipped with a ZenMuse XT S IR camera and the second was DJI Mavic Pro with an RGB camera, which was used to collect aerial and thermal images of the area (Figure 4b,d). ZenMuse XT S IR camera has a measurement accuracy of ±2 °C. To ensure that the whole study area was surveyed, an identical flight path was assigned to the drones to fly at 120 m above ground. The overlapping RGB aerial images captured from the DJI Mavic Pro were combined using DJI Terra software version 4.0.8, and a 3D model was generated. This 3D model was used as reference information when building a 3D model in Sketchup. Furthermore, following ENVI-met modelling guidelines to improve simulation accuracy, nesting grids were added in the model (Figure 5d).
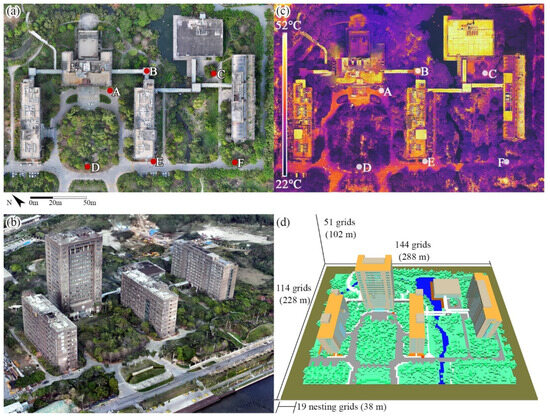
Figure 5.
(a) The study area Institute of Urban Environment located in Xiamen, China. Six points (A to F) selected for temperature and humidity measurement. (b) 3D model of the study area created with UAV. (c) Infrared image of the study area. (d) ENVI-met model generated based on the study area.
The IR thermal images captured by the IR UAV with a frequency of 2 h from 6:00 to 18:00 were analysed to identify urban hot spots using DJI thermal analysis tool 3 software. Data collections were performed under clear weather with no cloud cover. Based on the IR images, six areas with high surface temperature and high human traffic excluding the roofs of buildings were selected. On these points, temperature and humidity sensors were installed at 1.4 m height above the ground (Figure 5a). The six selected points were located throughout the case study area. Locations A, C, and E were positioned on areas covered mostly with concrete pavement with access to direct sunlight radiation mostly throughout the day. Point B was located under a canopy with no direct sunlight, surrounded with greenery. Points D and F received moderate sunlight and were surrounded by green vegetation. In this study, point A recorded the highest air temperature and was selected as a reference input for weather data to simulate the maximum air temperature condition.
2.5. ENVI-Met Model and Input Files Generation
To prepare the simulation in ENVI-met 5.6.1, an area input file comprising a three-dimensional model and meteorological data is generated from the study area field observation. Aerial images captured by DJI Mavic Pro are input into DJI Terra for building a 3D model of the urban area (Figure 5b). This 3D model contains detailed information on building positions, dimensions, urban materials, and vegetations, which serve as a reference when building the ENVI-met model. Using Sketchup Pro, a simplified version of the urban area model could be created, which would then be exported directly to ENVI-met using the Sketchup INX plugin. This plugin is used to convert the 3D Sketchup model as a 3D Sketchup model into a 3D INX model that can be opened in ENVI-met. With the accurate building models built into the ENVI-met, vegetation and textures could be modelled closely according to the detailed reference model and field observations. ENVI-met has a large database of building materials, wall surfaces, and roofing materials with their thermal properties. Based on the UAV aerial images, appropriate materials could be assigned as detailed as possible to the 3D urban model. In the simplified ENVI-met model, five vegetation species commonly found in Xiamen (Appendix A), approximating the actual vegetation in the study site, were assigned in the corresponding areas of the site. The vegetation’s height, size, and leaf density were modelled based on the existing ENVI-met tree database and modified to closely resemble the selected trees. The final ENVI-met model dimensions were 114 × 114 × 51 grids, where every grid size was 1 m square (Figure 5d). Nesting grids were modelled on the borders of the simulation following the ENVI-met simulation guidelines.
The meteorological data input for ENVI-met simulation could be collected from a nearby weather station or in situ temperature humidity sensors. For this study, the weather data were taken from the temperature humidity sensors installed at the six points of the site. The recorded temperature at point A represents the highest temperature condition of the urban area, which was used as simulation input data, while the other temperature sensors were used to assess the spatial accuracy of the simulation. The wind direction and speed data during the day were collected from the nearby weather station. The simulations were performed with the specified parameter conditions (Table 2) on 26 August 2024. ENVI-met software generated hourly simulation data for the duration of 24 h for every grid assigned to the model.
Table 2.
ENVI-met meteorological boundary condition and parameters.
2.6. Simulation Validation
To validate the reliability of simulation results, statistical metrics such as the coefficient of determinants (R2), the index of agreement, the root mean squared error (RMSE), and the mean biased (MBE) are often used [23,33,34]. The actual data of 26 August 2024, from the data loggers are correlated for every hour against the simulated data at the exact grid position and height where temperature loggers were installed. In this study, the model is validated using R and R2. All the temperature data at the selected points showed a positive strong correlation R > 0.9 and R2 > 0.8, demonstrating the validity of the model.
3. Results
3.1. The Impact of Building Surface Materials’ Colours and Properties on Surface Temperature
During the monitoring period, the air temperature recorded from the weather station in Jakarta varied between 23 °C and 31 °C, representing hot weather, while the weather in Xiamen varied between 12 °C and 19 °C, representing cold weather. When the monitoring results from both study areas are compared, the Ts of materials in Jakarta are significantly higher than the Ts of materials in Xiamen.
At peak temperature at 14:00 in the afternoon in both Xiamen and Jakarta, surface materials with the darkest colour (CB-BL and A-BN) show 10 °C to 20 °C higher surface temperature compared to the lightest colour (CR-WT and CB-LG) in both Jakarta and Xiamen (Figure 6). These materials both have a low solar reflectance ranging from 0.1 to 0.35 and a high solar absorbance coefficient, therefore absorbing more sunlight radiation. In both study areas, the lowest Ts value was recorded at 5:00 in the morning and the temperature peaked in the afternoon between 13:00 and 14:00. The temperature increased gradually during sunrise (6:00) and subsided during sunset (18:00). The surface temperature of the lightest-coloured materials was the lowest (CR-WT and CB-LG). These materials had the highest solar reflectance value and the lowest solar absorption value, reflecting most of the radiation. This can be observed in the thermal images shown in Figure 6. In both the Jakarta and Xiamen study, the thermal images show the lowest Ts for white ceramic (CR-WT) and the highest for brown andesite (A-BN). The same trend can be observed in the Ts comparison of light grey (CB-LG) and black (CB-BL) cement boards. The average Ts difference between the light and dark colour materials in both areas exceeded 10 °C during the peak Ts (Ts max) in the testing conducted in Jakarta and Xiamen. Both peak surface temperatures were recorded around 14:00 in the afternoon.
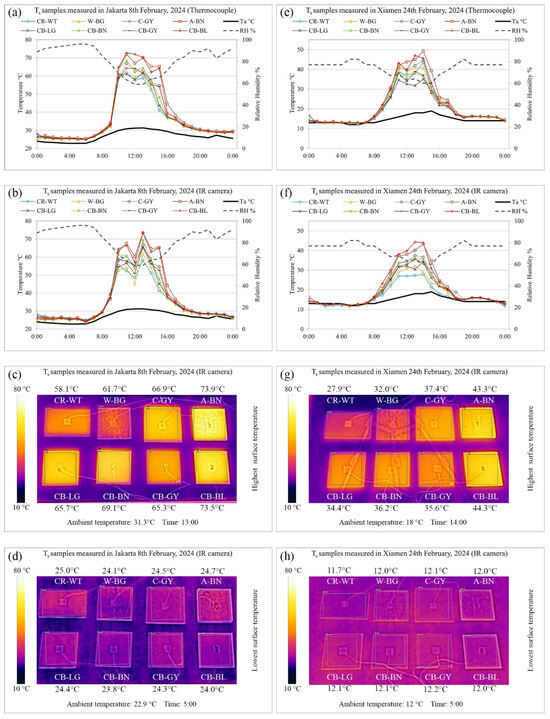
Figure 6.
The hourly temperature of surface material samples monitored for 24 h with thermocouples and infrared camera in Jakarta 8 February 2024 (a,b) and Xiamen 24 February 2024 (e,f). The infrared images show the surface materials during the peak (c,g) and lowest observed surface temperature (d,h).
The data from Xiamen and Jakarta show an identical Ts distribution, where dark samples with the lowest solar reflectance value (albedo) have the highest Ts, and the light samples with the highest solar reflectance value have the lowest Ts. The darker materials have a higher solar absorbance value compared to the lighter sample materials, therefore exhibiting a higher surface temperature trend. The temperature dropped slightly around 12:00 due to cloud cover on the study site and lowered steadily during sunset after 5:00 until 24:00. At midnight, the Ts decreased, showing heat loss from the sample. This means that the material samples released heat during the night. Based on the test results in Figure 6, there is a 10–15 °C difference in surface temperature between the lightest-coloured ceramic white (CR-WT) and the darkest-coloured material andesite (A-BN). CR-WT has the highest solar reflectance and the lowest solar absorbance value, while A-BN has the lowest reflectance and the highest absorbance value. This means that A-BN absorbs more heat compared to CR-WT during the day. In terms of thermal properties, A-BN has a higher specific heat range compared to CR-WT and could absorb more heat. These outcomes answer the first research question, where materials with darker colours have lower solar reflectance, higher specific heat, and higher surface temperature because they absorb more heat compared to materials with a lighter colour, higher solar reflectance, and lower specific heat.
3.1.1. Surface Temperature Comparison Between Infrared Camera and K-Type Thermocouple
The results of the measurements taken with thermocouples and a thermal camera in Jakarta are illustrated in Figure 7. The trend of the Ts temperature taken from the thermal camera is consistent with the thermocouple readings. The surface temperature data from both the infrared camera and the K-type thermocouple show identical trends and correlation between both datasets (Table 3).

Figure 7.
Box plot comparison of surface temperature data between FLIR C5 and K-type thermocouple. (a) Thermocouple measurements in Jakarta; (b) thermocouple measurements in Xiamen; (c) IR camera measurements in Jakarta; (d) IR measurements in Xiamen. The legend represents the initials and colour coding of the monitored building surface materials.
Table 3.
Comparison of 24 h monitoring data between FLIR C5 and K-type thermocouple at 1 h intervals. The maximum temperatures were recorded between 13:00 and 14:00 and minimum temperatures were recorded between 5:00 and 6:00.
In terms of the precision of the measurement, based on the manufacturer’s specifications, the FLIR C5 thermal camera has higher measurement errors (±3 °C) compared to the TA612C K-type thermocouple measurement (±0.2 °C + 0.7 °C). However, the thermocouple is only capable of detecting temperature on a spot of a sample, and errors could occur if a homogenous temperature distribution across the entire piece of material is assumed. Thermal cameras, on the other hand, can provide visualised surface temperature distribution of the materials, which thermocouple cannot achieve. The temperature distribution on the surface is considered an important parameter. As such, the error margin of ±3 °C made by the thermal camera is considered acceptable and can be calibrated using thermocouple measurements at critical points within the thermal camera’s field of view. Overall, with the current measurements, the accuracy of the TA612C K-type thermocouple and that of the FLIR C5 thermal camera have comparable data and identical trends. This trend could be observed during both hot tropical and mild winter climate.
3.1.2. UAV-IR Measurement of Urban Surface Temperatures
By utilising infrared aerial imaging on UAV, the surface temperature of the study area was measured (Figure 8). The aerial thermal monitoring was conducted from 6:00 sunrise until 18:00 sunset every 2 h. During sunrise 6:00 (Figure 8b), the surface temperature of the study area started to increase due to solar radiation. The surface temperature recorded on all the sample points reached around 20 °C to 21 °C. The water body projected a temperature lower than 20 °C. At 8:00 AM, the surface temperature on all the sample points except point B started to increase by 2 °C to 3 °C. Point B was located under a canopy; unlike the other sample points, it had no direct sunlight radiation exposure. At 10:00 AM, surface temperature started to increase significantly on all the sample points, reaching 28 °C to 29 °C. Roof materials made from concrete and aluminium steel had a higher surface temperature, reaching 60 °C. At noon 12:00 PM, the surface temperature on all sample points increased significantly, ranging from 27 °C to 31 °C. At this hour, the differences between the surface temperatures of the materials in the study area were clearly shown. Roof materials generally had a higher surface temperature as they were exposed to sun radiation. During peak air temperatures at 14:00 PM, concrete roofs and pavements showed the highest surface temperature. The areas surrounding reference points A and E with less green and soil cover had the highest surface temperature of 35 °C and 35.7 °C, respectively. Reference point B had the lowest surface temperature of 25.7 °C compared to all the other points. This surface temperature trend continued to 16:00 PM, where surface temperature had not yet decreased. During this period, point A had the highest surface temperature of 36.2 °C. This was the highest surface temperature of all the reference points during the day. During sunset at 18:00, there was less sun radiation exposure in the area. Surface temperatures started to decrease significantly. Based on the surface temperature observation, points A, C, and E still had a higher surface temperature compared to points B, D, and F. This shows how the surface temperature was greatly affected by the composition of the surface materials in the reference area.

Figure 8.
Surface temperature of IUE campus captured using infrared UAV every 2 h from 6:00 (sunrise) to 18:00 (sunset). The maximum and minimum surface temperatures are highlighted. (a) Aerial image of the study area IUE campus, selected points (A, B, C, D, E, and F) are selected for surface monitoring; (b) IR aerial image of IUE at 6:00; (c) IR aerial image of IUE at 8:00; (d) IR aerial image of IUE at 10:00; (e) IR aerial image of IUE at 12:00; (f) IR aerial image of IUE at 14:00; (g) IR aerial image of IUE at 16:00; (h) IR aerial image of IUE at 18:00.
3.2. Impact of Building Surface Materials on the Local Microclimate
To examine the impact of the surface temperature on urban microclimates, six sensors have been placed at several locations to compare the air temperature under different conditions. The surrounding conditions of the sensor locations are depicted in Figure 8a. During peak temperature at 3:00 PM, air temperature data at points A, C, and E, where materials consisted mostly of concrete surface, show higher temperature trends, while B, D, and F, with more vegetation cover, record lower temperature trends throughout the day (Figure 9). The maximum temperature recorded at points A and C reached 39 °C, while the lowest temperature recorded was at point B (32 °C). Point B was located under a canopy building with lower temperature and solar radiation. This answers the second research question of how the surrounding materials strongly influence the temperature recorded at every point. Points surrounded by concrete pavement surface and less vegetation showed higher recorded air temperatures.
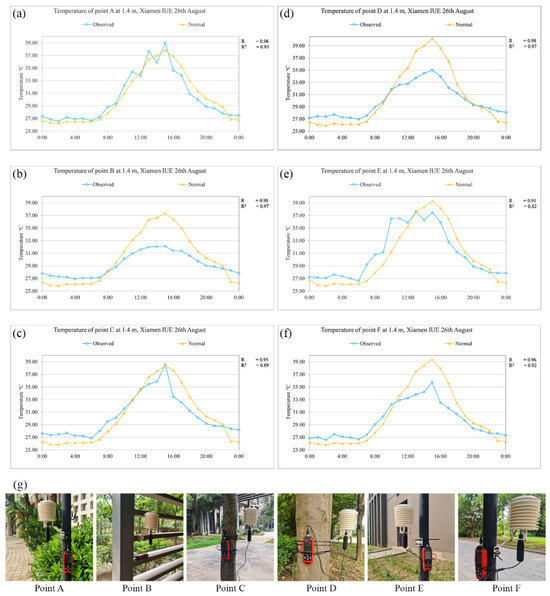
Figure 9.
Comparison of observed and simulated temperature at points A, B, C, D, E, and F on 26 August 2024 for 24 h at 1-h intervals. The height of the recorded air temperature is at 1.4 m. (a) Observed temperature of point A compared to simulation; (b) Observed temperature of point B compared to simulation; (c) Observed temperature of point C compared to simulation; (d) Observed temperature of point D compared to simulation; (e) Observed temperature of point E compared to simulation; (f) Observed temperature of point F compared to simulation; (g) Visual images of sensor positions at point A, B, C, D, E and F.
Using the validated ENVI-met simulation model, we further investigate the temperature distribution in the surrounding area (Figure 10). ENVI-met simulation results are compared to the air temperature on the reference points A, B, C, D, E, and F (Figure 9). Points A (reference point of the ENVI-met modelling), C, and E show the highest correlation between observation and simulation. Points B, D, and F show less accuracy between observed and simulated data. However, all the temperature distribution in the model satisfies the R > 0.9 and R2 >0.8. The ENVI-met simulation results show a similar trend to the air temperature sensors data. In the simulation results, point A, C, D, E, and F reach a peak temperature of 39 °C. The temperature distribution in the ENVI-met simulation results (Figure 10) also reflect how the surface materials affect the temperature above it. On water bodies and vegetation areas, less air temperature is projected throughout the day. Areas with more pavement cover have higher air temperatures above it.

Figure 10.
ENVI-met simulated potential air temperature at 1.4 m height of IUE campus on 26 August 2024. (a) Potential air temperature of IUE at 9:00; (b) Potential air temperature of IUE at 10:00; (c) Potential air temperature of IUE at 11:00; (d) Potential air temperature of IUE at 12:00; (e) Potential air temperature of IUE at 13:00; (f) Potential air temperature of IUE at 14:00; (g) Potential air temperature of IUE at 15:00; (h) Potential air temperature of IUE at 16:00; (i) Potential air temperature of IUE at 17:00; (j) Potential air temperature of IUE at 18:00.
4. Discussion
4.1. The Impact of Building Surface Materials on Surface Temperature
The surface temperature of different types of materials varied after being exposed to the same amount of solar radiation. Our finding confirms that darker materials with a high specific heat capacity showed the highest surface temperature, while the lighter-coloured materials with a low thermal mass exhibited the lowest surface temperature. In this case, the darkest material had the lowest solar reflectance value and a high absorbance value, which means that that specific material will absorb more heat and radiate it to the environment. To make sure that the relationship can be examined at different spatiotemporal scales, we first verified that the IR camera showed the performance of detecting the surface temperature of the selected surface materials at the same level as K-type thermocouples. It was identified in Jakarta and Xiamen that materials with higher solar reflectance, lower solar absorbance and lower specific heat capacity, such as white ceramic (CR-WT) and wood (W-BG), have the lowest peak surface temperature throughout the day. On the other hand, materials with low solar reflectance, high solar absorbance, and high specific heat capacity, such as andesite (A-BN) and black concrete board (CB-BL), have the highest peak temperature trend recorded during the day. In Jakarta, for example, the difference between the peak temperature of CR-WT is 10 to 15 °C lower than that of A-BN using both the K-type thermocouple and the IR camera. This shows that CR-WT reflects more and absorbs less sun radiation compared to A-BN. While having a lower surface temperature could provide a better thermal environment and less energy use for cooling, highly reflective materials may disturb the surrounding population. The results showed how the two components, meteorological conditions and material characteristics, affect the surface temperatures of building surface materials. First, they affect the meteorological conditions (temperature, humidity, and sun radiation) and materials’ thermal radiative properties (thermal conductivity, specific heat, reflectivity, and emissivity). This finding shows how meteorological conditions play an important role in affecting surface temperature. Moreover, during the nighttime in Jakarta, the material surface temperature is 2–3 °C higher compared to the ambient temperature. This shows that, in Jakarta, the material is absorbing more heat during the day and experiencing a harsher UHI effect during the nighttime compared to Xiamen. Other studies have also shown that climatic conditions greatly affect building surface materials and urban microclimate [28,35]. The variation in surface temperature recorded between materials shows that colours and material thermal properties greatly affect surface temperature. Higher thermal mass materials like concrete (C-GY), andesite stone (A-BN), and black cement board (CB-BL) have the highest surface temperature because they can store more heat, which increases their surface temperature. These outcomes are also reflected in other, similar research about building surface materials’ thermal performance [2,28,29]. The distinct improvement between this study and the others is that, in this study, IR cameras are tested together with thermocouples to complement each other. The surface temperature of materials could show the UHI effect in the area and the surrounding air temperature. The outcomes of the first experiment show that, by monitoring different building materials, a classification of said materials could be made as guidance for future city planning and urban management. With the correct building fabric composition, the UHI effect can be reduced [2,36,37]. Some of the literature presented a hypothesis that, in harsher winters, the heating effect for the same dark-coloured materials as building surface materials may be desirable, as the surrounding microclimate may be warmed up [38,39]. Potentially, the passive heating of materials in this certain area could make the temperature more thermally comfortable. Applying lighter colours in hotter climates is suitable for mitigating UHI, whereas it is possible that darker-coloured materials could increase air temperature during winter, creating a more comfortable ambience temperature.
When compared, the performance of IR and K-type thermocouples are acceptable for hourly monitoring tasks. K-type thermocouples typically have a higher response time (0.015 s) than IR cameras’ image capturing capability. However, in the context of urban monitoring, hourly recorded data are acceptable, since the building takes hours to absorb heat and have surface temperature changes. Compared to thermocouples, IR cameras record up to 2–3 °C higher temperature, but the measurements are precise. For building monitoring applications, this accuracy is acceptable to detect hotspots and temperature trends within the materials monitored. In addition, IR cameras could provide visual information about the temperature distribution, which a K-type thermocouple could not provide. Less waste material and labour are required for monitoring when an IR camera is used. Furthermore, although IR cameras could not accurately monitor highly reflective materials (Albedo above 0.5), in the urban context, such limitations are acceptable because less reflective materials are used for the building surface. In an industry context, materials manufacturers could add material thermal properties like emissivity, thermal capacity, thermal conductivity, and albedo to surface material on the market to have easier implementation in the field. The application of IR cameras in monitoring surface materials could be useful for architects, urban planners, and policymakers in selecting suitable surface materials to contribute to mitigating UHI.
4.2. Urban Scale Implications
This IR monitoring method was expanded further by assessing the IUE Xiamen campus as a case study. UAV equipped with IR was utilised to identify urban hot spots, combined with ground temperature, humidity sensors, and ENVI-met software. The surface temperature distribution could be observed throughout the whole area, and surfaces with high temperatures could be identified (Figure 8). In Figure 8c, aluminium roofing acquires surface temperature because it has a high thermal conductivity at 2:00 PM. However, it is also the first material that cools down after sunset at 6:00 PM. Dark-coloured concrete absorbs a lot of heat and has high surface temperatures. This type of material needs to be avoided, as it will release heat to the environment as a UHI effect. Surface temperature near vegetation and water bodies is found to be lower compared to surface temperature near buildings or concrete objects. The sensor placements shows that the peak air temperature is at points A, C, and E, while lower air temperature is at B, D, and F. The differences between sensors’ temperatures are mostly caused by different a material composition within the surroundings and how the materials radiate heat to the air. Points A, C, and E positions are exposed to direct sunlight radiation throughout the whole day, whereas B, D, and F have vegetation and canopy cover. In terms of surrounding materials, A’s, C’s, and E’s grounds are covered mostly with concrete materials. B, D, and F are mostly covered with soil and greenery. Aside from surface temperature, another cause of difference in recorded temperature could also be attributed to the sun radiation angle and building orientations. As the sun rises from the east to the west, the areas that are not shaded by the buildings receive more sun radiation and therefore have higher surface temperatures. Therefore, although points E, D, and F are positioned linearly, point E has higher surface and air temperature. The vertical building surfaces that are facing to the east are exposed to more direct sunlight. Hence, they have higher surface temperatures. This solar exposure also indirectly impacts the building’s energy consumption by increasing cooling loads. Areas of the building that received the most sun radiation throughout the day will most likely have higher energy loads for cooling needs. Based on the findings, urban planners could use this method to monitor the urban thermal distribution and highlight areas that are greatly affected by thermal stress. The use of UAV to pinpoint temperature urban hotspots combined with temperature sensors could be an efficient method to show which part of the urban area requires UHI mitigations.
From the current findings, it is shown that materials’ colour and thermal properties significantly impact the urban surface temperature, which inadvertently also affects the surrounding air temperature. It is suggested to use less bulky materials with a low reflectance value like concrete as a surface material, as it will absorb additional heat. This heat would be released to the microclimate, increasing the UHI effect. While high solar reflectance materials would be preferable, it is suggested not to install materials with very high solar reflectivity, like steel. This may reflect solar flares directly to the ongoing pedestrian, creating a transportation hazard. To test the suggested materials’ thermal performance, microclimate simulation softwares like ENVI-met could be used to first test the microclimate conditions.
4.3. Future Work
Future studies may experiment with how different materials could affect the air temperature and microclimate conditions of an urban case study. The difference in heat exposure with respect to human comfort could be compared and analysed. By using IR, it is possible for manufacturers and researchers to perform a quick screening of building surface materials. However, it is also possible to conduct further research on the microstructure of the building surface materials and investigate how it will affect surface temperatures. There is also a possibility of using remote sensing Land Surface Temperature as a comparison to ENVI-met simulation results. Areas in the city that have high thermal stress could be identified. The highlighted areas could then be simulated with ENVI-met simulation to improve the urban thermal conditions. This could apply to big cities that are greatly affected by UHI. Several materials or green cover scenario changes could be applied in the simulation to test the effectiveness of the selected material modification as a UHI mitigation strategy.
5. Conclusions
Building surface materials have a significant impact on air temperature in urban environments. Selecting materials that could absorb and release less heat to the air could effectively help alleviate UHI effects and enhance the thermal comfort of an area. Traditional UHI monitoring methods using temperature humidity sensors and satellite IR images lack the resolution and data frequency to analyse the direct source of UHI in urban environments. To address this gap, this study proposed a novel method to assess the UHI effect by combining in situ measurement using IR cameras, thermocouples, and ENVI-met simulation. The primary results of this study can be summarised as follows:
- (1)
- IR thermal camera capability and practicality to complement the spot check of thermocouples for monitoring materials is demonstrated in this study. Material samples with the lightest colour, white ceramic (CR-WT), have the lowest surface temperature of 58.1 °C (Jakarta) and 27.9 °C (Xiamen) during the peak temperature at 2:00 PM. On the other hand, the darkest-coloured material, black cement board (CB-BL) has the highest surface temperature of 73.5 °C (Jakarta) and 44.3 °C (Xiamen). The surface temperature difference between the lightest and the darkest material during peak ambient temperature ranges between 16.4 °C to 30.2 °C. This demonstrates that darker materials with lower albedo will absorb more heat and radiate higher surface temperature.
- (2)
- This study also investigates the impact of materials on temperature distribution in the case study of the urban area in the IUE campus Xiamen using UAV and temperature ground sensors. During peak ambient temperature at 2:00 PM, from the selected sampling points (A, B, C, D, E, F) the highest surface temperatures detected were on points A (35 °C) and E (35.7 °C). The maximum air temperature is also recorded on points A (35.89 °C) and E (36.26 °C).
- (3)
- The ENVI-met validated model in this study shows satisfactory correlation values of R > 0.9 and R2 > 0.8. ENVI-met simulation results provide further visualisation of the whole temperature distribution in the area.
This study proposed a novel method for urban planners and policymakers to consider the materials’ composition that comprises urban surfaces when designing future cities. With a balanced materials composition, it is believed that the newly designed or modified urban areas could mitigate or at least lower the UHI effects in said areas. Collectively, the energy consumption and CO2 emissions in said areas could be reduced. Additionally, with ENVI-met simulation, urban planners could test different materials and vegetation covers to investigate the effectiveness of UHI mitigation techniques.
Supplementary Materials
The following supporting information can be downloaded at https://www.mdpi.com/article/10.3390/buildings16020334/s1. The supplementary materials contain the following: Figure S1. Infrared images Xiamen on 23 February 2024; Figure S2. Infrared images in Jakarta on 8 February 2024; Figure S3. Flight path for infrared and RGB drone; Figure S4. IR image captured from UAV at 2:00 PM during the peak surface temperature, the surface material with the highest surface temperature is highlighted above; Figure S5. Temperature sensor location placements; Figure S6. Potential temperature without (left) and with green wall installed (right) from 00:00 to 04:00; Figure S7. Potential temperature without (left) and with green wall installed (right) from 05:00 to 09:00; Figure S8. Potential temperature without (left) and with green wall installed (right) from 10:00 to 14:00; Figure S9. Potential temperature without (left) and with green wall installed (right) from 15:00 to 19:00; Figure S10. Potential temperature without (left) and with green wall installed (right) from 20:00 to 24:00; Table S1. Infrared image data measured in Jakarta on 8 February 2024; Table S2. Thermocouple data measured in Jakarta on 8 February 2024; Table S3. Infrared image data measured in Xiamen on 23 February 2024; Table S4. Thermocouple data measured in Xiamen on 23 February 2024; Table S5. Observed air temperature data compared with normal simulation and green wall simulation data (Height 1.4 m).
Author Contributions
All authors contributed to the study conception and design. R.J.: Writing—original draft, visualisation, methodology, investigation, conceptualization. T.L.: supervision, project administration, funding acquisition. I.L.: supervision, validation. S.D.W.: writing—review and editing, validation. Y.-T.T.: writing—review and editing, supervision, project administration. All authors have read and agreed to the published version of the manuscript.
Funding
We are grateful for funding from the Strategic Priority Research Program of the Chinese Academy of Sciences (Grant No.XDA23030104), the Major Special Project—the China High-Resolution Earth Observation System (30-Y30F06-9003-20/22), the International Partnership Program of Chinese Academy of Sciences (Grant No.132C35K-YSB20200007), the National Natural Science Foundation of China (42271299), and Xiamen Key Laboratory of smart management on the urban environment. Ryan Jonathan would like to acknowledge support from the University of Nottingham Ningbo China through the DTP studentship (19053DTPXM) and Graduate School Travel Prize (I03180800109). Samuel D. Widijatmoko would like to acknowledge funding from the Centre for Postdoctoral Development in Infrastructure, Cities and Energy (C-DICE) through the C-DICE Networking Grant (C-DICE is funded by the Research England Development Fund—www.cdice.ac.uk).
Data Availability Statement
The original contributions presented in this study are included in the article/Supplementary Materials. Further inquiries can be directed to the corresponding authors.
Conflicts of Interest
The author declare that they have no known competing financial interests or personal relationships that could have appeared to influence the work reported in this paper.
Abbreviations
The following abbreviations are used in this manuscript:
| UHI | Urban Heat Island |
| UAV | Unmanned Aerial Vehicle |
| IR | Infrared |
| RH | Relative Humidity |
Appendix A
Table A1.
Selected common vegetations in Xiamen to be used in the ENVI-met simulation.
Table A1.
Selected common vegetations in Xiamen to be used in the ENVI-met simulation.
| No. | Plant Name | Scientific Name | Height (m) | Category |
|---|---|---|---|---|
| 1 | Palm | Livisitona chinensis | 10 | Medium deciduous dense plant |
| 2 | Fragant osmanthus | Osmanthus fragrans | 10 | Medium deciduous dense plant |
| 3 | Chinese banyan | Ficus macrocarpa | 10 | Small deciduous sparse plant |
| 4 | Red frangipani | Plumeria rubra | 8 | Small deciduous sparse plant |
| 5 | East Asian mallotus | Mallotus japonicus | 4 | Small deciduous sparse plant |
| 6 | Sedum | Sedum acre | 0.25 | Roof greening plant |
References
- Santamouris, M. Analyzing the heat island magnitude and characteristics in one hundred Asian and Australian cities and regions. Sci. Total Environ. 2015, 512–513, 582–598. [Google Scholar] [CrossRef] [PubMed]
- Santamouris, M.; Yun, G.Y. Recent development and research priorities on cool and super cool materials to mitigate urban heat island. Renew. Energy 2020, 161, 792–807. [Google Scholar] [CrossRef]
- Santamouris, M.; Cartalis, C.; Synnefa, A.; Kolokotsa, D. On the impact of urban heat island and global warming on the power demand and electricity consumption of buildings—A review. Energy Build. 2015, 98, 119–124. [Google Scholar] [CrossRef]
- Dong, F.; Asawa, T. A simulation study on building-scale strategies for urban heat island mitigation and building energy consumption: Case study in Japan. Build. Environ. 2025, 268, 112311. [Google Scholar] [CrossRef]
- Halder, B.; Bandyopadhyay, J.; Banik, P. Monitoring the effect of urban development on urban heat island based on remote sensing and geo-spatial approach in Kolkata and adjacent areas, India. Sustain. Cities Soc. 2021, 74, 103186. [Google Scholar] [CrossRef]
- Kousis, I.; Pigliautile, I.; Pisello, A.L. Intra-urban microclimate investigation in urban heat island through a novel mobile monitoring system. Sci. Rep. 2021, 11, 9732. [Google Scholar] [CrossRef] [PubMed]
- Marando, F.; Heris, M.P.; Zulian, G.; Udías, A.; Mentaschi, L.; Chrysoulakis, N.; Parastatidis, D.; Maes, J. Urban heat island mitigation by green infrastructure in European Functional Urban Areas. Sustain. Cities Soc. 2022, 77, 103564. [Google Scholar] [CrossRef]
- Mirzaei, M.; Verrelst, J.; Arbabi, M.; Shaklabadi, Z.; Lotfizadeh, M. Urban heat island monitoring and impacts on citizen’s general health status in Isfahan metropolis: A remote sensing and field survey approach. Remote Sens. 2020, 12, 1350. [Google Scholar] [CrossRef]
- Sun, C.-Y.; Kato, S.; Gou, Z. Application of low-cost sensors for urban heat island assessment: A case study in Taiwan. Sustainability 2019, 11, 2759. [Google Scholar] [CrossRef]
- Akbari, H.; Cartalis, C.; Kolokotsa, D.; Muscio, A.; Pisello, A.L.; Rossi, F.; Santamouris, M.; Synnefa, A.; Wong, N.H.; Zinzi, M. Local climate change and urban heat island mitigation techniques—The state of the art. J. Civ. Eng. Manag. 2016, 22, 1–16. [Google Scholar] [CrossRef]
- Santos Nouri, A.; Costa, J.; Santamouris, M.; Matzarakis, A. Approaches to Outdoor Thermal Comfort Thresholds through Public Space Design: A Review. Atmosphere 2018, 9, 108. [Google Scholar] [CrossRef]
- Pisello, A.L.; Saliari, M.; Vasilakopoulou, K.; Haddad, S.; Santamouris, M. Facing the urban overheating: Recent developments. Mitigation potential and sensitivity of the main technologies. WIREs Energy Environ. 2018, 7, e294. [Google Scholar] [CrossRef]
- Piccinini Scolaro, T.; Ghisi, E.; Silva, C.M. Assessing the impact of evapotranspiration from green roofs on reducing surface temperatures. J. Build. Eng. 2024, 95, 110095. [Google Scholar] [CrossRef]
- Mohajerani, A.; Bakaric, J.; Jeffrey-Bailey, T. The urban heat island effect, its causes, and mitigation, with reference to the thermal properties of asphalt concrete. J. Environ. Manag. 2017, 197, 522–538. [Google Scholar] [CrossRef] [PubMed]
- Tomita, K.; Chew, M.Y.L. A review of infrared thermography for delamination detection on infrastructures and buildings. Sensors 2022, 22, 423. [Google Scholar] [CrossRef]
- Henn, K.A.; Peduzzi, A. Surface Heat Monitoring with High-Resolution UAV Thermal Imaging: Assessing Accuracy and Applications in Urban Environments. Remote Sens. 2024, 16, 930. [Google Scholar] [CrossRef]
- Martin, M.; Chong, A.; Biljecki, F.; Miller, C. Infrared thermography in the built environment: A multi-scale review. Renew. Sustain. Energy Rev. 2022, 165, 112540. [Google Scholar] [CrossRef]
- Song, B.; Park, K. Verification of Accuracy of Unmanned Aerial Vehicle (UAV) Land Surface Temperature Images Using In-Situ Data. Remote Sens. 2020, 12, 288. [Google Scholar] [CrossRef]
- Hong, X.; Li, L.; He, W.; Ge, Y.; Xu, S. Study on solar liquid desiccant air-conditioning systems in Xiamen. Procedia Eng. 2017, 205, 2807–2814. [Google Scholar] [CrossRef]
- Tarigan, E. Comparison of energy production between fixed-mount and tracking systems of solar PV systems in Jakarta, Indonesia. Future Cities Environ. 2023, 9, 1–8. [Google Scholar] [CrossRef]
- Wang, C.; Shen, W.; Cui, B.; Zeng, Y. Numerical study on the thermal environment of the vertical greening system based on infrared thermal imaging. Archit. Eng. Des. Manag. 2024, 21, 315–337. [Google Scholar] [CrossRef]
- Zhang, S.; Wu, Z.; Wu, Z.; Lin, S.; Hu, X.; Zheng, L. The Impact of Urban Forest Landscape on Thermal Environment Based on Deep Learning: A Case of Three Main Cities in Southeastern China. Forests 2024, 15, 1304. [Google Scholar] [CrossRef]
- Wu, Z.; Dou, P.; Chen, L. Comparative and combinative cooling effects of different spatial arrangements of buildings and trees on microclimate. Sustain. Cities Soc. 2019, 51, 101711. [Google Scholar] [CrossRef]
- Lin, M.; Dong, J.; Jones, L.; Liu, J.; Lin, T.; Zuo, J.; Ye, H.; Zhang, G.; Zhou, T. Modeling green roofs’ cooling effect in high-density urban areas based on law of diminishing marginal utility of the cooling efficiency: A case study of Xiamen Island, China. J. Clean. Prod. 2021, 316, 128277. [Google Scholar] [CrossRef]
- Li, Z.; Zhou, L.; Hong, X.; Qiu, S. Outdoor thermal comfort and activities in urban parks: An experiment study in humid subtropical climates. Build. Environ. 2024, 253, 111361. [Google Scholar] [CrossRef]
- Chen, F.; Shen, X.; Huang, D.; Huang, Y. Thermal Environment of Residential Communities Over a Coast Area in Southeastern China. Int. Arch. Photogramm. Remote Sens. Spat. Inf. Sci. 2022, 48, 9–14. [Google Scholar] [CrossRef]
- Ferrari, C.; Libbra, A.; Muscio, A.; Siligardi, C. Design of ceramic tiles with high solar reflectance through the development of a functional engobe. Ceram. Int. 2013, 39, 9583–9590. [Google Scholar] [CrossRef]
- Radhi, H.; Assem, E.; Sharples, S. On the colours and properties of building surface materials to mitigate urban heat islands in highly productive solar regions. Build. Environ. 2014, 72, 162–172. [Google Scholar] [CrossRef]
- Stache, E.; Schilperoort, B.; Ottelé, M.; Jonkers, H.M. Comparative analysis in thermal behaviour of common urban building materials and vegetation and consequences for urban heat island effect. Build. Environ. 2022, 213, 108489. [Google Scholar] [CrossRef]
- Đukić, I.; Pervan, S. Specific Heat Capacity of Wood. Drv. Ind. 2014, 65, 151–157. [Google Scholar] [CrossRef]
- Oke, T. The urban energy balance. Prog. Phys. Geogr. 1988, 12, 471–508. [Google Scholar] [CrossRef]
- Zhou, K.-F.; Wang, S.-S. Spectral properties of weathered and fresh rock surfaces in the Xiemisitai metallogenic belt, NW Xinjiang, China. Open Geosci. 2017, 9, 322–339. [Google Scholar] [CrossRef]
- Willmott, C.J. On the validation of models. Phys. Geogr. 1981, 2, 184–194. [Google Scholar] [CrossRef]
- Kotharkar, R.; Dongarsane, P. Investigating outdoor thermal comfort variations across Local Climate Zones in Nagpur, India, using ENVI-met. Build. Environ. 2024, 249, 111122. [Google Scholar] [CrossRef]
- Wonorahardjo, S.; Sutjahja, I.M.; Mardiyati, Y.; Andoni, H.; Achsani, R.A.; Steven, S.; Thomas, D.; Tunçbilek, E.; Arıcı, M.; Rahmah, N. Effect of different building façade systems on thermal comfort and urban heat island phenomenon: An experimental analysis. Build. Environ. 2022, 217, 109063. [Google Scholar] [CrossRef]
- Santamouris, M.; Gaitani, N.; Spanou, A.; Saliari, M.; Giannopoulou, K.; Vasilakopoulou, K.; Kardomateas, T. Using cool paving materials to improve microclimate of urban areas—Design realization and results of the flisvos project. Build. Environ. 2012, 53, 128–136. [Google Scholar] [CrossRef]
- Santamouris, M. Recent progress on urban overheating and heat island research. Integrated assessment of the energy, environmental, vulnerability and health impact. Synergies with the global climate change. Energy Build. 2020, 207, 109482. [Google Scholar] [CrossRef]
- Varentsov, M.; Konstantinov, P.; Baklanov, A.; Esau, I.; Miles, V.; Davy, R. Anthropogenic and natural drivers of a strong winter urban heat island in a typical Arctic city. Atmos. Chem. Phys. 2018, 18, 17573–17587. [Google Scholar] [CrossRef]
- Macintyre, H.L.; Heaviside, C.; Cai, X.; Phalkey, R. The winter urban heat island: Impacts on cold-related mortality in a highly urbanized European region for present and future climate. Environ. Int. 2021, 154, 106530. [Google Scholar] [CrossRef]
Disclaimer/Publisher’s Note: The statements, opinions and data contained in all publications are solely those of the individual author(s) and contributor(s) and not of MDPI and/or the editor(s). MDPI and/or the editor(s) disclaim responsibility for any injury to people or property resulting from any ideas, methods, instructions or products referred to in the content. |
© 2026 by the authors. Licensee MDPI, Basel, Switzerland. This article is an open access article distributed under the terms and conditions of the Creative Commons Attribution (CC BY) license.