Abstract
In order to meet the demand for the seismic-resilience assessment of urban–rural building clusters, a new classification method is proposed by integrating national risk census results and evaluated using a large-scale dataset. This study initially identifies and analyzes the key factors that influence seismic-resilience. The reason for considering both internal and external factors is that they comprehensively reflect the characteristics and influencing conditions of urban–rural building clusters in terms of seismic-resilience. Subsequently, a comprehensive evaluation index system is constructed, encompassing both internal and external factors. Based on this system, criteria for seismic-resilience grading are proposed to classify the resilience levels of different building clusters. This is crucial for differentiating the seismic resilience capabilities of various building clusters. The evaluation index weights are determined by means of a robust method, and a seismic resilience evaluation method for urban–rural building clusters is established on the basis of the fuzzy comprehensive evaluation theory. This method incorporates various internal and external influencing factors to offer a comprehensive assessment. Moreover, by leveraging the ArcGIS platform, the evaluation method is successfully applied to urban–rural building clusters. Taking Weinan City, China, as a case study, an empirical evaluation of the seismic resilience of Weinan City is carried out. The results indicate that the proposed method effectively reflects the seismic resilience of the building clusters and offers valuable insights for enhancing resilience. The research findings provide a solid theoretical foundation and practical reference for enhancing the seismic resilience of urban–rural building clusters, promoting resilient city construction, and supporting post-earthquake disaster-area recovery and reconstruction.
1. Introduction
In recent years, multiple destructive earthquakes have led to varying degrees of casualties and structural damage. Besides the immediate treatment of the injured and the investigation of potential hazards, restoring building functions has become a crucial post-earthquake priority. Recovering building functionality in affected areas is often challenging, time-consuming, and costly. Consequently, these challenges have drawn increasing attention to the concept of seismic resilience in urban and rural building clusters [1]. In response, numerous studies have advocated the development of resilient urban–rural areas, which are defined as regions capable of maintaining essential and emergency functions without large-scale casualties during destructive earthquakes and of rapidly restoring all urban–rural functions thereafter [1].
In 2011, the United States National Research Council introduced the goal of “national earthquake resilience” [2]. Then, in 2014, Japan issued the “National Resilience Plan” to enhance the robustness and adaptability of the land [3]. Next, in 2017, the China Earthquake Administration designated “resilient urban–rural areas” as one of the four major initiatives within the “National Earthquake Science and Technology Innovation Project” [4]. More recently, the 2023 China Housing and Urban–Rural Development Conference emphasized the development of livable, resilient, and smart cities [5]. Overall, the concept of seismic resilience provides effective approaches to urban disaster prevention and mitigation and offers foundational support for the sustainable development of society [6].
Resilient urban and rural areas encompass multiple engineering systems. The building system, as an important part, influences post-earthquake casualties, economic losses, and post-disaster production recovery. Building seismic resilience refers to the ability to maintain and restore the original function following a destructive earthquake [7]. While there have been numerous studies on the seismic resilience of single buildings, and the evaluation methods are adequate [8,9,10,11], there are few research studies on the seismic resilience of urban and rural building groups [12,13,14,15,16,17]. Moreover, most studies merely focus on the community level [18,19]. There are no mature and applicable evaluation methods and related standards for the seismic resilience of urban and rural building groups. Furthermore, most studies focus on seismic resilience by only considering the internal factors of buildings. Few studies comprehensively consider the influence of external factors [20]. This is a significant shortcoming, as both internal and external factors interact and jointly determine the overall seismic resilience of building groups. External factors such as the surrounding infrastructure, land-use patterns, and emergency response resources can have a profound impact on how well buildings can maintain and recover their functions after an earthquake.
The seismic resilience of urban–rural building groups is significantly influenced by various external factors, and understanding and incorporating these factors into the evaluation are crucial. Numerous external factors affect the seismic resilience of urban–rural building groups. Social factors, such as population density and economic level, can impact the post-earthquake recovery speed and the resources available for reconstruction. Facility factors, like medical institutions and emergency shelters, are vital for providing immediate assistance and accommodation during disasters. Management factors, including material reserves, emergency plans, education, and drills, contribute to effective disaster response. Personnel factors, such as the availability of rescue and construction personnel, directly affect the efficiency of post-earthquake operations. However, it is currently not feasible to comprehensively consider these external factors in the seismic resilience evaluation of urban-rural building groups, and this limitation hinders the construction of resilient cities.
Recent advancements in the seismic analysis of critical infrastructure, like concrete gravity dams, illustrate the significance of rigorous finite-element modeling in comprehending dynamic response, dam structures, nonlinear material behavior, and damage progression under strong ground motion. Studies [21,22] that utilize advanced FE formulations, including fluid–structure interaction and nonlinear constitutive models, offer physically-based insights into the ways major infrastructure components contribute to regional seismic resilience.
By incorporating relevant findings from dam-reservoir FE modeling, the conceptual framework of the present study can be strengthened. This is achieved by linking community-level resilience indices with the structural-level seismic performance of key lifelines, which directly influence post-earthquake recovery capacity.
Consequently, it is imperative to propose an evaluation method for the seismic resilience of urban–rural building groups that can comprehensively account for these external factors. This evaluation method should enable accurate, reliable, and rapid assessment of the seismic-resilience capacity of urban–rural building groups. Accuracy is necessary to ensure that the evaluation results reflect the true state of the building groups’ resilience. Reliability guarantees the consistency and credibility of the assessment, and rapidity allows for timely decision-making and resource allocation in the context of earthquake-prone areas.
This paper analyzes the influencing factors of the seismic-resilience capacity of urban–rural building groups. First, it establishes an evaluation index system, which serves as the foundation for the subsequent evaluation. Then, it proposes the grade standards of each single-factor evaluation index corresponding to different seismic-resilience grades. After that, based on fuzzy comprehensive evaluation, this paper proposes an evaluation method for the seismic-resilience capacity that takes into account both internal and multiple external factors. Subsequently, a fuzzy-comprehensive-evaluation model is established to evaluate the seismic-resilience capacity of urban–rural building groups. Moreover, the objectivity and accuracy of the evaluation results are enhanced by using the hierarchical-analysis method to calculate the various influencing factor weights. Finally, taking Weinan in China as an example, this paper analyzes the distribution of the seismic-resilience capacity of building groups. The evaluation of the seismic-resilience capacity of urban–rural building groups can provide support for enhancing the resilience of building systems, promoting resilient urban–rural construction, and facilitating post-earthquake disaster-area recovery and reconstruction. The innovation of this paper lies in proposing a new evaluation model and presenting visualized results. More importantly, the model is deeply integrated with national risk census results, aligning with real-world conditions. Meanwhile, verification and analysis were conducted using a large-scale database, including 1.32 million buildings.
2. First National Natural Disaster Risk Survey
Seismic resilience evaluation methods require support from a basic database of urban–rural building groups. From 2021 to 2022, the first national natural disaster risk survey was carried out. This survey provides a basis for obtaining relevant data for local-level seismic-resilience evaluations. The main sources of risk-survey data in Weinan include the Statistical Yearbook of Weinan [23], which offers comprehensive historical data on various aspects of the city’s development and is valuable for analyzing long-term trends relevant to seismic resilience. The Statistical Bulletin of Weinan’s National Economic and Social Development in 2022 [24] provides information on its economic and social status, which is crucial for understanding the city’s capacity to respond to and recover from earthquakes. Additionally, the data from investigation tasks of risk-survey projects carried out by the administrative departments of housing and construction, emergency management, and other industries contributed.
Based on the risk-survey project, basic data of 1.3259 million buildings with a total area of 415.7209 million square meters in Weinan were obtained. These data cover offices, schools, hospitals, public buildings, and residential buildings. Data regarding building characteristics include information on structural type, construction year, building function, building area and floors, seismic fortification intensity, regularity degree, reinforcement and renovation, building damage, latitude and longitude, construction scale, material strength, component dimensions, internal non-structural components, and some construction drawings.
In addition to the building-related data, basic urban-related data of Weinan were also obtained, covering population, economy, emergency shelters, disaster-relief teams, construction teams, medical institutions, emergency drills, and emergency plans. These urban-related data are crucial for a comprehensive understanding of the overall environment in which the buildings are located and their ability to respond to seismic events.
After screening and processing, the data can be directly applied to the seismic-resilience evaluation method of urban–rural building groups in this study. This ensures that the evaluation is based on reliable and relevant information, enabling a more accurate assessment of the seismic resilience of urban–rural building groups in Weinan.
3. Influence Factors of Seismic-Resilience Capacity of Urban–Rural Building Groups
As mentioned above, in the existing literature, most studies have primarily focused on the internal factors of buildings when evaluating seismic resilience, with few concentrating on the effect of external factors. It is true that the seismic resilience of an individual building mainly depends on its internal factors. However, for urban–rural building groups, the situation is more complex. Their seismic resilience is related not only to internal factors but also to external factors. External factors, including social, facility, management, and personnel factors, can reflect the earthquake-prevention and disaster-reduction capacity in urban–rural areas.
3.1. Internal Factors
Internal factors can be categorized into seismic-type factors and function-type factors. Seismic-type factors are related to the seismic resistance of building structures, including structure type, seismic fortification intensity, construction year, and building damage. Function-type factors refer to non-structural factors that affect the difficulty level and time required for building function restoration after an earthquake, including building function, internal facilities, and non-structural components.
3.1.1. Seismic-Type Factors
- (1)
- Structure type
Buildings with different structure types show different seismic responses under the same earthquake, which leads to different levels of structure damage and casualties. Based on regional distribution, the proportion of concrete structures is higher in urban areas, while the proportion of masonry structures is higher in rural areas. Based on the data on Weinan including 1.3259 million buildings and 415.7209 million square meters, the structure types can be roughly divided into five types: steel structures, concrete structures, masonry structures, brick–wood structures, and solid-wood structures. The proportion of different structure types in Weinan City is summarized in Table 1.

Table 1.
Proportion of building areas with different structure types in Weinan City.
- (2)
- Seismic Fortification Intensity
Higher seismic fortification intensity in structure design means a stronger seismic resistance of a structure. Based on extensive housing research, urban houses can basically be designed with seismic fortification intensity requirements because of the supervision of the housing and construction department. And most public houses in rural areas can be designed with seismic fortification intensity requirements. However, most self-built houses by rural residents cannot meet earthquake-resistant requirements. Therefore, this paper takes the seismic fortification intensity as an influencing factor in the evaluation method.
- (3)
- Construction Year
Buildings built in different years adopt different design standards [25]. Therefore, the construction year can reflect a building’s seismic standards, building materials, and building age. Considering the successive revisions of building seismic standards, the construction years were divided into before 1989, 1990–2000, 2001–2010, and after 2011. The area proportion of different building construction years in Weinan is summarized in Table 2.
Table 2.
Area proportion of different building construction years in Weinan.
- (4)
- Building damage
Based on the investigation of urban and rural house construction, some old houses have some damage, including structural cracks and uneven settlement of foundation. For example, some cracks that appear on structural components weaken the bearing capacity. It is necessary to consider building damage to improve the seismic-resilience evaluation of urban–rural building groups.
3.1.2. Function-Type Factors
- (1)
- Building function
Building function is a crucial function-type factor influencing the seismic resilience of urban–rural building groups. Different building functions exhibit distinct characteristics after an earthquake.
These include the impact of building function loss, urgency, and the difficulty of building function restoration. For instance, a hospital’s function loss during an earthquake can have far-reaching impacts on emergency medical services, making its restoration extremely urgent. Based on their functions, buildings are classified into five types: residential, schools, hospitals, offices, and public buildings. Table 3 presents the proportion of each building type in Weinan.
Table 3.
Area proportion of each building type in Weinan City.
- (2)
- Internal facilities
In addition to building function, internal facilities also play a significant role in seismic-resilience evaluation. Different buildings house various internal facilities, which directly influence the time and difficulty of a building’s functional recovery after an earthquake. For example, a building with advanced power-backup systems can resume its normal operation more quickly than others. Consequently, taking into account the impact of internal facilities on building seismic resilience renders the evaluation results of urban–rural building seismic resilience more reasonable and accurate.
- (3)
- Non-structural components
Besides building function and internal facilities, non-structural components are also key factors in seismic-resilience assessment. Non-structural components vary across different buildings, and their restoration directly impacts the restoration and utilization of building functions post-earthquake. For example, partitions in an office building need to be restored to ensure the normal division of space. Thus, considering the influence of non-structural components on the seismic resilience of building groups is a prerequisite for evaluating the seismic resilience of urban–rural buildings.
By considering the influence of the three factors (i.e., building function, internal facilities, and non-structural components), the method can reflect the impact of function-type factors on the seismic resilience of urban–rural building groups, thereby rendering the evaluation results more scientific and accurate. This comprehensive consideration enables a more in-depth understanding of the seismic resilience of urban–rural building groups and provides a more solid foundation for related decision-making.
3.2. External Factors
As mentioned above, the seismic resilience of urban–rural building groups is influenced by external factors, including economic level, population density, the number of medical institutions and emergency shelters, emergency plans, relief material reserves, disaster-prevention education and drills, rescue teams, and construction teams. These factors can reflect earthquake-prevention and disaster-reduction capacity in urban and rural areas. They demonstrate the recovery ability and recovery time of building functions after an earthquake, thus reflecting the seismic resilience of urban–rural building groups. To evaluate seismic resilience scientifically and accurately, the external factors are classified into four categories: social factors, facility factors, management factors, and personnel factors.
3.2.1. Social Factors and Facility Factors
Social factors encompass population density and economic level. Areas with concentrated population and wealth tend to suffer greater economic losses due to earthquakes. They also experience more serious consequences from building function interruptions, as seen in the disruption of business operations in commercial areas. Additionally, they face a higher urgency for building function restoration, especially in areas where essential services like hospitals and transportation hubs are located.
Facility factors primarily include medical institutions and emergency shelters, which are crucial for reducing casualties and restoring disaster-affected areas after an earthquake. Adequate medical institutions and emergency shelters can make a significant difference. For example, in the aftermath of the 2008 Wenchuan earthquake, well-equipped medical institutions played a vital role in saving lives, and sufficient emergency shelters provided a safe haven for affected residents. This enabled more people to start the process of repairing damaged houses in a timely manner.
When compared with rural areas, urban areas exhibit a higher economic level, higher population density, and more complete infrastructure, including medical institutions and emergency shelters. These differences significantly influence the seismic resilience of urban–rural building groups. In urban areas, higher population density may pose challenges in evacuation, but better-developed economic and infrastructure conditions can facilitate faster post-earthquake recovery. In contrast, rural areas may have more dispersed populations and relatively limited resources, affecting their resilience. Hence, considering the influence of social and facility factors is necessary to ensure more accurate and reliable evaluation results.
As an example, we analyzed Weinan City in Shaanxi Province. Based on the population and economic data from the first national natural disaster risk survey, we obtained the population–kilometer grid data and GDP–kilometer grid data of Weinan City, which are depicted in Figure 1 and Figure 2. These data are essential for accurately assessing the impact of social factors on the seismic resilience of Weinan’s urban and rural building groups. The population–kilometer grid data can help us understand population distribution and its relation to potential earthquake-related risks, while the GDP–kilometer grid data can reflect the economic vulnerability of different areas, providing a basis for a more comprehensive evaluation.
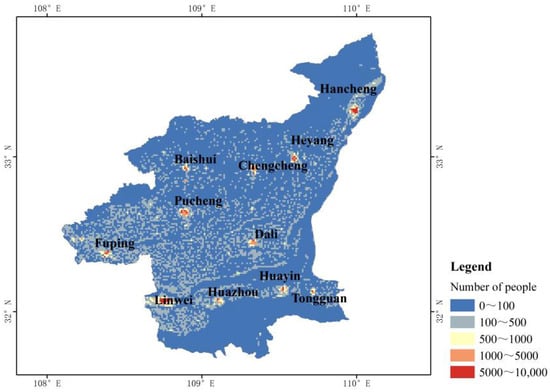
Figure 1.
Distribution map of population–kilometer grid in Weinan City.
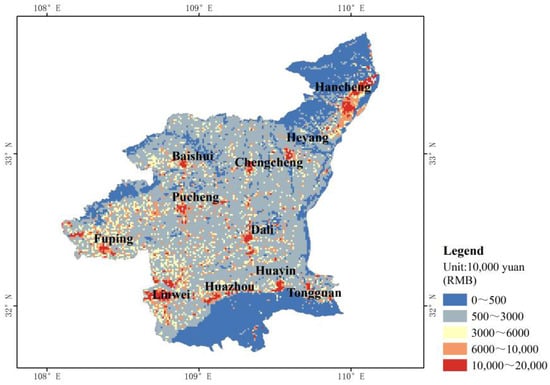
Figure 2.
Distribution map of economy–kilometer grid in Weinan City.
3.2.2. Management Factors and Personnel Factors
Management factors encompass material reserves, emergency plans, disaster-prevention education, and drills. Material reserves, such as food, water, and medical supplies, are crucial as they provide the necessary resources for immediate response and sustenance during the post-earthquake period. Well-formulated emergency plans lay out clear procedures for evacuation, rescue operations, and resource allocation, which are essential for an organized and effective response. Disaster-prevention education raises public awareness about earthquake risks and safety measures, enabling individuals to better protect themselves. Drills, on the other hand, help test and improve the effectiveness of emergency plans and ensure that people are familiar with response procedures. All these aspects contribute to the overall disaster-relief and function-recovery capacities of urban–rural building groups.
Personnel factors include the number of staff involved in rescue and building-repair work. The number of well-trained rescue staff directly impacts the speed and efficiency of search and rescue operations, which can significantly affect the survival rate of victims. In the same way, an adequate number of skilled building-repair personnel is necessary for the timely restoration of building functions, reducing the disruption to normal life in the affected areas.
Management and personnel factors can reflect the disaster-relief and function-recovery capacities of urban–rural building groups following earthquakes. Well-organized rescue teams and a sufficient number of building-repair workers also play a vital role in the relatively quick recovery of affected areas. Historical earthquakes demonstrate that well-formulated emergency plans, adequate disaster-prevention education, and drills can reduce casualties and shorten the recovery time of building systems in disaster-stricken areas. This further emphasizes the importance of considering these factors in the assessment of the seismic resilience of urban–rural building groups.
4. Evaluation of Seismic-Resilience Capacity
4.1. Evaluation Indexes
A scientific and reasonable evaluation index system serves as the foundation for evaluating the seismic-resilience capacity of urban–rural building groups. The seismic-resilience capacity of urban–rural building groups is determined by the structural parameters of buildings and the earthquake-disaster-reduction capacity in urban–rural areas. Based on the above-mentioned factor analysis, expert questionnaire surveys, and existing research findings on resilience evaluation, a seismic-resilience evaluation system for urban–rural building groups was proposed, taking into account disaster-bearing capacity, recovery capacity, and adaptability. Numerous factors influence the seismic-resilience capacity of buildings. Third-level seismic-resilience evaluation indexes are introduced for these factors. They include 2 first-level evaluation indexes (such as internal and external factors), 6 second-level evaluation indexes (such as seismic-resistance factor, functional factor, social factor, facility factor, management factor, and personnel factor), and 16 third-level evaluation indexes (such as structural type, seismic fortification intensity, construction year, building damage, building function, internal facilities, non-structural components, population density, economic level, the number of medical institutions, the number of emergency shelters, material reserves, emergency plans, disaster-prevention education and drills, the number of rescue personnel, and the number of construction personnel).
4.2. Classification of Seismic-Resilience Capacity Levels
Based on the classification methods of seismic-resilience levels in building seismic-resilience evaluation standards, such as the “Evaluation Standards for Seismic Resilience of Buildings” [8] (ESSR Standards), REDi Rating System [10], and USRC Rating System [11], the seismic resilience of urban–rural building groups can be categorized into five levels: I (very good), II (good), III (medium), IV (poor), and V (very poor).
Drawing on China’s emergency plan [26] and existing earthquake data [27], we invited professionals from various fields to conduct a questionnaire survey. The 16 three-level evaluation indexes for the five levels of seismic-resilience capacity of urban–rural building groups were determined, as presented in Appendix A Table A1. The index system consists of 6 qualitative and 10 quantitative indexes. It is worth noting that the evaluation indexes were calculated on a grid scale of 1 square kilometer.
4.3. Index Weights in Seismic-Resilience Evaluation
After establishing the evaluation index system for the seismic resilience of urban–rural building groups, it is necessary to determine each index weight. Based on the Analytic Hierarchy Process [24,28], the index weights in the evaluation index system are calculated through the following four steps:
- (1)
- Establishing the hierarchical-structure model.
Considering the complexity of the indicator system and the scientific requirements for evaluation, 5 to 9 experts, who either hold senior professional titles in civil engineering-related fields or have extensive practical engineering experience, are selected to form an evaluation team. This step aims to break down the complex problem of seismic-resilience evaluation into a hierarchical structure. It helps in clearly defining the relationships between different levels of evaluation indexes, from the overall goal (evaluating the seismic resilience of urban–rural building groups) to specific sub-criteria and individual indexes.
- (2)
- Constructing the judgment matrix.
The judgment matrix is constructed to compare the relative importance of each pair of elements within the same level of the hierarchical structure. This allows for a systematic way to express the decision-maker’s preferences regarding the importance of different factors in the evaluation process. By employing Saaty’s 1–9 scale method, experts independently develop positive-reciprocal judgment matrices for the pairwise comparison of indicator importance. The divergence of expert opinions is quantified through the coefficient of variation and Kendall’s coefficient of concordance. After anonymously revising the divergent items by means of the Delphi method, a comprehensive judgment matrix is obtained through aggregation using the arithmetic averaging method.
- (3)
- Calculating the maximum eigenvalue and eigenvector (i.e., weights). By calculating the maximum eigenvalue and its corresponding eigenvector of the judgment matrix, we can obtain the weights of the indexes. These weights represent the relative importance of each index in the overall evaluation, with larger weights indicating greater significance.
- (4)
- Conducting consistency checking. This step is crucial to ensure the rationality of the importance judgment of evaluation indexes. In the consistency test, the consistency index CI and the test coefficient CR should be calculated to ensure the rationality of the importance judgment of evaluation indexes, as follows.
For the consistency matrix, the weight values can be calculated by the geometric average method, as follows.
where = 1, 2……; is the weight value of each factor; is the correlation coefficient of factors; and n is the factor number. The factor weight values were calculated by the geometric average method, and the weights of each first-level index, second-level index, and third-level index in the evaluation index system were shown in Appendix B Table A2. The combination weights of 16 third-level indexes were obtained by multiplying the level-index weights.
The calculated consistency index (CI) is 0.016, and the Consistency Ratio (CR) is 0.031. These values indicate that the judgments regarding indicator importance are relatively reasonable. Finally, the weight values for each parameter were obtained by normalizing the eigenvector of the comprehensive matrix. Upon comparison, significant differences are observed in the index weights. Internal factors exert a more substantial influence on the seismic resilience of urban–rural building groups. Among the second-level evaluation indexes, seismic-type factors and personnel factors have a significant effect, whereas facility factors have a relatively minor effect. Among the third-level evaluation indexes, the order of influence is as follows: structure type, seismic fortification intensity, seismic measures for non-structural components, the number of construction personnel, and construction year. Based on historical earthquake data, the calculated weights of the seismic-resilience evaluation indexes for urban–rural building groups are consistent with the actual situation.
As mentioned above, it is essential to pay attention to the structure type, seismic fortification intensity, and seismic measures for non-structural components to enhance the seismic resilience of urban–rural building groups. Furthermore, improving the seismic resilience of structural and non-structural components can directly and effectively enhance the seismic resilience of urban–rural building groups.
5. Seismic-Resilience Evaluation Model for Urban–Rural Building Groups
5.1. Fuzzy Comprehensive Evaluation
The fuzzy comprehensive evaluation method, based on fuzzy mathematics [29,30,31,32], is a comprehensive evaluation approach with good applicability to the problem studied in this paper. Fuzzy mathematics is well-suited because the evaluation of seismic resilience in urban–rural building groups often involves imprecise and uncertain factors, such as the complex interaction between different building types and the variable impact of surrounding environments.
Urban–rural building groups are characterized by not only a large quantity and wide coverage but also diverse structural types, co-existence of new and old buildings, and different functional uses. These characteristics introduce a high degree of complexity and uncertainty. The fuzzy comprehensive evaluation method can handle such complexity by taking into account the fuzzy boundaries and relative importance of various factors. For example, it can effectively deal with the diverse structural types and functional uses, which may not have clear-cut distinctions in terms of their impact on seismic resilience.
The evaluation method based on fuzzy comprehensive evaluation theory can accurately and efficiently evaluate the seismic resilience of urban–rural building groups. In conclusion, this method provides a valuable tool for the in-depth study of the seismic resilience of urban–rural building groups, enabling more informed decision-making in urban planning, building design, and disaster prevention strategies.
Based on the results of the First National Natural Disaster Risk Census, and through the analysis of a large amount of data, the proportion of the number of times each numerical interval was identified by experts or scholars as a certain fuzzy level to the total number of times was calculated. Drawing on the literature [32,33,34], the semi-trapezoidal distribution function was chosen to determine the membership function. In this paper, a fuzzy-comprehensive-evaluation model for the seismic resilience of urban–rural building groups is constructed. The model comprises the following components: the evaluation index set W, the evaluation level set V, the membership matrix R of evaluation indexes, and the evaluation index weights.
- (1)
- Evaluation-index set W. The evaluation index system was developed by categorizing and organizing the influencing factors and evaluation indexes, as depicted in Figure 3. This study established a three-level fuzzy-comprehensive-evaluation model. The 16 evaluation indexes were used to form 6 first-level evaluation-index sets, namely U1 = {A1, A2, A3, A4}, U2 = {B1, B2, B3}, U3 = {C1, C2}, U4 = {D1, D2}, U5 = {E1, E2, E3}, and U6 = {F1, F2}. The 6 first-level evaluation-index sets are then used to form 2 second-level evaluation-index sets: W1 = {U1, U2} and W2 = {U3, U4, U5, U6}. Here, W1 represents the internal evaluation-index set, and W2 represents the external evaluation-index set. The 2 second-level evaluation-index sets form the third-level evaluation-index set W = {W1, W2}. Figure 4 depicts the hierarchy of evaluation-index sets for the seismic resilience of urban–rural building groups.
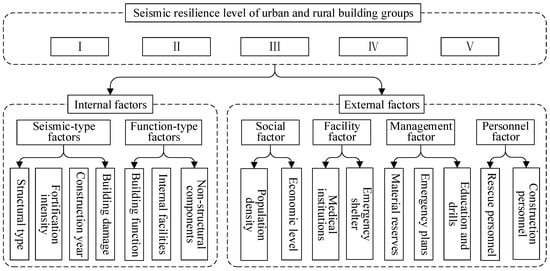 Figure 3. Evaluation index system of seismic-resilience capacity of urban–rural building groups.
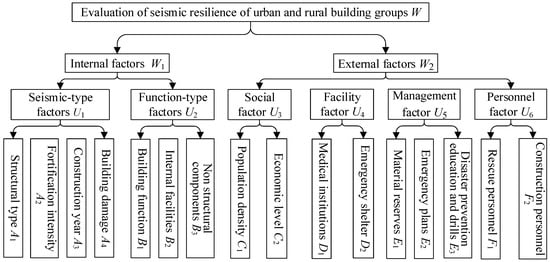 Figure 4. Hierarchical diagram of evaluation index sets for the seismic resilience of urban–rural building groups.
- (2)
- Evaluation level set V. Based on Appendix A Table A1, the seismic-resilience capacity of urban–rural building groups is divided into 5 levels. A total of 16 single-factor evaluation indexes are defined and classified into these 5 levels. Based on the study results, this section constructs an evaluation-level set for the seismic resilience of urban–rural building groups, specifically V = {V1, V2, V3, V4, V5} = {I, II, III, IV, V}. In this proposed set, I represents very good seismic resilience, II represents good seismic resilience, III represents medium seismic resilience, IV represents poor seismic resilience, and V represents very poor seismic resilience.
- (3)
- Membership matrix R for evaluation indexes. The membership matrix should consider characteristics of the study object. Based on the study of the relationship between evaluation indexes and resilience levels, this section proposes the membership matrix R:
To accurately evaluate the seismic resilience of urban–rural building clusters, understanding index types is crucial. In the evaluation method, two index types exist: continuous and discrete. Continuous indexes are quantifiable, while discrete ones are qualitative. Specifically, for continuous indexes, the membership degree is derived via a membership function. For example, a trapezoidal or triangular function can map continuous values like building height to a 0–1 membership degree. For discrete indexes, the direct-frequency method is used. For instance, when considering building structure type, the membership degree is calculated as the ratio of the frequency of each type to the total number of buildings.
Following the differentiation between continuous and discrete indexes, calculating the membership degree of continuous indexes is crucial. This is performed by establishing a membership–function relationship and inputting measured evaluation-index values. Based on evaluation-index distribution characteristics and existing research [32,33,34], the semi-trapezoidal distribution function was chosen. It can effectively capture the non-linear relationship common in seismic-resilience evaluation, like for building-related indexes. This function is used to establish the relationship between index values and membership degrees (i.e., membership functions), as presented in Equations (5)–(9). The semi-trapezoidal distribution function is widely applied in fuzzy-comprehensive-evaluation methods.
where s1, s2, s3, s4, and s5 are standard values of the evaluation indexes in Appendix A Table A1. The standard values were set as either the average value of the closed interval or the boundary value of the open interval within the evaluation range. F1(x), F2(x), F3(x), F4(x), and F5(x) represent the membership degrees of evaluation indexes corresponding to different evaluation levels. x denotes the measured value of the seismic-resilience evaluation index for buildings. The ArcGIS 10.2 platform divided the study area into N 1 km grid units. ArcGIS automatically calculates the measured values x of each evaluation index within each 1 km grid unit. The membership degrees of each evaluation index corresponding to different resilience-evaluation levels can be obtained from Equations (5)–(9). Subsequently, the membership matrix R of all quantitative evaluation indexes within the N 1 km grid units was constructed.
Discrete indexes, also known as qualitative indexes, have membership functions that cannot be expressed in mathematical formulas. A membership function for qualitative indexes needs to be constructed based on expert experience. In this section, the direct-frequency method was employed to determine the membership degrees of the five resilience-evaluation levels corresponding to qualitative evaluation indexes. The ArcGIS platform divided the research area into N 1 km grid units. Within each 1 km grid unit, ArcGIS automatically calculated the frequency of each evaluation level for qualitative single-factor evaluation indexes. After normalization, the membership degrees of qualitative single-factor evaluation indexes were obtained, resulting in the degree vector of qualitative single-factor evaluation indexes ri = (ri1, ri2, ……, rim). The membership-degree matrix R was obtained by combining the membership-degree vectors of all qualitative single-factor evaluation indexes.
- (4)
- The fuzzy-comprehensive-evaluation method, which is based on the Analytic Hierarchy Process (AHP), can prevent data loss and categorize the seismic-resilience level to obtain scientific and accurate evaluation results. The weight of the evaluation index reflects the importance and influence of each index, directly affecting the results of the fuzzy-comprehensive evaluation. The calculated consistency index (CI) is 0.016, and the Consistency Ratio (CR) is 0.031. These values indicate that the judgments regarding indicator importance are relatively reasonable. In this section, the weights of the evaluation indexes calculated by means of the Analytic Hierarchy Process [25] in Appendix B Table A2 above are utilized. The weights of the three levels of evaluation indexes form three different weight vectors: one first-level evaluation-index weight vector, Q1 = {0.658, 0.342}; two second-level evaluation-index weight vectors, Q21 = {0.716, 0.284} and Q22 = {0.205, 0.137, 0.251, 0.407}; and six third-level evaluation-index weight vectors Q31 = {0.416, 0.304, 0.146, 0.134}, Q32 = {0.291, 0.202, 0.507}, Q33 = {0.324, 0.676}, Q34 = {0.712, 0.288}, Q35 = {0.452, 0.281, 0.267}, and Q36 = {0.422, 0.578}.
- (5)
- Fuzzy comprehensive evaluation operation: The fuzzy comprehensive evaluation method is capable of evaluating the seismic-resilience capacity of urban–rural building groups. First, the third-level indexes need to be subjected to a fuzzy-comprehensive calculation. Subsequently, the evaluation values of the upper-level indexes are calculated step by step until the first-level index is reached. The specific details are presented as follows.
Third-level calculation: By combining the membership matrix R3i of the third-level evaluation index with the weight vector Q3i, the third-level fuzzy-comprehensive-evaluation result can be obtained, P3i = Q3i × R3i (i = 1, 2, ⋯⋯, 6).
Second-level calculation: The result vectors of six third-level fuzzy-comprehensive evaluations are combined to obtain two second-level membership matrices of fuzzy-comprehensive evaluations, M1 = (P31, P32), M2 = (P33, P34, P35, P36). Based on the membership matrix Mi and corresponding weight vector Q2i of the evaluation index, the second-level fuzzy-comprehensive-evaluation result can be obtained, Hi = Q2i × Mi (i = 1, 2).
First-level calculation: By combining the result vectors of two second-level fuzzy-comprehensive evaluations, the membership matrix K = (H1, H2) of the first-level fuzzy-comprehensive evaluation is obtained. Subsequently, based on the membership matrix K and the corresponding weight vector Q1 of the first-level evaluation index, the final fuzzy-comprehensive-evaluation vector, Z, is obtained, where Z = Q1 × K. Z represents the result vector of the fuzzy-comprehensive evaluation.
- (6)
- Evaluation by the maximum membership principle
The maximum membership principle is used to determine the seismic-resilience level of the evaluation object. The evaluation result vector of seismic-resilience ability Z = (Z1, Z2, Z3, Z4, Z5) was achieved in the above section. Based on the maximum membership principle, Zi = max {Z1, Z2, Z3, Z4, Z5}, the seismic-resilience level corresponding to the level set V = {I, II, III, IV, V} is the seismic-resilience level of the evaluated object.
In summary, this section constructs the evaluation-index set W, the evaluation-level set V, and the membership matrix R of evaluation indexes. Additionally, the weight values of the evaluation indexes are determined, and three-level fuzzy-comprehensive-evaluation operations are performed. The seismic-resilience level of the evaluation object is determined according to the maximum-membership principle. The maximum-membership principle states that the seismic-resilience level of the object is assigned to the level with the highest membership degree in the final evaluation vector.
Finally, a fuzzy-comprehensive-evaluation model for the seismic-resilience capacity of urban–rural building groups is established. This model can evaluate the seismic-resilience capacity of urban–rural building groups. After establishing the model, using the ArcGIS platform, the target area is divided into N 1 km grid units. Then, seismic-resilience evaluation calculations are performed for each 1 km grid unit. Dividing the area into grid units allows for a more detailed and accurate assessment of the spatial variation in seismic resilience. Each grid unit represents a homogeneous area in terms of the evaluation factors, enabling a more focused analysis.
Thus, the seismic-resilience-level evaluation results of urban–rural building groups can be obtained for each 1 km grid unit. These results can provide valuable insights into the distribution of seismic resilience within the urban–rural area, which can be used for targeted mitigation strategies and urban planning.
5.2. Application of Fuzzy Comprehensive Evaluation Method
Urban–rural building groups are characterized by diverse structural types, the co-existence of new and old buildings, and different usage functions. There is a need to develop a resilience evaluation system by integrating computer-automated data-processing and evaluation-calculation functions to conduct seismic-resilience evaluations of large-scale and widespread urban–rural building groups.
Based on the proposed evaluation method and the secondary development function of the ArcGIS platform, a fuzzy-comprehensive-evaluation model for the seismic resilience of urban–rural building groups was established. To demonstrate the practical application of this model, taking Weinan City as an example, the seismic-resilience capacity of urban–rural building groups in Weinan was evaluated.
Using the ArcGIS platform, the administrative area of Weinan City was divided into a series of 1 km grid units to perform the resilience-evaluation calculations. The data for the seismic-resilience evaluation-index calculations within each 1 km grid unit was obtained from the first national natural disaster risk survey. The evaluation-index set W, evaluation-level set V, and membership matrix R of the evaluation index were constructed. The evaluation-index set W contains various factors relevant to seismic resilience, such as structural characteristics and environmental factors. The evaluation-level set V defines different levels of seismic resilience. The membership matrix R represents the degree to which each evaluation index belongs to each evaluation level. The evaluation-index weights were determined, which reflect the relative importance of each index in the overall evaluation.
Three levels of fuzzy-comprehensive evaluation were performed, and the seismic-resilience level of buildings in each 1 km grid unit was determined according to the maximum-membership principle. Furthermore, the seismic-resilience levels and distribution of urban–rural building groups were visualized by coloring the 1 km grid units in different colors, drawing on the principles of the geographic-information discipline. This visualization method helps decision-makers quickly understand the distribution of seismic resilience.
Therefore, the evaluation system can accurately and effectively present the evaluation results to decision-makers through the thematic map of the seismic-resilience capacity of urban–rural building groups. Based on the above analysis, the distribution of seismic-resilience levels of urban–rural building groups in Weinan is presented in Figure 5. The proportions of buildings at different seismic-resilience levels are summarized in Table 4, and the area proportions of different-function buildings at different seismic-resilience-capacity levels are summarized in Table 5. These figures and tables provide a comprehensive overview of the seismic-resilience situation in Weinan, which can be used to inform urban planning and disaster-prevention strategies.
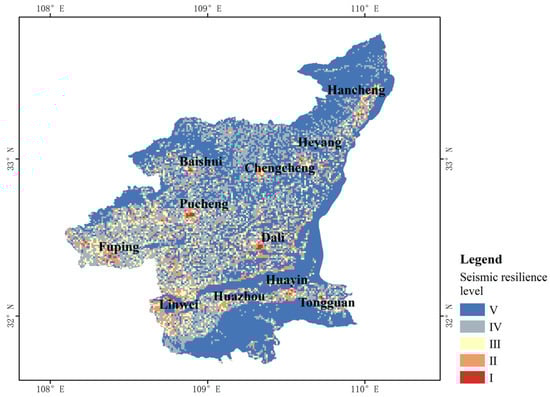
Figure 5.
Distribution of seismic-resilience levels of building groups in Weinan.
Table 4.
Building proportions of different seismic-resilience levels (%).
Table 5.
Area proportion of seismic-resilience capacity levels of different functional buildings (%).
The following analysis of Weinan’s buildings based on the fuzzy-comprehensive-evaluation model reveals distinct patterns in seismic-resilience levels, seismic fortification, and geographical distribution. The data in Weinan includes 1,325,900 buildings and 415,720,900 square meters.
Regarding the aforementioned dataset of 1.3 million buildings, missing or inconsistent data were initially filled and corrected reasonably based on information importance and rules, while a small amount of invalid data was removed. Subsequently, the extent of building damage was comprehensively quantified and graded in terms of structure, function, and appearance. Thereafter, building indicators of different dimensions were normalized and transformed to eliminate calculation bias.
For mixed building types within 1 km grids, the indicators for various building types in each grid were preferentially stratified and counted by building type. Alternatively, they were weighted according to building type or building-area proportion to obtain overall grid characteristics, thus completing efficient and reasonable data processing. Since the calculation process is relatively complex and has been elaborated in our bureau’s seismic-safety assessment report, it will not be further elaborated in this paper.
A comparison with the actual seismic-damage data of historical earthquakes compiled by our bureau reveals that the model’s assessment results are in good alignment with the measured results, accurately reflecting the true characteristics of structural seismic damage.
A sensitivity analysis of the model’s core weights and membership-boundary parameters shows that within a reasonable perturbation range, the variation in assessment results is controllable and adheres to engineering logic. There are no sudden jumps across damage grades, indicating good robustness and validating the reasonableness of parameter values. The above-mentioned analysis fully validates that the model’s construction logic is scientific, its assessment results are reliable, and the model exhibits rationality and applicability.
As detailed in Appendix A Table A1, based on the proposed fuzzy-comprehensive-evaluation model, the analysis results indicate that in Weinan, 32,600 buildings (36,370,400 square meters), accounting for approximately 2.46% of the total number of buildings, possess I-level seismic resilience. A total of 154,300 buildings (78,986,900 square meters), approximately 11.64% of the total, possess II-level seismic resilience. A total of 311,600 buildings (91,458,400 square meters), around 23.50% of the total, possess III-level seismic resilience. A total of 427,900 buildings (112,244,500 square meters), about 32.27% of the total, possess IV-level seismic resilience, and 399,500 buildings (96,660,700 square meters), roughly 30.13% of the total, possess V-level seismic resilience.
Based on the analysis, very few buildings in Weinan reach I-level seismic resilience. Most buildings with seismic fortification are distributed in urban areas. Relatively few buildings reach II-level seismic resilience, and most of these buildings with seismic fortification are also distributed in urban areas. In contrast, most buildings reach IV-level or V-level seismic resilience. Most of these buildings, lacking seismic fortification, are distributed in rural areas. This distribution pattern implies that there may be a need for more focused seismic-resilience improvement efforts in rural areas to enhance the overall seismic safety of Weinan’s urban–rural building groups.
The difficulty and urgency of post-earthquake functional recovery vary among buildings with different functions. Therefore, evaluating the seismic resilience of buildings with different functions is of great importance.
Based on the proposed seismic-resilience evaluation model, which likely involves a combination of structural analysis, consideration of non-structural components, and assessment of post-earthquake recovery potential, the proportion of areas at different seismic-resilience levels for buildings with different functions in Weinan is presented in Table 5.
Based on the analysis, the seismic resilience of school buildings is better than that of other functional buildings. For instance, the seismic-resilience level of school buildings is higher than that of public buildings. Schools possess relatively simple non-structural components, which renders post-earthquake functional recovery relatively easy. However, public buildings demonstrate weaker seismic resilience. Their interior finishes are more complex, and most non-structural components lack seismic measures, making functional recovery after earthquakes difficult.
However, the seismic resilience of public buildings is weaker than that of other functional buildings. The interior decoration of public buildings is relatively complex, with elaborate finishes, suspended ceilings, and large-scale display systems. Most non-structural components lack earthquake-resistant measures, such as proper bracing or anchoring. Consequently, it is difficult to restore their functional use after an earthquake.
In general, these findings highlight the need for targeted strategies in urban planning and building design. For public buildings, more attention should be paid to improving the seismic resistance of non-structural components during the design and construction phases. For schools, the current good practice in seismic-resilience design could be further promoted and replicated in other types of buildings. This would enhance the overall seismic resilience of the built environment in Weinan and similar regions.
6. Conclusions
This paper focuses on the seismic-resilience evaluation method of urban–rural building groups grounded in fuzzy-comprehensive-evaluation theory. Initially, the influencing factors of the seismic resilience of these building groups are analyzed. Subsequently, based on this analysis, a seismic-resilience evaluation method is proposed. This method simultaneously takes into account both internal and external factors, thus enabling the seismic-resilience evaluation of large-scale and widespread urban–rural building groups. To illustrate the practical application of this method, Weinan is taken as an example to apply the proposed system. Based on the study results, the conclusions are summarized as follows:
- (1)
- The weight values of 16 evaluation indexes for the seismic resilience of urban–rural buildings were derived. This was integrated with the national risk census, as well as expert analysis and evaluation. The results indicate that the evaluation indexes with combined weight values exceeding 0.09 are the structural type, seismic fortification intensity, and seismic measures for non-structural components. The evaluation indexes with combined weight values less than 0.03 include the number of emergency shelters, population density, emergency plan, disaster-prevention education, and drills.
- (2)
- The seismic-resilience capacity of urban–rural building groups was divided into five levels. The classification criteria for 16 evaluation indexes were defined to correspond to five different seismic-resilience levels.
- (3)
- Based on the fuzzy-comprehensive evaluation, a fuzzy-comprehensive-evaluation model for the seismic-resilience capacity of urban–rural building groups was constructed. The calculation efficiency of seismic-resilience capacity evaluation was improved by using the ArcGIS platform.
- (4)
- The seismic-resilience capacity and distribution of urban–rural building groups in Weinan City were assessed. A large-scale dataset, consisting of 1.32 million buildings, was utilized to verify the accuracy of the proposed model and perform an in-depth analysis.
However, the proposed seismic-resilience evaluation method only takes into account 16 influencing factors. This limitation might lead to an incomplete understanding of seismic resilience, as there could be other significant factors that are currently overlooked. These unaccounted factors could potentially have a substantial impact on the accuracy of the evaluation, thus affecting the effectiveness of any related mitigation strategies.
The framework treats each 1 km grid independently. However, in reality, (a) infrastructure systems, such as power, water, and transportation, are spatially connected; (b) damage propagation or cascading failures are non-local; and (c) recovery significantly depends on the performance of neighboring grids. However, the proposed model fails to account for the aforementioned spatial-correlation issues.
Therefore, there are some urgent issues that should be studied in the future. Firstly, more unknown influencing factors need to be identified. These could include emerging construction materials, new building techniques, or changing environmental conditions that might interact with the existing factors in complex ways. Secondly, the coupling effect among various factors is crucial. Understanding these relationships is essential for a more comprehensive evaluation. Finally, developing a more accurate seismic-resilience evaluation method is necessary. The current method, despite its merits, may not capture all the nuances of real-world scenarios, and improving it could lead to more reliable assessments and better-informed decision-making in urban planning and building design.
Author Contributions
Conceptualization, H.R.; methodology, H.R. and T.Z.; software, D.S.; validation, R.D.; investigation, R.D. and Q.T.; writing—original draft, H.R. and L.C.; writing—review and editing, D.S.; supervision, L.C.; project administration, T.Z.; data curation, T.Z. All authors have read and agreed to the published version of the manuscript.
Funding
This research was supported by the Natural Science Basic Research Program of Shaanxi (Program No. 2025JC-YBQN-697), and the Natural Science Basic Research Program of Shaanxi (Program No. 2025JC-YBMS-293), and the Key Research and Development Program of Shaanxi (Program No. 2024SF-ZDCYL-05-15).
Data Availability Statement
The original contributions presented in this study are included in the article. Further inquiries can be directed to the corresponding author.
Conflicts of Interest
The authors declare no conflicts of interest.
Appendix A
Table A1.
Classification standard of seismic-resilience capacity evaluation index.
Table A1.
Classification standard of seismic-resilience capacity evaluation index.
| Level 1 Evaluation Indexes | Level 2 Evaluation Indexes | Level 3 Evaluation Indexes | Classification Standard of Seismic-Resilience Capacity | ||||
|---|---|---|---|---|---|---|---|
| I | II | III | IV | V | |||
| Internal factors | Seismic-type factors | Structural type | Steel structure | Concrete structure | Masonry structure | Brick-wood Structure | Solid-wood Structure |
| Seismic fortification intensity | >8 degree | 8 degree | 7 degree | 6 degree | Non-fortification | ||
| Construction year | After 2011 | 2001–2010 | 1990–2000 | 1980–1989 | Before 1980 | ||
| Building damage | Nothing | Mild | Moderate | Serious | Very serious | ||
| Function-type factors | Building function | — | Schools, Hospitals | Residential, Office | Business center | — | |
| Internal facilities | Very simple | Simple | Medium | Complex | Very Complex | ||
| Seismic measures for non-structural components | Very good | Good | Medium | Poor | Very poor | ||
| External factors | Social factors | Population density (person/km2) | >5000 | 1000–5000 | 500–1000 | 100–500 | <100 |
| Economic level (10,000 yuan/km2) | >10,000 | 6000–10,000 | 3000–6000 | 500–3000 | <500 | ||
| Facility factors | Number of medical institutions | >4 | 3–4 | 2 | 1 | 0 | |
| Number of emergency shelters | >6 | 5–6 | 3–4 | 1–2 | 0 | ||
| Management factors | Quantity of material reserves (pieces) | >20 | 16~20 | 11~15 | 6~10 | ≤5 | |
| Emergency plan | Very complete | Complete | Incomplete | Very incomplete | None | ||
| Disaster prevention education and drills (times/year) | >3 | 3 | 2 | 1 | 0 | ||
| Personnel factors | Number of rescuers | >40 | 26~40 | 16~25 | 9~15 | ≤8 | |
| Number of construction personnel | >30 | 21~30 | 11~20 | 6~10 | ≤5 | ||
Note: The parameters of each quantitative index are computed in a 1-square-kilometer grid.
Appendix B
Table A2.
Weight values of seismic-resilience evaluation indexes.
Table A2.
Weight values of seismic-resilience evaluation indexes.
| Level 1 Evaluation Indexes | Weight of Level 1 Evaluation Indexes | Level 2 Evaluation Indexes | Weight of Level 2 Evaluation Indexes | Level 3 Evaluation Indexes | Weight of Level 3 Evaluation Indexes | Combination Weight | Ranking |
|---|---|---|---|---|---|---|---|
| Internal factors | 0.658 | Seismic-type factors | 0.716 | Structural type | 0.416 | 0.196 | 1 |
| Seismic fortification intensity | 0.304 | 0.143 | 2 | ||||
| Construction year | 0.146 | 0.069 | 5 | ||||
| Building damage | 0.134 | 0.063 | 6 | ||||
| Function-type factors | 0.284 | Building function | 0.291 | 0.054 | 8 | ||
| Internal facilities | 0.202 | 0.038 | 11 | ||||
| Seismic measures for non-structural components | 0.507 | 0.095 | 3 | ||||
| External factors | 0.342 | Social factors | 0.205 | Population density | 0.324 | 0.023 | 15 |
| Economic level | 0.676 | 0.047 | 9 | ||||
| Facility factors | 0.137 | Number of medical institutions | 0.712 | 0.033 | 12 | ||
| Number of emergency shelters | 0.288 | 0.014 | 16 | ||||
| Management factors | 0.251 | Quantity of material reserves | 0.452 | 0.039 | 10 | ||
| Emergency plan | 0.281 | 0.024 | 13 | ||||
| Disaster prevention education and drills | 0.267 | 0.023 | 14 | ||||
| Personnel factors | 0.407 | Number of rescuers | 0.422 | 0.059 | 7 | ||
| Number of construction personnel | 0.578 | 0.080 | 4 |
References
- Zhai, C.H.; Liu, W.; Xie, L.L. Research progress on urban seismic resilience assessment. J. Build. Struct. 2018, 39, 1–9. [Google Scholar]
- Bo, J.S.; Wang, Y.T.; Bo, T.; Wan, W.; Zhao, X.L.; Chen, Y.N. Progress and Outlook on seismic toughness of cities and buildings. J. Seism. Eng. Eng. Vib. 2022, 42, 13–21. [Google Scholar]
- Lu, X.Z.; Zeng, X. The challenges faced in building earthquake resilient cities. Urban Disaster Reduct. 2017, 4, 29–34. [Google Scholar]
- National Research Council. National Earthquake Resilience: Research, Implementation and Outreach; The National Academies Press: Washington, DC, USA, 2011. [Google Scholar]
- China Daily Network. The National Conference on Housing and Urban and Rural Construction Was Held in Beijing [EB/OL]. Available online: https://cn.chinadaily.com.cn/a/202301/17/WS63c66049a3102ada8b22bb8d.html (accessed on 1 January 2023).
- Terao, K. The basic concept of national land stabilization and the policy of the country: To the strong. J. Rural Plan. Assoc. 2017, 36, 398–401. [Google Scholar] [CrossRef]
- Ren, J.Y.; Pan, P.; Wang, T.; Zhou, Y.; Wang, H.S.; Shan, M.Y. Interpretation of GB/T 38591-2020 Evaluation Standards for Seismic Resilience of Buildings. J. Build. Struct. 2021, 42, 48–56. [Google Scholar]
- GB/T 38591-2020; Evaluation Standard for Seismic Resilience of Buildings. China Standards Press: Beijing, China, 2020.
- Federal Emergency Management Agency (FEMA). Seismic Performance Assessment of Buildings: Volume 1-Methodology: FEMA-P58; Federal Emergency Management Agency: Washington, DC, USA, 2012.
- Almufti, I.; Willford, M. REDi Rating System: Resilience-Based Earthquake Design Initiative for the Next Generation of Buildings; Arup: London, UK, 2013. [Google Scholar]
- U.S. Resiliency Council. Rating Building Performance in Natural Disasters [EB/OL]. Available online: https://www.usrc.org/usrc-media-portfolio/ (accessed on 1 November 2022).
- Lin, P.; Wang, N. Stochastic post-disaster functionality recovery of community building portfolios I: Modeling. Struct. Saf. 2017, 69, 96–105. [Google Scholar] [CrossRef]
- Lin, X.C.; Liu, X.Y. Seismic damage analysis and seismic resilience evaluation of group buildings at the macro epicenter of the Ludian earthquake. Earthq. Res. 2020, 43, 449–455. [Google Scholar]
- Xiong, C.; Huang, J.; Lu, X.Z. Framework for city-scale building seismic resilience simulation and repair scheduling with labor constrains driven by time-history analysis. Comput. Aided Civ. Infrastruct. Eng. 2020, 35, 322–341. [Google Scholar] [CrossRef]
- Burton, H.V.; Deierlein, G.G.; Lallemant, D.; Lin, T. Framework for incorporating probabilistic building performance in the assessment of community seismic resilience. J. Struct. Eng. 2016, 142, 04015007. [Google Scholar] [CrossRef]
- Zhang, H. Research on Seismic Resilience Evaluation of Community Buildings. Master’s Thesis, Dalian University of Technology, Dalian, China, 2021. [Google Scholar]
- Li, G.; Xue, L. Evaluation of post earthquake functional recovery ability of regional buildings considering traffic congestion. J. Civ. Eng. 2021, 54, 1–11. [Google Scholar]
- Fang, D.P.; Li, Q.W.; Li, N. Community earthquake safety resilience assessment system and application demonstration. J. Eng. Mech. 2020, 37, 28–44. [Google Scholar]
- Mieler, M.; Stojadinovic, B.; Budnitz, R.; Comerio, M.; Mahin, S.A. A framework for linking community-resilience goals to specific performance targets for the built environment. J. Earthq. Spectra 2015, 31, 1267–1283. [Google Scholar] [CrossRef]
- Ren, H.; Rong, C.; Tian, Q.H.; Zhang, W.C.; Shao, D. Evaluation Model for Seismic Resilience of Urban Building Groups. J. Build. 2023, 13, 2502. [Google Scholar] [CrossRef]
- Rasa, A.Y.; Budak, A. A parametric investigation on seismic performance of ageing Sariyar dam. Struct. Eng. Mech. 2024, 91, 123–133. [Google Scholar]
- Guo, Y.B.; Zhang, Y.H. Seismic settlement of earth dams subjected to wavelet-based earthquake motions. Eur. J. Environ. Civ. Eng. 2025, 29, 3850–3866. [Google Scholar] [CrossRef]
- Weinan Municipal Government. Weinan Statistical Yearbook; China Statistical Publishing House: Beijing, China, 2022.
- Weinan Municipal Government. Statistical Bulletin on the National Economic and Social Development of Weinan City in 2022; Weinan City Bureau of Statistics: Weinan, China, 2023.
- Sun, B.T.; Zhang, G.X. Research on risk distribution of building earthquake disasters in Chinese Mainland. J. Civ. Eng. 2017, 50, 1–7. [Google Scholar]
- Emergency Management Office of the State Council. The National Earthquake Emergency Plan; Bulletin of The State Council of the People’s Republic of China: Beijing, China, 2022.
- Li, F. Research on Seismic Resilience Evaluation Method for Communication Systems. Master’s Thesis, Institute of Engineering Mechanics, China Earthquake Administration, Harbin, China, 2022. [Google Scholar]
- Fan, Y.J.; Huang, H.H.; Ding, J.X. Resilience evaluation system of the old community based on cloud model. J. Shandong Univ. (Eng. Sci.) 2023, 53, 1–9. [Google Scholar]
- Zhao, X.Y. Assessment of Fire-Fighting Toughness in High-Rise Public Buildings. Master’s Thesis, North China University of Science and Technology, Tangshan, China, 2022. [Google Scholar]
- Yang, Z.D.; Zhou, Q.W.; Wang, W. Preliminary study on a fuzzy comprehensive evaluation-based method for classifying the degree of soil fertility damage of cultivated land. J. Agro-Environ. Sci. 2023, 42, 2780–2786. [Google Scholar]
- Yang, J. Application of the Improved Fuzzy Comprehensive Evaluation Method in Water Quality Evaluation. Master’s Thesis, Chongqing University, Chongqing, China, 2014. [Google Scholar]
- Shen, J.; Rao, J.; Fu, X.D. Mudflow risk evaluation based on fuzzy comprehensive evaluation method. J. Disasters 2016, 31, 171–175. [Google Scholar]
- Ren, G.F.; Chen, S.; Zhou, C.J.; Li, X.D. Study on the health and safety assessment method of shield tunnel structure during operation. J. Wuhan Univ. Technol. 2023, 45, 520–526. [Google Scholar]
- Zhang, Y.H.; Li, H.X.; Sheng, Q.; Li, Z.Y.; Yue, Z.P. Study on the stability classification of highway rock slope based on fuzzy comprehensive evaluation. J. Rock Soil Mech. 2010, 31, 3151–3156. [Google Scholar]


Disclaimer/Publisher’s Note: The statements, opinions and data contained in all publications are solely those of the individual author(s) and contributor(s) and not of MDPI and/or the editor(s). MDPI and/or the editor(s) disclaim responsibility for any injury to people or property resulting from any ideas, methods, instructions or products referred to in the content. |
© 2026 by the authors. Licensee MDPI, Basel, Switzerland. This article is an open access article distributed under the terms and conditions of the Creative Commons Attribution (CC BY) license.