Abstract
The structural vulnerability of RC structures during major seismic events raises several concerns regarding structural design and behaviour. Additionally, corrosion’s impact on steel and concrete, including a reduction in ductility, confinement and strength, can compromise structural performance, especially for reversal loading. This work investigates the combined effect of corrosion and seismic actions on the structural performance of RC structures. Numerical models of RC structures with 0%, 5%, 10%, 15% and 20% corrosion were proposed. The effect of corrosion in the numerical models was calibrated based on experimental studies carried out on corroded RC elements. Afterwards, we considered the scenario of corrosion in all peripheral structural elements of 5- and 10-storey MRF structures in three distinct conditions. To enforce vertical irregularity, we have imposed vertical irregularity at the ground level in each structure. An adaptive pushover analysis was performed to assess the effect of corrosion and vertical irregularity on the seismic response. The results demonstrate that, for the levels of 5% and 10% corrosion, uniform corrosion produces a deleterious impact on structural responses in 10- and 5-storey MRF structures, respectively, regardless of the level of irregularity of the elevation. However, the irregularity generates a higher impact in the seismic response than the uniformly distributed corrosion in height. The combined effect of those parameters must be considered in seismic codes for new and existing buildings in order to maintain safe performance levels.
1. Introduction
The structural vulnerability of reinforced concrete (RC) buildings during major seismic events raises several concerns regarding structural design and behaviour, construction methods and existing building maintenance guidelines. Modern RC buildings are designed to establish a global ductile failure mechanism, allowing for anticipated plastic hinges in beam ends. This design approach mitigates shear collapse by implementing a capacity design procedure and adhering to specific requirements regarding construction details and material properties [1].
Several studies have been performed to assess the seismic vulnerability of RC structures with vertical irregularities. Benaied et al. stated that those irregularities substantially concentrate inelastic demands at the levels of geometric or stiffness transitions [2]. In the 2023 Kahramanmaraş earthquakes, the soft storey phenomenon generated a disproportionate increase in inter-storey drifts at the ground floor, leading to shear failure in columns [3,4]. A comparative analysis suggests that buildings with stiffness irregularities present the most critical seismic behaviour [5].
Corrosion’s impact on steel and concrete, including reductions in ductility, confinement and strength, can compromise structural performance. This is marked by a decline in strength and, more critically, a decrease in structural displacement capacity, often leading to a change in the collapse modality and unforeseen failures. This issue was highlighted in some numerical studies aimed at capturing the effect of corrosion on the seismic performance of an entire building [6,7,8,9,10,11,12,13,14].
This issue can be even greater in existing RC buildings, often characterised by the strong beam/weak column hierarchy typical of designs with vertical loads, which are frequently exposed to brittle soft storey collapses [15]. The corrosion on RC structures may not only change their seismic performance but also their behaviour under other lateral loads, such as tsunamis [16].
To assess the residual performance of corroded structures, comprehensive research has been conducted over the past few decades, leading to the development of numerous empirical and theoretical relationships between corrosion levels and various performance indicators, including corrosion-induced crack width, bond–slip behaviour, mechanical properties of corroded reinforcement bars and the load-carrying capacity of corroded elements. However, for these correlations to be considered in structural assessments, the corrosion level must first be accurately quantified, which presents significant challenges for in-service structures compared to laboratory specimens [17].
Recent experimental studies have demonstrated the significance of assessing the impact of corrosion on the strength and, particularly, the displacement capacity of RC columns. This is especially relevant for columns affected by pitting corrosion and those well-confined and designed to exhibit ductile behaviour [11]. Meda et al. [8] indicate that corroded elements experience a reduction in ultimate strength and overall ductility by as much as 50% when the corrosion level reaches around 20% mass loss, even when the confinement loss from the stirrup deterioration is disregarded.
This work aims to contribute to that field by performing a numerical analysis of 5–10-storey MRF (moment-resisting frame) structures; 0%, 5%, 10%, 15% and 20% corrosion has been considered in the adaptive pushover analysis of those structures, an approach developed by Antoniou and Pinho [18,19]. This approach has been chosen considering the limitations of the static pushover analysis method. In the last 30 years, to solve those limitations, especially with regard to irregular structures, the adaptive pushover analysis has been employed in several studies with sufficient accuracy [20].
To calibrate those models, a study of models proposed by the experimental work of Meda et al. [8], Goksu et al. [9], Yang et al. [10], Rajput et al. [11] and Rinaldi et al. [12] was carried out. Considering those studies, the structural configuration of each percentage of corrosion was proposed, and the existing buildings were assessed based on those characteristics.
This study considered three corrosion scenarios: extreme conditions in which all façade elements are subjected to corrosion, facilitating a comprehensive assessment of the overall impact of deterioration, as proposed by Caixinhas et al. [21], corrosion in all peripheral columns until a height of 1.50 m and corrosion in columns of two opposite façades until a height of 1.50 m. Adaptive pushover analyses were conducted in SeismoStruct v2025 software [22] to assess the impact of corrosion on the seismic response. The capacity curves, performance points, initial stiffness, yield point, maximum resistance and inter-storey drift profile were discussed and compared.
While the existing literature has extensively characterised corrosion and vertical irregularity in RC structures individually, the novelty of this study lies in the provision of RC structure corrosion calibration settings and the assessment of the combined effect of vertical irregularity and corrosion in the seismic response of MRF RC structures.
2. Corrosion Impact on Seismic Behaviour
Besides the well-known cross-section reduction, the decrease in the deformation capacity of rebars due to corrosion is evident in reinforcements. Experimental results highlighted the residual values of the elongation to a maximum load relatively equal to 50% of the sound performance [23,24,25,26], a lower but relevant decrease in ultimate elongation and a negligible deterioration of strength, both at the yielding and ultimate level [27,28]. The reduction in the ultimate elongation of stirrups acts on RC sections’ confinement: together with the progressive reduction in stirrups’ diameter, the deterioration of the deformation capacity due to corrosion leads to the loss of confinement and a following decrease in strength and ductility properties at section and element levels [15].
Based on the corrosion effects, the decrease in the structural seismic performance of RC structures is often related to the shift in the collapse modality. Modern RC buildings are designed to have a global ductile failure mechanism with plastic hinges in the beams, preventing shear collapse by adopting the capacity design procedure and respecting specific requirements for executive details and material characteristics [1]. The effects of corrosion on steel and concrete (reduction in ductility, confinement, strength, etc.) can impair the structural response, with a decrease in strength and, more importantly, with a reduction in the structural displacement capacity, often leading to a change in the collapse modality and unexpected failures [6].
Such issues can be even greater in constructions where no specific attention was devoted to these aspects: this is the case, for example, of existing RC buildings characterised by the intense beam/weak column hierarchy typical of designs with only vertical loads, which are frequently exposed to brittle soft storey collapses [15].
Experimental studies to assess the cyclic behaviour of corroded RC columns have been carried out by several authors, namely Meda et al. [8], Goksu et al. [9], Yang et al. [10], Rajput et al. [11] and Rinaldi et al. [12]. Table 1 presents the experimental parameters of those works. Figure 1 presents the last drift ratio and lateral load regarding the percentage of corrosion. The last drift ratio is defined as the comparison between the last observed drift in the assessed corroded element and the last drift shown in the uncorroded column in each experimental study. The moment of the drift is defined by the significant damage level of the column. From then, the following can be seen:

Table 1.
Experimental parameters of corrosion studies.
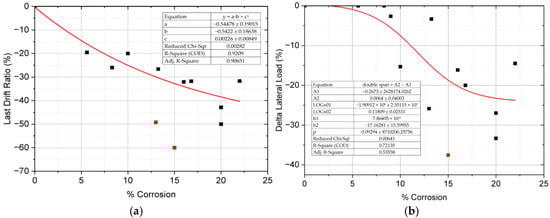
Figure 1.
Comparison of experimental studies regarding the shift of the (a) last drift ratio and (b) lateral load.
- The shift in all parameters between studies, from geometrical parameters to concrete and rebar properties, reduced the axial load of the columns and also the applied lateral load developed in the assessed experiments;
3. Numerical Modelling of RC MRF Structures
3.1. Modelling Approach
The modelling approach employed in this study for simulating RC elements utilised, similarly to Caixinhas et al. [21], inelastic force-based frame elements subdivided into seven integration sections, with each section further discretised into 204 fibbers to capture the nonlinear material behaviour accurately.
To characterise the behaviour of rebars and concrete under corroded and uncorroded conditions, the uniaxial constitutive model developed by Monti and Nuti [29] was adopted for steel, while the model proposed by Mander et al. [30] was employed for concrete. The constitutive law and the formulation that incorporates the confining effects by lateral transverse reinforcements were considered as proposed by Mander et al. [30]. The cyclic loading rules of Martinez-Rueda and Elnashai [31] were applied.
The performance criteria consider the limit states established by Eurocode (Damage Limitation, Significant Damage and Near Collapse) at the element and the structural level. For the element level, the assessment is focused on chord rotation and shear capacity, and at the structural level, it is assessed by the inter-storey drift and roof displacement.
The seismic characteristics considered in the models are defined as in Santos et al. [5] and presented in Table 2:
Table 2.
Seismic properties—EN1998-1:2004 [1].
To simulate the effects of corrosion on columns and beams, two strategies were employed:
- A reduction in the effective cross-sectional area of the longitudinal and transverse reinforcement was used to simulate the material loss associated with the corrosion process in RC elements. The reduction (%) of corrosion represents the percentage of the cross-section rebar loss due to this process. SeismoStruct v2025 [22], nonetheless, has a limitation in modelling stirrups: it restricts the bar selection to standard diameters, thereby precluding the use of intermediate sizes. To overcome this limitation, the stirrup spacing was adjusted to obtain the desired equivalent cross-sectional area per meter, even though this approach may have potential implications for shear behaviour and confinement efficiency. Despite that limitation, this simplification is suitable for a global seismic response assessment.
- We modified the mechanical properties of the steel, considering the parameters observed in the experimental studies of Meda et al. [8], Goksu et al. [9], Yang et al. [10], Rajput et al. [11] and Rinaldi et al. [12]. These modifications have been performed until the horizontal displacement history of numerical models satisfactorily represents the experimental campaign of the aforementioned studies in each corrosion scenario. The calibration process is discussed in the next section, and the settings defined for this study are presented in Table 3.
Table 3. Constant material property settings of increasing corrosion level.
3.2. Models’ Calibration
Several models have already been developed to simulate the impact of corrosion on structural behaviour. Alipour et al. [32] and Rao et al. [33] are examples of those studies. However, considering the challenges in modelling this problem, their work presents some deficiencies, such as considering the impact of corrosion in inelastic buckling and the low-cycle fatigue of rebars and its deleterious influence on damage states. Kashani et al. [34] addressed these issues and incorporated the corrosion influence in seismic damage thresholds, as verified later by Dizaj et al. [35].
Figure 2 demonstrates the numerical calibration of a column based on Meda et al. [8]. The details of the lateral displacement history are shown in Figure 2a, and the load–drift relationship of the uncorroded column and the column with 20% corrosion is presented in Figure 2b. This approach has been performed by Goksu et al. [9], Yang et al. [10], Rajput et al. [11] and Rinaldi et al. [12], resulting in the models’ material settings as illustrated in Figure 3 and Table 3 and Table 4.
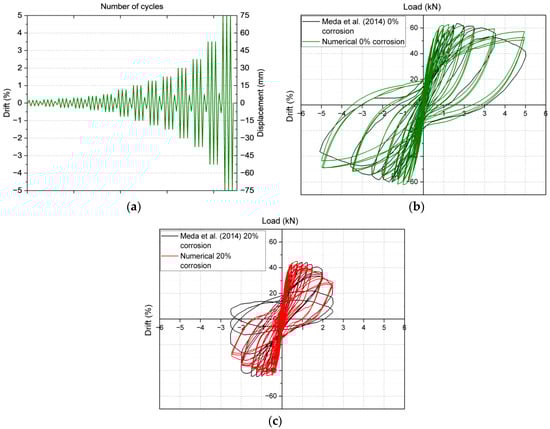
Figure 2.
Comparison between Meda et al. [8] and proposed numerical modelling: (a) horizontal displacement history; (b) horizontal load–drift of uncorroded columns; and (c) horizontal load–drift of 20% corroded columns.
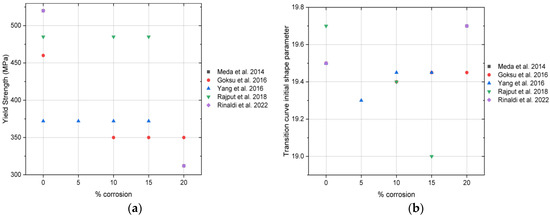
Figure 3.
Material properties settings: (a) yield strength (fy) and (b) transition curve initial shape parameter (R0) [8,9,10,11,12].
Table 4.
Proposed material property settings.
From these figures and tables, the following conclusions can be drawn:
- Table 3 shows the constant material property settings, notwithstanding the shift in corrosion levels. This means that, for those properties, the corrosion level has no influence.
- Almost all studies demonstrated similar results for the steel elasticity modulus (Es) and transition curve shape calibrating coefficient A1 (a1) and fracture/bucking strain (P), regardless of the increase in corrosion (200–210, 18.5–19.0 and 0.1372–0.2, respectively). Additionally, for 20% corrosion, the kinematic/isotropic weighting coefficient (k) and spurious unloading corrective parameter (r (%)) also present similar settings in Meda et al. [8] and Rinaldi et al. [12] (0.9 and 5.0, respectively).
- Figure 3a,b, on the other hand, demonstrate considerable variation in the yield strength and transition curve initial shape parameter when the level of corrosion increases.
- Considering the discussion presented above, the proposed model settings are presented in Table 4. Despite the variation in Es in the Rajput et al. [11] study, 210 GPa in all corrosion levels was considered a control variable approach. Additionally, the fy (yield strength) was 520 MPa in 0% and 5% corroded structures. However, this value decreases to 350 MPa and 312 MPa for higher levels of corrosion. Furthermore, R0 varies between 19.4 and 19.7. Finally, P remained constant (0.137) for 0–15% corrosion, changing to 0.200 for 20% corrosion.
- It is important to highlight the limitations of the discussion performed above due to the restriction of the data.
4. Case Study
The RC MRF buildings considered in this work were obtained from Santos et al. [5]. The structural system for the buildings consists of 5/10-storey frame RC structures with three spans in both directions and a spacing of 6.0 m on the X-axis and 7.0 m on the Y-axis. The height between floors is 3.0 m for all storeys, except on the ground floor, where the height considered is 3.0 m, 4.0 m or 5.0 m to produce irregularity in elevation by changing the lateral stiffness. The slabs were 15 cm thick and were treated as rigid diaphragms. Those geometrical properties are demonstrated in Figure 4.
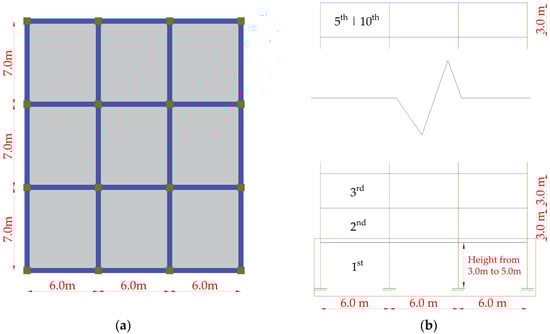
Figure 4.
Frame building system configurations: (a) plan view and (b) 5|10-storey building cutaway.
The DCM (ductility class medium) structures were designed according to EN 1990:2002 [36], EN 1998-1:2004 [1] and prEN1998-1-2:2024 [37]. Despite the structures designed with those provisions being considered new structures, these ones will pass through the corrosion process during their life cycle. It is crucial to understand the impact of corrosion on seismic performance to better predict its future behaviour.
The models have been named as shown in Figure 5. The first two characters (FR) indicate that the structures are frame structures. Then, the next ones (5S or 10S) demonstrate the number of storeys of the building. The third part specifies the ground floor height (3, 4 or 5 m), and, finally, the last part indicates the behaviour factor value used in the design considering the regularity classification of the structure.
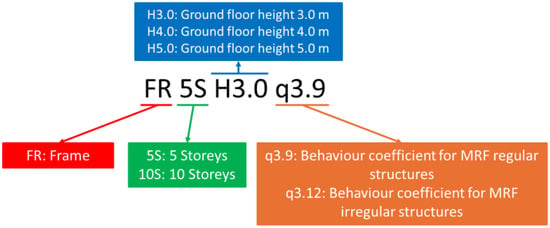
Figure 5.
Adopted nomenclature to identify the models.
The material’s characteristics and actions considered in the design were all fully discussed by Santos et al. [5]. The structures were DCM made of C30/37 concrete (fc = 38 MPa), with properties defined by Eurocode 2 [38] and EN 206-1:2007 [39]. The reinforcement steel is classified as B500 (fy = 520 MPa), with mechanical properties defined by EN 10080:2005 [40]. Regarding the loads considered in the design, we considered, for vertical loads, the office buildings’ characteristics. Additionally, the aforementioned work specified the approach for the seismic load consideration. These data were considered for the corrosion impact on the seismic response.
Figure 6 demonstrates the maximum lateral stiffness shift (Max inter-storey Δk) between storeys observed in each model, observing the vertical irregularity limit criterion of the 30% state by prEN1998-1-2:2024 [37]. Considering that this is the control variable regarding the irregularity in the elevation imposition, these results were used to classify the structures as regular or irregular in elevation.
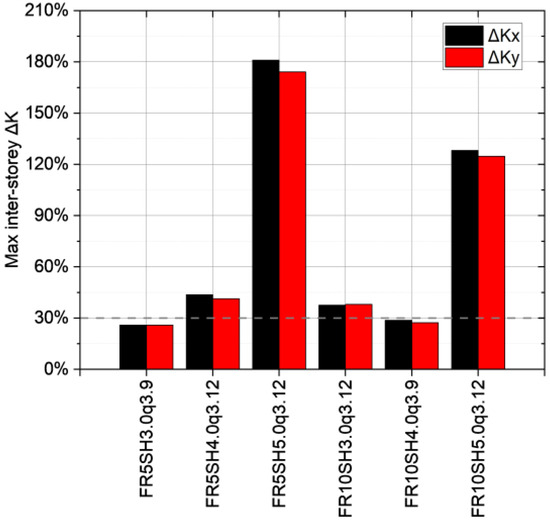
Figure 6.
Maximum inter-storey lateral stiffness shift in X- and Y-axis.
The corrosion propagation has been considered in three different scenarios, with levels of corrosion of 0%, 5%, 10%, 15% and 20%, as shown in Figure 7 and described below:
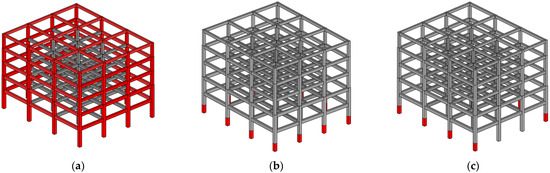
Figure 7.
Corrosion scenarios: (a) scenario 1; (b) scenario 2; and (c) scenario 3.
- Scenario 1: Corrosion in all external RC elements, representing the worst environmental condition, according to one scenario proposed by Caixinhas et al. [21];
- Scenario 2: Corrosion in all peripheral columns until a 1.50 m height;
- Scenario 3: Corrosion in columns of two opposite façades until a 1.50 m height.
5. Results and Discussion
Figure 8, Figure 9, Figure 10 and Figure 11 present, respectively, the capacity curves, the critical points of those curves, the inter-storey drifts and the limit states demonstrated in the assessed models, considering each level of corrosion and scenario, as discussed previously in Section 4. Table 5 demonstrates the percentual variation in critical points observed in capacity curves in comparison with each uncorroded structure.
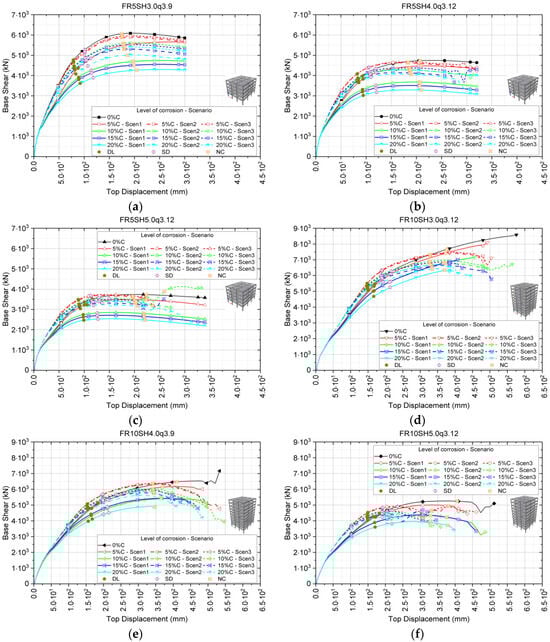
Figure 8.
The 5|10-storey frame structures’ capacity curves with various levels of corrosion, considering each model typology: (a) FR5SH3.0q3.9; (b) FR5SH4.0q3.12; (c) FR5SH5.0q3.12; (d) FR10SH3.0q3.12; (e) FR10SH4.0q3.9; (f) FR10SH5.0q3.12.
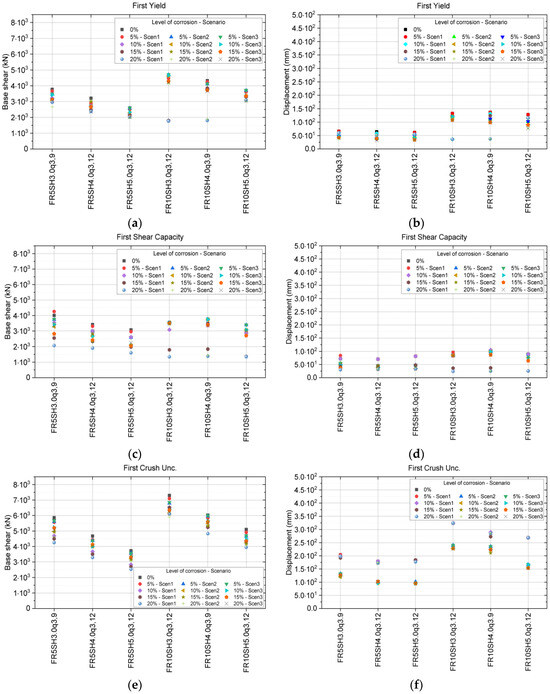
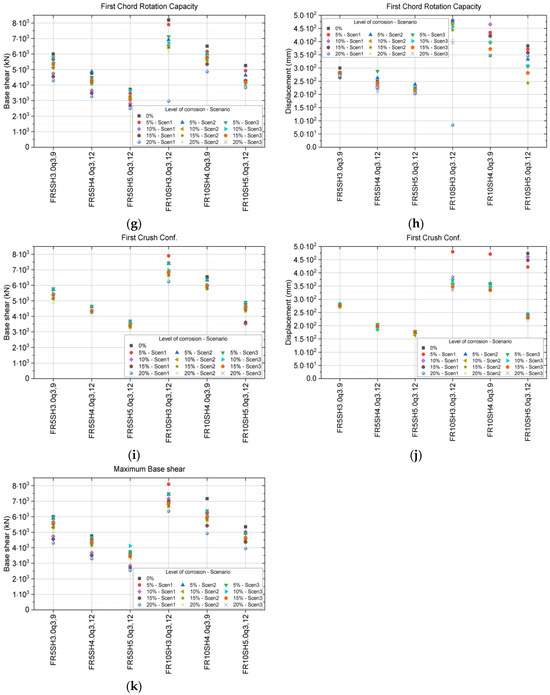
Figure 9.
Critical points of capacity curves in 5|10-storey frame buildings considering different levels of corrosion: (a,b) First yield; (c,d) First Shear Capacity; (e,f) First Crush Uncover; (g,h) First Chord Rotation Capacity; (i,j) First Crush Confinement; (k) Maximum Base Shear.
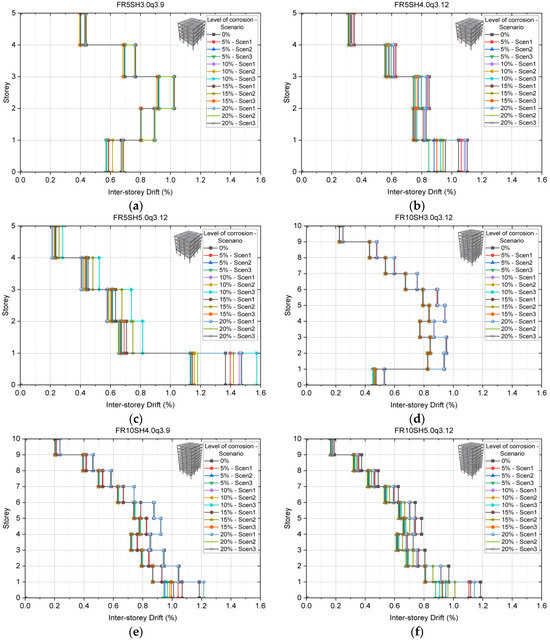
Figure 10.
Inter-storey drifts in 5|10-storey frame buildings considering different levels of corrosion, considering each model typology: (a) FR5SH3.0q3.9; (b) FR5SH4.0q3.12; (c) FR5SH5.0q3.12; (d) FR10SH3.0q3.12; (e) FR10SH4.0q3.9; (f) FR10SH5.0q3.12.
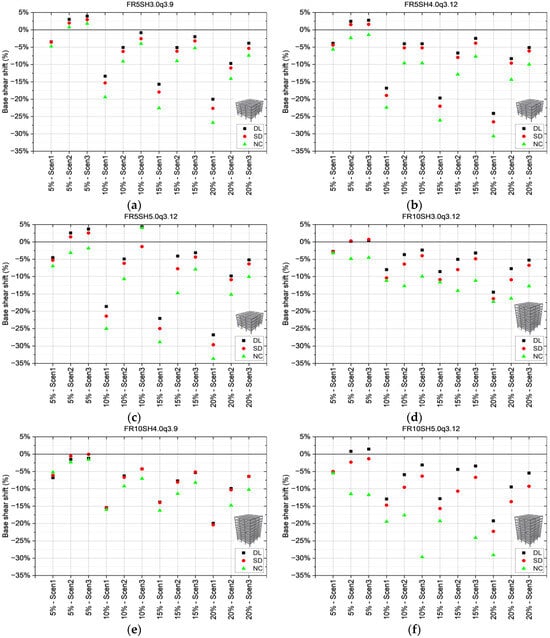
Figure 11.
The 5|10-storey frame structure limit state comparison by corrosion level, considering each model typology: (a) FR5SH3.0q3.9; (b) FR5SH4.0q3.12; (c) FR5SH5.0q3.12; (d) FR10SH3.0q3.12; (e) FR10SH4.0q3.9; (f) FR10SH5.0q3.12.
Table 5.
Critical points of capacity curve comparison with uncorroded structures on base shear.
From these figures and tables, the following conclusions can be drawn:
- From the capacity curves demonstrated in Figure 8, the level of corrosion that starts to impact the structural capacity significantly is 10% for 5-storey models and 5% for 10-storey structures. This is related to the structural stiffness distribution and the magnitude of P-Delta effects. In 10-storey models, even a 5% loss in rebar can substantially impact the stiffness required to counteract P-Delta effects, reducing the structural capacity. Conversely, 5-storey buildings, due to lower axial demands and shorter heights that reduce the impact of lateral loads, tolerate a higher degree of degradation before the stiffness loss starts to compromise structural integrity or shift the dynamic period. Figure 9 illustrates the maximum base shear shift compared to each corroded model. It shows this tendency, except for FR10SH5.0q3.12, in all studied scenarios, which does not present a considerable impact on the level of corrosion of 5%. For the 10%, 15% and 20% corrosion, a decrease in the maximum base shear was observed at around 6.1–32.0% and 13.5–31.4% for 5-storey and 10-storey buildings, respectively. Scenario 1 presented the worst behaviour in that matter. However, those maximum base shear values were reached with lower displacements in scenarios 2 and 3. When compared to the irregularity in elevation, the lateral stiffness shift and the level of corrosion, the maximum base shear behaviour is similar, regardless of the level of irregularity.
- In Figure 9 and Table 5, the corrosion impacts are substantial for each structural critical performance criterion, as observed similarly in Turan et al. [14]:
- a.
- First yield: Except for FR5SH4.0q3.12 in scenarios 2 and 3, almost all structures behave similarly to each other, presenting a substantial decrease in the first yield appearance from 10% corrosion. However, FR10SH3.0q3.12, in scenario 1, presented a considerably higher decrease in that parameter at 10%, 15% and 20% corrosion. The same occurs for FR10SH4.0q3.9 for 20% corrosion.
- b.
- First shear capacity: All structures performed similarly, regardless of irregularity differences. The considerable decrease in shear capacity in comparison to that observed in the respective uncorroded structures starts to occur at 10% corrosion in 5-storey buildings (11.6–48.5%) and to all buildings at 15% corrosion (31.8–53.5%) and 20% corrosion (44.3–62.3%). It is important to highlight that scenario 1 demonstrates the worst performance in that matter in comparison to scenarios 2 and 3 in all structures at the levels of corrosion of 15% and 20%.
- c.
- First crush uncover: As observed in the aforementioned parameters, the level of 10% corrosion is the crucial point of impact for this criterion. For 5-storey buildings, the shifts in base shear for 5%, 10%, 15% and 20% corrosion in comparison to the respective uncorroded structures were, respectively, 5.0–6.3%, 19.9–23.9%, 23.2–27.7% and 27.4–32.1% for scenario 1; 4.0–6.4%, 12.9–15.3%, 11.4–15.4% and 12.8–21.0% for scenario 2; and 3.3–6.4%, 9.3–14.4%, 11.3–11.7%; and 13.4–14.0% for scenario 3. For 10-storey models, the shifts were, respectively, 2.8–3.7%, 10.7–14.8%, 10.6–14.6% and 16.3–22.5% for scenario 1; 1.2–8.6%, 8.8–16.6%, 11.7–17.8% and 14.0–19.9% for scenario 2; and 0.5–7.7%, 6.1–12.3%, 7.2–14.5% and 8.6–16.3% for scenario 3. When performing the same assessment for the displacement observed in Figure 9f, a wider shift can be seen in scenarios 2 and 3 in comparison to the first one.
- d.
- First chord rotation capacity: The first chord rotation capacity is the chord rotation limit that marks the beginning of significant inelastic deformation in RC members. This criterion behaves analogously to the previous one. For 5-storey buildings, the shifts in base shear for 5%, 10%, 15% and 20% corrosion in comparison to the respective uncorroded structures were, respectively, 5.8–6.6%, 21.0–24.4%, 24.1–28.3% and 28.4–32.1%. For 10-storey models, the shifts were, respectively, 3.6–6.3%, 18.0–18.6%, 17.7–18.5% and 25.2–27.0%. Performing the same analysis for the displacement observed in Figure 9h, the variations for the 5-storey model were, respectively, 3.6–15.2%, 1.9–24.4%, 10.1–28.3% and 10.9–32.9%. For 10-storey buildings they were 3.6–18.4%, 11.2–20.8%, 11.0–18.5% and 10.7–63.8%.
- e.
- First crush confinement: This parameter was observed only in 10-storey structures in scenario 1 and in all structures for scenarios 2 and 3. However, the major shift does not surpass 15%, except for FR10SH5.0q3.12 in scenarios 2 and 3, which presents differences of 22.2% and 20.0% in shift, respectively.
- Figure 10 demonstrates that the corrosion level does not considerably impact the inter-storey drift. However, the irregularity, as expected and demonstrated in Santos et al. [5], substantially impacts that parameter.
- In Figure 11 it can be observed that, at the level of 5% of corrosion, the base shear shift in limit states at each level of corrosion in comparison to respective uncorroded models is no more than 11.7%. However, this variation is considerably higher, from 10% to 20% corrosion, reaching a maximum of 33.6%. It can also be observed that for 5% corrosion, the difference in the base shear between the limit state levels is slight, except for the FR10SH5.0q3.12 model. For the higher level of corrosion, the behaviour is the opposite in almost all cases.
6. Summary and Conclusions
RC structures are extensively utilised in contemporary construction. Nonetheless, they may undergo degradation processes caused by corrosion and seismic events throughout their service life. Accurately predicting structural behaviour, considering corrosion and seismic responses, remains a considerable challenge in numerical modelling. The existing literature lacks extensive research on modelling strategies that integrate the effects of corrosion, seismic responses in reinforced concrete structures and their impacts in vertical irregular structures, highlighting the complexity and the fact that this field remains significantly underexplored.
This work is intended to contribute to that field by performing a numerical analysis of 5- and 10-storey MRF structures, considering 0%, 5%, 10%, 15% and 20% corrosion in three distinct scenarios: throughout all peripheral structural elements, until 1.5 m of all columns and until 1.5 m in the columns of the opposite façades. Several experimental studies were considered to calibrate the models at each level of corrosion.
From this work, the following conclusions can be made:
- For the assessed 5- and 10-storey RC structures, 10% and 5% corrosion were, respectively, the levels that started to cause a substantial impact on the seismic response;
- Corrosion does not significantly impact the inter-storey drifts in the case where the same corrosion level was assumed in all floors and also in scenarios that present corrosion only until the 1.5 m height, regardless of the different levels of vertical irregularities;
- Although corrosion decreases the structural capacity, vertical irregularity has a greater negative impact on the seismic response;
- When combined, corrosion and irregularity in elevation lead to the worst-case seismic vulnerability.
It is important to highlight the limitations of this study. It just considered RC frame structures. Additionally, as highlighted by Turan et al. [13], to more accurately assess the corrosion in structural models, work should be based on the actual corrosion ratio obtained from experimental studies in order to better capture some effects, such as the beam-column joint behaviour. For future studies, it is important to assess the following:
- Plan irregularity combined with corrosion: How torsional effects interact with corrosion to alter global failure mechanisms;
- RC wall structures: How corrosion affects the lateral stiffness and energy dissipation of dense reinforcement zones in shear walls;
- Concrete strength: Considering that this study assessed only MRF RC structures with a concrete strength of C30/37, future research should examine other concrete grades and confinement levels’ influence on collapse modality shifts in structures with different levels of corrosion and irregularities;
- Non-uniform corrosion: Experimentally and numerically assess to provide modelling settings for future studies that address regions subjected to this type of corrosion;
- Dynamic time-history analysis: Consider, based on the previous discussion, using this approach instead of an adaptive pushover analysis to verify the accuracy of this method.
Finally, based on this study’s findings, future seismic design provisions should consider the combined effect of structural degradation and irregularity. Further study is necessary to assess if a more restricted behaviour factor for new structures would be beneficial and sufficient to address this issue, and a displacement-based check for existing buildings in corrosive environments to maintain safe performance levels is required.
Author Contributions
Conceptualization, D.S.; Methodology, D.S.; Validation, J.M.; Formal analysis, D.S.; Writing—original draft, D.S.; Writing—review and editing, J.M., A.F. and H.V.; Supervision, J.M., A.F. and H.V.; Project administration, J.M., A.F. and H.V.; Funding acquisition, D.S., J.M., A.F. and H.V. All authors have read and agreed to the published version of the manuscript.
Funding
This work is financially supported by national funds through the FCT of Project ERES2—DRI/India/0645/2020—Evaluation and Retrofitting of Existing Buildings for Safe and Sustainable Built Environment, with the DOI https://doi.org/10.54499/DRI/India/0645/2020. It was also financially supported by UID/04708/2025 and https://doi.org/10.54499/UID/04708/2025, of the CONSTRUCT—Instituto de I&D em Estruturas e Construções—and UID/6438/2025 of the research unit CERIS, funded by Fundação para a Ciência e a Tecnologia, I.P./MECI, through national funds.
Data Availability Statement
The data used to support the findings of this study are available from the corresponding author upon request.
Acknowledgments
The authors would like to express their gratitude to the editors and reviewers for their constructive comments, which greatly improved the quality of this paper.
Conflicts of Interest
The authors declare no conflicts of interest.
Abbreviations
The following abbreviations are used in this manuscript:
| a1, a2, a3, a4 | Transition curve shape calibrating coefficients A1, A2, A3 and A4, respectively |
| ag | Design ground acceleration |
| Es | Steel elasticity modulus |
| fc | Concrete yield strength |
| fy | Steel yield strength |
| k | Kinematic/isotropic weighting coefficient |
| P | Fracture/bucking strain |
| r (%) | Spurious unloading corrective parameter |
| R0 | Transition curve initial shape parameter |
| Soil factor | |
| ξ | Damping coefficient |
| µ | Strain hardening parameter |
| Specific weight (kN/m3) | |
| DCM | Ductility class medium |
| DL, SD, NC | Limit states: damage limitation, significant damage and near collapse, respectively |
| MRF | Moment-resisting frame |
| RC | Reinforced concrete |
References
- CEN EN 1998-1; Eurocode 8: Design of Structures for Earthquake Resistance—Part 1: General Rules, Seismic Actions and Rules for Buildings. European Comittee for Standardization: Brussels, Belgium, 2004.
- Benaied, B.; Hemsas, M.; Benanane, A.; Hentri, M. Seismic Analysis of RC Building Frames with Vertical Mass and Stiffness Irregularities Using Adaptive Pushover Analysis. Rev. Construcción 2023, 22, 597–612. [Google Scholar] [CrossRef]
- Vuran, E.; Serhatoğlu, C.; Timurağaoğlu, M.Ö.; Smyrou, E.; Bal, İ.E.; Livaoğlu, R. Damage Observations of RC Buildings from 2023 Kahramanmaraş Earthquake Sequence and Discussion on the Seismic Code Regulations. Bull. Earthq. Eng. 2024, 23, 1153–1182. [Google Scholar] [CrossRef]
- Işık, E.; Avcil, F.; Büyüksaraç, A.; Arkan, E. Comparative Analysis of Target Displacements in RC Buildings for 2023 Türkiye Earthquakes. Appl. Sci. 2025, 15, 4014. [Google Scholar] [CrossRef]
- Santos, D.; Melo, J.; Varum, H. Comparative Analysis of the Impact of Vertical Irregularities on Reinforced Concrete Moment-Resisting Frame Structures According to Eurocode 8. Buildings 2024, 14, 2982. [Google Scholar] [CrossRef]
- Berto, L.; Vitaliani, R.; Saetta, A.; Simioni, P. Seismic Assessment of Existing RC Structures Affected by Degradation Phenomena. Struct. Saf. 2009, 31, 284–297. [Google Scholar] [CrossRef]
- Afsar Dizaj, E.; Kashani, M.M. Nonlinear Structural Performance and Seismic Fragility of Corroded Reinforced Concrete Structures: Modelling Guidelines. Eur. J. Environ. Civ. Eng. 2022, 26, 5374–5403. [Google Scholar] [CrossRef]
- Meda, A.; Mostosi, S.; Rinaldi, Z.; Riva, P. Experimental Evaluation of the Corrosion Influence on the Cyclic Behaviour of RC Columns. Eng. Struct. 2014, 76, 112–123. [Google Scholar] [CrossRef]
- Goksu, C.; Ilki, A. Seismic Behavior of Reinforced Concrete Columns with Corroded Deformed Reinforcing Bars. ACI Struct. J. 2016, 113, 1053–1064. [Google Scholar] [CrossRef]
- Yang, S.Y.; Song, X.B.; Jia, H.X.; Chen, X.; Liu, X. La Experimental Research on Hysteretic Behaviors of Corroded Reinforced Concrete Columns with Different Maximum Amounts of Corrosion of Rebar. Constr. Build. Mater. 2016, 121, 319–327. [Google Scholar] [CrossRef]
- Rajput, A.S.; Sharma, U.K. Corroded Reinforced Concrete Columns under Simulated Seismic Loading. Eng. Struct. 2018, 171, 453–463. [Google Scholar] [CrossRef]
- Rinaldi, Z.; Di Carlo, F.; Spagnuolo, S.; Meda, A. Influence of Localised Corrosion on the Cyclic Response of Reinforced Concrete Columns. Eng. Struct. 2022, 256, 114037. [Google Scholar] [CrossRef]
- Turan, A.İ.; Kumbasaroglu, A.; Yalciner, H.; Ayaz, Y. Prediction of Seismic Performance Levels of Corroded RC Frames Based on Crack Width. Structures 2025, 76, 108860. [Google Scholar] [CrossRef]
- Turan, A.İ.; Ayaz, Y.; Yalciner, H.; Kumbasaroglu, A. An Experimental Evaluation on Structural Performance Level of Corroded Reinforced Concrete Frames. Eng. Struct. 2025, 325, 119479. [Google Scholar] [CrossRef]
- Berto, L.; Caprili, S.; Saetta, A.; Salvatore, W.; Talledo, D. Corrosion Effects on the Seismic Response of Existing RC Frames Designed According to Different Building Codes. Eng. Struct. 2020, 216, 110397. [Google Scholar] [CrossRef]
- Del Zoppo, M.; Di Ludovico, M.; Lignola, G.P.; Prota, A. Time-Dependent Tsunami Fragility Analysis for Reinforced Concrete Building Stock. Eng. Struct. 2025, 330, 119931. [Google Scholar] [CrossRef]
- Hu, J.Y.; Zhang, S.S.; Chen, E.; Li, W.G. A Review on Corrosion Detection and Protection of Existing Reinforced Concrete (RC) Structures. Constr. Build. Mater. 2022, 325, 126718. [Google Scholar] [CrossRef]
- Antoniou, S.; Pinho, R. Advantages and Limitations of Adaptive and Non-Adaptive Force-Based Pushover Procedures. J. Earthq. Eng. 2004, 8, 497–522. [Google Scholar] [CrossRef]
- Antoniou, S.; Pinho, R. Development and Verification of a Displacement-Based Adaptive Pushover Procedure. J. Earthq. Eng. 2004, 8, 643–661. [Google Scholar] [CrossRef]
- Ruggieri, S.; Uva, G. Extending the Concepts of Response Spectrum Analysis to Nonlinear Static Analysis: Does It Make Sense? Innov. Infrastruct. Solut. 2024, 9, 235. [Google Scholar] [CrossRef]
- Caixinhas, A.; Tomé, J.; Melo, J.; Marreneca, G.; Furtado, A. Impact of Corrosion on the Behaviour of Reinforced Concrete Buildings. Buildings 2025, 15, 1267. [Google Scholar] [CrossRef]
- Seismosoft. SeismoStruct 2021—A Computer Program for Static and Dynamic Nonlinear Analysis of Framed Structures; Seismosoft: Pavia, Italy, 2021. [Google Scholar]
- Caprili, S.; Salvatore, W. Cyclic Behaviour of Uncorroded and Corroded Steel Reinforcing Bars. Constr. Build. Mater. 2015, 76, 168–186. [Google Scholar] [CrossRef]
- Zhang, W.; Song, X.; Gu, X.; Li, S. Tensile and Fatigue Behavior of Corroded Rebars. Constr. Build. Mater. 2012, 34, 409–417. [Google Scholar] [CrossRef]
- Imperatore, S.; Rinaldi, Z.; Drago, C. Degradation Relationships for the Mechanical Properties of Corroded Steel Rebars. Constr. Build. Mater. 2017, 148, 219–230. [Google Scholar] [CrossRef]
- Finozzi, I.; Saetta, A.; Budelmann, H. Structural Response of Reinforcing Bars Affected by Pitting Corrosion: Experimental Evaluation. Constr. Build. Mater. 2018, 192, 478–488. [Google Scholar] [CrossRef]
- Salvatore, W.; Caprili, S.; Braconi, A.; Finetto, M.; Bianco, L.; Ascanio, C.; Moersch, J.; Apostolopoulos, C.; Ferreira Pimenra, G. Effects of Corrosion on Low-Cycle Fatigue (Seismic) Behaviour of High-Strength Steel Reinforcing Bars (Rustell); European Union Research: Ispra, Italy, 2014. [Google Scholar]
- Caprili, S.; Moersch, J.; Salvatore, W. Mechanical Performance versus Corrosion Damage Indicators for Corroded Steel Reinforcing Bars. Adv. Mater. Sci. Eng. 2015, 2015, 739625. [Google Scholar] [CrossRef]
- Monti, G.; Nuti, C.; Santini, S. CYRUS-Cyclic Response of Upgraded Sections; Università degli Studi G. D’Annunzio di Chieti: Chieti, Italy, 1996. [Google Scholar]
- Mander, J.B.; Priestley, M.J.N.; Park, R. Theoretical Stress-Strain Model for Confined Concrete. J. Struct. Eng. 1988, 114, 1804–1826. [Google Scholar] [CrossRef]
- Enrique Martlnez-Rueda, J.; Elnashai, A.S. Confined Concrete Model under Cyclic Load. Mater. Struct. 1997, 30, 139–147. [Google Scholar] [CrossRef]
- Alipour, A.; Shafei, B.; Shinozuka, M. Performance Evaluation of Deteriorating Highway Bridges Located in High Seismic Areas. J. Bridge Eng. 2011, 16, 597–611. [Google Scholar] [CrossRef]
- Rao, A.S.; Lepech, M.D.; Kiremidjian, A.S.; Sun, X.Y. Simplified Structural Deterioration Model for Reinforced Concrete Bridge Piers under Cyclic Loading. Struct. Infrastruct. Eng. 2017, 13, 55–66. [Google Scholar] [CrossRef]
- Kashani, M.M.; Lowes, L.N.; Crewe, A.J.; Alexander, N.A. Nonlinear Fibre Element Modelling of RC Bridge Piers Considering Inelastic Buckling of Reinforcement. Eng. Struct. 2016, 116, 163–177. [Google Scholar] [CrossRef]
- Afsar Dizaj, E.; Madandoust, R.; Kashani, M.M. Exploring the Impact of Chloride-Induced Corrosion on Seismic Damage Limit States and Residual Capacity of Reinforced Concrete Structures. Struct. Infrastruct. Eng. 2018, 14, 714–729. [Google Scholar] [CrossRef]
- CEN EN 1990; Eurocode—Basis of Structural Design. European Comittee for Standardization: Brussels, Belgium, 2002.
- CEN PrEN 1998-1-2; Eurocode 8: Design of Structures for Earthquake Resistance—Part 1-2: Rules for New Buildings, Draft Post-ENQ 48th Meeting CEN/TC250/SC8. European Committee for Standardization: Brussels, Belgium, 2024.
- CEN EN 1992-1-1; Eurocode 2—Design of Concrete Structures—Part 1–1: General Rules and Rules for Buildings. European Committee for Standardization: Brussels, Belgium, 2004.
- CEN EN 206; Concrete—Part 1: Specification, Performance, Production and Conformity. European Comittee for Standardization: Brussels, Belgium, 2007.
- CEN EN 10080; Steel for the Reinforcement of Concrete—Weldable Reinforcing Steel—General. BSI, European Comittee for Standardization: Brussels, Belgium, 2005.


Disclaimer/Publisher’s Note: The statements, opinions and data contained in all publications are solely those of the individual author(s) and contributor(s) and not of MDPI and/or the editor(s). MDPI and/or the editor(s) disclaim responsibility for any injury to people or property resulting from any ideas, methods, instructions or products referred to in the content. |
© 2026 by the authors. Licensee MDPI, Basel, Switzerland. This article is an open access article distributed under the terms and conditions of the Creative Commons Attribution (CC BY) license.