Abstract
Openings are often introduced in continuous reinforced concrete (RC) deep beams to accommodate utility services, which can compromise their structural capacity. This paper presents a numerical investigation—via nonlinear finite element (FE) modeling—into the effects of post-construction rectangular openings in continuous high-strength concrete (HSC) deep beams. A previously tested two-span continuous HSC deep beam with rectangular openings was used for model validation and subsequently adopted in a parametric study, maintaining consistent beam and opening dimensions. The study focuses on the influence of opening location, both symmetric and asymmetric, at mid-depth within critical shear and flexural zones of the two-span continuous deep beam. Key parameters analyzed include load-carrying capacity, support reactions, initial and post-cracking stiffness, reinforcement stresses, and concrete stress distribution. Results indicate that mid-depth openings located in flexure-critical regions have minimal impact, causing only a 3–5% reduction in load-carrying capacity and negligible changes in stress behavior. However, when openings intersect the primary strut paths, reductions in capacity ranged from 17% to 53%, depending on the number and location of the openings (i.e., crossing external or internal struts). Furthermore, symmetric placement of openings was found to significantly mitigate performance degradation compared to asymmetric configurations. These findings provide design insights that enable safe incorporation of service openings without excessive material use, thereby promoting more sustainable and resource-efficient concrete construction.
1. Introduction
Reinforced concrete (RC) deep beams are distinguished by their substantial depth compared to their span. According to ACI 318-25 [1], RC beams are classified as deep beams if they meet any one or both of these criteria: (a) the clear span is less than or equal to four times the overall depth of the member, or (b) the shear span is less than or equal to twice the overall depth. These deep beams are commonly utilized as pile caps, or transfer girders in various structures, including high-rise buildings, bridges, parking garages, offshore constructions, and shear walls. In some cases, openings may be necessary for utility passage, which can impact the load carrying capacity of deep beams, particularly when these openings intersect the struts that facilitate load transfer to the supports. Most previous studies have primarily concentrated on examining the response of single span deep beams with web openings [2,3,4,5,6].
Alhammud et al. [2] provided a comprehensive overview and analysis of the existing literature regarding the structural effects of openings in concrete deep beams, discussing design considerations and performance characteristics. Jasim et al. [3] investigated the effect of size and location of square web openings on the overall structural behavior of reinforced concrete deep beams, reporting on experimental findings related to strength and stiffness. Sheikh-Sobeh et al. [4] conducted a numerical analysis to study the behavior of concrete deep beams when the traditional steel reinforcement is replaced with Glass Fiber-Reinforced Polymer (GFRP) bars, evaluating performance under load. Chai et al. [5] presented a combined experimental and numerical study on the strength performance of deep beams, focusing on the use of perforated thin mild steel plates as an alternative form of shear reinforcement. Chin et al. [6] offered a review of research centered on the use of FRP (Fiber-Reinforced Polymer) materials for strengthening reinforced concrete deep beams that contain openings, summarizing various strengthening techniques and their effectiveness.
Yang and Ashour [7] examined how the positioning of rectangular openings influences the behavior of RC continuous deep beams. Their study focused on key parameters such as web reinforcement layout surrounding the openings, opening positions, and the ratio of shear span to overall depth. Openings were placed in both the exterior and interior shear spans, with shear span-to-depth ratios of 0.6 and 1.0. The dimensions of the openings were 180 × 120 mm for the shorter span ratio and 360 mm × 120 mm for the longer one. Results showed that openings in the exterior shear span led to a reduction in load capacity ranging from 14% to 19%, whereas openings within the interior span caused more significant reductions, between 31% and 49%.
Mohamed et al. [8] investigated the structural performance of RC deep beams both with and without openings. Their findings suggested that to restrict the decrease in load-bearing capacity to within 10% of that of a solid beam, the depth of the opening should be less than 20% of the beam’s total depth. In a separate numerical study, Rodriguez et al. [9] explored the behavior of RC continuous deep beams containing openings. They conducted a parametric study using FE simulation to evaluate the influence of the position of symmetrical 300 mm diameter circular openings in the web of beams having a depth of 1000 mm, considering concentrated and distributed load. The test results revealed that the openings located in the interior struts of the beam had a notable impact on load capacity, resulting in a decrease of 38% to 42% compared to openings located on the outer struts, which had reduction in peak load ranging from 4% to 13%. In case of a uniformly distributed load, there is a significant increase in the load capacity compared to a concentrated load, and a lower load reduction compared to a concentrated load when the openings were located on the inside regions of the beam.
Yousef et al. [10] tested seven continuous ultra-high-performance fiber reinforced concrete (UHPFRC) deep beams having square and rectangular openings located on exterior struts. The variables were the opening’s position, height, and width and the web reinforcement. They used one and two identical openings having height of 20% and 40% of the beam depth. The study revealed that the presence of openings of height equal to 20% of the beam depth, resulted in a reduction in failure load varying from 37% to 54%. Similarly, when the height of the openings increased to 40% of the overall beam depth, the load carrying capacity decreased by approximately 37% to 54%.
Ashour and Rishi [11] investigated the behavior of 16 continuous RC deep beams incorporating rectangular openings positioned in either the interior or exterior struts. The study identified two distinct failure mechanisms, influenced primarily by the location of the openings, irrespective of their dimensions or the configuration and quantity of web reinforcement. Beams with openings crossing the interior strut exhibited failure through diagonal cracking that extended from the corners of the openings toward the edges of the loading. Conversely, when the openings were crossing the exterior strut, diagonal cracks developed across both the interior and exterior spans. It was also observed that openings in the exterior spans had a less detrimental impact on load-carrying capacity compared to those in the interior spans.
Khalaf et al. [12] explored the retrofitting of continuously supported RC deep beams with symmetrical openings using CFRP strips. The square openings, measuring 160 mm, were centrally located at each mid-span. Their findings demonstrated that the ultimate load of the beam with openings reached 79% of the ultimate load of a solid specimen. Al-Mahbashi et al. [13] examined the impact of asymmetric rectangular and circular openings in high strength concrete (HSC) continuous deep beams. They observed that the existence of two openings within the same span caused a significant decrease in failure load, regardless of the openings’ shape. When considering the specific layout of the openings, with one opening positioned near the exterior support in the left span and the second opening situated close to the interior support in the right span, the reduction in failure load was slightly higher. However, the reduction was almost identical for both shapes of openings, with a 41% decrease for circular openings and a 45% decrease for rectangular openings. This study was extended by the authors for strengthening the deep beams having rectangular [14] and circular openings [15] using different schemes involving steel plates and fiber-reinforced polymer (FRP).
In HSC deep beams, geometric proportions play a critical role in governing shear behavior. The length-to-depth ratio (l/d) is particularly influential: beams with very small l/d ratios (typically below 2.0) develop a pronounced arching action, forming a “safe zone” in which shear capacity is relatively high and failure tends to be more ductile. As l/d increases toward more slender configurations, the internal force transfer becomes increasingly reliant on diagonal tension fields, creating a “risky zone” characterized by reduced shear capacity and greater sensitivity to cracking [16]. Similarly, the width-to-depth ratio (b/d) affects the degree of lateral confinement and the spreading of compressive stresses. Larger b/d ratios generally enhance shear strength by improving confinement, whereas smaller b/d ratios may promote brittle diagonal shear failure [16]. Understanding these geometric influences is essential, especially for deep beams with web openings, where the disturbance of stress trajectories can further influence the vulnerabilities associated with unfavorable l/d and b/d combinations.
Additionally, the shear span-to-depth ratio (λ) and the vertical web reinforcement ratio () also affect the shear capacity of HSC deep beams. The deep beams with small λ values predominantly exhibit arching action and thus benefit less from increased , whereas beams with larger λ values rely more heavily on vertical web reinforcement to control diagonal tension cracking. While increasing generally improves shear resistance, experimental evidence indicates diminishing returns beyond an optimum range, beyond which additional reinforcement does not significantly enhance capacity [17].
In RC deep beams, load transfer is governed by nonlinear compression struts and tension ties, and the presence of openings can significantly disturb these internal load paths. According to the fundamental principles of strut-and-tie modeling (STM) outlined in a classical paper by Schlaich et al. [18], openings interrupt the natural flow of principal stresses, forcing the formation of alternative, and often less efficient, strut-and-tie mechanisms. Although developing a complete STM for continuous deep beams with multiple post-construction openings is highly complex and beyond the scope of this study, the conceptual STM framework provides a useful basis for interpreting how the size, location, and symmetry of openings influence stress redistribution and failure patterns.
The aforementioned review indicates that there is limited research on the impact of openings in HSC continuous deep beams. This study addresses this gap in the existing literature by investigating the effects of varying numbers of rectangular openings placed both symmetrically and asymmetrically at different locations within the flexure and shear critical zones of an HSC two-span continuous deep beam. Nonlinear FE analysis was performed to validate the numerical models, using the beams tested in the authors’ previous study [13,14]. These validated models were then used for a parametric study to assess the influence of the openings. The continuous beams, composed of two equal spans, have rectangular web openings positioned at various locations within the critical shear and flexural zones. Different opening layouts were considered, with a solid control beam as the reference. Key parameters analyzed included load-carrying capacity, support reactions, initial and post-cracking stiffness, reinforcement stresses, and concrete stress distribution.
2. Finite Element Analysis
To investigate the effect of varying the number of rectangular openings in an HSC continuous deep beam, a parametric study was conducted using two-dimensional (2D) nonlinear FE analysis. The analysis was carried out on a two-span continuous deep beam using the DIANA 10.5 FE program [19]. The numerical models were validated against experimental results from the authors’ previous studies [13,14] as well as three-dimensional (3D) numerical models developed using LS-DYNA R11 software [20]. Three-dimensional analysis was not pursued for the parametric study, as it typically demands significantly greater computational time, while 2D FE analysis could deliver comparably accurate results.
The 2D FE models were validated using two beams tested by Al-Mahbashi et al. [13]; one was a control continuous solid deep beam (CS), and the other (R13) had two rectangular openings crossing struts 1 and 3 (Figure 1), with the strut numbering scheme also depicted in Figure 1. The control beam (CS) served as the baseline model for the parametric study. The beams of 150 × 400 mm cross-section and an overall length of 2640 mm, comprising two spans of 1120 mm each and 200 mm overhangs at both ends were used. The longitudinal rebars were 3φ20 for both the top and bottom reinforcement. Web reinforcement was provided using 5 mm diameter bars spaced at 70 mm on center. The openings were rectangular, measuring 118 mm × 150 mm, consistent with those used in the experimental program [13]. Figure 2 shows the rebar cage of beam R13 and the beam after casting. As the openings were post-construction, these were created by inserting a wooden box in the rebar cage, as shown in Figure 2a. The beams were tested by giving a monotonically increasing downward vertical displacement. Figure 3a,b shows the failure of the two beams CS and R13 and Figure 3c,d show the zoomed view of the cracking around openings of R13 at peak load. The beams were cast using ready mix concrete obtained from a local supplier. The concrete mix proportion is given in Table 1.
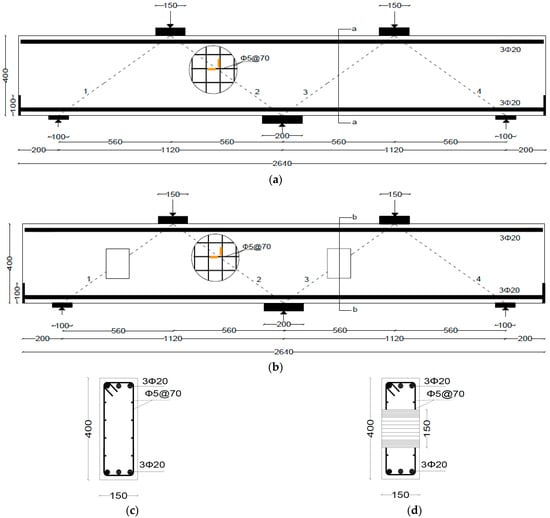
Figure 1.
Detailing of continuous beams [14]: (a) CS; (b) R13. (c) Section a-a. (d) Section b-b (unit: mm, rebar strain gages are shown in orange color).
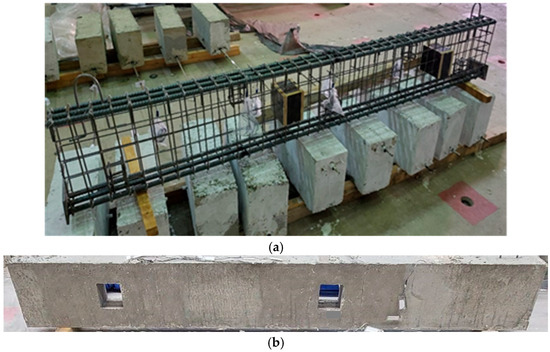
Figure 2.
(a) Rebar cage of beam R13 [13] and (b) beam R13 after casting [14].
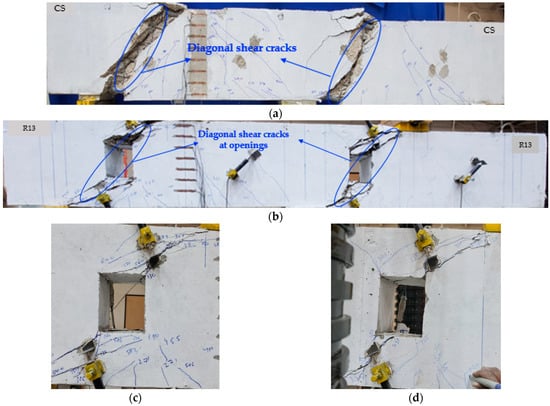
Figure 3.
(a) Control beam (CS) at failure and (b) Beam R13 at failure. (c,d) Zoomed views of cracking around left and right openings in beam R13 at peak load [13,14].

Table 1.
Mix proportion of HSC.
2.1. Two-Dimensional FE Modeling
An eight-node rectangular isoparametric plane stress element was adopted for modeling concrete and steel plates. The maximum mesh size was 20 mm, which is 5% of the overall depth of the beam, as recommended in DIANA 10.5 [19]. The FE mesh of the beams is shown in Figure 4. The rebars were modeled using two-node truss elements, as shown in Figure 5.
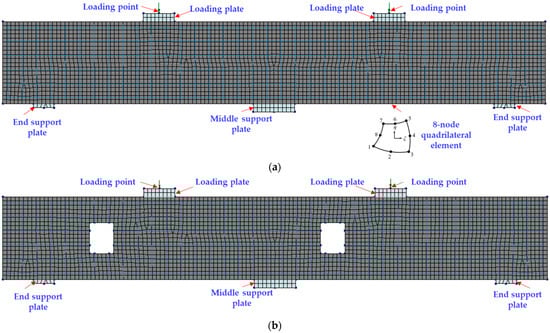
Figure 4.
FE mesh of specimens: (a) CS; (b) R13 [14].
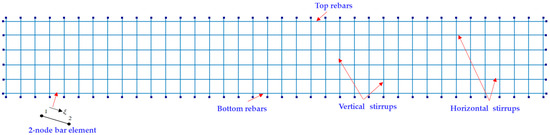
Figure 5.
FE mesh of rebar elements [14].
Concrete was modeled using a total strain-based smeared cracking approach with rotating crack orientation. The behavior of concrete in tension was modeled with a uniaxial stress–strain relationship. The parabolic curve of Feenstra [21] was adopted to model the stress–strain variation in concrete in compression as per the following formula:
where is the actual compressive stress in concrete, is the uniaxial peak compressive stress, is the actual strain, is the uniaxial strain at peak stress, is the ultimate strain, is the compressive fracture energy, is the elastic modulus of concrete, = strain corresponding to the stress level of and is the element length. The properties of materials adopted in FE modeling are listed in Table 2. The compressive strength of concrete reported in the table is 63 MPa indicating it is HSC, as it is greater than 55 MPa [1]. It is worth mentioning here that the constitutive formulation is primarily uniaxial, and the model does not explicitly incorporate multiaxial confinement effects or a full multi-axial failure surface. Instead, multi-axial stress states are implicitly handled, but without an explicit confinement enhancement. In the 3D finite element (FE) analysis, the tri-axial stress behavior of concrete was represented using a continuous surface cap model. This model provides a smooth transition between the hardening cap and the shear yield surface. The initial damage surface coincides with the yield surface, which is defined in terms of three stress invariants [20].
Table 2.
FE modeling key parameters.
Chhetri & Chicchi [22] stated that the available equations of fracture energy of concrete, such as FIB 2010 [23] (Equation (4)), overestimate the failure load.
where is the fracture energy in tension (N/mm), and is in MPa. Chhetri & Chicchi [22] suggested that the fracture energy can be taken to capture the experimental behavior of RC. They used fracture energy of concrete in tension as 0.025, where is the tensile strength of concrete in MPa.
Regarding the fracture energy of concrete in compression, , there are several equations available in the literature. In one such study, Van Aken [24] adopted the value of as 50 to 100 times , whereas DIANA 10.5 [19] used the value of as . Nevertheless, in this study, the fracture energy was taken to capture the behavior of tested beams, and thus, was adopted as and for the compression, was taken as .
The softening in concrete was modeled using the JSCE tension softening model [25], as shown in Figure 6. It is a bilinear tensile stress-crack width ( − ) curve with a breakpoint at , where is concrete’s tensile strength, and is the concrete’s fracture energy in tension. It reaches zero at a crack opening displacement of . The fracture energy of the concrete, , required to form a unit area of stress-free crack, determines the value of crack opening at complete release of stress. The direct tensile strength of concrete was calculated based on the FIB 2010 [23] equation:
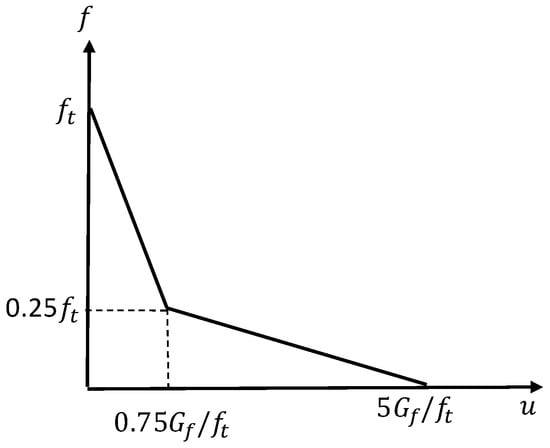
Figure 6.
JSCE softening of concrete in tension (u = crack opening displacement, f = tensile stress) [25].
However, many researchers (e.g., [26]) stated that this value of tensile strength of concrete overestimates the strength of models, so they suggested using as the direct tensile strength of concrete, which has been adopted in this study. The steel reinforcing bars were simulated using embedded truss elements using an elastic-plastic model with Von-Mises yield criterion. The bond between the concrete and the steel bars was taken as perfect, as no slippage occurred during the test. An elastic model was used for steel plates of loading and support points.
The loading in the FE analysis was made consistent with the experimental setup by applying identical vertical displacements at the midpoints of both spans. This displacement-controlled approach ensures full compatibility with the testing procedure and allows the reactions to develop naturally according to the structural response. The same displacement control approach was also adopted for the parametric study presented in subsequent sections.
It is important to note that the global structural response of continuous deep beams is primarily governed by arching action and principal stress trajectories, which are effectively captured under plane-stress conditions. In this study, the 2D DIANA models were validated against previously developed 3D LS-DYNA models by the same authors for both a solid beam and beams with openings. The comparison demonstrated acceptable agreement in terms of load–deflection behavior, crack development, and ultimate capacity, confirming that the key mechanisms controlling the behavior were reproduced with reasonable accuracy in 2D. Although the validation was conducted on two beams (CS and R13), these results are consistent with the established understanding that, for deep beams where plane-stress dominates, 2D modeling can reliably reproduce the essential response even when the opening size or location varies. Therefore, the conclusions drawn from the 2D parametric study are expected to remain valid in a fully 3D context. However, it is acknowledged that 3D effects may become relevant in cases involving severe out-of-plane actions or complex boundary conditions.
2.2. Mesh Sensitivity
A mesh sensitivity analysis was conducted on the control continuous RC deep beam (CS) to determine an appropriate element size for the parametric study. Peak load was used as the validation parameter. Table 3 presents the predicted peak loads and corresponding errors for mesh sizes of 30, 25, and 20 mm. To balance accuracy and computational efficiency, a 20 mm mesh was selected. At this mesh size, the numerical peak load matched the experimental result with negligible error, confirming that it provides sufficient accuracy for subsequent simulations.
Table 3.
Mesh sensitivity of solid control continuous RC deep beam (CS).
2.3. Validation
The FE modeling results obtained from both 2D analysis (using DIANA) and 3D analysis (using LS-DYNA) showed strong agreement with the experimental data for both the control beam (CS) and the beam with rectangular openings (R13), as illustrated in the load-deflection plots (Figure 7 and Figure 8). It is important to note that all the load-deflection plots, including those presented later in the parametric study, illustrate the total load applied on the beam. The 3D analysis predicted the peak load for the control beam with 2% error, estimating 1101 kN compared to the experimental value of 1078 kN. For the beam with openings (R13), the prediction was almost exact, with almost no error (a peak load of 590 kN was predicted versus an experimentally measured load of 592 kN). In comparison, the 2D analysis achieved even closer accuracy. For the control beam (CS), the predicted peak load was 1080 kN, resulting in virtually no error, while for beam R13, the predicted value was 589 kN, corresponding to 1% error. The slightly better performance of 2D analysis can be explained by the distinct numerical methods and solution techniques employed by each program. Additionally, variations in element types, material models, solver settings, convergence criteria, and boundary conditions contribute to the differences in the results of the two models.
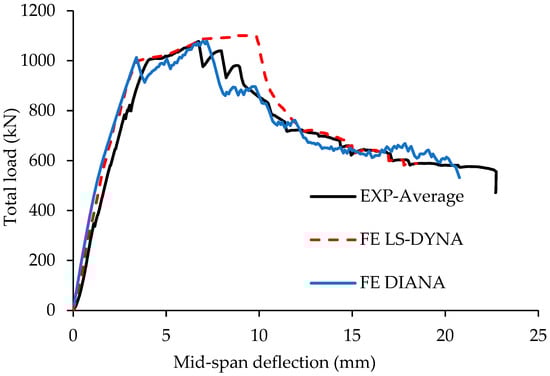
Figure 7.
Comparison of experimental and numerically predicted total load-deflection curves of control specimen, CS [13,14].
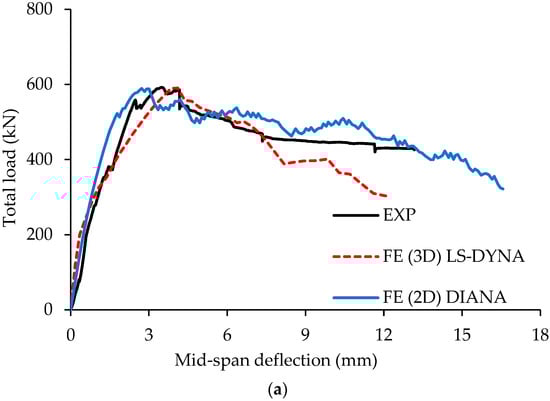
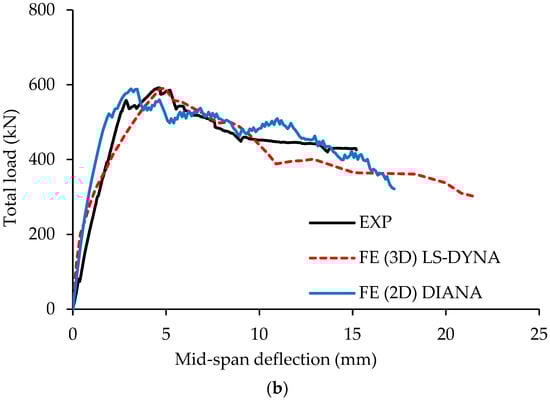
Figure 8.
Comparison of experimental and numerically predicted total load-deflection curves of control specimen, R13: (a) left span; (b) right span [13,14].
The experimental initial and post-cracking stiffnesses were compared with the corresponding 2D and 3D FE predictions. To eliminate seating effects and nonlinearities in the early segment of the experimental load–deflection response, the initial stiffness was defined as the slope between 5% of the peak load and the cracking load. The cracking load was taken as 40% of the peak load, consistent with established ranges for cracking in RC beams [27]. The post-cracking stiffness was then calculated as the slope between the cracking load and the peak load. For the control beam (CS), the experimental initial stiffness was 349 kN/mm. The 3D model predicted 369 kN/mm (6% error), whereas the 2D model predicted 417 kN/mm (19% error). For post-cracking stiffness, the 2D model yielded 251 kN/mm compared to the experimental 235 kN/mm (7% error), while the 3D model produced 270 kN/mm (15% error). Although the 3D model better reproduced the initial stiffness, reflecting its ability to capture out-of-plane confinement, torsional restraint, and local geometric effects, the 2D model performed comparatively better in predicting the peak load. Overall, both modeling approaches demonstrated acceptable accuracy across the key response parameters. Nevertheless, the stiffness values from the 2D analysis in the parametric study remain suitable for comparative evaluation.
These results confirm that the 2D nonlinear FE models can accurately capture the structural behavior of continuous RC deep beams (in terms of the load-carrying capacity), both with and without openings. Moreover, they present a computationally efficient alternative to 3D analysis, particularly suitable for extensive parametric studies. While 3D models can truly capture the stress states, the aim of this study was to evaluate the reduction in load-carrying capacity caused by the number and location of openings, rather than to analyze localized stress concentrations. The validated 2D model thus provided a practical and appropriate tool for achieving the study’s objectives.
While the authors’ previous study [13] validated the 3D models of the control (CS) and beam R13, this paper introduces the validation of 2D models, which are essential for the subsequent parametric study. Furthermore, this research significantly expands the parametric analysis to comprehensively cover all cases, including variations in the number of openings (1 to 4) and their critical locations within both flexure and shear zones.
3. Parametric Study
This parametric study was conducted to investigate the effect of introducing rectangular openings in two-span HSC continuous deep beams. The HSC deep beam with rectangular openings, used above for validation, was adopted for this study, maintaining the same beam and opening dimensions as well as the same beam reinforcement and material properties. The key parameters examined include load-carrying capacity, support reactions, initial stiffness, post-cracking stiffness, rebar stresses, and the distribution of concrete stresses. Given the short span-to-depth ratio of RC deep beams, their structural behavior is primarily governed by shear and strut-and-tie action. As a result, deflections are typically minimal, and deflection checks are generally not critical in their design or assessment. Therefore, deflection was not considered a governing parameter in this study. For consistency and ease of comparison across all beams, the stiffness values of the left and right spans were averaged.
The analysis considered beam configurations with one, two, three, or four rectangular openings, arranged symmetrically or asymmetrically. These openings were positioned in both shear-critical and bending-critical regions to evaluate their influence on structural performance. Although numerous variables can be explored in a parametric study, this investigation focused on rectangular openings of identical size, with their centers aligned along the mid-depth of the beam. All simulations were performed using the 2D FE model developed in DIANA 10.5 software, as described in the preceding sections.
3.1. Openings in Flexure Regions
Table 4 presents the locations of the openings introduced in the flexure regions of the two-span RC continuous deep beams analyzed in this study. The beam configuration Rm1 includes a single rectangular opening at the mid-span of the left span, while Rm2 contains two openings, each placed at the mid-span of both spans. The control beam (CS) has no openings.
Table 4.
Parametric study matrix for openings in flexure regions.
The load versus mid-span deflection plots for both the left and right spans of these beams are illustrated in Figure 9a and Figure 9b, respectively. The load-carrying capacities for each span of the beams (including the control) are summarized in Table 5, while the corresponding support reactions are detailed in Table 6. In order to compare stiffness characteristics, Figure 10 provides stacked bar charts of the average initial and post-cracking stiffness, with the peak load values also included for reference.
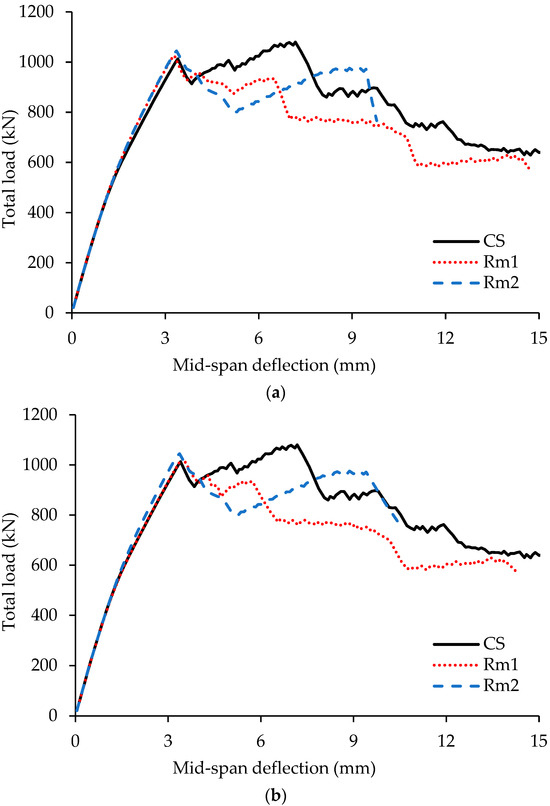
Figure 9.
Total load versus mid-span deflection plots for beams CS, Rm1, and Rm2 for: (a) left span; (b) right span.
Table 5.
Load-carrying capacity of beams with openings in flexure critical regions.
Table 6.
Support reactions at peak load for beams with openings in flexure regions.
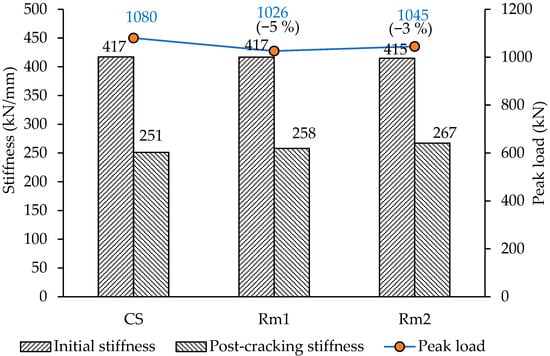
Figure 10.
Initial and post-cracking stiffness, along with peak load of beams with openings located in flexure regions.
Although the post-cracking stiffness was calculated between the cracking load and the peak load, for the control specimen (CS), the first peak load was used instead of the ultimate peak load. This adjustment was made to enable consistent comparison with other beams, as the CS specimen exhibited a secondary increase in load after an initial drop (Figure 9), likely due to internal redistribution of forces, resulting in a delayed peak at a much higher displacement.
The principal stresses in concrete at peak load are shown in Figure 11, and the longitudinal steel stresses (top and bottom rebars) for both spans are listed in Table 7. The observations made from these tables and figures are as follows:
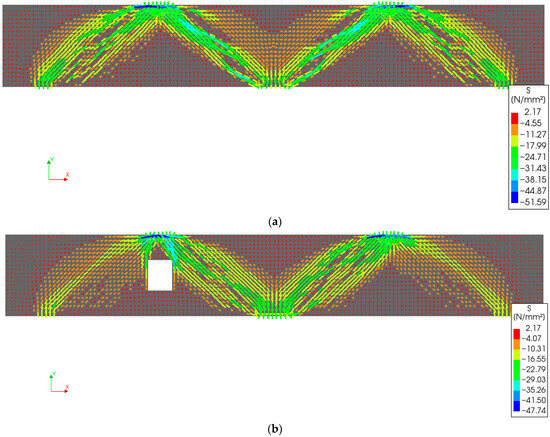
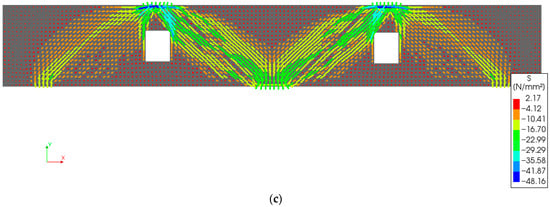
Figure 11.
Contours of principal stresses in concrete, S (MPa), at peak load for beams: (a) CS; (b) Rm1; (c) Rm2.
Table 7.
Stresses at peak load in longitudinal rebars at mid-span of beams with openings in flexure regions.
- The experimental failure of the control beam, CS (Figure 3a), shows good agreement with stress contours of FE analysis presented in Figure 11a and Figure 12. The experimental diagonal shear failure cracks developed in the beam correspond to the FE stress paths.
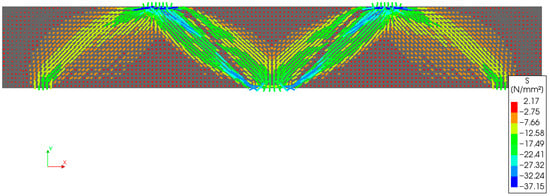 Figure 12. Contours of principal stresses in concrete, S (MPa), at the first peak load for the control beam CS.
 - The load-carrying capacity of the beam with an opening located in the middle of one of the spans (Rm1) is 1026 kN, which indicates a 5% reduction as compared to the control beam (1080 kN). In contrast, when two openings are considered at the midpoints of both the spans of the continuous beam (Rm2), the load-carrying capacity is reduced to 1045 kN, showing a lesser reduction (3%). The lower reduction in Rm2 may be attributed to the symmetrical placement of openings, resulting in a more balanced load path. Thus, symmetry contributes to a more uniform distribution of stress, thereby enhancing stiffness. When comparing individual spans with openings to the corresponding spans in the control beam, the reduction is 6% for a single opening and 3% for two openings. These results indicate that openings in flexure-critical regions have minimal impact on the overall load-carrying capacity.
- Both the initial and post-cracking stiffness values of Rm1 (417 kN/mm and 258 kN/mm) and Rm2 (415 kN/mm and 267 kN/mm) are comparable to those of the control beam (417 kN/mm and 251 kN/mm), with less than 6% difference. This suggests that even when openings are present in all spans, their effect on beam stiffness is negligible, provided they are located in the flexure-critical zone and are aligned with the mid-depth of the beam.
- The principal stress plots at peak load clearly show the development of exterior and interior struts in all beams. Beams with openings (Rm1 and Rm2) exhibited higher interior support reactions compared to the control beam, which is also reflected in the stress plots, as the interior struts in the control beam appear weaker at the ultimate peak load. However, when stress distribution is examined at the first peak load (see Figure 12), the interior struts in CS are comparable in strength to those in Rm1 and Rm2. At this first peak (1013 kN), the interior support reaction in CS was 60% of the total load, which is the same as the beams Rm1 and Rm2. The subsequent drop in load is likely due to cracking of the interior struts, followed by redistribution of forces, which increased the transfer to the outer supports, resulting in further load increase. If the beam were slender rather than deep, a higher interior support reaction (typically around 69%) would be expected, confirming the unique shear-dominant behavior of deep beams.
- In all beam configurations, including the control and those with openings, the longitudinal rebar stresses remained well below the yield limit. The top rebar stresses were quite low, with the maximum being 0.29 ( is the yield stress) for the control beam. Despite similar peak loads across the beams, the bottom rebar stresses in Rm1 and Rm2 are significantly lower than those in the control. In fact, rather than showing a reduction, the control beam exhibited higher rebar stresses, primarily because these stresses were recorded at the ultimate peak load, which occurred after considerable load redistribution and at relatively larger deflections. In contrast, the beams with openings reached their peak loads earlier in the loading process, with minimal redistribution, resulting in lower measured rebar stresses. Additionally, the bottom rebar stresses in the control beam were found to be higher, which can be attributed to the increased reaction at the exterior support after redistribution. This is because the horizontal component of the exterior strut induces tension in the bottom reinforcement, while the horizontal forces from the interior struts largely balance each other. As a result, the magnitude of the exterior strut directly influences the stress level in the bottom rebars.
3.2. Openings in Shear-Critical Regions
In this parametric study, the rectangular openings in the shear-critical region were positioned such that their centers coincided with the midpoint of the line connecting the support to the applied load. This location is considered the most critical for openings, as it intersects key strut paths, potentially disrupting the primary load transfer mechanism.
3.2.1. Single Opening
Table 8 presents the configurations of single rectangular openings located in the shear-critical regions of the beam. Beams R1 and R2 contain openings intersecting Strut 1 (exterior) and Strut 2 (interior), respectively. In this nomenclature, the numeral in the beam ID corresponds to the strut intersected by the opening.
Table 8.
Parametric study matrix for single opening in shear-critical regions.
The load versus mid-span deflection curves for the left and right spans of these beams are shown in Figure 13a and Figure 13b, respectively. The load-carrying capacities of individual spans, including the control beam, are summarized in Table 9, while support reactions are listed in Table 10. To assess the stiffness behavior, Figure 14 provides stacked bar charts comparing initial and post-cracking stiffness, along with the peak load values. Principal concrete stresses at peak load are illustrated in Figure 15, and the longitudinal rebar stresses (top and bottom) for both spans are reported in Table 11. The following observations are made based on these results:
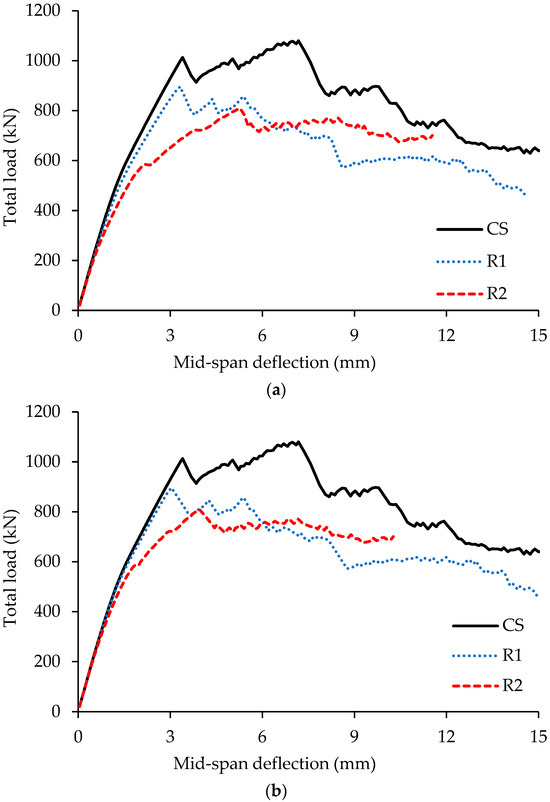
Figure 13.
Total load versus mid-span deflection plots for beams, CS, R1, and R2: (a) left span; (b) right span.
Table 9.
Load carrying capacity of beams with single opening in shear-critical region.
Table 10.
Support reactions at peak load for beams with single opening in shear-critical region.
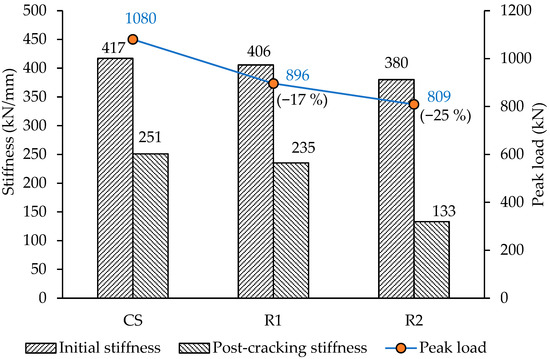
Figure 14.
Initial and post-cracking stiffness along with peak load for beams with single opening located in shear-critical regions.
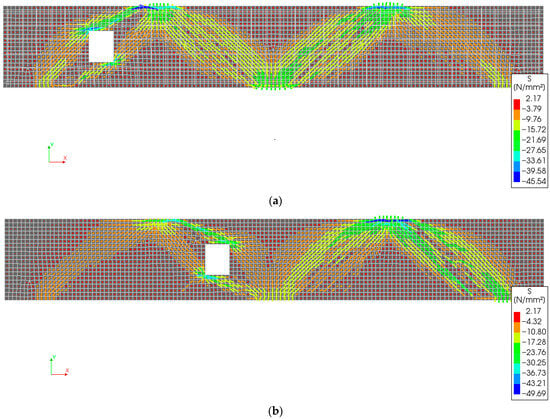
Figure 15.
Contours of principal stresses in concrete, S (MPa), at peak load for beams: (a) R1; (b) R2.
Table 11.
Stresses at peak load in longitudinal rebars at mid spans with single opening located in shear-critical regions.
- The difference between the left and right exterior support reactions arises from the unequal stiffness of the two spans, since both spans were subjected to the same vertical displacement.
- The opening in Beam R1, intersecting the exterior strut, resulted in a 17% reduction in overall load-carrying capacity compared to the control beam. This was primarily due to a 23% reduction in the capacity of the left span, which decreased from 540 kN to 419 kN. While the right span also experienced a minor reduction, it remained largely unaffected structurally, as failure was initiated by the left span.
- In Beam R2, where the opening intersected the interior strut, the overall load-carrying capacity was reduced by 25%, with the left span showing a significant 50% reduction (from 540 kN to 272 kN). This highlights the greater structural importance of interior struts in deep beams. The right span showed minimal reduction in capacity, as the failure again originated in the left span.
- A comparison between Beams R1 and R2 indicates that openings intersecting interior struts are more detrimental than those intersecting exterior struts. Specifically, the 50% reduction in span capacity for R2 significantly exceeds the 23% reduction for R1. Therefore, if an opening must be introduced, placing it across an exterior strut is preferable. However, in continuous beams with more than two spans, the majority of struts will be interior, limiting this option.
- The effect of creating an opening in the exterior strut (Beam R1) shows minimal impact on both the initial and post-cracking stiffness, with differences of less than 6%. In contrast, introducing openings in both spans significantly reduces the initial stiffness by 9.0% (from 417 kN/mm to 380 kN/mm) and the post-cracking stiffness by 47% for R2 (from 258 kN/mm to 133 kN/mm). This highlights the more pronounced structural effects of openings in interior struts.
- Although the peak loads for R1 and R2 were 17% and 25% lower, respectively, than the control beam, the bottom longitudinal rebar stresses were significantly lower in R1 (0.39 ) and also in beam R2 (0.67 ). This is attributed partly to the lower peak loads and partly to the relatively higher stress levels observed in the control beam, which experienced more pronounced load redistribution, as explained above. Additionally, the bottom rebar stress in the right span of R2 was higher than in R1 due to an increased exterior support reaction, which in turn led to higher tensile forces in the bottom longitudinal reinforcement.
- The top rebar stresses are low, with the maximum being 0.33 for beam R2.
3.2.2. Two Openings
In the case of two openings, the opening layout was considered such that the first opening crosses strut #1, and the second opening locations were varied. Thus, the following beams with two openings were considered: R12, R13, and R14, as shown in Table 12. Additionally, a beam R23 having openings crossing interior struts #2 and #3 was also considered.
Table 12.
Parametric study matrix for two openings in shear-critical regions.
The load–mid-span deflection responses for the left and right spans of these beams are presented in Figure 16a and Figure 16b, respectively. The load-carrying capacities for individual spans, including the control specimen, are summarized in Table 13, while the corresponding support reactions are provided in Table 14.
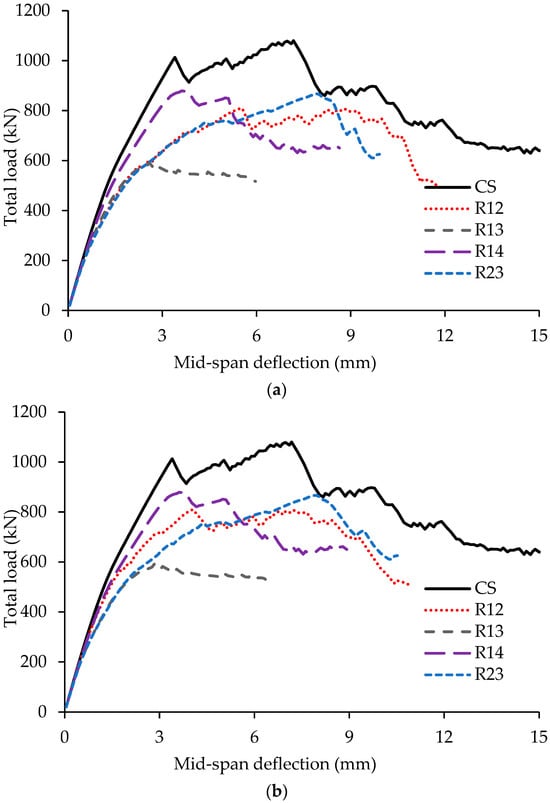
Figure 16.
Total load versus mid-span deflection plots for beams, CS, R12, R13, R14, and R23: (a) left span; (b) right span.
Table 13.
Load carrying capacity of beams with two openings in shear-critical regions.
Table 14.
Support reactions at peak load for beams with two openings in shear-critical regions.
To assess the stiffness behavior, Figure 17 shows stacked bar charts comparing initial and post-cracking stiffness, along with peak load values. Principal stress distributions in concrete at peak load are illustrated in Figure 18, and the top and bottom longitudinal rebar stresses for each span are listed in Table 15. Key observations from these results are as follows:
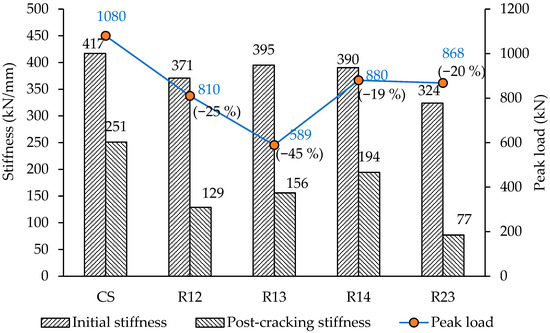
Figure 17.
Initial and post-cracking stiffness, along with peak load, for beams having two openings located in shear-critical regions.
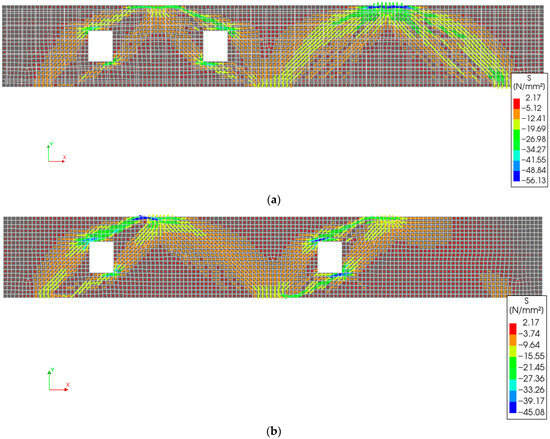
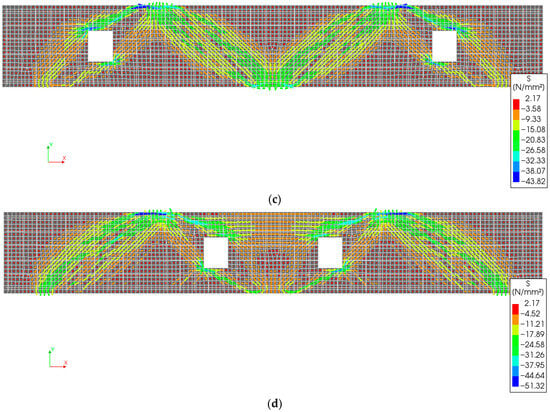
Figure 18.
Contours of principal stresses in concrete, S (MPa), at peak load for beams: (a) R12; (b) R13; (c) R14; (d) R23.
Table 15.
Stresses in longitudinal rebars at mid spans of beams with two openings in shear critical regions.
- A comparison of the FE failure mode of R13 (Figure 18) with the experimental failure of the beam (Figure 3b–d) shows good agreement. The failure shear cracks developed in the specimens correspond to the FE stress paths observed between the loading and support plates and the corners of the openings, as shown in Figure 18.
- The introduction of two openings in the shear-critical region resulted in a reduction in total load-carrying capacity ranging from 19% (Beam R14) to 45% (Beam R13), depending on the opening configuration.
- The longitudinal top rebar stresses remained relatively low across all configurations, with the maximum reaching 0.32 in beam R12. Bottom rebar stresses were reduced in all beams with openings, except R23, where the stress reached 0.80 . Thus, no longitudinal reinforcement was yielded in any configuration.
- In beam R12, where both openings were located within a single span, a 25% overall reduction in load capacity was observed. The span containing both openings showed a drastic 61% drop in load-carrying capacity (from 540 kN to 253 kN). The bottom rebar stresses are higher in the right span (0.67 ) compared to the left span (0.33 ) due to a higher exterior support reaction in the right span (283 kN, 35% of the total load).
- Beam R13, which had one opening cutting through an exterior strut in the left span and another cutting through an interior strut in the right span, showed the most severe reduction of 45% in total load capacity. The left span dropped by 38% (from 540 kN to 333 kN), and the right span by 53% (from 540 kN to 256 kN). Bottom rebar stresses were the lowest among all beams, 0.33 in the left span and 0.26 in the right span due to low support reactions stemming from the significantly reduced load capacity.
- Beam R14, with symmetric openings intersecting the exterior struts of both spans, exhibited a 19% reduction in load capacity (880 kN). Due to symmetry, the longitudinal stresses in both spans were identical (188 MPa or 0.34 ). These low values correspond to reduced exterior support reactions (149 kN, 17% of the total load), as cutting exterior struts weakened the associated strut forces (Figure 18).
- Beam R23, with symmetric openings cutting through the interior struts of both spans, showed a 20% reduction in total capacity. Although both openings were located in critical regions, the symmetrical layout helped maintain balanced load transfer. This configuration produced the highest rebar stresses (up to 0.80 ) due to higher exterior support reactions (296 kN, 34% of the total load), which intensified tension in the bottom tie reinforcements.
- Cutting two openings reduced the initial stiffness by 5.0% to 22.0%, with the minimum reduction observed in R13 (and R14 with 6.0% reduction) and the maximum in R23. Similarly, the post-cracking stiffness decreased by 23.0% to 69.0%, again with the minimum in R14 and the maximum in R23. These results further emphasize the detrimental impact of openings in interior struts, as the most significant reductions in both initial and post-cracking stiffness were observed in beam R23, where openings were introduced in both interior struts.
- Among the various configurations, the symmetrical layouts, R14 and R23, proved to be the least detrimental, showing only 19% and 20% reductions in load-carrying capacity, respectively. These configurations are preferable when two openings are required in the shear-critical zones of continuous RC deep beams.
3.2.3. More than Two Openings
Table 16 presents the layout of beams with three and four openings, denoted as R123 and R1234, respectively. While deep beams with multiple openings are occasionally encountered in practice, beams with three or four openings were included here primarily for comparison, representing limiting cases.
Table 16.
Parametric study matrix for three and four openings in shear-critical regions.
The load versus mid-span deflection responses for the left and right spans of these beams are shown in Figure 19a and Figure 19b, respectively. The load-carrying capacities of the individual spans, including the control beam, are summarized in Table 17, while the corresponding support reactions are listed in Table 18.
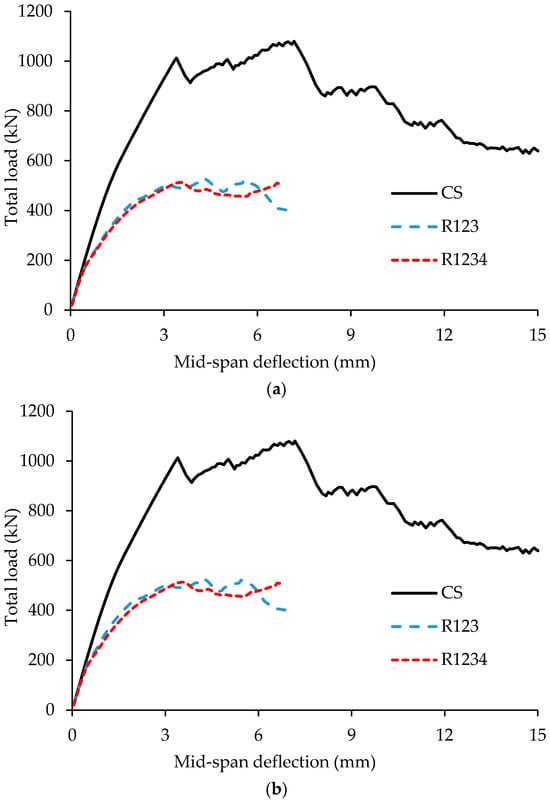
Figure 19.
Total load versus mid-span deflection plots for beams, CS, R123, and R1234: (a) left span; (b) right span.
Table 17.
Load-carrying capacity of beams with three or four openings in shear-critical region.
Table 18.
Support reactions at peak load for beams with three or four openings in shear-critical regions.
To evaluate stiffness behavior, Figure 20 provides stacked bar charts comparing initial and post-cracking stiffness, as well as peak load values. Figure 21 illustrates the principal concrete stresses at peak load, and Table 19 reports the longitudinal (top and bottom) rebar stresses for both spans. The following observations can be made based on these results:
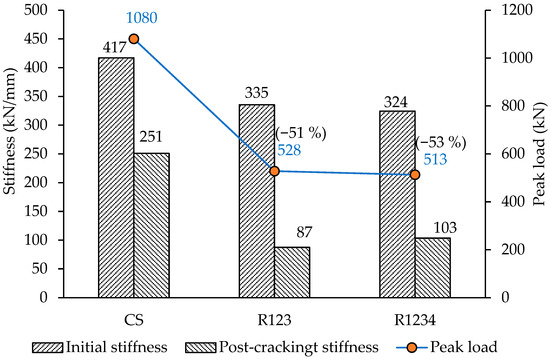
Figure 20.
Initial and post-cracking stiffness along with peak load for beams R123 and R1234.
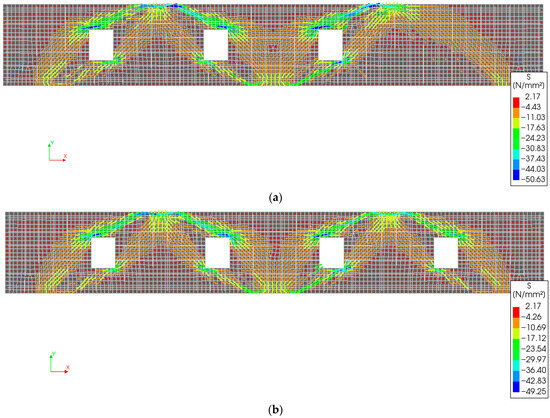
Figure 21.
Contours of principal stresses in concrete, S (MPa), at peak load for beams: (a) R123 and (b) R1234.
Table 19.
Stresses in longitudinal rebars at mid spans with three and four openings.
- Introducing three openings (Beam R123) reduced the load-carrying capacity from 1080 kN in the control beam to 528 kN, a reduction of 51%. Adding a fourth opening (Beam R1234) further reduced the capacity to 513 kN, amounting to a 53% decrease.
- The stresses in the top longitudinal reinforcement remained low, not exceeding 0.13 . Likewise, the bottom reinforcement experienced limited stress, with a maximum of 0.34 , due to the reduced load-carrying capacity and the correspondingly low exterior support reactions, which predominantly influence the stress in the bottom rebars.
- Cutting three openings in Beam R123 and four openings in R1234 reduced the initial stiffness by 20.0% and 22.0%, respectively. As expected, the post-cracking stiffness also decreased substantially, by 65.0% and 59.0% for R123 and R1234, respectively.
4. Comparisons Among Beams of Different Groups
The comparisons discussed previously were limited to beams within individual groups. However, the following observations are based on comparisons across different groups of beams:
- Cutting openings in the flexure-critical region located at mid-depth proved to be the least detrimental. Even when all spans had such openings, there was almost no impact on load-carrying capacity, support reactions, or stresses in the concrete and reinforcement.
- When having openings in shear-critical regions, cutting through exterior struts is the most favorable option. For a single opening, Beam R1 (with an exterior strut cut) performs best, and for two openings, Beam R14 (with both exterior struts cut) offers the most effective configuration. This conclusion is based on comparative results for load-carrying capacity, support reactions, and stresses in both concrete and reinforcement.
- Increasing the number of openings in shear critical regions from one to four led to a progressive reduction in the beam’s load capacity. A single opening in Beam R1 resulted in a 17% reduction, which increased to 25% for two openings (R12) (Figure 22). This reduction rose sharply to 51% with three openings (R123). However, adding a fourth opening (R1234), which cut through all struts, caused only a slight additional reduction, reaching 53%.
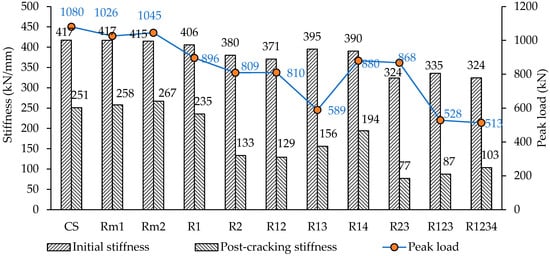 Figure 22. Initial and post-cracking stiffness, along with peak load, for all beams.
 - Beam R1, with a single opening, experienced a slightly smaller reduction in load capacity (17%) compared to Beam R14, which had two openings (19%) (Figure 22). This small difference, even after adding an opening, is attributed to the symmetrical layout of Beam R14, which facilitated a more balanced load transfer across the spans.
- The highest stresses in the bottom longitudinal reinforcement were recorded in Beam R23. This was due to all openings being located in shear-critical regions, intersecting both interior struts of each span. These openings increased the exterior support reactions transferred through the exterior struts, resulting in higher bottom rebar stresses. However, these stresses still remained below the yield strength. Notably, Beam R23 also exhibited the greatest reduction in both initial and post-cracking stiffness, 22% and 69%, respectively (Figure 22). Although its load-carrying capacity is almost the same as the best option (Beam R14) due to the symmetrical layout of openings, it is not recommended to cut interior struts due to the significant loss of stiffness. Although Beam R1234 showed a similar loss in initial stiffness, it was excluded from this comparison, as cutting four openings that interrupt all struts is not considered a practical design scenario and was evaluated purely for comparative purposes.
In all specimens, the progression of cracking and final failure closely followed the principal stress trajectories connecting the loading and support regions. For beams without openings, diagonal compression struts remained well-developed, resulting in a typical shear–compression failure. However, when openings were introduced, these stress paths were disrupted, forcing stresses to divert around the opening edges. This led to earlier initiation of diagonal cracks, localized crushing at the strut-opening interface, and, in asymmetric cases, unbalanced stress flow that produced more severe damage. The observed reduction in load capacity and stiffness is therefore directly linked to the interruption and weakening of the principal stress strut. This interpretation is consistent with the nonlinear FE analysis, which shows stress concentration and redistribution in the disturbed regions, confirming that opening placement governs both the mechanism and severity of failure.
In this study, the openings were introduced post-construction without any additional local reinforcement, leading to pronounced stress concentrations around the opening boundaries, as reflected in the principal stress fields. In practical design, however, engineers typically provide supplementary reinforcement or strengthening to redistribute stresses and maintain continuity of the load path. Such detailing would be expected to reduce stress concentration, delay cracking, and enhance both stiffness and load capacity compared with the unstrengthened configurations analyzed here.
5. Conclusions
The conclusions derived from the results of numerical analysis of two-span (span = 1120 mm) continuous HSC deep beams of 150 × 400 mm cross-section, having post-construction rectangular openings (118 mm × 150 mm) positioned at mid-depth of beam with different layouts, are as follows:
- Openings positioned at mid-depth within the flexure-critical regions of deep beams were found to be the least detrimental. Even when such openings were present in both spans, the beams exhibited only marginal changes in structural response, confirming that this configuration is a structurally efficient option for accommodating service ducts or utilities. However, this conclusion is specific to the size of openings considered in the study, and further verification is required for bigger size of openings.
- When openings are required in shear-critical regions, cutting through the exterior struts is the most favorable approach. Beam R1, with a single opening in an exterior strut, and Beam R14, with symmetrical openings in both exterior struts, demonstrated the best performance in terms of load-carrying capacity (17% and 19% reduction), support reactions, and reinforcement and concrete stress levels.
- A progressive reduction in load capacity was observed with an increasing number of openings in shear-critical regions. A single opening caused a 17% reduction, which increased to 25% with two openings and further to 51% with three. Interestingly, the addition of a fourth opening, which intersected all struts, caused only a marginal further reduction to 53%, indicating a saturation point in structural degradation.
- Beam R1 (single opening) exhibited a slightly smaller reduction in load capacity (17%) compared to Beam R14 (two symmetric openings), which showed a 19% reduction. The relatively smaller impact of the additional opening in Beam R14 is attributed to the symmetric layout, which promoted more balanced force flow. The better performance for symmetric openings is also due to the symmetric loading conditions. However, the behavior under non-symmetric loading may differ, and further investigation is needed to quantify the extent to which the advantages of symmetric openings persist when nonsymmetric loads are applied.
- Beam R23, which had openings intersecting both interior struts in each span, experienced the most severe performance deterioration. It exhibited the highest bottom longitudinal reinforcement stresses, still below the yield strength, and the maximum reductions in both initial and post-cracking stiffness, at 22% and 69%, respectively.
- This study is based on a specific size of rectangular openings in the shear critical zones of a two-span continuous HSC deep beam. However, the conclusions derived need to be verified for other opening sizes and shapes in deep beams of different sizes. Further studies are needed to confirm the applicability across different geometries.
- The findings of this study offer valuable design guidance for the safe incorporation of service openings in continuous HSC deep beams, minimizing unnecessary material consumption and thereby contributing to more sustainable and resource-efficient concrete construction. The insights into favorable opening locations and underlying load-transfer mechanisms enhance the practical relevance of the results.
Author Contributions
Conceptualization, methodology, investigation, visualization, validation, formal analysis, writing—original draft preparation, M.A.-M. Conceptualization, methodology, validation, visualization, writing—original draft, H.A. Investigation, methodology, visualization, writing—review and editing, H.E. Methodology, investigation, visualization, writing—review and editing, A.A. Investigation, writing—review and editing, M.A. Investigation, writing—review and editing, T.A. Supervision, funding acquisition, Investigation, writing—review and editing, Y.A.-S. All authors have read and agreed to the published version of the manuscript.
Funding
This research was funded through the Ongoing Research Funding program—Research Chairs (ORF-RC-2025–0400), King Saud University, Riyadh, Saudi Arabia.
Data Availability Statement
All data and models generated or used during the study appear in the submitted article.
Acknowledgments
The authors gratefully acknowledge the funding received through the Ongoing Research Funding program—Research Chairs (ORF-RC-2025-0400), King Saud University, Riyadh, Saudi Arabia.
Conflicts of Interest
The authors declare that there is no conflict of interest regarding the publication of this article.
References
- ACI Committee. Building Code Requirements for Structural Concrete (ACI 318-25) and Commentary (ACI 318R-25); American Concrete Institute: Farmington Hills, MI, USA, 2025. [Google Scholar]
- Alhammud, B.; Günal, D.A.Y.; Alkhatib, R. An Overview of Openings in Concrete Deep Beams-A Comprehensive Analysis. Int. J. Innov. Res. Comput. Sci. Technol. 2024, 12, 168–173. [Google Scholar] [CrossRef]
- Jasim, W.A.; Allawi, A.A.; Oukaili, N.K. Effect of size and location of square web openings on the entire behavior of reinforced concrete deep beams. Civ. Eng. J. 2019, 5, 209–226. [Google Scholar] [CrossRef]
- Sheikh-Sobeh, A.; Kachouh, N.; El-Maaddawy, T. Numerical analysis of concrete deep beams reinforced with glass fiber-reinforced polymer bars. Buildings 2023, 13, 2767. [Google Scholar] [CrossRef]
- Chai, K.F.; Woon, K.S.; Wong, J.K.; Lim, J.H.; Lee, F.W.; Lee, Y.L. Experimental and numerical study of the strength performance of deep beams with perforated thin mild steel plates as shear reinforcement. Appl. Sci. 2023, 13, 8217. [Google Scholar] [CrossRef]
- Chin, S.C.; Shafiq, N.; Kusbiantoro, A.; Nuruddin, M.F. Reinforced concrete deep beams with openings strengthened using FRP—A review. Adv. Mater. Res. 2014, 1025, 938–943. [Google Scholar] [CrossRef]
- Yang, K.H.; Ashour, A.F. Effectiveness of Web Reinforcement around Openings in Continuous Concrete Deep Beams. ACI Struct. J. 2008, 105, 414–424. [Google Scholar] [CrossRef] [PubMed]
- Mohamed, A.R.; Shoukry, M.S.; Saeed, J.M. Prediction of the behavior of reinforced concrete deep beams with web openings using the finite element method. Alex. Eng. J. 2014, 53, 329–339. [Google Scholar] [CrossRef]
- Rodríguez, G.; Bonilla, J.; Hernández, J. Numerical modeling of reinforced concrete continuous deep beams. Rev. Ing. Construcción 2016, 31, 163–174. [Google Scholar] [CrossRef]
- Yousef, A.M.; Tahwia, A.M.; Al-Enezi, M.S. Experimental and numerical study of UHPFRC continuous deep beams with openings. Buildings 2023, 13, 1723. [Google Scholar] [CrossRef]
- Ashour, A.F.; Rishi, G. Tests of reinforced concrete continuous deep beams with web openings. Struct. J. 2000, 97, 418–426. [Google Scholar]
- Khalaf, M.R.; Al-Ahmed, A.H.A.; Allawi, A.A.; El-Zohairy, A. Strengthening of continuous reinforced concrete deep beams with large openings using CFRP strips. Materials 2021, 14, 3119. [Google Scholar] [CrossRef] [PubMed]
- Al-Mahbashi, M.; Elsanadedy, H.; Abbas, H.; Abadel, A.; Al-Salloum, Y. Experimental and numerical study of high strength reinforced concrete continuous deep beams with circular and rectangular openings. J. Build. Eng. 2023, 79, 107868. [Google Scholar] [CrossRef]
- Abbas, H.; Al-Mahbashi, M.; Elsanadedy, H.; Abadel, A.; Almusallam, T.; Al-Salloum, Y. Strengthening of high-strength RC continuous deep beams having rectangular web openings using bolted steel plates. Eng. Struct. 2025, 337, 120519. [Google Scholar] [CrossRef]
- Al-Mahbashi, M.; Elsanadedy, H.; Abadel, A.; Abbas, H.; Almusallam, T.; Al-Salloum, Y. Performance of HSC continuous deep beams with asymmetric circular openings: Hybrid FRP versus steel plate strengthening. Polymers 2025, 17, 3049. [Google Scholar] [CrossRef] [PubMed]
- El-Metwally, S.; Chen, W.F. Structural Concrete: Strut-and-Tie Models for Unified Design; CRC Press: Boca Raton, FL, USA, 2017. [Google Scholar]
- Yang, X.; Wu, T.; Liu, X.; Liu, Y. Influence of web reinforcement on shear behavior and size effect of lightweight aggregate concrete deep beams: Experimental and theoretical studies. Eng. Struct. 2025, 322, 119119. [Google Scholar] [CrossRef]
- Schlaich, J.; Schäfer, K.; Jennewein, M. Toward a consistent design of structural concrete. PCI J. 1987, 32, 74–150. [Google Scholar] [CrossRef]
- DIANA Finite Element Analysis User’s Manual Release, 10.5; DIANA FEA BV: Delft, The Netherlands, 2021.
- Livermore Software Technology Corporation (LSTC). LS-DYNA Keyword User’s Manual, Version R11; LSTC: Livermore, CA, USA, 2018; Volume 1–3.
- Feenstra, P.H. Computational Aspects of Biaxial Stress in Plain and Reinforced Concrete. Ph.D. Thesis, Delft University of Technology, Delft, The Netherlands, 1993. [Google Scholar]
- Chhetri, S.; Chicchi, R.A. Analytical investigation of tension loaded deformed rebar anchors in concrete. CivilEng 2021, 2, 442–458. [Google Scholar] [CrossRef]
- Fib-Federation Internationale Du Beton. Fib Model Code for Concrete Structures 2010; John Wiley & Sons: Hoboken, NJ, USA, 2013. [Google Scholar]
- Van Aken, S. Cracking at the Unheated Side of a Tunnel During the Heating and Cooling Phase of a Fire; Delft Techical University: Delft, The Netherlands, 2012. [Google Scholar]
- Japan Society of Civil Engineers Concrete Committee. Standard Specification for Concrete Structures “Design”; JSCE Guidelines for Concrete; Japan Society of Civil Engineers: Tokyo, Japan, 2007; Volume 15, pp. 139–142. [Google Scholar]
- Mansour, M.S. Strengthening of Concrete Deep Beams with Extreme Discontinuities Using Near-Surface-Mounted Composites; United Arab Emirates University: Al Ain, United Arab Emirates, 2019. [Google Scholar]
- MacGregor, J.G.; Wight, J.K.; Teng, S.; Irawan, P. Reinforced Concrete: Mechanics and Design; Pearson Prentice Hall: Upper Saddle River, NJ, USA, 2012. [Google Scholar]


Disclaimer/Publisher’s Note: The statements, opinions and data contained in all publications are solely those of the individual author(s) and contributor(s) and not of MDPI and/or the editor(s). MDPI and/or the editor(s) disclaim responsibility for any injury to people or property resulting from any ideas, methods, instructions or products referred to in the content. |
© 2025 by the authors. Licensee MDPI, Basel, Switzerland. This article is an open access article distributed under the terms and conditions of the Creative Commons Attribution (CC BY) license.