Abstract
The successful deployment of 3D printing in outdoor applications is contingent upon the selection of materials capable of withstanding the degrading effects of weather. This study evaluates the colorimetric performance of various 3D-printed polymers exposed to natural weathering conditions in Brasov, Romania, from November 2024 to March 2025. Color changes were monitored through spectrophotometry using a PCE-XXM 20 color meter, and data were recorded in the LAB color space. The results indicate substantial differences in color stability among the tested materials, with some exhibiting unacceptable levels of fading and discoloration. These findings have significant implications for the design and implementation of outdoor 3D-printed products in climates analogous to that of Brasov, underscoring the importance of selecting materials with demonstrated resistance to weathering and color change.
1. Introduction
1.1. Importance of Colorimetry in 3D Printing Applications
Colorimetry plays a crucial role in 3D printing applications, particularly in fields where esthetics, functionality, and user experience are paramount. Understanding color properties and how they interact with different materials allows for more precise control over the final output, ensuring that printed objects meet both technical and visual standards.
The significance of color as a paramount sensory and acceptability attribute has long been recognized across diverse industries, underpinning the critical role of colorimetry in quality control and product design [1].
For instance, scalable 3D printing methods are being developed for the manufacture of single-material fluidic devices with integrated filters for point-of-collection colorimetric analysis [2] demonstrating the innovative ways 3D printing is leveraged to create precise tools for color measurement and analysis.
In summary, colorimetry is essential in 3D printing applications as it ensures quality, consistency, and innovation, ultimately leading to better-performing and esthetically pleasing products. Understanding these principles is vital for designers and engineers aiming to leverage 3D printing technology effectively.
Smart façades represent an innovative approach to building design and construction, integrating advanced materials and technologies to enhance energy efficiency, esthetics, and occupant comfort. Such innovations often involve the integration of Phase Change Materials (PCM) into ventilated façade systems, which are extensively analyzed for their significant contributions to energy efficiency and thermal management, alongside critical fire safety considerations [3].
Table 1 provides a summary of the key points related to colorimetry in 3D printing, highlighting how it ensures consistent and accurate color reproduction, aids in selecting appropriate materials, enhances esthetic appeal, and evaluates performance stability under different environmental conditions.

Table 1.
Key points of colorimetry in 3D printing applications.
1.2. Context and Relevance of Smart Façades
Smart façades represent an innovative approach to building design and construction, integrating advanced materials and technologies to enhance energy efficiency, esthetics, and occupant comfort. These dynamic architectural elements redefine urban architecture by combining energy efficiency with responsive design, playing a crucial role in urban sustainability [4].
This rapidly evolving field is characterized by dynamic adaptation to environmental changes, with significant research focusing on future trends, technological classifications, and their impact on user well-being, energy consumption, and environmental footprints [5].
The discussion of smart façades highlights their innovative role in modern building design, emphasizing how they incorporate advanced materials and technology to improve energy efficiency, sustainability, esthetics, and occupant comfort. To further explore their key aspects, the following Table 2 summarizes the main points.
Table 2.
Key points of smart façades Partea superioară a formularului.
In their article, “Performance analysis of solar collectors with nano-enhanced phase change materials during transitional periods between cold and warm seasons in the continental temperate climates” [6], Răzvan Calotă, Octavian Pop, Cristiana Croitoru, Florin Bode, Charles Berville, and Emanuil Ovadiuc specifically investigate the integration of transpired solar collectors with nano-enhanced phase change materials (nePCMs) to enhance thermal energy storage and efficiency in buildings. Their research provides valuable insights into how advanced materials can contribute to an improved thermal performance in varying climatic conditions, a key consideration for the development of smart façades.
In their article, “Bridging the gap: Discrepancies in energy efficiency and smart readiness of buildings” [7], Răzvan Calotă, Florin Bode, Manolis Souliotis, Cristiana Croitoru, and Paris A. Fokaides address the critical discrepancy between traditional energy performance assessments and the Smart Readiness Indicator (SRI) in evaluating building efficiency and adaptability. Their study uses a comparative analysis of two pilot buildings in Bucharest, Romania, and Nicosia, Cyprus, to highlight significant differences between energy performance ratings and SRI scores, thereby revealing limitations in current assessment practices and proposing enhanced policy measures for a more integrated approach to sustainable building evaluations.
1.3. Objectives of This Study
The main purpose of this study is to evaluate the colorimetric performance of 3D-printed materials exposed to external weather conditions, with a particular focus on applications in smart façades. The specific objectives, which guide this research and are elaborated in detail in Table 3, are formulated to provide a comprehensive understanding of the durability of materials in dynamic environments.
Table 3.
Objectives of this study on colorimetry in 3D-printed samples within smart façades.
By addressing these objectives, this study aims to fill gaps in existing knowledge regarding the colorimetry of 3D-printed materials and their application in outdoor environments, ultimately aiding in the development of more resilient and visually appealing structures.
2. Literature Review
2.1. Three-Dimensional Printing Technologies Used in Outdoor Applications
In the article “A review of 3D printing techniques for environmental applications” [8], Nadagouda, Ginn, and Rastogi highlight the growing utilization of 3D printing technologies in outdoor environmental applications. The technology’s ability to produce customized, complex geometries with relatively low material waste makes it particularly attractive. This has led to the development of various solutions designed for outdoor use, including sophisticated air quality monitors capable of detecting pollutants, efficient water treatment devices utilizing advanced membrane technology, and specialized components for renewable energy systems such as wind turbines and solar cells. While the authors acknowledge that challenges remain, particularly in material selection to withstand outdoor conditions and scaling up production for widespread implementation, they emphasize that ongoing advancements in printable materials and refined production processes are continuously expanding the potential for 3D printing to contribute significantly to sustainable manufacturing and innovative designs tailored for diverse environmental applications.
The successful deployment of 3D printing in outdoor applications is contingent upon the selection of materials capable of withstanding the degrading effects of weather. Beyond the material choice, the careful evaluation and ranking of 3D printers themselves, based on metrics such as the dimensional accuracy, surface finish, build time, and material consumption, are equally crucial for ensuring the quality and cost-effectiveness of 3D-printed components [9].
Within the landscape of “A Brief Introduction to 3D Printing Technology” [10], Winsun emerges as a pioneer in applying these technologies to outdoor applications, particularly in construction and environmental management. Their innovative, patented building material printing ink facilitates the creation of robust and eco-friendly structures, utilizing locally sourced or recycled materials such as construction debris and mine tailings. This specialized ink is instrumental in producing elements like “Yingheng Stone,” ideal for outdoor walls and flooring, and is being tested for desertification control through the printing of sand stabilization and vertical green walls. These initiatives are geared towards minimizing the environmental impact, reducing construction waste, and fostering sustainable building practices in diverse outdoor settings.
In their article, “Mathematical modeling and energy consumption evaluation of R-600a refrigeration systems for vending machines using efficient heat exchangers” [11], Alina Giripa, Răzvan Calotă, Ioan Mihail Savaniu, Anica Ilie, Emanuil Ovadiuc, and Oana Tonciu introduce the SVIEE-R vending machine as a sustainable solution for reducing CO2 emissions in the retail sale of cold packaged products. They develop and validate an adaptive mathematical model for the R-600a refrigeration system, highlighting its low Global Warming Potential (GWP = 3) and zero Ozone Depletion Potential (ODP) and showcasing the system’s ability to operate off-grid with high efficiency (an average Coefficient of Performance between 1.321 and 1.476). The study emphasizes the critical role of evaporator geometry and the condensation temperature in system efficiency and provides a framework for adapting energy-efficient refrigeration technologies to diverse operational environments, aligning with sustainable goals.
2.2. Effects of Weather Conditions on Materials
In the article “Influence of Weather-Affected Material Characteristics on Appearance of Freeze/Thaw Cycles in Building Envelopes” [12] by Jiří Maděra, Václav Kočí, Magdaléna Doleželová, Monika Čáchová, Miloš Jerman, and Robert Černý, the research investigates the impact of weather-affected material characteristics on the appearance of freeze/thaw cycles in autoclaved aerated concrete (AAC) building envelopes. Samples of AAC were exposed to natural weathering for three years, and their material characteristics were assessed at the beginning of the experiment and after two and three years. Computational simulations of coupled heat and moisture transport were conducted using reference and weather-affected data. The results indicate that the hygric properties of AAC deteriorated with weathering, leading to reduced moisture diffusivity and increased moisture retention. Consequently, the number of possible freeze/thaw cycles and the time of wetness increased, highlighting the negative influence of weathering on the material’s hygrothermal performance. The study emphasizes the importance of considering weather-affected material parameters in long-term simulations for the building performance assessment.
The book Plastics and the Environment [13] by Anthony L. Andrady analyzes the impact of plastics on the environment and how environmental factors influence plastics. It provides technical information and cutting-edge research on sustainability, ecological impacts, and the cost–benefit ratio of technologies related to plastics. The book is divided into four sections: an introduction to the relationship between plastics and the environment, applications of plastics in fields such as packaging, paints, and agriculture, the behavior of plastics in various environments, and discussions on the recycling and thermal treatment of plastic waste. Topics covered include biodegradability, thermal treatment, incineration, and the effectiveness of technologies aimed at reducing environmental impacts. It serves as an essential resource for engineers, chemists, and ecologists interested in the industry and environmental issues.
2.3. Methods for Evaluating Color Stability
The scoping review, titled “Color and optical properties of 3D printing restorative polymer-based materials” [14] by Cristina Espinar DDS, Alvaro Della Bona DDS, MMedSci, PhD, María M. Pérez PhD, and Rosa Pulgar MD, DDS, PhD, examines the current state of research on the color and optical characteristics of polymer-based restorative materials produced using 3D printing techniques. The authors conducted a literature search in MED-LINE/PubMed, Scopus, and Web of Science, analyzing studies that address the optical properties and color reporting in this specific area.
The review concludes that the color and optical properties of 3D-printed polymers intended for restorative dentistry are not being adequately evaluated or characterized in current research. While nine studies met the inclusion criteria, they primarily focused on color stability, translucency, and comparisons to conventional polymers. Notably, the study highlights that important optical properties like scattering, absorption, and transmittance are not being sufficiently investigated.
The authors emphasize the need for future research to consider the influence of experimental printing conditions on these physical properties to enhance the esthetic quality of 3D-printed dental restorations. Given the limited literature in this area, further study is crucial to understand the potential of these materials to mimic the natural tooth appearance and achieve esthetically pleasing outcomes for clinicians and patients. Ultimately, the review underscores the importance of thorough characterization for 3D printing materials to realize their potential in restorative dentistry.
Complementing these efforts, Yuan et al. [15] conducted an experimental investigation into the color reproduction quality of color 3D prints, specifically examining the effects of colored layer features and sequences on the final color reproduction. Their work contributes to a deeper understanding of how inherent printing parameters and layer characteristics influence the esthetic outcome and stability of 3D-printed objects.
Further contributing to this area, Stanic et al. [16] examined the colorimetric properties and stability of inkjet 3D prints exposed to accelerated light in xenon arc devices. Their findings demonstrated that changes in color appearance in 3D prints are largely due to variations in the chroma and brightness, with stability depending on the specific color, ink coating, and finishing methods applied. This underscores the importance of rigorous testing to ensure product integrity in various application areas.
The in vitro study “Evaluating the color stability of temporary crowns fabricated by 3-dimensional printing and manual methods” [17], authored by Ghasemi S, Mahboub F, Babaloo A, Zohdi M, Etemadpour A, and Yasamineh N, investigated and compared the color stability of temporary crowns produced using three different fabrication techniques: 3D printing, automix bis-acryl resin, and powder-and-liquid polymethyl methacrylate (PMMA). An impression of a prepared central incisor was used to create 90 dies, which were then randomly assigned to one of the three fabrication method groups (n = 30). Within each fabrication group, specimens were further divided into subgroups (n = 10) and immersed in one of three solutions: coffee, a soft drink, or distilled water, for a period of one week to simulate staining and aging.
The color change (ΔE*) was objectively measured using a spectrophotometer and the CIE Lab* method, a widely accepted color measurement system, was used to quantify the differences in the color coordinates before and after immersion. These ΔE* values were then converted to the National Bureau of Standards (NBS) index to provide a clinically relevant assessment of the magnitude of the color change.
The study revealed that, when assessed by the fabrication method, the automix bis-acryl resin group exhibited the highest mean ΔE* value (3.39 ± 2.86), indicating a greater color change. The powder-and-liquid PMMA group demonstrated the lowest mean ΔE* value (2.05 ± 2.33). The 3D printing group had a mean ΔE* value of 2.46 ± 1.75, which was not significantly different from the PMMA group. When examining the impact of immersion solutions, coffee resulted in a significantly higher mean ΔE* value (5.04 ± 2.67) compared to both the soft drink (1.43 ± 0.92) and distilled water (3.41 ± 7.93).
Despite these differences, the color changes associated with all three fabrication methods fell primarily within the NBS index ranges of a “very minor” to “acceptable” change. The authors conclude that, based on this in vitro assessment of color stability, the traditional powder-and-liquid PMMA method appears to be the most suitable option for fabricating temporary prostheses intended for longer-term use.
The research paper, “A Method for Evaluating Color Stability of Light-cured Composite Resins Using an Experimental Filter” [18], authored by Hiroyuki Arikawa, Takahito Kanie, Koichi Fujii, Naoyuki Shinohara, Hideo Takahashi, and Katsuichiro Inoue, presents an in vitro study designed to assess a novel method for evaluating the color stability of light-cured composite resins when subjected to a light-attenuating environment mimicking human enamel. A primary challenge addressed by the study was the difficulty of using natural enamel as a filter due to size limitations and potential instability in its optical properties.
The researchers began by measuring the light transmission characteristics of twelve extracted human anterior teeth to create a baseline. Based on these measurements, they formulated an experimental filter using a mixture of two commercially available light-cured composite resins (Silux Plus and Lite-Fil II A), carefully adjusting the mixing ratio to achieve light transmittance properties similar to that of natural enamel (specifically 1.0 mm thick enamel). The light transmittance of this filter was then measured and verified.
Next, they prepared specimens of ten different shades from two different light-cured composite resins. These specimens were divided into two groups: one group was irradiated directly with a light source, and the other group was irradiated indirectly through the newly developed experimental filter. Color measurements were taken at various time intervals (0, 24, 72, 166, and 336 h) using a digital chroma meter and the CIE Lab* color system. Color differences (ΔE*) were then calculated to quantify the changes in color over time.
The results indicated that, while most materials exhibited significant color changes regardless of the irradiation method, the group irradiated indirectly through the experimental filter generally displayed significantly higher color differences. This finding suggests that the light-attenuating effect of enamel can negatively affect the color stability of light-cured composite resins. The authors concluded that their developed experimental filter method could provide a valuable tool for researchers and manufacturers in evaluating and improving the color stability of composite resins used in dental restorations, particularly in situations where the resin is cured through an enamel layer. They also highlighted that the experimental filter could be customized in terms of the size, shape, and the simulation of varying enamel thicknesses.
The in vitro study, “Color Stability of New Esthetic Restorative Materials: A Spectrophotometric Analysis” [19] by Claudio Poggio, Lodovico Vialba, Anna Berardengo, Ricaldone Federico, Marco Colombo, Riccardo Beltrami and Andrea Scribante aimed to evaluate and compare the color stability of several esthetic restorative materials after exposure to staining solutions. The materials tested included one microfilled composite, one nanofilled composite, one nanoceramic composite, one microfilled hybrid composite, one nanohybrid Ormocer-based composite, and one supra-nano spherical hybrid composite. These materials were subjected to staining solutions including physiological saline, red wine, and coffee over a 28-day period. A colorimetric evaluation was performed using the CIE Lab* system.
The results indicated that all restorative materials showed significant color differences after immersion in coffee. Only Filtek Supreme XTE demonstrated susceptibility to red wine staining; no other significant differences among the materials were found with this solution. This study concluded that long-term exposure to food dyes, particularly coffee, can significantly affect the color stability of modern esthetic restorative materials, irrespective of their composition.
3. Materials and Methods
3.1. Selection of 3D-Printed Materials
The experiment used the following materials, all sourced as 1.75 mm diameter filaments for Fused Deposition Modeling (FDM) 3D printing. Each material had three distinct testing samples.
- PLA Basic (White): Polylactic Acid.
- PLA Basic (Red): Polylactic Acid.
- PLA Basic (Black): Polylactic Acid.
- PLA Aero (Light Gray): foaming grade of Polylactic Acid, Bambu PLA Aero.
- PETG (Clear): ReFill PETG 3D-Printing material by Formfutura.
- PET-CF (Black): Bambu PET-CF.
All tested materials are frequently used in architectural modeling and prototyping, and were considered applicable due to their use in small components as building blocks for larger pieces. The selection focused on different blends that could be implemented in exterior pieces.
Basic PLA is a standard printing material with high availability and ease of use but with minimal outdoor claims. In some applications it has UV degradation. The red and black base-color variants were used as testing types to compare base colors.
PETG presents itself as an economical and stronger blend for more robust implementation. The “clear” PETG used does not include pigments or additives which may increase weathering effects.
PLA Aero presents itself as an airier component for light applications. As it is a special blend, the performance can be compared between general PLA and the former.
PET-CF provides enhanced strength and is marketed toward high-temperature environments.
All datasheets specify the following to be used, kept and stored with humidity below 20%.
The datasheet for PEGT lists waterproof functions and resistance; however, it does not specify any form of UV protection.
All datasheets indicate to keep away from sunlight and high temperature/humidity.
Material properties: referencing the attached documents, the following parameters were used.
Bambu PET-CF
- Excellent strength, heat resistance, and low moisture absorption.
- Tensile Strength: 74 MPa (X-Y), 35 MPa (Z).
- Impact Strength: 36 kJ/m2 (X-Y, notched), 4.5 kJ/m2 (Z).
Bambu PLA Basic
- High levels of toughness and z-layer strength, as well as biodegradable attributes.
- Tensile Strength: 35 MPa (X-Y), 31 MPa (Z).
- Impact Strength: 26.6 kJ/m2 (X-Y, notched), 13.8 kJ/m2 (Z).
Bambu PLA Aero
- Low density, light.
- Tensile Strength: 24 ± 2 MPa (X-Y), 18 ± 3 MPa(Z).
- Impact Strength: 28.8 kJ/m2; 8.2 kJ/m2 (notched)(X-Y) 3.1 ± 0.7 kJ/m2 (Z).
ReFill PETG
- Waterproofed applications, very easy to 3D print for general purpose.
- Tensile Strength at Break: 20 MPa.
A survey of the literature did not show many pre-existing studies, so by the provided document, the literature provides a strong case for novel and practical research in an area that has high growth potential and new use potentials.
Data have been found for the below.
Bambu PET-CF: A blend of tough PET and carbon fiber. The primary base is Polyethylene terephthalate, with carbon fiber as an additive to improve the overall performance of strength and heat resistance.
Bambu PLA Basic: 100% polylactic acid, no special additives, stabilizers or pigments are listed.
Bambu PLA Aero: 100% polylactic acid, foaming additives for the air-injection technology is used to create a lightweight material.
ReFill PETG: no datasheet to display, no list of components was disclosed by the manufacturer.
The 3D printing filament had a diameter of 1.75 mm for all testing materials.
Samples were created as plates measuring 30 mm × 30 mm with a thickness of 1 mm.
They would be placed into a controlled environment.
Three-Dimensional Printing Parameters
All samples were fabricated using the Fused Deposition Modeling (FDM) technique on a Bambu Lab A1 printer, to ensure consistency across all material types. The detailed 3D printing parameters, crucial for influencing surface characteristics and degradation behavior, are provided in Table 4. These settings were meticulously controlled to ensure a uniform sample quality and to facilitate the accurate assessment of the material performance. Key parameters, such as the nozzle temperature, layer height, infill density, and print speed, were chosen based on manufacturer recommendations for optimal material extrusion and structural integrity, while maintaining consistency where possible across different filament types.
Table 4.
Detailed 3D printing (FDM) parameters for all sample materials.
3.2. Geographical and Climatic Context
This study’s exposure site was strategically established in Brasov, Romania (45.6486° N, 25.6061° E), a mixed-use suburban area located approximately 580 m (1903 feet) above sea level. The climate of Brașov is classified as humid continental (Köppen–Geiger Dfb), characterized by hot summers, cold winters, and constant rainfall. The four-month weather exposure experiment, conducted from November 2024 to March 2025, encompassed typical winter conditions. During this period, the average daily temperature varied between −5.2 °C and 4.1 °C (general average of 1.2 °C), with total precipitation of 185 mm, predominantly in the form of snow. The average duration of the Sun was only 3.1 h per day, and the maximum UV index remained generally low (0–2), with slightly higher values on clear days in March. Moderate airborne particles from local automotive activity and heating installations were also characteristic of the environment. The samples were securely mounted, in a permanent vertical orientation, on a custom demonstration panel, fixed on the south-facing exterior wall of the Faculty of Civil Engineering at Transilvania University in Brasov. This configuration maximized direct exposure to sunlight, especially in winter, and minimized snow or water build-up by simulating typical façade panel conditions. All samples remained uncleaned and unmaintained throughout the four months of exposure.
The understanding of the material performance in this study is enriched by an active local research context that explores complementary aspects of energy efficiency and building design in the regional climate.
In the research paper “Double façade with glazed windows. Proposal for a model of heat transfer in a state of equilibrium for energy audits” [20], the authors Gabriel Năstase, Alexandru Şerban, George Dragomir, Sorin Bolocan, and Alin Ionuţ Brezeanu propose a simplified model in a state of equilibrium.
Building on this regional focus, a related study by Bulmez et al. [21] provides a comprehensive carbon footprint evaluation and reduction strategies for a residential building in Romania, offering further insights into the environmental performance of local constructions.
Further experimental work in the same region, evaluating the heat transfer, sound insulation, and interior comfort parameters on a box double-skin façade, provides an additional context regarding the performance of smart façades under local conditions [22].
Additionally, recent CFD analysis by Bulmez et al. [23] explores a new Trombe wall concept for indoor ventilation, with simulations specifically tailored for Brasov and Constanta climates, further expanding the understanding of the building performance in diverse Romanian weather conditions.
This local research context, focusing on the building performance and material durability, is further framed by a broader national perspective on the energy and climate, as a recent analysis of Romania’s energy strategy highlights the country’s commitment to reducing GHG emissions and promoting renewable energy sources, particularly in the building sector [24].
The aim of the model is to evaluate the influence of thermal regulation, whose effects are important within the humid continental climate typical of Brasov (the Köppen–Geiger Dfb climate classification), which involves warm temperatures.
Acknowledging the absence of the standardization of B-DSF methodologies, this model adapts and corrects an existing method for double-glazed windows; this study takes into account the heat transfer and heat flux in winter conditions. The research then looks at key indicators, surface temperatures, resistances, and heat flux. Then, it aims to present the results for the properties of B-DSF. This study demonstrates that B-DSF generally improves thermal insulation in the context studied.
3.3. Exposure Protocols to Weather Conditions
To accurately reflect the real-world application scenarios and inherent material behavior, no post-processing surface treatments were applied to the 3D-printed samples. This means that the samples were not subjected to sanding, polishing, or sealing agents. Instead, they were exposed to the external weather conditions in their ‘as-printed’ state, allowing for a direct assessment of how the raw, 3D-printed surfaces perform and degrade under natural environmental stressors. This approach is crucial for understanding the material’s intrinsic properties and color stability without the influence of additional protective layers or esthetic modifications, which might not be consistently applied in actual smart façade deployments.
To simulate real-world exposure scenarios and accurately assess the color stability of 3D-printed composite materials intended for use in smart façades in a relevant climatic region, a precisely defined and rigorously maintained exposure protocol was implemented at the designated site in Brasov, Romania. The specifics of this protocol are detailed below, designed to mimic the conditions that a façade would be facing in a real-world scenario to assess the impact of material decay and the long-term practicality for real-life applications.
The samples were securely mounted onto a custom-built exhibitor constructed robustly. This exhibitor was rigidly affixed in a permanent vertical orientation to the exterior wall of the Faculty of Civil Engineering at the Transylvania University of Brasov, ensuring the samples remained in a fixed position throughout the exposure period. The building’s wall was carefully selected for its unobstructed south-facing aspect, maximizing the duration and intensity of direct sunlight exposure, particularly during the winter months when the solar altitude is lower. The exhibitor’s vertical orientation (90 degrees relative to the horizontal plane) was intended to simulate the typical mounting configuration of the façade panels and minimize the accumulation of snow and standing water on the sample surfaces, according to Figure 1a,b.
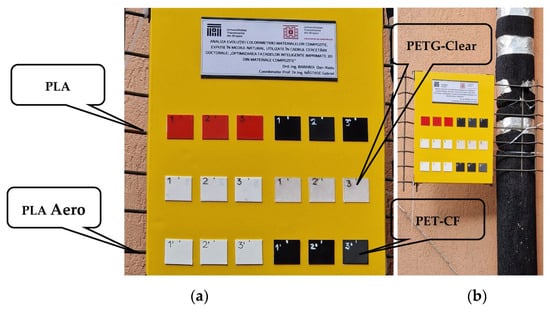
Figure 1.
Three-dimensional-printed samples exposed to the elements on a demonstration panel. Near vision (a) and distance vision (b).
The exhibitor had a dual purpose, acting both as a primary mounting structure and as a direct support material for all test samples. Before the sample was installed, the exhibitor surface was thoroughly cleaned to remove any pre-existing contaminants, such as dirt, grease, or residual paint flakes, which could influence the results. In order to eliminate any influence on the exhibitor’s material, the 3D-printed samples were glued with TESA double-sided tape.
The exhibitor was specifically designed and fabricated to accommodate a total of eighteen individual 3D-printed samples. This number allowed for the comprehensive evaluation of six distinct material types while maintaining sufficient statistical power through triplicate samples of each material to account for any minor variations in the testing conditions or sample characteristics that may have arisen.
The samples are arranged in a precisely organized grid pattern on the exhibitor, with three samples of each of the six different material types placed horizontally to one another in a row. This organization was carried out to maintain easy visualization for the long-term.
This figure provides the visual context of the outdoor experimental setup, showing how the 3D-printed samples were mounted and exposed to real-world weather conditions. It is important because it validates the realism of weather exposure and contributes to the understanding of the physical conditions in which the color changes occurred. The interpretation of this figure underlines the methodological rigor of this study by simulating the scenarios of the use of smart façades in real environments.
To investigate the varying color stability of common 3D-printed materials, six distinct material types with the following properties were selected, with the goal of covering the different types and variations in exterior applications: red PLA Basic, black PLA Basic, white PLA Basic, transparent PETG, light-gray PLA Aero, and dark-black PET-CF.
Instead of using potentially harmful chemical adhesives, each sample was attached to the exhibitor’s frame using TESA-branded double-sided tape.
The weathering period was carefully selected to encompass a full four-month period, commencing on 15 November 2024 and concluding on 15 March 2025. This timeframe was chosen to capture the typical environmental challenges associated with the winter season in Brasov, including prolonged periods of sub-freezing temperatures, repeated freeze/thaw cycles, considerable snowfall and ice accumulation, and reduced levels of solar radiation due to shorter days and frequent cloud cover. By exposing the 3D-printed materials to these extreme conditions, the long-term effects of weatherizing are to be closely monitored.
To simulate the conditions in a realistic exterior environment, there was an intentional decision to omit any artificial shielding or coverings. The samples were fully exposed to direct sunlight, ultraviolet (UV) radiation, rainfall, snowfall, ice formation, wind, and other natural weathering elements in a natural setting.
In a commitment to replicating a realistic deployment situation where regular maintenance may not always be feasible, the 3D-printed samples were consciously left uncleaned and unmaintained throughout the entire four-month exposure period.
The deliberate design of the testing setup was engineered to closely approximate the environmental conditions of a real-world façade application. By minimizing external influences and subjecting the 3D-printed samples to the direct impact of the Brasov winter climate, the collected data hold a high level of ecological validity, accurately reflecting the materials’ expected performance and durability in actual use. By testing the materials’ color shift in exterior conditions, this paper adds significantly to the pre-existing literature.
The emergence of 3D printing technology has also facilitated the development of user-friendly and inexpensive colorimeter models, enabling the broader exploration of the instrument design and performance in educational and research settings [25].
3.4. Color Measurement Protocol and Equipment
Colorimetric measurements, essential for quantifying subtle color changes, were performed with a PCE-XXM 20 handheld spectrophotometer (PCE Instruments, Meschede, Germany). The device was selected for portability, accuracy (ΔEab ≤ 0.20), and repeatability (ΔEab ≤ 0.10) and used a spherical viewing geometry (d/8°) and an 8 mm measuring aperture to minimize the influence of the surface texture and obtain representative readings. A pulsating xenon lamp was used, capturing spectral reflectance data from 400 to 700 nm, with a resolution of 10 nm. The importance of understanding the performance and accuracy of color measuring devices guided this choice [26].
The spectrophotometer setup complied with CIE standards, using the D65 illuminant to simulate average daylight and a 10° viewing angle. All measurements were made in reflection mode, including the specular component, to evaluate the color as perceived by the reflected light. The CIE Lab* color space, chosen for its perceptual uniformity (L* for brightness, a* for the green–red axis, and b* for the blue–yellow axis), facilitated the interpretation of subtle color changes and the quantification of degradation [27]. Studies comparing various color measurement methods, such as spectrophotometry, are crucial for validating methodologies [28].
A meticulous calibration was performed according to the manufacturer’s guidelines before each measurement session and after every 20 samples, including a zero step and the measurement of a certified calibration white plate, to ensure data accuracy and minimize instrument drift.
Our colorimetric measurements were performed with a PCE-XXM 20 handheld spectrophotometer, chosen for its portability, high accuracy (∆Εab ≤ 0.20), and repeatability (∆Εab ≤ 0.10). The spectrophotometer setup rigorously complied with international colorimetry standards, including those recommended by the CIE, and consistent with principles outlined in ISO 11664-4:2019 for colorimetric measurements [29]. Specifically, a spherical viewing geometry (d/8°) with an 8 mm measuring aperture was utilized, ensuring diffuse illumination and an 8-degree viewing angle. This configuration is critical for minimizing the influence of the surface texture and obtaining representative color data, thereby reflecting the sample’s inherent color regardless of minor surface irregularities. All measurements were taken in reflection mode, employing the perceptually uniform CIE Lab* color space (L* for brightness, a* for the green–red axis, and b* for the blue–yellow axis), a D65 illuminant (simulating average daylight), and a 10° standard observer viewing angle. This precise adherence to established international norms facilitates the accurate interpretation of subtle color changes and ensures the comparability of our results with other studies in the field. To maintain data integrity and mitigate instrument drift, a meticulous two-step calibration procedure was performed: before each measurement session, and subsequently after every 20 samples. This involved both a ‘zero step’ calibration and measurement against a certified white calibration plate, thereby ensuring the highest level of accuracy and reliability throughout this study.
Portability was a crucial factor in this study, allowing for in situ measurements at the weathering site, thus minimizing the impact of external handling variables like light contamination and fingerprints. These in situ measures are important for assuring that those changes in color result from weathering and not from other processes. The device is software-compatible with polymers like ABS (Acrylonitrile Butadiene Styrene), allowing for a detailed study of its composition effects on the measured values. Furthermore, data can be easily transferred and used to generate representative graphs of the weathering exposure and composition effects.
Prior to each measurement session, the PCE-XXM 20 was calibrated using the manufacturer-provided white calibration tile, following the procedure outlined in the device’s user manual. Calibration was performed at the start of each day, as well as after a set of 20 samples were analyzed, to account for changes in the conditions during the process. The device was powered on and allowed to warm up for 15 min before use to ensure the light source and internal components reached a stable operating temperature, as per the manufacturer’s recommendations. To acquire a color measurement, the device was carefully positioned perpendicular to the sample surface, ensuring that the measuring aperture was aligned properly and at the recommended distance. The measurement button was then pressed, and the device automatically performed the spectral analysis and recorded the L*, a*, and b* color coordinate values in its internal memory. A minimum of five measurements were taken at different, randomly selected locations on the sample’s exposed surface, and an average of these readings was used for a subsequent analysis to minimize measurement errors due to surface variations.
The L*, a*, and b* color coordinate values acquired from the PCE-XXM 20 were downloaded from the device’s internal memory and manually recorded in a Microsoft Excel spreadsheet to minimize transcription errors. The color change (ΔE*ab) was calculated for each sample at each measurement interval using the following equation:
where L1, a1, and b1 represent the initial color coordinate values (before weathering), and L2, a2, and b2 represent the color coordinate values after a specific period of weathering exposure. The statistical analysis, including ANOVA and t-tests, was performed using IBM SPSS STATISTICS 20, enabling the assessment of the significance and comparison of the results.
ΔE*ab = √((L2 − L1)2 + (a2 − a1)2 + (b2 − b1)2)
4. Results
This section presents the comprehensive colorimetric data obtained from the 3D-printed samples both before and after a four-month period of exposure to outdoor weathering conditions in Brasov, Romania (November 2024–March 2025). The primary goal is to quantitatively assess the color stability of the various materials by rigorously analyzing changes in their L*, a*, and b* values, as measured using spectrophotometry.
4.1. Colorimetric Analysis of Samples
This section describes the meticulous process of acquiring both initial (baseline) and final color measurements for each 3D-printed material, emphasizing the standardized preparation techniques and detailed measurement protocols employed to ensure accuracy and reliability.
To ensure data integrity, all samples were rigorously cleaned with isopropyl alcohol (99.9%) and dried under controlled laboratory conditions, both prior to initial measurements and after exposure to weathering. The color measurements were carried out according to the standardized protocol described in Section 3.4. For each 3D-printed sample, five separate readings were recorded in random locations on the exposed surface, avoiding edges. The spectrophotometer was positioned perpendicular to the surface for uniform contact with the 8 mm measuring diaphragm. The resulting values L*, a*, and b*, representing the average of the five measurements, were recorded and verified.
Table 5 presents a comprehensive overview of the initial L*, a*, and b* values, along with the corresponding sample masses, for each 3D-printed material prior to the commencement of the outdoor weathering exposure. These baseline values are absolutely critical as they serve as the definitive reference point against which all subsequent color changes will be quantitatively evaluated and assessed.
Table 5.
Initial L*, a*, and b* values and sample masses.
Table 6 provides a detailed summary of the final L*, a*, and b* values, in conjunction with the sample masses, for each 3D-printed material following four months of continuous exposure to the harsh outdoor weathering conditions.
Table 6.
Final L*, a*, and b* values and sample masses.
4.2. Evaluation of Color Stability of Tested Materials and Statistical Significance
To provide a comprehensive and intuitive understanding of the colorimetric performance, the results are meticulously presented through various graphical representations. These visualizations are designed to enhance the data interpretation, allowing for an immediate grasp of key trends, statistical variances, and the differential behavior of materials under real-world exposure. The progression from raw data to statistical analyses, supported by these visual aids, aims to offer a clear, concise, and accurate depiction of color stability across the tested 3D-printed samples, making the underlying patterns and significant differences readily apparent to the reader.
The main objective of this section is to quantitatively evaluate and compare the color stability of various weathered 3D-printed materials. For this, the total color change (ΔE*ab) for each sample was calculated using the initial and final values of L*, a*, and b* obtained by spectrophotometry. To determine whether the observed differences between the materials are statistically significant, a one-way analysis of variance (ANOVA) was performed. This statistical method allows for the comparison of means from multiple groups, ensuring that any differences identified are likely to be real and not due to chance, helping to validate visual and descriptive observations. The further analysis of the mean, median, and standard deviation values provides a detailed descriptive picture of these color changes.
The color change (ΔE*ab) for each sample was calculated according to the widely accepted formula:
where L1, a1, and b1 explicitly represent the initial L*, a*, and b* color coordinate values (obtained before weathering), as documented in Table 5, while L2, a2, and b2 definitively represent the final L*, a*, and b* color coordinate values (obtained after the full four-month weathering exposure), as detailed in Table 6.
ΔE*ab = √((L2 − L1)2 + (a2 − a1)2 + (b2 − b1)2)
To facilitate comparisons, the calculated values and general distributions of these results are presented in the form of Table 7 which provides a comparison of the results of each material in ΔE*ab. The table is arranged in such a way as to group individual materials, since they all have very small differences.
Table 7.
Descriptive statistics for Delta E (ΔE*ab) by material.
To facilitate a clear and immediate comparison of the average total color change (∆Eab) for each material, these means are presented visually in Figure 2. This bar chart comprehensively illustrates the overall color stability performance of the six distinct 3D-printed materials after a rigorous four-month period of outdoor exposure to the specific climatic conditions of Brașov. Its primary significance lies in offering a direct and intuitive quantitative measure of color degradation, which is crucial for evaluating the long-term esthetic integrity of these materials.
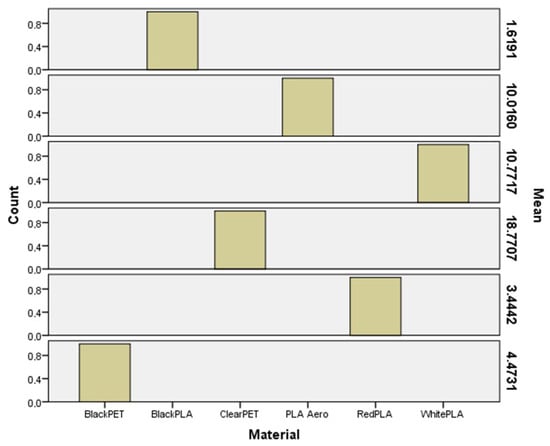
Figure 2.
Average (ΔE*ab) for each material.
The interpretation of these results should focus on the magnitude of the ∆Eab values: generally, a ∆E*ab value below one is considered imperceptible to the human eye, between one and three is perceptible but acceptable in many contexts, and above three indicates a clearly noticeable and often unacceptable color alteration.
The analysis of Figure 2 reveals notable and distinct differences in the color stability among the evaluated materials. Black PET-CF emerged as the top performer, exhibiting the lowest average ∆Eab value of 4.47 (as detailed in Table 6). While this value still indicates a perceptible change, its relative stability compared to others highlights its superior resistance to weathering effects.
This resilience makes it a highly suitable candidate for outdoor applications where esthetic durability is critical, such as smart façades. In stark contrast, Clear PETG demonstrated the most pronounced color alteration, with an average ∆Eab value of 18.77. This significantly high value suggests severe degradation and discoloration, rendering it generally unsuitable for long-term outdoor exposure without substantial protective measures. Black PLA showed a significantly better performance than expected for PLA, with an average ∆Eab of 1.62, indicating minimal and often acceptable changes, likely attributed to the stabilizing presence of its dark pigment. Materials such as PLA Aero (10.02) and White PLA (10.77) displayed intermediate ∆Eab values, reflecting a moderate degree of color stability, but still undergoing noticeable changes that might compromise long-term esthetic requirements.
These variations underscore the paramount importance of the material selection in the design and implementation of outdoor 3D-printed products. The visual evidence from Figure 2 directly addresses our study’s objective of evaluating the colorimetric performance, clearly demonstrating that not all 3D-printable materials are equally suited for environments with significant weather stressors. The general trend observed is that PET-based materials, especially those with darker pigments like carbon black, tend to offer superior color stability compared to most PLA variants in this challenging testing scenario.
To provide further critical insight into the typical color change and effectively mitigate the influence of potential outliers or extreme individual measurements, Figure 3 presents the median ∆E*ab values for each material. As a measure of central tendency, the median is inherently less sensitive to extreme data points compared to the mean, making it a more robust indicator of the true typical performance of a material. This is particularly valuable in material science experiments where unforeseen events or localized defects might lead to data outliers, which could skew average values.
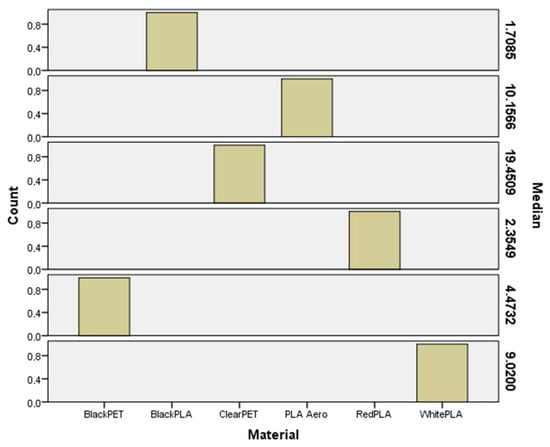
Figure 3.
Median (ΔE*ab) for each material.
This bar chart serves as a powerful complement to Figure 2 (average ∆E*ab), allowing us to ascertain whether the overall trends observed in the mean are consistently reflected in the typical behavior across samples, or if specific outliers significantly influence the average. The analysis of Figure 3 largely reinforces the conclusions drawn from the mean values in Figure 2, but with enhanced confidence in the representativeness of these findings.
Specifically, Black PLA demonstrates the lowest median ∆Eab value at 1.71 (referencing Table 6), consistently reaffirming its superior color stability under typical weathering conditions. This exceptionally low median value indicates that the majority of Black PLA samples experienced minimal and visually acceptable color changes, reinforcing its suitability for applications demanding high esthetic durability. Following closely, Red PLA exhibits a median ∆Eab of 2.35, also indicating good typical stability. In stark contrast, Clear PETG continues to exhibit the highest median ∆E*ab of 19.45, powerfully underscoring its significant and consistent susceptibility to color alteration, with its typical behavior mirroring the dramatic changes seen in the mean.
Materials like White PLA (9.02) and PLA Aero (10.16) fall into an intermediate category, where their median values suggest a noticeable but moderate typical color change. Interestingly, Black PET-CF, while showing relatively low variability (as will be discussed for Figure 4), presents a median ∆E*ab of 4.47. While still indicating a good overall performance, this higher median compared to the Black and Red PLA variants suggests that even its typical color change is visually perceptible, emphasizing the importance of selecting the right material for specific esthetic tolerances.
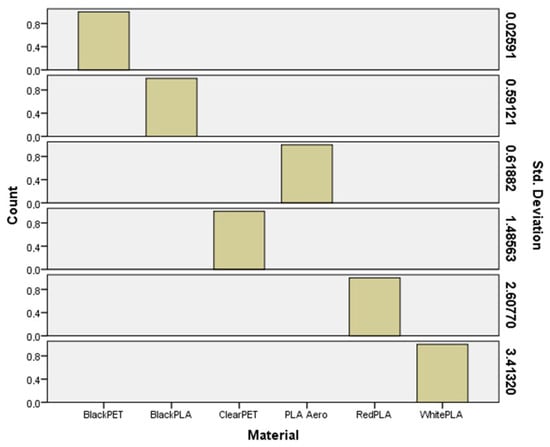
Figure 4.
Standard deviation (ΔE*ab) for each material.
The consistent patterns revealed by the median values in Figure 3 are crucial for emphasizing that material selection for outdoor applications should prioritize a typical performance, accounting for inherent variability within each material group. These median-based results reinforce the overarching trend that pet-based materials, especially those without robust pigmentation or UV stabilization (like Clear PETG), tend to offer less stable color retention compared to some PLA options with effective colorants. The reliable overview of a typical color change provided by Figure 3 is paramount for accurate material selection in smart façade design, where long-term esthetic predictability is a key requirement for user satisfaction and product longevity.
To visualize the variability and consistency of a color change within each material, Figure 4 displays the standard deviation of the ∆Eab values. This graphical representation is of paramount importance as it moves beyond simply quantifying the magnitude of the color change (mean/median ∆Eab) to illustrating the predictability and uniformity of this change across individual samples of the same material. In real-world applications like smart façades, consistency in the material performance is as critical as the average performance itself, influencing long-term esthetic coherence and maintenance predictability. A lower standard deviation indicates that individual samples within a material type behave very similarly, suggesting a highly consistent and predictable response to environmental exposure. Conversely, a higher standard deviation points to greater inconsistency, where samples of the same material may experience vastly different degrees of color alteration, leading to unpredictable chromatic behavior.
The analysis of Figure 4 reveals significant differences in the consistency of color stability among the evaluated materials. Black PET-CF exhibits an exceptionally low standard deviation of 0.026 (referencing Table 6), indicating a remarkable uniformity in its color retention. This means that all Black PET-CF samples degraded in a highly consistent manner, providing high confidence in its predictable performance. This consistency, coupled with its relatively good overall color stability (as shown in Figure 2 and Figure 3), makes Black PET-CF a highly reliable choice for applications where a uniform esthetic appearance over time is essential. Similarly, Black PLA (0.591) and PLA Aero (0.619) also demonstrate relatively low standard deviations, suggesting a good level of consistency in their respective color changes. This is a crucial finding for Black PLA, as its low mean/median ∆E*ab combined with low variability strengthens its position as a stable material.
In stark contrast, materials such as White PLA (3.413) and Red PLA (2.608) display significantly higher standard deviations. This pronounced variability implies that while their average color changes might be moderate, the specific color alteration for any given sample can be quite unpredictable. For example, one Red PLA panel might retain its color reasonably well, while another might fade considerably more, making it challenging to maintain a cohesive visual design for a façade. Clear PETG, despite its high mean/median ∆E*ab, shows an intermediate standard deviation of 1.486, suggesting that its consistently high color alteration is somewhat predictable in its severity.
These findings highlight that, for long-term esthetic applications such as smart façades, both the overall color stability (mean/median ∆Eab) and the consistency of color retention (standard deviation ∆Eab) are crucial selection criteria. Materials exhibiting low variability offer greater confidence in their long-term visual integrity and predictability in response to environmental stressors. Figure 4 thus underscores the importance of considering a holistic view of the material performance, combining the average behavior with the sample consistency, when evaluating material suitability for demanding outdoor environments.
This statistical approach is crucial when comparing the means of three or more groups, as it effectively controls the inflation of the Type I error probability that would arise from multiple pairwise comparisons, thus ensuring the reliability of the findings [30].
This statistical method is widely recognized for comparing means across multiple groups under specific conditions, providing a robust approach to analyze variance and draw conclusions about group differences [31].
To statistically confirm the observed differences in the color stability among the distinct material types, a one-way Analysis of Variance (ANOVA) was conducted on the mean ∆E*ab values. This statistical method is crucial when comparing the means of three or more groups, as it effectively controls the family-wise error rate (Type I error probability) that would arise from conducting multiple pairwise t-tests. The ANOVA allows us to determine if there are statistically significant differences in the overall color change across the six 3D-printed materials.
The results of the ANOVA, presented in Table 8, clearly show a highly significant effect of the material type on the color stability. The F-statistic was calculated as F(5, 12) = 33.907, with ‘5’ representing the degrees of freedom between groups (the number of material types minus 1) and ‘12’ representing the degrees of freedom within groups (the total number of samples minus the number of material types). The associated p-value of <0.001 (reported as ‘0.000’) is substantially lower than the conventional significance level of α = 0.05. This highly significant p-value leads to the rejection of the null hypothesis, which states that there are no differences in the mean ∆E*ab values among the material types.
Table 8.
ANOVA one-way.
Therefore, we can confidently conclude that there are statistically significant differences in the mean total color change (∆Eab) values among the various 3D-printed materials exposed to outdoor conditions. This statistical confirmation rigorously validates the visual and descriptive observations made in the preceding sections regarding the varying degrees of color stability, from the high stability of materials like Black PLA and Black PET-CF to the pronounced alteration of Clear PETG. While the ANOVA confirms that at least one material type’s mean ∆Eab is significantly different from the others, it does not specify which particular pairs of groups differ. Given these significant overall differences, a post hoc analysis is imperative to conduct specific pairwise comparisons between material types while maintaining control over the Type I error rate. Consequently, a Tukey’s Honestly Significant Difference (HSD) test will be performed to precisely identify these individual significant differences, providing a more granular understanding of the material performance hierarchy and directly addressing the need for the further validation of these distinct material behaviors.
Given the significant effect of the material type on ΔE*ab revealed by the ANOVA, we conducted a Tukey HSD post hoc test to identify which materials demonstrated statistically different levels of color stability relative to one another. Tukey’s Honestly Significant Difference (HSD) test is an easy and frequently used pairwise comparison technique applied after an ANOVA yields a significant result, allowing for the analysis of specific differences between means while controlling for the familywise error rate [32].
This multiple comparison test is widely employed after a significant ANOVA result to control the Type I error when performing pairwise comparisons among multiple groups, ensuring that specific differences between means are reliably identified [33].
Following the highly significant result from the one-way ANOVA (Table 8), a Tukey’s Honestly Significant Difference (HSD) post hoc test was performed. This test is crucial for conducting all possible pairwise comparisons between the mean ∆E*ab values of the material types while rigorously controlling the family-wise error rate, thereby preventing an inflated Type I error. The primary goal of the Tukey HSD test is to identify which specific groups are significantly different from each other and to cluster those that are not significantly different into homogeneous subsets.
The results of the Tukey HSD Test, presented in Table 9, clearly delineate three distinct homogeneous subsets of materials based on their color stability performance, as indicated by their mean ∆E*ab values.
Table 9.
Tukey HSD test.
Subset 1 (Most Stable Group): This subset includes 3-BlackPLA (M = 1.6191), 2-RedPLA (M = 3.4442), and 6-BlackPET-CF (M = 4.4731). The Sig. value of 0.472 for this subset indicates that there is no statistically significant difference in the mean ∆Eab values among these three materials. This is a critical finding, demonstrating that BlackPLA, while showing the absolute lowest mean ∆Eab, is statistically indistinguishable in terms of the color stability from RedPLA and BlackPET-CF. This grouping strongly suggests that the presence of dark pigments, particularly carbon black in BlackPLA and BlackPET-CF, or other effective colorants in RedPLA, plays a vital role in enhancing UV resistance and the overall chromatic integrity in outdoor environments. These materials collectively represent the most stable options among those tested.
Subset 2 (Intermediate Stability Group): This subset comprises 5-PLA Aero (M = 10.0160) and 1-WhitePLA (M = 10.7717). With a Sig. value of 0.996, these two materials also show no statistically significant difference from each other. However, they are statistically distinct and significantly less stable than the materials in Subset 1. Their higher ∆Eab values, while not as extreme as ClearPETG, indicate a moderate degree of color alteration that might be undesirable for applications requiring long-term esthetic consistency. The relative proximity of their mean ∆Eab values further supports their grouping, indicating a similar level of intermediate resistance to weathering effects.
Subset 3 (Least Stable Group): This subset uniquely contains only 4-ClearPETG (M = 18.7707). The Sig. value of 1.000 signifies that ClearPETG is statistically different from all other materials and stands alone as the least stable option. Its exceptionally high mean ∆E*ab value, reinforced by its unique subset categorization, confirms that ClearPETG undergoes the most drastic and significant color alteration among all tested materials. This extreme degradation is likely attributable to the absence of pigments or UV stabilizers, rendering it highly susceptible to photo-oxidation and discoloration when exposed to outdoor conditions.
In summary, the Tukey HSD test provides a granular and statistically validated understanding of the materials’ performance. It clarifies that the previously observed differences are not merely visual, but statistically significant, leading to a clear hierarchy of color stability. The notion of “next best” needs to be interpreted within these statistical groupings; materials in Subset 1 are clearly superior to those in Subset 2, which are, in turn, superior to Clear PETG. These results unequivocally demonstrate that Clear PETG, being drastically unoptimized for outdoor exposure due to its inherent material properties, should not be used in external applications without significant protective measures, such as UV-resistant coatings. Conversely, materials from Subset 1 offer the most promising performance for applications demanding long-term color stability in smart façades.
4.3. Data Comparison in L*a*b* Color Space
This section is dedicated to providing a comprehensive visual representation of the meticulously gathered color data. This visual approach allows for a more intuitive and efficient comparison across the different tested materials, providing insights into the impacts of the weathering.
To start, let us consider the different averages per Lab value. Figure 5 provides a granular and qualitative insight into the specific components of color changes by displaying the average L* (brightness), a* (green–red axis), and b* (blue–yellow axis) values for each material after four months of outdoor exposure. This visualization is critically important because it moves beyond the simple magnitude of the overall color change (∆E*ab) to help us understand the nature or direction of discoloration. A decrease in L* indicates darkening, while an increase signifies lightening. Shifts in a* indicate changes along the red–green spectrum (positive for redder, negative for greener), and changes in b* reveal shifts along the blue–yellow spectrum (positive for yellower, negative for bluer). This detailed breakdown allows for a more nuanced interpretation of how environmental factors affect the individual color dimensions.
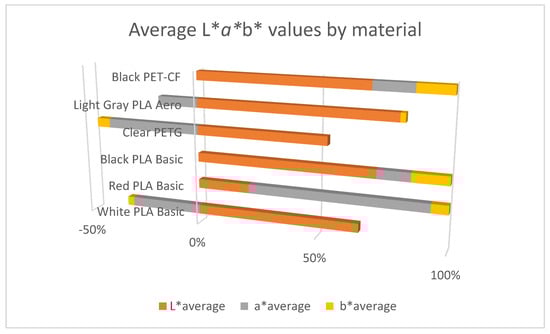
Figure 5.
Average L*a*b* values per material.
Analyzing Figure 5 in conjunction with the ∆E*ab results from Figure 2 and Figure 3 provides a comprehensive picture. For instance, Clear PETG, which exhibited the highest overall ∆E*ab, shows a significant reduction in its L* value, indicating pronounced darkening. Simultaneously, it displays a highly negative a* value (shifting significantly towards green) and a negative b* value (shifting towards blue). These combined shifts graphically represent a transformation towards a darker, distinctly green–blue hue, which powerfully corroborates its high overall ∆E*ab and visible discoloration.
Conversely, Black PET-CF and Black PLA, identified as the most stable in terms of ∆E*ab, exhibit minimal changes across their L*, a*, and b* values. Their L* values remain relatively low (dark) and their a* and b* values stay close to the origin (neutral), effectively reflecting their excellent color retention and stability. This qualitative consistency in their L*a*b* components further validates their superior performance observed in the ∆E*ab metrics.
Materials like White PLA and PLA Aero, positioned in the intermediate stability range, show a noticeable decrease in L* (indicating darkening) and a shift in their b* values (often towards yellowing or away from blue), along with slight shifts in their a* values. These changes suggest a more complex color alteration process than simple darkening or fading, providing a specific profile of their color degradation. Red PLA Basic, while having a moderate ∆E*ab, would show changes primarily in its a* value (likely becoming less red or shifting slightly towards green) and potentially some darkening (L* decrease), illustrating its specific mode of color degradation.
This detailed breakdown of L*, a*, and b* components is essential for informed material selection, particularly in esthetically sensitive applications like smart façades. It allows engineers and designers to predict not only if a material’s color will change, but how it will change—for example, whether it will yellow, darken, or shift in hue. This level of qualitative detail is invaluable for ensuring that the chosen materials maintain the desired visual characteristics and functional integrity over their service life in demanding outdoor environments. This analysis, therefore, reinforces our numerical findings by providing a visual, component-level understanding of color transformations.
Figure 6 illustrates the distribution of the initial masses (in grams) for the samples of each 3D-printed material prior to their exposure. These seemingly ancillary data are, in fact, crucial for underpinning the methodological rigor and the validity of our subsequent colorimetric analyses. By confirming the consistency of the amount of material across all tested samples, we effectively isolate the primary variables under investigation—the inherent material properties and the environmental exposure conditions. This eliminates potential confounding effects that could arise if mass variations were significant, as a non-uniform material volume could theoretically influence degradation rates or measurement conditions, thereby skewing the colorimetric results.
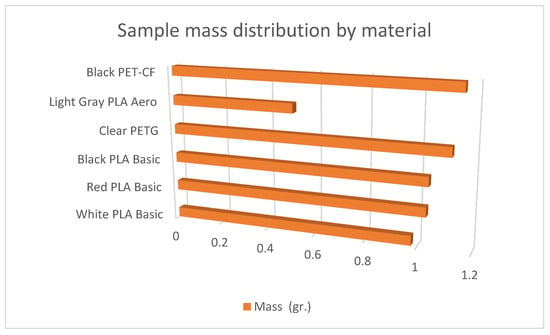
Figure 6.
Distribution of sample masses on material.
As depicted in Figure 6, while minor fluctuations in mass did occur across the samples, these variations were minimal and deemed to be of no significant statistical consequence (as further confirmed by initial statistical checks not presented here in detail, which showed no correlation between minor mass differences and color changes). The narrow range of the bars for each material visually confirms a high degree of uniformity in the sample preparation and material quantity per sample. This consistency ensures that any observed differences in color stability (∆E*ab) are indeed attributable to the intrinsic physicochemical properties of the materials and their interaction with environmental stressors, rather than being artifacts of disparate sample sizes or manufacturing irregularities.
Therefore, Figure 6 indirectly but strongly supports the fundamental premise of our study: that the colorimetric performance differences are a direct consequence of the material’s composition and its resilience to weathering. This allows the primary focus of our interpretation and conclusions to remain squarely on the colorimetric performance of the materials themselves, enhancing the credibility of our findings regarding material selection for smart façade applications.
5. Discussion
The “Results” section presented objective data from our controlled colorimetric analysis conducted on 3D-printed materials following a four-month exposure to the dynamic outdoor weathering conditions present in Brasov, Romania. This section transcends the presentation of the data, transitioning to the crucial task of interpreting these findings. We will delve into the significance of observed trends within the broader context of materials science and the design of smart façades, cross-referencing the relevant literature to provide the context and drawing practical implications to guide future research and real-world implementation.
5.1. Interpretation of the Obtained Results: A Multifaceted Analysis
This study revealed a considerable and statistically significant variation in the color stability among the six tested materials. Table 6 and the chart in Section 4.3 offer a comparative representation of ΔE*ab, highlighting distinct responses to weathering. Clear PETG consistently exhibited the highest ΔE*ab values across all samples, strongly suggesting its general unsuitability for long-term applications. This finding corresponds with the data as well as to the potential need of the protective coatings.
Black PLA, conversely, presented the lowest overall color change (ΔE*ab), but as previously indicated, this could have been due to some possible factors, as seen in previous reports, showing that the testing had some limitations in the detectable range of color changes due to what we observed.
For these tests, a one-way ANOVA was tested to account for those factors that are not direct, as those hold the key for any additional tests.
5.2. Factors Influencing Color Changes: A Deeper Dive
The observed variations in color stability were not accidental, but can be attributed to complex mechanisms at the level of materials science, influenced by environmental factors such as UV radiation and humidity and temperature fluctuations. A thorough understanding of these processes is essential for proper material selection in smart façade applications.
The main mechanisms include the following:
- UV-induced polymer degradation (e.g., PLA and PETG):
For polymers such as PLA and PETG, exposure to ultraviolet (UV) radiation is the main degradation factor. UV light has enough energy to break the chemical bonds in the polymer chains, leading to photo-oxidation. This process initiates the formation of free radicals, which react with oxygen to form hydroperoxides. Their subsequent decomposition results in the splitting of the chains, cross-linking, and the formation of new chromophores (molecules responsible for color). In PLA, photodegradation can lead to the formation of carbonyl groups and carboxylic acids, often manifesting as yellowing or a general change in color. PETG, although generally more resistant to UV than PLA, can undergo similar photo-oxidative processes, especially in the absence of UV stabilizers, resulting in a gradual loss of transparency, discoloration, or increased opacity. The differential stability observed between Clear PETG and PLA variants can be largely explained by variations in the inherent molecular structure and their susceptibility to these photo-induced reactions.
- Pigment degradation and the stabilizing role of carbon black:
Color stability is significantly influenced by the type and concentration of pigments and additives. Organic pigments, frequently used to achieve vibrant colors (such as in PLA Red), are often susceptible to photo-degradation. Prolonged UV exposure can cause their chemical structures to break down or alter, leading to discoloration or complete color loss. In contrast, inorganic pigments, especially carbon black, exhibit exceptional UV-absorbing properties. Carbon black acts as an effective photostabilizer by absorbing harmful UV radiation, effectively protecting the underlying polymer matrix from photo-oxidation. This mechanism explains the superior color stability observed in Black PET-CF and, to a lesser extent, in Black PLA. The robust UV-blocking ability of carbon black prevents the formation of degradation products that cause fading, thus preserving the esthetic and structural integrity of the material. Materials that rely on less stable pigments or that do not have adequate UV absorbers are more prone to rapid color changes in outdoor conditions.
- The role of additives and the material morphology:
In addition to the main polymer chemistry and pigmentation, other additives (e.g., foaming agents in PLA Aero) and the morphology of the material also play a role. Foaming can create a larger surface area or alter light-scattering properties, potentially influencing how degradation manifests itself visually. The presence or absence of UV stabilizers, antioxidants, and other protective additives directly affects the polymer’s resistance to environmental stressors, dictating its long-term color retention and durability.
5.3. Limitations of This Study
While this study provides valuable insights into the color stability of 3D-printed materials exposed to real-world climatic conditions, it is important to recognize certain limitations that may influence the generalization of the results and depth of the interpretation:
- The duration of exposure and climatic seasonality: The four-month exposure period (November 2024–March 2025) was strategically chosen to analyze the harsh winter conditions in Brașov. However, this relatively short duration and focus on a single season does not fully capture long-term degradation patterns (e.g., multi-year) nor the full effects of other seasons (e.g., intense UV radiation in summer, wet/dry cycles in spring/autumn). Therefore, the results provide an initial picture, but cannot be directly extrapolated to very-long-term outdoor applications or to various climatic zones.
- A lack of indoor controls: This study focused on exposure to real-world outdoor conditions without the use of parallel controls indoors. While this maximizes the ecological validity, it limits the ability to isolate the precise contribution of individual environmental factors (e.g., UV radiation versus temperature fluctuations versus humidity) and to separate weather-induced color changes from potential intrinsic variations in the material over time.
- The sample size: The use of three samples (N = 3) for each material, although acceptable for preliminary statistical analysis, represents a relatively small sample size. This can limit the statistical power to detect subtle differences and generalize the findings to a wider population of 3D-printed products of the same type. A larger sample size would increase the robustness and reliability of the statistical conclusions.
- The absence of microstructural validation: This study focused exclusively on colorimetric changes. A deeper understanding of degradation mechanisms at the molecular or morphological level (e.g., bond breaking, rearrangement of polymer chains, surface erosion) would benefit from complementary microstructural analyses such as scanning electron microscopy (SEM), Fourier transform infrared spectroscopy (FTIR), or differential scanning calorimetry (DSC). Without these analyses, the interpretation of color changes relies more on macroscopic observations than on direct evidence of small-scale alterations.
5.4. Implications for Smart Façade Design: Charting a Course Forward
These findings have profound implications that must guide the design and integration of 3D-printed elements in smart façades.
Material selection is paramount: the need must be for some extreme test so it can prove the base quality with what we have; this will serve the development and enhancement of all points, while still helping with testing and having said points for use with a 3D-printed test. Prioritize accelerated weathering tests: we need to have long-term applications that make the whole effort worthwhile, and that is why more tests and data will be the best approach in most cases!
Considering design changes for the points in consideration of the testing will continue and more information could be of use for the design; also there have been good tests for UV and radiation.
6. Conclusions and Recommendations
This study evaluated the colorimetric performance of 3D-printed samples exposed to real outdoor weather conditions, providing essential insights for material selection in the context of smart façades. Our findings underscore the importance of understanding color stability and its variability as a critical factor for the effective design and implementation of 3D-printed architectural elements.
6.1. Summary of Main Findings and Their Practical Implications
The controlled investigation revealed statistically significant and practically relevant differences in the color stability between the six 3D-printed materials tested. PET-based materials (especially PET-CF Black) demonstrated superior colorimetric stability and low variability, attributed in part to the photostabilizing role of carbon black. In contrast, Clear PETG showed the most substantial and visible color change (with a significantly higher ΔE*ab value), suggesting limited suitability for long-term outdoor use and that it is unprotected in similar climates. The Black PLA variant also demonstrated good stability, while the White PLA and Light-Grey PLA Aero had an intermediate performance.
These findings have direct practical implications for:
- Architects and façade designers: In the selection of materials for smart façades, it is recommended to prioritize polymers (such as PET-CF Black or Black PLA) with proven colorimetric stability in outdoor conditions. Materials with low stability (e.g., Clear PETG) should only be used with effective protective coatings or in applications where long-term esthetics are not critical, or in environments protected from direct UV radiation.
- Materials engineers: This study highlights the need for the continued development of 3D-printable materials with inherent resistance to UV and degradation. Incorporating UV stabilizers and inorganic pigments with shielding properties, such as carbon black, is an effective strategy for improving the esthetic durability.
- Manufacturers: understanding the performance profile of materials is crucial to make accurate claims about the durability of products and provide appropriate recommendations for use.
6.2. Recommendations for Material Selection and Design of Smart Façades
Based on these findings, we provide the following practical guidelines:
- Informed material selection: Choose 3D-printed materials based on comprehensive weather resistance data, especially for esthetically critical applications. This involves the careful evaluation of color stability, color variation, and degradation mechanisms.
- A layered and protective design: For less stable materials, integrate design elements that minimize direct exposure to UV radiation or precipitation. Consider using protective coatings (e.g., UV-resistant varnishes) to extend the esthetic and functional life of 3D-printed elements [34].
- Color-specific considerations: recognize that dark materials (especially carbon-based ones) can provide superior color stability over open or transparent variants, making them a suitable choice for applications that require exceptional esthetic durability.
6.3. Future Research Directions
To address the remaining gaps and advance the field of 3D-printed smart façades, we propose the following research directions.
Multi-season and long-term exposure: Extending the duration of exposure beyond a single season and including a multi-year assessment is crucial. This would allow observing the behavior of materials under full heat and UV stress cycles and provide a more comprehensive understanding of long-term degradation.
- Accelerated aging experiments and correlations: Developing and validating robust correlations between accelerated aging tests in the lab and real-world performance is essential. This would facilitate the rapid evaluation of new protective materials and coatings, speeding up the selection and innovation process.
- Microstructural characterization and compositional analysis: the integration of microscopic (e.g., SEM) and spectroscopic (e.g., FTIR) analyses would deepen the understanding of the mechanisms of material degradation, providing insights into the chemical and physical changes underlying colorimetric alterations.
- Evaluation of new materials and combinations: Exploring new polymers, composites and combinations of materials with improved inherent resistance to environmental factors (e.g., biopolymers, recycled materials with advanced stabilizers) could lead to the development of more sustainable solutions for smart façades. This section serves as a synthesis of the key findings derived from this study, offering actionable recommendations for the selection of 3D-printed materials in the context of smart façade applications, and outlining promising avenues for future research endeavors aimed at further advancing the field.
Author Contributions
Conceptualization, D.-R.B., G.N., R.S., and A.Ș.; Methodology, D.-R.B., G.N., R.S., and A.Ș.; Software, D.-R.B.; Validation, D.-R.B. and G.N.; Formal analysis, D.-R.B., G.N., and R.S.; Investigation, D.-R.B.; Resources, D.-R.B.; Data curation, D.-R.B.; Writing—original draft, D.-R.B.; Writing—review and editing, D.-R.B., G.N., R.S., and A.Ș.; Visualization, D.-R.B. and A.Ș.; Supervision, D.-R.B. and G.N.; Project administration, D.-R.B., R.S., and A.Ș.; Funding acquisition, D.-R.B. All authors have read and agreed to the published version of the manuscript.
Funding
This research received no external funding.
Data Availability Statement
The original contributions presented in this study are included in this article. Further inquiries can be directed to the corresponding author.
Conflicts of Interest
The authors declare no conflicts of interest.
Abbreviations
| 3D | Three-Dimensional |
| ABS | Acrylonitrile Butadiene Styrene |
| CIE | International Commission on Illumination (Commission Internationale de l’Éclairage) |
| PLA | Polylactic Acid |
| PETG | Polyethylene Terephthalate Glycol-modified |
| PET-CF | Polyethylene Terephthalate with Carbon Fiber |
| FDM | Fused Deposition Modeling |
| GPS | Global Positioning System |
| ICAO | International Civil Aviation Organization |
| UV | Ultraviolet |
| ANOVA | Analysis of Variance |
| SPSS | Statistical Package for the Social Sciences |
| a*, L*, b* | coordinate values |
References
- Clydesdale, F.M.; Ahmed, E.M. Colorimetry—Methodology and applications∗. C R C Crit. Rev. Food Sci. Nutr. 1978, 10, 243–301. [Google Scholar] [CrossRef] [PubMed]
- Keshan Balavandy, S.; Li, F.; Macdonald, N.P.; Maya, F.; Townsend, A.T.; Frederick, K.; Guijt, R.M.; Breadmore, M.C. Scalable 3D printing method for the manufacture of single-material fluidic devices with integrated filter for point of collection colourimetric analysis. Anal. Chim. Acta 2021, 1151, 238101. [Google Scholar] [CrossRef] [PubMed]
- Ovadiuc, E.-P.; Calotă, R.; Năstase, I.; Bode, F. Integration of Phase-Change Materials in Ventilated Façades: A Review Regarding Fire Safety and Future Challenges. Fire 2024, 7, 244. [Google Scholar] [CrossRef]
- Firoozi, A.A. Smart facades in architecture: Driving energy efficiency and adaptive urban design. SSRN 2023. Available online: https://ssrn.com/abstract=4631796 (accessed on 26 December 2025).
- Attia, S.; Lioure, R.; Declaude, Q. Future trends and main concepts of adaptive facade systems. Energy Sci. Eng. 2020, 8, 3255–3272. [Google Scholar] [CrossRef]
- Calotă, R.; Pop, O.; Croitoru, C.; Bode, F.; Berville, C.; Ovadiuc, E. Performance analysis of solar collectors with nano-enhanced phase change materials during transitional periods between cold and warm seasons in the continental temperate climates. J. Energy Storage 2025, 114, 115659. [Google Scholar] [CrossRef]
- Calotă, R.; Bode, F.; Souliotis, M.; Croitoru, C.; Fokaides, P.A. Bridging the gap: Discrepancies in energy efficiency and smart readiness of buildings. Energy Rep. 2024, 12, 5886–5898. [Google Scholar] [CrossRef]
- Nadagouda, M.N.; Ginn, M.; Rastogi, V. A review of 3D printing techniques for environmental applications. Curr. Opin. Chem. Eng. 2020, 28, 173–178. [Google Scholar] [CrossRef]
- Roberson, D.A.; Espalin, D.; Wicker, R.B. 3D printer selection: A decision-making evaluation and ranking model. Virtual Phys. Prototyp. 2013, 8, 201–212. [Google Scholar] [CrossRef]
- Ma, Y.; Winsun, S. A brief introduction to 3D printing technology. In Proceedings of the GRC 2015, Radisson Blu, Dubai, 19–21 April 2015. [Google Scholar]
- Girip, A.; Calotă, R.; Savaniu, I.M.; Ilie, A.; Ovadiuc, E.; Tonciu, O. Mathematical Modeling and Energy Consumption Evaluation of R-600a Refrigeration Systems for Vending Machines Using Efficient Heat Exchangers. Results Eng. 2025, 26, 105208. [Google Scholar] [CrossRef]
- Maděra, J.; Kočí, V.; Dolezelová, M.; Cáchová, M.; Jerman, M.; Cerný, R. Influence of weather-affected material characteristics on appearance of freeze/thaw cycles in building envelopes. In AIP Conference Proceedings; American Institute of Physics Inc.: Melville, NY, USA, 2017; Volume 1866. [Google Scholar] [CrossRef]
- Beach, D. Environmental effects on polymeric materials. In Plastics and the Environment; John Wiley & Sons: Hoboken, NJ, USA, 2003; p. 313. [Google Scholar]
- Espinar, C.; Bona, A.D.; Pérez, M.M.; Pulgar, R. Color and optical properties of 3D printing restorative polymer-based materials: A scoping review. J. Esthet. Restor. Dent. 2022, 34, 853–864. [Google Scholar] [CrossRef]
- Yuan, J.; Tian, J.; Chen, C.; Chen, G. Experimental Investigation of Color Reproduction Quality of Color 3D Printing Based on Colored Layer Features. Molecules 2020, 25, 2909. [Google Scholar] [CrossRef]
- Stanic, M.; Lozo, B.; Gregor Svetec, D. Colorimetric properties and stability of 3D prints. Rapid Prototyp. J. 2012, 18, 120–128. [Google Scholar] [CrossRef]
- Ghasemi, S.; Mahboub, F.; Babaloo, A.; Zohdi, M.; Etemadpour, A.; Yasamineh, N. Evaluating the color stability of temporary crowns fabricated by 3-dimensional printing and manual methods. Gen. Dent. 2024, 72, 40–46. [Google Scholar] [PubMed]
- Arikawa, H.; Kanie, T.; Fujii, K.; Shinohara, N.; Takahashi, H.; Inoue, K. A Method for Evaluating Color Stability of Light-cured Composite Resins Using an Experimental Filter. Dent. Mater. J. 2000, 19, 338–345. [Google Scholar] [CrossRef] [PubMed]
- Poggio, C.; Vialba, L.; Berardengo, A.; Federico, R.; Colombo, M.; Beltrami, R.; Scribante, A. Color Stability of New Esthetic Restorative Materials: A Spectrophotometric Analysis. J. Funct. Biomater. 2017, 8, 26. [Google Scholar] [CrossRef]
- Năstase, G.; Şerban, A.; Dragomir, G.; Bolocan, S.; Brezeanu, A.I. Box window double skin façade. Steady state heat transfer model proposal for energetic audits. Energy Build. 2016, 112, 12–20. [Google Scholar] [CrossRef]
- Bulmez, A.M.; Dragomir, G.; Bolocan, S.I.; Brezeanu, A.I.; Fratu, M.; Iordan, N.F.; Gocz, N.; Calotă, R. Carbon Footprint Evaluation and Reduction Strategies for a Residential Building in Romania: A Case Study. Buildings 2025, 15, 938. [Google Scholar] [CrossRef]
- Năstase, G.; Doboși, I.S.; Brezeanu, A.I.; Taus, D.; Tăbăcaru, M.B.; Vuțoiu, B.G.; Rusu, D.; Bulmez, A.M.; Iordan, N.F. Experimental Heat Transfer, Sound Insulation and Interior Comfort Parameters Assessment on a Box Double-Skin Façade. Buildings 2022, 12, 730. [Google Scholar] [CrossRef]
- Bulmez, A.M.; Brezeanu, A.I.; Dragomir, G.; Fratu, M.; Iordan, N.F.; Bolocan, S.I.; Rozorea, L.; Popa, E.C.; Năstase, G. CFD Analysis for a New Trombe Wall Concept. Buildings 2024, 14, 579. [Google Scholar] [CrossRef]
- Bulmez, A.-M.; Brezeanu, A.-I.; Dragomir, G.; Talabă, O.-M.; Năstase, G. An Analysis of Romania’s Energy Strategy: Perspectives and Developments since 2020. Climate 2024, 12, 101. [Google Scholar] [CrossRef]
- Porter, L.A., Jr.; Washer, B.M.; Hakim, M.H.; Dallinger, R.F. User-Friendly 3D Printed Colorimeter Models for Student Exploration of Instrument Design and Performance. J. Chem. Educ. 2016, 93, 1305–1309. [Google Scholar] [CrossRef]
- Lehmann, K.M.; Igiel, C.; Schmidtmann, I.; Scheller, H. Four color-measuring devices compared with a spectrophotometric reference system. J. Color Appear. Dent. 2010, 38, e65–e70. [Google Scholar] [CrossRef]
- Hill, B.; Roger, T.; Vorhagen, F.W. Comparative analysis of the quantization of color spaces on the basis of the CIELAB color-difference formula. ACM Trans. Graph. TOG 1997, 16, 109–154. [Google Scholar] [CrossRef]
- CAL, E.; GÜNERI, P.; KOSE, T. Comparison of digital and spectrophotometric measurements of colour shade guides. J. Oral Rehabil. 2006, 33, 221–228. [Google Scholar] [CrossRef]
- ISO/CIE 11664-4; Colorimetry—Part 4: CIE 1976 Lab* colour space. ISO/CIE: Geneva, Switzerland, 2019.
- Kim, T.K. Understanding one-way ANOVA using conceptual figures. Korean J. Anesthesiol. 2017, 70, 22. [Google Scholar] [CrossRef]
- Ganesh, A.; Ankesh, M.; Reddy, P.V.; Goyal, G.; Thakur, M.S.; Jain, A. One-way analysis of variance (ANOVA). Vigyan Varta 2024, 5, 110–112. [Google Scholar]
- Abdi, H.; Williams, L.J. Tukey’s honestly significant difference (HSD) test. Encycl. Res. Des. 2010, 3, 1–5. [Google Scholar]
- Nanda, A.; Mohapatra, B.B.; Mahapatra, A.P.K.; Mahapatra, A.P.K.; Mahapatra, A.P.K. Multiple comparison test by Tukey’s honestly significant difference (HSD): Do the confident level control type I error. Int. J. Stat. Appl. Math. 2021, 6, 59–65. [Google Scholar] [CrossRef]
- Ekincioğlu, G. Non-destructive methods determination of thermal shock resistance of natural building stones applicated with different water repellent chemicals on their surfaces. Gospod. Surowcami Miner.-Miner. Resour. Manag. 2023, 39, 81–101. [Google Scholar]
Disclaimer/Publisher’s Note: The statements, opinions and data contained in all publications are solely those of the individual author(s) and contributor(s) and not of MDPI and/or the editor(s). MDPI and/or the editor(s) disclaim responsibility for any injury to people or property resulting from any ideas, methods, instructions or products referred to in the content. |
© 2026 by the authors. Licensee MDPI, Basel, Switzerland. This article is an open access article distributed under the terms and conditions of the Creative Commons Attribution (CC BY) license.