Abstract
This study prepares solid-waste-based alkali-activated material (AAM) concrete using ground granulated blast furnace slag (GGBFS), fly ash (FA), steel slag (SS), and desulfurized gypsum (DG) as primary raw materials, with Na2SiO3 as the activator. Taking the GGBFS content (X1), Na2SiO3 content (X2), and water-to-binder ratio (X3) as independent variables and the 3-day, 7-day, and 28-day compressive strengths and slump as response values, it investigates the influence of each factor and their interactions, constructs a response surface prediction model, screens for the optimal mix proportion with comprehensive performance, and explores the microstructural characterization and strength formation mechanism of the AAM concrete via SEM and EDS. The results indicate the following: (1) compared with binary and ternary mixtures, the use of the quaternary solid waste mixture not only enhances strength and optimizes the microstructure but also increases the utilization rate of low-quality solid wastes; (2) the regression coefficients (R2) of the response surface models are all greater than 0.98, exhibiting good goodness of fit and rationality. Experimental validation confirms that each model shows excellent predictive capability; (3) AAM concrete exhibits comprehensively superior mechanical properties to ordinary cement, with leading early- and late-stage compressive strengths and splitting strengths, albeit with a slightly lower slump; (4) the performance synergy is prominent. Combined with microscopic analysis (highly polymerized C-S-H gels and a dense structure), the superiority of its macroscopic mechanical properties stems from the optimization of the microstructure, reflecting the intrinsic correlation of the “microscopic densification-macroscopic high strength.
1. Introduction
Against the backdrop of the global construction industry facing strict constraints from “dual-carbon” targets, the high energy consumption and carbon emissions inherent to traditional cement concrete production have emerged as critical bottlenecks hindering the industry’s sustainable development. As the predominant cementitious material in concrete, cement accounts for up to 90% of the total carbon emissions from concrete raw materials [1,2,3,4]. Therefore, exploring alternatives to cement and reducing its dosage in concrete represent pivotal strategies for achieving green and low-carbon development in the concrete sector. The substitution of cement with solid waste-derived AAM in concrete production not only yields economic benefits but also promotes the circular utilization of solid waste, with multiple positive implications for environmental protection and sustainable resource management.
AAM, a novel aluminosilicate cementitious material, primarily utilizes industrial solid wastes rich in silica and alumina (e.g., slag, fly ash) as raw materials [5], replacing traditional Portland cement through synergistic hydration with alkaline activators or alkaline solid wastes. Alkali-activated materials demonstrate excellent performance comparable to ordinary cement, even outperforming cement in specific aspects. For instance, AAMs feature higher early-strength development rates, superior sulfate resistance [6], reduced reinforcement corrosion in prestressed concrete [7,8,9,10], and notable high-temperature stability [11]. These advantages endow them with promising application prospects in fields such as repair/strengthening materials [12] and resistance to chemical media erosion [13]. Existing studies have clarified the functional contributions of different solid waste precursors: GGBFS and steel slag serve as calcium-rich sources to provide Ca2+ for gel formation [14,15], fly ash supplies abundant SiO2 and Al2O3 to promote the polymerization of aluminosilicate networks [16,17], and desulfurized gypsum offers SO42− to induce ettringite (AFt) formation [18]. These precursors are expected to synergistically generate composite gel systems dominated by C-S-H, C-(A)-S-H, and AFt, which have been proven to enhance concrete durability, such as sulfate resistance and volume stability [8,19]. However, current research predominantly focuses on binary or ternary systems with high-reactivity solid wastes (e.g., GGBFS), resulting in the limited utilization of low-grade wastes like steel slag and desulfurized gypsum [20,21,22], and the complex synergistic mechanisms between multiple precursors and their interactive effects on gel formation remain insufficiently explored [23,24,25]. This study thus aims to construct a quaternary solid waste system integrating GGBFS, fly ash, steel slag, and desulfurized gypsum, to maximize the resource utilization of low-quality solid wastes while optimizing the mechanical properties and microstructure of AAC.
Therefore, this study employs GGBFS as the primary raw material, with FA, SS, and DG as auxiliary components, and Na2SiO3 as the alkali activator to prepare a quaternary solid waste cementitious system, which replaces cement in the fabrication of slag-based AAM concrete. Initially, mortar tests were conducted to evaluate the effects of the GGBFS content and Na2SiO3 dosage on compressive strength within a slag–fly ash binary solid waste system. Subsequently, steel slag and desulphurized gypsum were introduced to replace fly ash, aiming to determine the rational mix proportion of the quaternary system and enhance the utilization efficiency of low-grade solid wastes. Furthermore, response surface methodology (RSM) was adopted, with the GGBFS content, Na2SiO3 dosage, and water-to-binder ratio (W/B) as independent variables and the 3 d/7 d/28 d compressive strengths and slump as response values. A predictive model was constructed to analyze the influencing mechanisms of individual factors and their interactive effects on mechanical properties and workability. The optimal mix design was derived through model optimization. Finally, combined SEM and EDS analyses were performed to characterize the microstructural features and strength-formation mechanisms, providing critical insights for the application of multi-component solid wastes in concrete engineering.
2. Experiment
2.1. Raw Materials
The S105-grade ground granulated blast furnace slag (GGBFS), fly ash (FA), steel slag (SS), and flue gas desulfurization gypsum (DG) used in this experiment were procured from Jiewei Environmental Protection Materials Co., Ltd. located in Zhengzhou, Henan Province, China. The specific chemical compositions of the above four raw materials are shown in Table 1. The appearance images and XRD patterns of the raw materials are shown in Figure 1. The main chemical compositions, determined via X-ray fluorescence (XRF) analyses, are SiO2 and Al2O3, with the primary components being CaO, SiO2, and Al2O3.

Table 1.
Chemical compositions of raw materials.
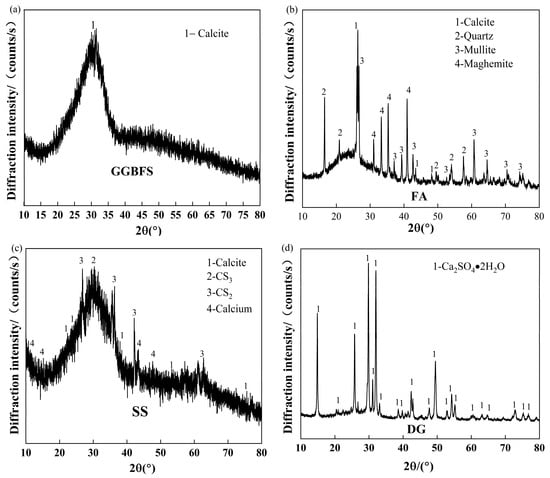
Figure 1.
Appearance images and XRD pattern of raw material:(a) GGBFS; (b) FA; (c) SS; (d) DG.
2.1.1. Alkali Activators
Sodium hydroxide (NaOH): Commercially available with a purity of 95%, in the form of white flaky solid, free of caking and impurities.
Sodium silicate (Na2SiO3) solution: Industrial-grade commercial product with an initial modulus of 3.3 (molar ratio of Na2O to SiO2) and a mass fraction of 30% (moisture content of 70%). The density at 20 °C is 1.35 g/cm3, and the solid phase fraction is 32%.
Preparation process: Weigh 300 g of industrial-grade Na2SiO3 solid (initial modulus 3.3) and add 700 g of distilled water. Stir at room temperature on a magnetic stirrer for 30 min until completely dissolved to form a uniform and transparent solution. According to the modulus calculation formula M = n(Na2O)/n(SiO2), the required amount of NaOH was calculated—28 g of 95% NaOH per 1 L of 30% Na2SiO3 solution. Slowly add the NaOH solid to the Na2SiO3 solution, stir continuously for 20 min to avoid local overheating, cool to room temperature (20 ± 2 °C), and stand for 12 h to ensure the modulus stabilizes at 1.2 ± 0.05.
2.1.2. Fine Aggregate (Sand for Mortar and Concrete)
Natural river sand was used, clean and free of impurities, shells, and other organic substances. The particle size range is 0.15–5.0 mm with continuous gradation. The cumulative sieve residue values are as follows: 0% for the 4.75 mm sieve, 15% for the 2.36 mm sieve, 35% for the 1.18 mm sieve, 65% for the 0.60 mm sieve, 88% for the 0.30 mm sieve, and 98% for the 0.15 mm sieve. The fineness modulus is 2.7 (medium sand), meeting the requirements of cement mortar and concrete tests.
2.1.3. Coarse Aggregate (Crushed Stone for Concrete)
Natural granite crushed stone with an approximately cubic particle shape was adopted, with a continuous particle size range of 5–20 mm. The gradation ratio (mass ratio) of 5–10 mm:10–16 mm:16–20 mm is 5:2:1, designed to ensure the compactness of concrete.
2.2. Experimental Methods
- (1)
- Mortar Test
The mortar compressive strength test was performed using the GB/T 17671-2021 Test Method for Compressive Strength of Cement Mortar (ISO Method) [26]. Mortar specimens (40 × 40 × 160 mm) were prepared with a water-to-binder ratio of 0.5 and a binder-to-sand ratio of 1:3.
- (2)
- Concrete Test
Using slag, fly ash, steel slag, and desulfurized gypsum as raw materials (with Na2SiO3 as the activator), the GGBFS, fly ash, steel slag, and desulfurized gypsum were first homogenized in a concrete mixer. At the specified water-to-binder ratio, the activator was incorporated into the dry mixture and stirred until a homogeneous slurry formed, followed by casting, molding, demolding, and curing. Concrete compressive strength tests were conducted per GB/T 50081-2002 Standard Test Methods for Physical and Mechanical Properties of Ordinary Concrete [27].
Demolding standard: Cubic specimens (100 mm edge length) were demolded after 24 h of indoor curing. The compressive strength of the specimens at demolding was required to be ≥5 MPa to avoid damage caused by early demolding.
Standard curing conditions: After demolding, the specimens were immediately transferred to a constant temperature and humidity curing chamber, with the temperature controlled at 20 ± 2 °C and relative humidity ≥ 95% (monitored in real-time by a humidity sensor with an error ≤ ±1%). The specimens were placed on a perforated steel frame, with a spacing of ≥10 mm between specimens and a distance of ≥50 mm from the bottom of the curing chamber to avoid contact with the chamber wall.
Mixing process: The raw materials include GGBFS, FA, SS, DG, Na2SiO3 (activator), gravel, AAC cementitious material, and water. The specific steps are as follows: (1) cool the prepared Na2SiO3 solution to room temperature (20 ± 2 °C) in advance; (2) add the dry aggregates (sand and gravel) and AAC cementitious material into the concrete mixer and mix for 5 min; (3) slowly add the cooled Na2SiO3 solution while stirring continuously, and mix for another 5 min to form a uniform AAC concrete slurry; (4) proceed with casting, molding, demolding, and curing as specified, followed by standard strength tests at 3 d, 7 d, and 28 d.
2.3. Analysis and Testing
A Sigma 300 thermal field emission scanning electron microscope (SEM, Carl Zeiss, Oberkochen, Germany) with a maximum resolution of 1.0 nm was employed for the microscopic characterization of the cementitious matrix in AAM concrete. Elemental analysis was conducted using an Octance Plus X-ray energy dispersive spectrometer (EDS, EDAX, Mahawa, NJ, USA). Samples were gold-suspended prior to SEM imaging to enhance conductivity. Following mechanical property tests, selected fracture surface fragments from specimens were subjected to EDS analysis to investigate microscale elemental ratios of AAM concrete under different mix proportions.
3. Experimental Design
3.1. Response Factor Parameter Experimental Design
The calcium-rich phases in slag provide the essential material basis for the formation of high-strength AAMs. Thus, this study employs GGBFS as the primary raw material and incorporates fly ash, steel slag, and desulphurized gypsum as auxiliary components to fabricate a quaternary solid waste cementitious system. The active constituents in these solid waste materials primarily rely on activation induced by alkaline reagents, with studies demonstrating that a Na2SiO3 solution of modulus 1.2 yields optimal activation efficiency [28].
Mortar tests were conducted to determine the rational proportioning range of the quaternary solid waste system and inform the subsequent response surface experimental design. The tests were executed with a fixed water-to-binder ratio of 0.5, binder-to-sand ratio of 1:3, and Na2SiO3 modulus of 1.2. Groups A, B, and C tests were sequentially performed: Group A investigated the effects of the GGBFS content (50–90%) and Na2SiO3 dosage (6–10%) on compressive strength; Groups B and C evaluated the influence of steel slag and desulphurized gypsum contents, respectively. Building upon Group A results, steel slag and desulphurized gypsum were used to substitute part of the fly ash to explore the feasibility of synthesizing cementitious materials from quaternary solid wastes. Detailed mix proportions and findings are tabulated in Table 2.
Table 2.
Test mix proportion.
3.1.1. Test Analysis
As illustrated in Figure 2a,b, the strength of the AAM cementitious matrix in Group A is primarily attributed to the hydration reaction between GGBFS and Na2SiO3. Excessively low contents of GGBFS and Na2SiO3 lead to a pronounced strength decline, with poor performance observed at 50% GGBFS and 6% Na2SiO3.
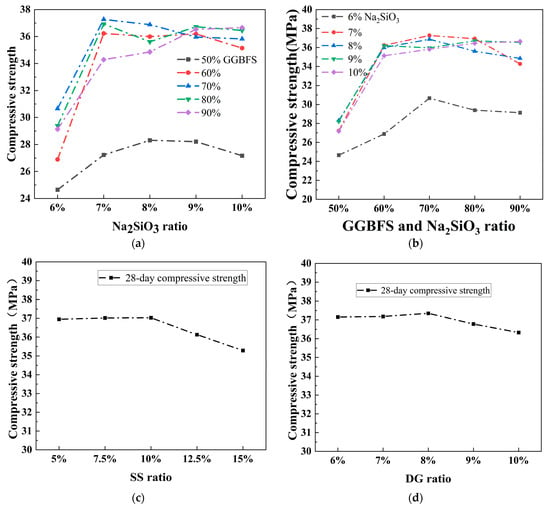
Figure 2.
Dot-line plots of concrete 28-day compressive strength with different mix parameters: (a) Na2SiO3 Content; (b) GGBFS Replacement Ratio; (c) SS Replacement Ratio; (d) DG Replacement Ratio.
An analysis of Figure 2a reveals the following: (1) at a fixed GGBFS content of 60%, increasing the Na2SiO3 dosage from 7% to 9% results in a strength plateau. (2) With GGBFS fixed at 70%, strength first increases, then decreases with the Na2SiO3 dosage, peaking at 7%. (3) At 80% GGBFS, the strength curve exhibits a bimodal phenomenon, with comparable peaks at 7% and 9% Na2SiO3. (4) At 90% GGBFS, strength increases steadily with Na2SiO3, showing a linear trend at 9–10%.
Figure 2b demonstrates the following: (1) for fixed Na2SiO3 dosages of 7% and 8%, strength peaks at 70% GGBFS in a gentle parabolic curve, followed by a decline. (2) At 9% Na2SiO3, strength displays bimodal peaks at 60% and 80% GGBFS with similar values. (3) At 10% Na2SiO3, strength increases rapidly initially, then plateaus, rising by <6% as GGBFS increases from 60% to 90%.
Overall, GGBFS and Na2SiO3 exhibit bidirectional effects, with optimal ranges of 60–80% and 7–9%, respectively. To maximize low-grade solid waste utilization, the mix with 60% GGBFS and 8% Na2SiO3 was selected for subsequent testing.
As shown in Figure 2c, SS contents of 5–10% result in slightly higher 28-day compressive strengths than Group A, indicating that the alkaline constituents in steel slag exert a specific activating effect on the slag–fly ash system hydration [29]. However, due to steel slag’s low reactivity, excessive addition dilutes cementitious components, causing strength degradation. The optimal steel slag content was determined as 10% to balance resource utilization and the AAM strength.
Figure 2d shows that increasing the DG content from 6% to 10% leads to a strength trend of an initial increase followed by a decrease. Desulphurized gypsum provides a sulfate environment where SO42− reacts with free Ca2+ and Al2O42− to form ettringite, enhancing early-age strength. However, ettringite’s micro-expansibility induces excessive internal porosity and potential expansion cracking at high DG dosages [30]. The optimal DG content was identified as 8%.
AAM matrix tests confirmed 10% SS and 8% DG as optimal. By contrast, GGBFS–Na2SiO3 interactions proved complex, with single-factor effects difficult to isolate. Optimal ranges of 60–80% GGBFS and 7–9% Na2SiO3 were established, providing critical data for subsequent AAM–concrete substitution studies.
3.1.2. Microstructural Analysis of Cementitious Materials
- (1)
- Na2SiO3-activated GGBFS–fly ash system
As shown in Figure 3a, the core hydration products of the Na2SiO3-activated binary system are C-S-H gels and C-A-S-H gels. In an alkaline environment, GGBFS releases Ca2+ and Al3+, which react with the OH− and SiO32− generated by the hydrolysis of Na2SiO3 to form fibrous and plate-like C-S-H gels. Fly ash contributes to the development of later strength by generating C-A-S-H gels, which exhibit a dense layered structure supplemented by some flaky Ca(OH)2. SEM observations reveal that the hydration products uniformly cover the surfaces of GGBFS and fly ash particles, forming an interwoven three-dimensional network with low porosity [1].
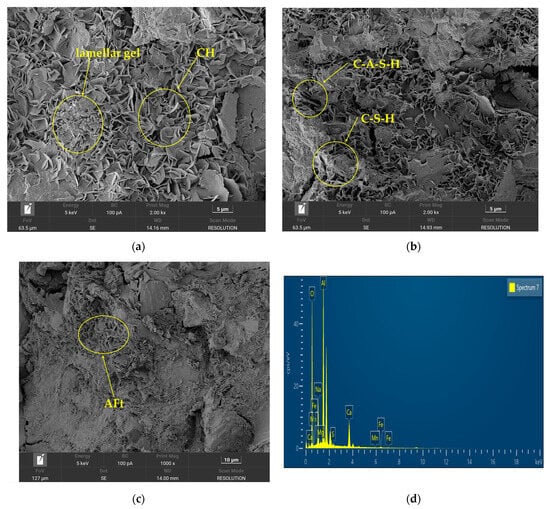
Figure 3.
SEM micrographs and EDS spectrum of composite systems: (a) Cement-Based Binary Composite System Microstructure (28 Days, SEM Image); (b) Ternary Composite System Microstructure (28 Days, SEM Image); (c) Quaternary Composite System Microstructure (28 Days, SEM Image); (d) EDS Elemental Spectrum of Quaternary Composite System.
- (2)
- Na2SiO3-activated slag–fly ash–steel slag system
As shown in Figure 3b, the incorporation of steel slag induces significant changes: the content of C-S-H gels increases; CaO and Fe2O3 in steel slag provide additional Ca2+ and Fe2+, promoting the dissolution of slag and fly ash and generating more C-S-H gels. Additionally, Fe elements may participate in the formation of Fe-C-S-H gels, which exhibit a denser structure and darker color compared to ordinary C-S-H. Meanwhile, based on the morphological characteristics of the hydration products (dense layered structure) and the compositional property of the ternary system (fly ash is rich in Al2O3), some hydration products are identified as “C-(A)-S-H-like gels”. It should be noted that relying solely on the morphological characterization of scanning electron microscopy (SEM) cannot fully and accurately distinguish between C-S-H gels and C-(A)-S-H gels. The above identification is a reasonable inference combined with the composition characteristics of the system and relevant research conclusions on similar alkali-activated systems [16,28]. Its precise phase composition still needs to be further verified using more accurate characterization technologies, such as X-ray photoelectron spectroscopy (XPS) and nuclear magnetic resonance (NMR). SEM observations reveal that the hydration products include both fibrous C-S-H and C-(A)-S-H-like gels and acicular hydrated garnet, with the overall structure becoming more compact due to the filling of Fe-C-S-H gels [28].
- (3)
- Na2SiO3-activated slag-fly ash-steel slag-desulfurized gypsum system
As shown in Figure 3c, the addition of desulfurized gypsum leads to notable changes: SO42− provided by desulfurized gypsum reacts with Al3+ and Ca2+ in the system to form acicular AFt crystals, which fill the pores, improving structural compactness and significantly enhancing early strength. Concurrently, the presence of SO42− inhibits the coarsening of C-S-H, making them appear as finer granular or short fibrous particles with a more uniform distribution. Ca2+ provided by steel slag accelerates AFt formation. At the same time, based on the uniform distribution of Fe elements (from steel slag) and elements (from desulfurized gypsum) in the interfacial region (Figure 3d), and the SEM observation that acicular AFt crystals are closely intertwined with C-S-H gels, it is speculated that Fe elements may promote the interfacial bonding between C-S-H and AFt, leading to a more compact composite structure. This speculation is based on the correlation between the elemental distribution and microtopography, and the specific interaction mechanism requires further verification using phase analysis techniques. SEM images show that acicular AFt and fine C-S-H gels are interwoven throughout the system, with pores effectively filled, leading to a significant improvement in structural compactness [23].
Microstructural analyses of binary, ternary, and quaternary cementitious systems reveal that steel slag facilitates gel formation and modifies its composition through the provision of Ca2+ and Fe elements. At the same time, the resulting hydration products reinforce the skeletal structure. Desulfurized gypsum induces the formation of AFt crystals via SO42−, refines the gel morphology, significantly enhances the early-age strength and density, and improves the overall structural compactness. The synergistic interaction between steel slag and desulfurized gypsum establishes a multiphase reaction network involving Ca2+, Fe2+, SO42−, and Al3+, optimizing the spatial distribution of reaction products and interfacial bonding. Compared with binary and ternary blends, the quaternary solid waste mixture not only enhances the mechanical performance and refines the microstructure but also elevates the utilization efficiency of low-quality industrial by-products [20,21].
3.2. Experimental Design of Response Surface Methodology (RSM) for Concrete
Based on the test results of AAM cementitious materials, the optimal ranges for GGBFS and Na2SiO3 contents were determined. However, due to the intricate interactions between these factors, they were adopted as influencing variables in AAM concrete tests, with the water-to-binder ratio (W/B) also included.
To explore the influencing mechanisms of the GGBFS dosage, Na2SiO3 dosage, and W/B on the AAM concrete strength, a three-factor, four-level central composite design (CCD) was employed for response surface methodology (RSM) experiments. The response values included the 3 d/7 d/28 d compressive strengths and slump of specimens. Design-Expert software (Version 13) was utilized for factor coding and statistical analysis. The RSM factor coding and levels are detailed in Table 3, with experimental designs listed in Table 4. Steel slag and desulphurized gypsum were incorporated at 10% and 8%, respectively, with fly ash added to balance the total binder mass.
Table 3.
Coding and levels of experimental factors.
Table 4.
Response surface experimental design and results.
4. Results and Analysis of RSM Tests
4.1. Development and Rationality Analysis of the Regression Model
Design-Expert software was utilized to process the experimental data in Table 4. Nonlinear fitting of various models identified the quadratic model as optimal, leading to the establishment of quadratic regression models describing the relationships among the GGBFS content (X1), Na2SiO3 dosage (X2), W/B (X3), and 3 d (Y1)/7 d (Y2)/28 d (Y3) compressive strengths as well as slump (Y4). The regression equations are provided in Equations (1)–(3):
Y1 = 20.22 − 0.0363X1 + 2.01X2 − 0.0325X3 + 0.3900X1X2 − 0.0425X1X3 +
0.0125X2X3 + 0.0780X12 − 2.51X22 − 0.4395X32
0.0125X2X3 + 0.0780X12 − 2.51X22 − 0.4395X32
Y2 = 29.62 − 0.3762X1 + 4.06X2 − 0.0875X3 + 0.3000X1X2 − 0.0575X1X3 +
0.2975X2X3 + 0.2105X12 − 4.62X22 − 0.3920X32
0.2975X2X3 + 0.2105X12 − 4.62X22 − 0.3920X32
Y3 = 39.95 + 0.3287X1 + 6.16X2 − 0.0612X3 − 0.3700X1X2 + 0.5425X2X3 +
0.2175X1X2 − 0.4695X12 − 7.80X22 − 0.4895X32
0.2175X1X2 − 0.4695X12 − 7.80X22 − 0.4895X32
Y4 = 211.40 + 1.38X1 + 2.63X2 + 20.00X3 − 0.2500X1X2 − 2.5X1X3 − 4.00X2X3 −
12.82X12 − 10.83X22 − 3.08X32
12.82X12 − 10.83X22 − 3.08X32
The model’s overall significance was evaluated via p-value testing. As tabulated in Table 5, all p-values for the models corresponding to Y1, Y2, Y3, and Y4 are <0.0001, confirming the statistical significance of the response surface models. The lack of fit p-values (0.2039, 0.2128, 0.1071, 0.4698) all exceed 0.0001, indicating a non-significant lack of fit. Collectively, these results demonstrate excellent model goodness-of-fit, justifying the use of regression models to analyze and predict experimental outcomes in place of actual data points.
Table 5.
Regression model statistics.
4.2. Analysis of Model Fit
The coefficient of determination (R2) for Y1, Y2, Y3, and Y4 all exceed 98%, demonstrating excellent goodness-of-fit for the regression models (Equations (1)–(4)), which aligns with the p-value analysis. Adequacy precision values for Y1, Y2, Y3, and Y4 (60.86, 21.19, 33.34, 30.01) all exceed 4, confirming the models’ ability to reproduce experimental scenarios faithfully. Scatter plots were constructed with model predictions as the abscissa and experimental response values as the ordinate (Figure 4a–d). Data points across all ages exhibit near-linear distributions clustered around y = x, indicating strong agreement between predicted and measured values. Collectively, these results validate the models’ predictive accuracy and justify their application in AAM concrete analysis. As illustrated in the normal plots of residuals for 3-day, 7-day, and 28-day compressive strengths and slump (Figure 5), the experimental data points are uniformly distributed on both sides of the reference line, indicating minimal residual deviations and high data reliability.
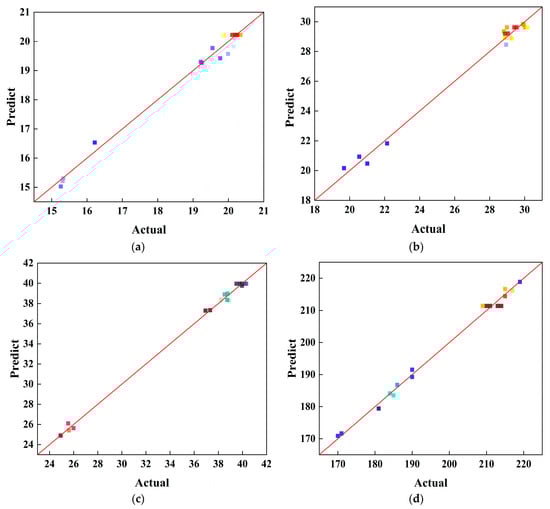
Figure 4.
Scatter plots of Y1, Y2, and Y3: (a) 3-day; (b) 7-day; (c) 28-day; (d) Slump.
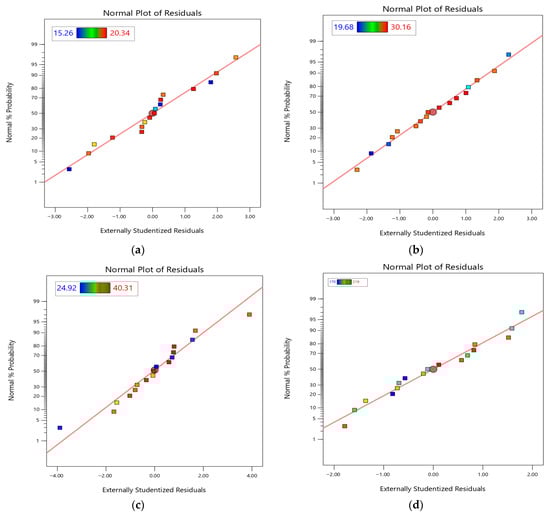
Figure 5.
Normal plot of residuals of Y1, Y2, and Y3: (a) 3-day; (b) 7-day; (c) 28-day; (d) Slump.
4.3. Effects of Various Factors and Their Interaction Terms on Response Values
4.3.1. Compressive Strength
Response surface plots were generated based on the regression model to analyze the effects of various factors and their interactions on the compressive strength of AAM concrete at 3 d, 7 d, and 28 d curing ages, as depicted in Figure 6, Figure 7 and Figure 8.
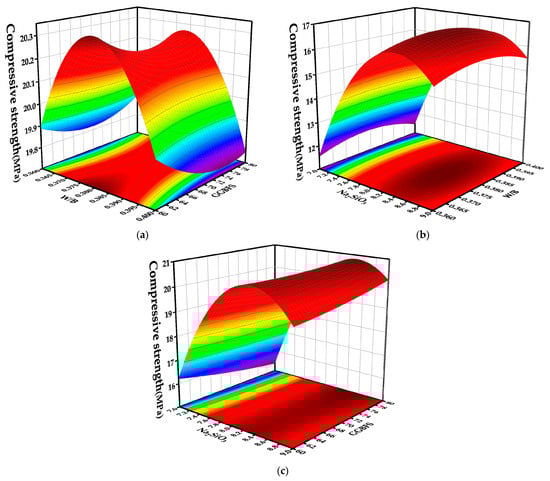
Figure 6.
Three-day compressive strength response surface plot: (a) 3D Response Surface of Concrete 3-day Compressive Strength as a Function of Water-to-Binder Ratio and GGBFS Content; (b) 3D Response Surface of Concrete 3-day Compressive Strength as a Function of Sodium Silicate Content and Water-to-Binder Ratio; (c) 3D Response Surface of Concrete 3-day Compressive Strength as a Function of Sodium Silicate and GGBFS Content.
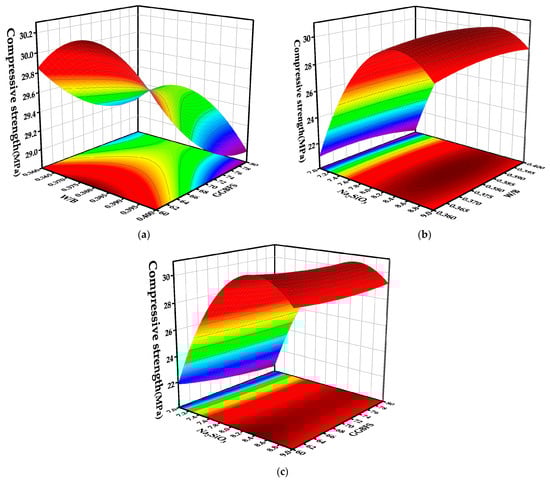
Figure 7.
Seven-day compressive strength response surface plot: (a) 3D Response Surface of Concrete 7-day Compressive Strength as a Function of Water-to-Binder Ratio and GGBFS Content; (b) 3D Response Surface of Concrete 7-day Compressive Strength as a Function of Sodium Silicate Content and Water-to-Binder Ratio; (c) 3D Response Surface of Concrete 7-day Compressive Strength as a Function of Sodium Silicate and GGBFS Content.
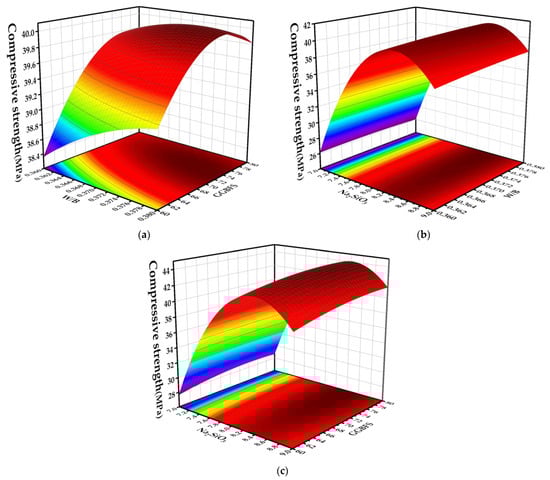
Figure 8.
Twenty-eight-day compressive strength response surface plot: (a) 3D Response Surface of Concrete 28-day Compressive Strength as a Function of Water-to-Binder Ratio and GGBFS Content; (b) 3D Response Surface of Concrete 28-day Compressive Strength as a Function of Sodium Silicate Content and Water-to-Binder Ratio; (c) 3D Response Surface of Concrete 28-day Compressive Strength as a Function of Sodium Silicate and GGBFS Content.
Data in Table 5, Table 6 and Table 7 indicate that the influence hierarchy for 3 d compressive strength is X2 > X22 > X32 > X1X2, with X2, X22, X32, and X1X2 exhibiting statistically significant effects (other terms were non-significant). X2 and X3 showed positive correlations with the 3 d strength, while X1 exhibited a trend of increasing then decreasing, peaking at X1 = 70%.
Table 6.
ANOVA results of the regression model.
Table 7.
Response model validation.
For 7 d/28 d strengths, the hierarchy was simplified to X2 > X22, with only these terms showing statistical significance. Compared to 3 d results, p-values for X32 and X1X2 rose above 0.01 (reduced significance), while X1 trended toward significance (p = 0.0662).
Figure 6b, Figure 7b and Figure 8b reveal a parabolic trend in the effect of W/B on strength: low W/B caused insufficient hydration. At the same time, high W/B diluted the binder phase, both reducing the number of hydration products and matrix density. The optimal W/B ratio was identified as ~0.38 from the response surfaces.
As shown in Figure 6b, Figure 7b and Figure 8b, the 3 d/7 d/28 d strengths peaked at 20.34 MPa, 30.16 MPa, and 40.31 MPa with 8% Na2SiO3, following a rise-then-fall pattern. This is attributed to Na2SiO3’s alkaline environment catalyzing the depolymerization–polymerization of [SiO4]4−/[AlO4]5− tetrahedra and promoting C-S-H gel formation via GGBFS activation [31]. Weak alkalinity only deconstructs fly ash’s aluminate tetrahedra, leaving slag’s silicate networks intact and inhibiting activity release [32]. Excessive alkalinity causes surface sealing, an ion imbalance, and competitive side reactions, enabling rapid early strength gain but stagnant late-stage development [33].
4.3.2. Slump
Response surface plots were generated from the regression model to analyze the effects of various factors and their interactions on the slump of AAM paste, as illustrated in Figure 9. Slump serves as a critical indicator for evaluating the engineering applicability of AAM concrete. As tabulated in Table 6, the influence hierarchy for the slump is X3 > X12 > X22 > X2X3 > X2 > X32 > X1X2, with X3, X12, and X22 exhibiting highly significant effects. X2X3, X2, X32, and X1X2 show significant influences, while other terms are non-significant. X2 demonstrates a cloak-shaped correlation with the slump, peaking at X2 = 8%, whereas X3 and X1 exhibit positive linear relationships.
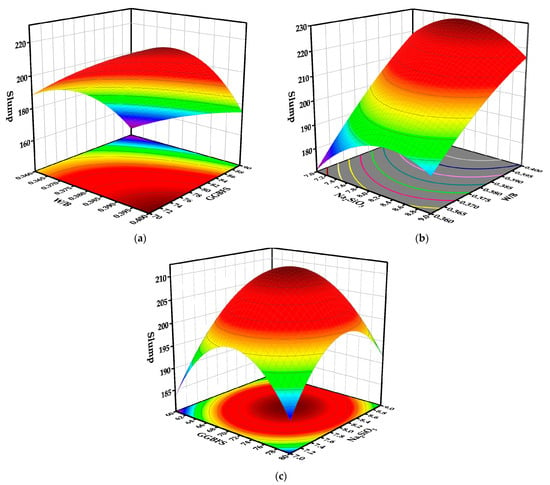
Figure 9.
Slump response surface diagram: (a) 3D Surface Plot of Water-to-Binder Ratio (W/B) and GGBFS Content Effects on Concrete Slump; (b) 3D Surface Plot of Sodium Silicate (Na2SiO3) and Water-to-Binder Ratio (W/B) Effects on Concrete Slump; (c) 3D Surface Plot of Sodium Silicate (Na2SiO3) and GGBFS Effects on Concrete Slump.
Figure 9a shows that the slump first increases and then decreases with the Na2SiO3 dosage, optimizing at 8%. Increasing the dosage to 9% reduces the slump by ~10 mm due to excessive alkalinity, accelerating AAM hydration, and causing paste gelling [34]. The alkaline environment from Na2SiO3 promotes the depolymerization of [SiO4]4−/[AlO4]5− tetrahedra during mixing, enhancing fluidity initially, but excessive alkalinity triggers rapid setting.
The GGBFS content variations (60–80%) in Figure 9a show slump peaks at 70% GGBFS. Higher GGBFS activity and finer particle size enhance reactivity, but excessive GGBFS accelerates hydration, causing slump loss after equilibrium.
4.4. Response Surface Optimization Validation
Response value optimization was accomplished through a comprehensive analysis integrating ANOVA, response surface model validation, and model prediction with residual plots. Guided by the effects of the Na2SiO3 dosage, water-to-binder ratio (W/B), and GGBFS content on the concrete strength and slump, the optimal mix proportion was determined to maximize synergistic hydration within the AAM cementitious matrix. Using Design-Expert software, response surface modeling generated 100 sets of simulated experimental data, yielding the optimal response values (Table 8). Validation results (Table 9) demonstrated 3 d/7 d/28 d strength errors of +4.27%, +3.15%, and +3.64% and a slump error of −3.37%. With prediction–actual errors all below 5% under the optimized mix, the response surface methodology (RSM) accurately predicts AAM concrete proportions, confirming the model’s high precision. As supported by data from Table 9, Table 10, Table 11 and Table 12, alkali-activated composite (AAC) concrete offers significant advantages over ordinary Portland cement (OPC P.O42.5) concrete across multiple key performance dimensions, with clear synergies between its material properties and practical applicability.
Table 8.
Optimized mix design ratios for alkali-activated slag-fly ash AAM concrete via response surface methodology.
Table 9.
Model reliability analysis.
Table 10.
Setting time comparison.
Table 11.
Performance retention capability comparison.
Table 12.
Separation and rapid hardening.
First and foremost, mechanical performance stands out: at the same water-binder ratio, AAC concrete exhibits superior 3-day, 7-day, and 28-day compressive strengths compared to OPC, with respective increases of 10.6%, 3.6%, and 10.9%. This core strength advantage originates from its optimized microstructure—highly polymerized gels interweaved with AFt crystals form a dense internal structure, which directly translates to enhanced macroscopic mechanical properties.
In terms of workability, while AAC concrete has a slightly lower slump than OPC, it compensates with excellent cohesion and stable slump loss over time. This characteristic ensures it meets the requirements of conventional engineering applications, particularly those with moderate flowability demands.
Regarding setting characteristics, AAC concrete achieves rapid initial and final setting, accompanied by strong early load-bearing capacity. This makes it exceptionally suitable for time-sensitive scenarios such as emergency repairs and precast component production, where quick formwork removal and early structural stability are critical.
For durability, AAC concrete outperforms OPC with superior water resistance, chemical corrosion resistance, and volume stability. A key contributing factor is the absence of free Ca(OH)2—a weak phase in OPC that is prone to degradation—further reinforcing its long-term structural reliability in harsh environments.
Furthermore, AAC concrete enables the efficient utilization of low-grade industrial solid wastes (e.g., ground granulated blast furnace slag, steel slag, fly ash, and desulfurized gypsum), integrating environmental sustainability with engineering value. Collectively, these attributes make it an ideal choice for high-strength projects, harsh-environment applications, and time-sensitive constructions.
4.5. Microstructural Analysis of AAM Concrete
As shown in Figure 10 and Figure 11, the SEM images and EDS spectra of the R sample at 3 d, 7 d, 14 d, and 28 d reveal the following:
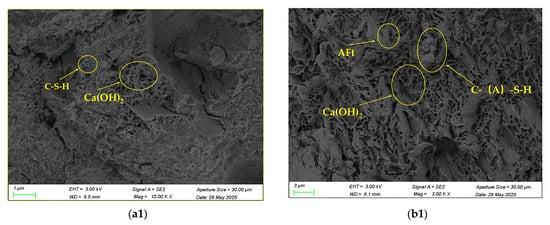
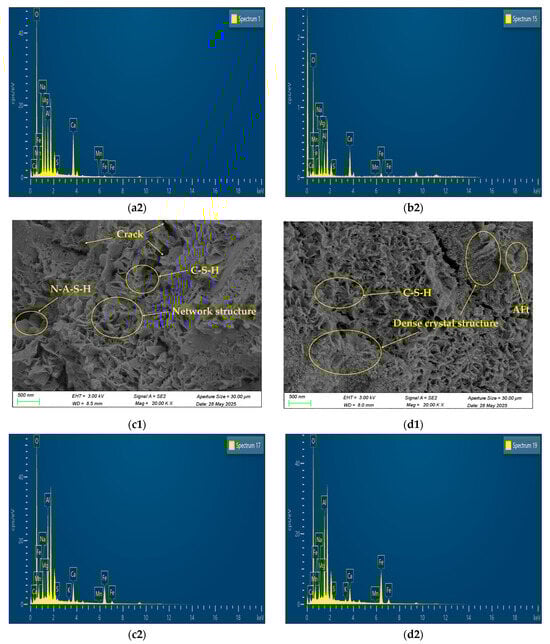
Figure 10.
SEM images and EDS analysis spectra at 3 days, 7 days, 14 days, and 28 days: (a1) 3-day micrograph; (a2) 3-day EDS Spectrum; (b1) 7-day micrograph; (b2) 7-day EDS Spectrum; (c1) 14-day micrograph; (c2) 14-day EDS Spectrum; (d1) 28-day micrograph; (d2) 28-day EDS Spectrum.
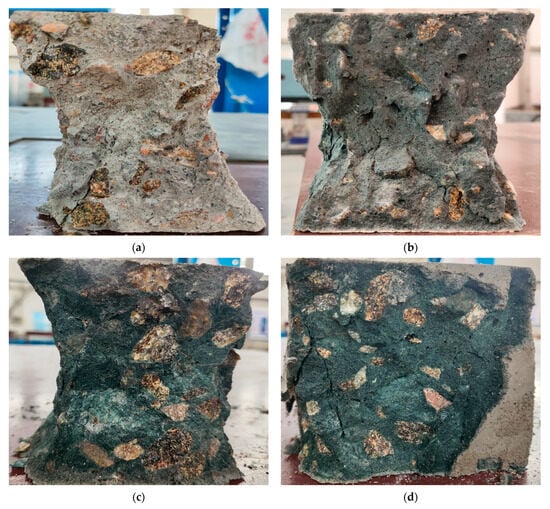
Figure 11.
Concrete surface damage pattern: (a) 3-day; (b) 7-day; (c) 14-day; (d) 28-day.
SEM analysis shows that the 3 d sample (Figure 10(a1)) exhibits lamellar Ca(OH)2 crystals and a flocculent C-S-H gel. In the early hydration stage, only a small amount of C-S-H gel adheres to Ca(OH)2 crystals, forming a dispersed structure with numerous voids and cracks, and failure to establish a continuous network. The 7 d sample (Figure 10(b1)) features plate-like Ca(OH)2 crystals, a flocculent C-S-H gel, and minor AFt crystals. The C-S-H gel content increases significantly compared to the 3 d group, with reduced voids/cracks and a honeycomb morphology. The 14 d sample (Figure 10(c1)) shows similar hydration products but a denser C-S-H gel and fewer defects. The 28-day specimen (Figure 10(d1)) presents a dense gel-like matrix with uniformly dispersed acicular crystals. EDS analysis confirms that the acicular crystals are enriched in Ca, S, and Al elements—consistent with the elemental signature of ettringite (AFt)—while the gel-like matrix is predominated by Ca, Si, and Al elements, which aligns with the elemental composition of C-S-H/C-(A)-S-H gels. Combined with the characteristic morphologies of the two components, they are tentatively assigned as C-S-H gel and AFt crystals; however, the definitive phase composition requires confirmation via X-ray diffraction (XRD) analysis.
EDS analysis indicates that Li et al. [35] noted that when the Ca/Si ratio exceeds 1.5, a large amount of Ca(OH)2 crystals and small amounts of flocculent C-S-H gel form, ultimately yielding a tobermorite-like layered structure in the C-S-H gel. The 3-day sample (Figure 10(a2)) has a Ca/Si ratio of 1.62 (high Ca/Si ratio), leading to discontinuous hydration product structures in the 7-day group, characterized by numerous pores, cracks, and low-polymerized C-S-H gel dominated by Ca(OH)2 crystals. Li et al. [18] found that reducing the Ca/Si ratio to 0.8 inhibits Ca(OH)2 precipitation and promotes Al3+ incorporation into the gel network. The 7-day sample (Figure 10(b2)) shows a Ca/Si ratio of 0.81, significantly lower than that of the 3-day sample but still relatively high. The Al3+ content decreases slightly from 6.78% to 6.67%, with a distinct elemental gradient, indicating reduced Ca(OH)2 precipitation and enhanced Al3+ participation in gel formation, thus forming a denser network structure. As reported by Yan et al. [36], Al3+ compensates for charges in the gel network, facilitating the formation of highly polymerized C-(A)-S-H gel. The 14-day sample (Figure 10(c2)) has a Ca/Si ratio of 0.71 (low Ca/Si ratio) and 10.09% Al3+, indicating extensive Al involvement in forming C-A-S-H and N-A-S-H gels. Scanferla et al. [37] demonstrated that water glass provides Si4+, promoting low Ca/Si ratio C-A-S-H gel formation and inhibiting Ca(OH)2 crystallization. The 28-day sample (Figure 10(d2)) exhibits a Ca/Si ratio of 0.40, with Ca content decreasing to 7% through continuous consumption, an Al/S ratio of 1.32 (nearly all Al participating in hydration), and stable AFt formation from S, resulting in a dense vitreous crystalline structure with enhanced compactness [38].
Combined SEM and EDS analyses reveal that as the curing age of the AAM concrete increases, the hydration reaction progressively becomes more complete. Morphologically, the hydration products evolve from layered flaky Ca(OH)2 and small amounts of flocculent C-S-H gels to a dense structure characterized by highly polymerized C-S-H gels with uniformly intertwined AFt crystals. The Ca/Si ratio decreases continuously from 1.62 to 0.40, concurrent with increased participation of Al3+, which raises the Al/S ratio to 1.32. This process inhibits the precipitation of Ca(OH)2 and promotes the formation of more stable C-A-S-H gels and AFt crystals. In terms of structural properties, porosity is gradually eliminated, with the structure transitioning from a loose layered arrangement to a dense glassy crystalline matrix as the hydration reaction approaches full completion.
Limitations of Microstructural Characterization
It should be noted that the microstructural analysis in this study is mainly based on SEM (morphological observation) and EDS (qualitative elemental composition analysis), which have inherent limitations in direct phase identification. Conclusions such as “Fe-C-S-H-like gel formation” and the “C-S-H-AFt composite structure” are inferred from the correlation between the elemental distribution and microtopography, rather than direct phase identification evidence.
For the accurate identification of hydration products (e.g., confirming the existence of Fe-C-S-H, quantifying AFt content, and analyzing Ca(OH)2 decomposition), supplementary tests such as X-ray diffraction (XRD, for crystal phase identification) and thermogravimetric/differential thermal analysis (TGA/DTG, for phase content quantification) are required. Future research will integrate these techniques to systematically verify the phase composition and evolution mechanism of the hydration products.
5. Conclusions
This study systematically investigated the performance-optimization mechanism of AAM concrete under a quaternary solid waste system composed of ground granulated blast furnace slag (GGBFS), steel slag (SS), fly ash (FA), and desulfurized gypsum (DG) through basic tests on cementitious materials and response surface methodology (RSM). Combined with microstructural characterization, the intrinsic laws governing strength development were revealed. The main conclusions are as follows:
(1) Basic tests showed that, compared with binary and ternary systems, the combined use of the quaternary solid waste system not only improved the strength and optimized the microstructure but also enhanced the utilization rate of low-quality solid wastes.
(2) Using the RSM with GGBFS content, the Na2SiO3 content, and water-binder ratio as influencing factors, the established response surface models for the 3 d, 7 d, 28 d compressive strength and slump exhibited excellent goodness of fit (all R2 > 0.98) with errors between measured and predicted values less than 5%. These models can accurately quantify the effects of each factor and their interactions on performance, providing a reliable basis for mix proportion optimization.
(3) Performance synergy is prominent. Combined with microstructural analysis (SEM/EDS), it is revealed that the macroscopic mechanical properties are closely related to the optimization of microstructure: the gel-like matrix (tentatively identified as C-S-H/C-(A)-S-H) becomes highly polymerized, and acicular crystals (tentatively associated with AFt) are uniformly distributed, leading to a dense internal structure. This finding reveals the intrinsic correlation of the “microscopic densification-macroscopic high strength”, but the exact phase composition of the hydration products requires supplementary phase-analysis techniques for verification.
This study established a multi-objective optimization framework for AAM concrete based on quaternary solid wastes, demonstrating its potential in the resource utilization of industrial wastes. The test results provide a reference value for the application of solid wastes.
Author Contributions
Conceptualization, J.J.; methodology, L.M., J.J. and X.Z.; software, L.M.; validation, L.W.; formal analysis, L.M. and Z.W.; investigation, L.W., L.M. and J.J.; data curation, L.M., Z.M. and X.Z.; writing—original draft preparation, L.M.; writing—review and editing, L.W., L.M. and J.J. All authors have read and agreed to the published version of the manuscript.
Funding
Science Research Project of Hebei Education Department (No. QN2024034); Financially Supported Project of the 2025 Municipal-Level Science and Technology Program of Zhangjiakou City (No. 2511025A).
Data Availability Statement
The original contributions presented in this study are included in the article. Further inquiries can be directed to the corresponding authors.
Acknowledgments
The authors acknowledge funding from the Science and Technology Research Project of Higher Education Institutions in Hebei Province, China.
Conflicts of Interest
The authors declare no conflicts of interest.
References
- Zhou, K.; Gong, K.; Zhou, Q.; Zhao, S.; Guo, H.; Qian, X. Estimating the feasibility of using industrial solid waste as raw material for polyurethane composites with low fire hazards. J. Clean. Prod. 2020, 257, 120606. [Google Scholar] [CrossRef]
- Wei, J.X.; Cen, K. Empirical assessing cement CO2 emissions based on China’s economic and social development during 2001−2030. Sci. Total Environ. 2019, 653, 200−211. [Google Scholar] [CrossRef]
- Çelik, A.İ.; Tunç, U.; Karalar, M.; Althaqafi, E.; Özkılıç, Y.O. Sustainable utilization of aluminum waste in geopolymer concrete: Influence of alkaline activation on microstructure and mechanical properties. Rev. Adv. Mater. Sci. 2025, 64, 20250152. [Google Scholar] [CrossRef]
- Çelik, A.İ.; Karalar, M.; Tunç, U.; Şahan, M.F.; Althaqafi, E.; Umiye, O.A.; Özkılıç, Y.O. Mechanical and impact behavior of lightweight geopolymer concrete produced by pumice and waste rubber. Sci. Rep. 2025, 15, 19202. [Google Scholar] [CrossRef]
- Çelik, A.İ.; Tunç, U.; Karalar, M.; Şahan, M.F.; Özkılıç, Y.O. Study on mechanical, dynamic impact, and microstructural properties of eco-friendly geopolymer paving stones cured in ambient conditions. Constr. Build. Mater. 2025, 464, 140132. [Google Scholar] [CrossRef]
- Peng, L.; Dong, S.; Yang, J.; Gou, J.; Shao, L.; Ma, L.; Nie, R.; Shi, J.; Du, Y.; Liu, Y.; et al. Industrial solid waste as oxygen carrier in chemical looping gasification technology: A review. J. Energy Inst. 2024, 116, 101694. [Google Scholar] [CrossRef]
- He, S.; Lei, X.W.; Zhang, H.G.; Yu, P.; Zhou, Y.T.; Huang, X.J. Durability and heavy metals long-term stability of alkali-activated sintered municipal solid waste incineration fly ash concrete in acidic environments. Constr. Build. Mater. 2025, 462, 139990. [Google Scholar] [CrossRef]
- Siddique, S.; Jang, J.G. Acid and sulfate resistance of seawater based alkali activated fly ash: A sustainable and durable approach. Constr. Build. Mater. 2021, 281, 122601. [Google Scholar] [CrossRef]
- Zhu, J.; Cui, H.; Cui, L.; Yang, S.; Zhang, C.; Liu, W.; Zheng, D. Mutual Activation Mechanism of Cement–GGBS–Steel Slag Ternary System Excited by Sodium Sulfate. Buildings 2024, 14, 631. [Google Scholar] [CrossRef]
- Liu, J.X.; Yu, Q.B.; Zuo, Z.L.; Yang, F.; Duan, W.j.; Qin, Q. Blast furnace slag obtained from dry granulation method as a component in slag cement. Constr. Build. Mater. 2017, 131, 381–387. [Google Scholar] [CrossRef]
- Bernal, S.A.; Provis, J.L.; Rose, V.; Mejía de Gutierrez, R. Evolution of binder structure in sodium silicate-activated slag-metakaolin blends. Cem. Concr. Compos. 2011, 33, 46–54. [Google Scholar] [CrossRef]
- Luan, Y.; Wang, J.; Ma, T.; Wang, S.; Li, C. Modification Mechanism of Desulfurized Gypsum on Alkali-Activated Slag-Fly Ash Mortars. Constr. Build. Mater. 2023, 396, 132400. [Google Scholar] [CrossRef]
- Nasir, M.; Megat Johari, M.A.; Maslehuddin, M.; Yusuf, M.O. Sulfuric acid resistance of alkali/slag activated silicomanganese fume-based mortars. Struct. Concr. 2021, 22, E400–E414. [Google Scholar] [CrossRef]
- Liu, Q.; Liu, J.X.; Qi, L.Q. Effects of temperature and carbonation curing on the mechanical properties of steel slag-cement binding materials. Constr. Build. Mater. 2016, 124, 999–1006. [Google Scholar] [CrossRef]
- Ren, Q.; Zeng, Z.Y.; Jiang, Z.W.; Chen, Q. Incorporation of bamboo charcoal for cement-based humidity adsorption material. Constr. Build. Mater. 2019, 215, 244–251. [Google Scholar] [CrossRef]
- Sun, H.; Qian, J.; Yang, Y.; Fan, C.; Yue, Y. Optimization of gypsum and slag contents in blended cement containing slag. Cem. Concr. Compos. 2020, 112, 103674. [Google Scholar] [CrossRef]
- Sun, J.; Chen, Z. Effect of silicate modulus of water glass on the hydration of alkali-activated converter steel slag. J. Therm. Anal. Calorim. 2019, 138, 2221−2231. [Google Scholar] [CrossRef]
- Li, J.X.; Yu, Q.J.; Wei, J.X.; Zhang, T.S. Structural characteristics and hydration kinetics of modified steel slag. Cem. Concr. Res. 2011, 41, 324–329. [Google Scholar] [CrossRef]
- Liu, K.S.; Zhang, Z.Q.; Sun, J. Advances in understanding the alkali-activated metallurgical slag. Adv. Civ. Eng. 2021, 19, 8795588. [Google Scholar] [CrossRef]
- Bondar, D.; Vinai, R. Chemical and Microstructural Properties of Fly Ash and Fly Ash/Slag Activated by Waste Glass-Derived Sodium Silicate. Crystals 2022, 12, 913. [Google Scholar] [CrossRef]
- Tong, Y.; Seibou, A.-O.; Li, M.; Kaci, A.; Ye, J. Bamboo Sawdust as a Partial Replacement of Cement for the Production of Sustainable Cementitious Materials. Crystals 2021, 11, 1593. [Google Scholar] [CrossRef]
- Waqas, R.M.; Butt, F.; Zhu, X.; Jiang, T.; Tufail, R.F. A comprehensive study on the factors affecting the workability and mechanical properties of ambient cured fly ash and slag-based geopolymer concrete. Appl. Sci. 2021, 11, 8722. [Google Scholar] [CrossRef]
- Ramos, T.; Matos, A.M.; Sousa-Coutinho, J. Mortar with wood waste ash: Mechanical strength, carbonation resistance and ASR expansion. Constr. Build. Mater. 2013, 49, 343–351. [Google Scholar] [CrossRef]
- Shilar, F.A.; Alqahtani, D.A.; Shilar, M.; Khan, T.M.Y. Valorization of agricultural and industrial wastes in geopolymer foam concrete, a ternary binder approach using corncob ash, red mud, and fly ash. Case Stud. Constr. Mater. 2026, 24, e05716. [Google Scholar] [CrossRef]
- Nana, A.; Tome, S.; Yanze, G.A.N.; Singla, R.; Liebscher, M.; Kamseu, E.; Mechtcherine, V.; Kumar, S.; Leonelli, C. Durability of Geopolymer Mortars from Feldspar Waste: Seawater, Nitric and Sulfuric Acids Resistance, Phase Evolution and Microstructure. Iran J. Sci. Technol. Trans. Civ. Eng. 2025, 49, 1–12. [Google Scholar] [CrossRef]
- GB/T 17671-2021; Test Method of Cement Mortar Strength (ISO Method). Beijing Concrete Association: Beijing, China, 2022.
- GB/T 50081-2002; Standard for Test Methods of Mechanical Properties on Ordinary Concrete. China Academy of Building Research: Beijing, China, 2007.
- Zhao, G.; Pan, X.; Yan, H.; Tian, J.; Han, Y.; Guan, H.; Ruan, Y.; Liu, B.; Chen, F. Optimization and characterization of GGBFS-FA based alkali-activated CLSM containing Shield-discharged soil using Box-Behnken response surface design method. Case Stud. Constr. Mater. 2024, 21, e03800. [Google Scholar] [CrossRef]
- Ismail, I.; Bernal, S.A.; Provis, J.L.; San Nicolas, R.; Hamdan, S.; van Deventer, J.S.J. Modification of phase evolution in alkali-activated blast furnace slag by the incorporation of fly ash. Cem. Concr. Compos. 2014, 45, 125−135. [Google Scholar] [CrossRef]
- Oyebisi, S.; Alomayri, T. Artificial intelligence-based prediction of strengths of slag-ash-based geopolymer concrete using deep neural networks. Constr. Build. Mater. 2023, 400, 132606. [Google Scholar] [CrossRef]
- Ravikumar, D.; Peethamparan, S.; Neithalath, N. Structure and strength of Na2SiO3 activated concretes containing fly ash or GGBFS as the sole binder. Cem. Concr. Compos. 2010, 32, 432−441. [Google Scholar] [CrossRef]
- Khan, M.S.H.; Kayali, O. Chloride binding ability and the onset corrosion threat on alkali-activated GGBFS and binary blend pastes. Eur. J. Environ. Civ. Eng. 2018, 22, 1017−1033. [Google Scholar] [CrossRef]
- Ye, T.H.; Xiao, J.Z.; Duan, Z.H.; Li, S. Geopolymers made of recycled brick and concrete powder-A critical review. Constr. Build. Mater. 2022, 330, 127232. [Google Scholar] [CrossRef]
- Oyebisi, S.; Ede, A.; Olutoge, F.; Olukanni, D. Assessment of activity moduli and acidic resistance of slag-based geopolymer concrete incorporating pozzolan. Case Stud. Constr. Mater. 2020, 13, e00394. [Google Scholar] [CrossRef]
- Li, Y.; Shen, J.L.; Lin, H.; Li, Y.Q. Optimization design for alkali-activated slag-fly ash geopolymer concrete based on artificial intelligence considering compressive strength, cost, and carbon emission. J. Build. Eng. 2023, 75, 106929. [Google Scholar] [CrossRef]
- Yan, W.L.; Cheng, H.R.; Zhang, M.; Qin, Y.J.; Cao, J.Q.; Cao, X.Y. Alkali-Activated Slag–Fly Ash–Desert Sand Mortar for Building Applications: Flowability, Mechanical Properties, Sulfate Resistance, and Microstructural Analysis. Buildings 2025, 15, 2069. [Google Scholar] [CrossRef]
- Scanferla, P.; Finocchiaro, C.; Gharzouni, A.; Barone, G.; Mazzoleni, P.; Rossignol, S. High temperature behavior of sodium and potassium volcanic ashes-based alkali-activated materials (Mt. Etna, Italy). Constr. Build. Mater. 2023, 408, 133702. [Google Scholar] [CrossRef]
- Casar, Z.; Mohamed, A.K.; Bowen, P.; Scrivener, K. Atomic-Level and Surface Structure of Calcium Silicate Hydrate Nanofoils. J. Phys. Chem. C. 2023, 127, 18652–18661. [Google Scholar] [CrossRef]


Disclaimer/Publisher’s Note: The statements, opinions and data contained in all publications are solely those of the individual author(s) and contributor(s) and not of MDPI and/or the editor(s). MDPI and/or the editor(s) disclaim responsibility for any injury to people or property resulting from any ideas, methods, instructions or products referred to in the content. |
© 2026 by the authors. Licensee MDPI, Basel, Switzerland. This article is an open access article distributed under the terms and conditions of the Creative Commons Attribution (CC BY) license.