Abstract
In the literature, fatigue-loaded reinforced concrete (RC) beams have been the subject of several experimental investigations; however, few numerical studies have specifically examined this behavior. The primary goal of this study is to create and validate a comprehensive nonlinear finite element (FE) modeling framework that combines an existing concrete damage model with specialized modelling techniques (e.g., material modelling, structural modelling, mesh configuration) to forecast the behaviour of reinforced concrete beams under monotonic fatigue loads and track the failure progress. This was accomplished by implementing suitable constitutive and structural models pertaining to concrete and reinforcing steel using VecTor2 finite element software. The Lü concrete damage model, which accounts for the accumulated damage in the concrete at each loading cycle, was taken from the literature to enhance the numerical findings. A number of published experimental tests conducted under monotonic fatigue loading were used to assess the accuracy of the suggested numerical model. The obtained numerical results demonstrated that the FE model may be used to simulate the monotonic fatigue behaviour of various RC beam types. The monotonic fatigue results were significantly improved by applying the Lü concrete damage model. Additionally, the FE model was implemented into practice to offer valuable information on failure mechanisms, fracture patterns, and strain profiles at different loading cycles.
1. Introduction
Fatigue is a complex phenomenon wherein a material is subjected to a fraction of a static loading in the form of repeated loading over multiple cycles, inducing cumulative structural alteration. If the material is loaded statically for a significantly extended period, stresses greater than its ultimate strength may be created, which could result in complete failure. The terms “fatigue monotonic” or “static fatigue” are commonly used to describe this phenomenon [1,2] (Glucklich, 1961; Junior and Parvin, 2019). The term monotonic fatigue refers to a test or analysis where the material’s response to cyclic loading is represented in its response under monotonic loading conditions. Hence, the internal propagation of microcracks leads to irreversible, irreparable, and permanent damage (deformation) of material properties such as stiffness, load-carrying capacity, deflection, and durability. Subsequently, fatigue failure takes place at an applied load that is less than the designed load post enduring a significant number of load cycles [3,4,5,6,7,8,9].
According to Meneghetti et al. [10], bridge girders are subjected to at least 58 × load cycles of different intensities during their approximately 40-year lifespan. The fatigue strength drops by 25% when the loading cycles increase from 5 to 100 million, as reported by Heffernan and Erki [11]. The fatigue strength is typically influenced by many parameters, including the range of applied loads, frequency, loading history, material properties, environmental conditions, and the number of loading cycles [12,13,14,15,16]. Further study by Barnes and Mays [17] showed that large-sized specimens should be considered because experimental laboratory tests performed on small-sized specimens generate a high level of conservative stresses, while they do not match large-sized specimens. In addition, full-scale specimens have a lower fatigue limit. Concrete and reinforcing steel show diverse responses under fatigue loading compared to those under static loading. Accordingly, their typical fatigue response is explained in the following sections.
1.1. Fatigue Behavior of Concrete
The overall behavior related to the progression of concrete fatigue strain during compression is represented by an increase in the strain (accumulated fatigue damage) versus the number of loading cycles. Fatigue stress in RC beams, particularly in the tension zone, causes notable cracks and strains. High stresses expand the cracks further and lead to stress redistribution [18]. This results in a completely different behavior and failure technique than static failure, which usually occurs by the same mechanism [17]. Consequently, it is assumed that the fatigue strength of a certain concrete sample with 10 million cycles is approximately 55% of the element’s initial static strength [3,8].
In Isojeh et al. [19], a numerical fatigue study for structural elements made of steel-fiber reinforced concrete (SFRC) and reinforced concrete (RC) was presented to account for both irreversible strain accumulation and progressive deterioration under cyclic loading. They integrated fatigue damage models into a disturbed stress field model (DSFM) to capture concrete degradation. Ray and Kishen [20] created a scalar damage model to depict the gradual deterioration of concrete under monotonic and cyclic loads. The model could represent important fatigue phenomena, such as nonlinear strain accumulation, gradual stiffness loss, and fatigue failure, since the evolution of damage is controlled by stress level and loading history. The research study of Wang et al. [12] proposed a numerical modeling approach to forecast the fatigue life of damaged concrete structures during repeated load cycles. It focused on already damaged concrete, and it evaluated how that damage develops over time under fatigue pressures.
1.2. Fatigue Behavior of Reinforcement
This component experiences microcracks that initially form along the transverse rib, which is the maximum stress concentration. Under fatigue loading, stresses in reinforcement can grow over the fatigue life to a measurable size, causing irreversible cumulative energy deformation in the form of cracks, creep, and, eventually, fractures [8,21]. It is stated that the primary factor influencing the fatigue behavior of RC beams is the reinforcing steel, since redistribution of stresses occurs due to the evolution of cracks and stresses during the load cycles. Fatigue failure generally varies with changing stress levels. Accordingly, the ACI guidelines [3] propose maintaining a maximum stress range of 161 MPa for reinforcing steel subjected to fatigue loading, expressed as follows:
where and are the maximum and minimum allowable stress range, respectively; both stresses are given in MPa. In contrast, the American Association of State Highway and Transportation Officials specifications [22] assign a maximum stress range for service loads according to the following:
where is the ratio between the base radius and the height of the transverse deformation of the bar, and it is assumed to be 0.3 if it is not known. Likewise, other ACI specifications provided a limit for the stresses in the longitudinal steel to 80% of its yield stress [23].
Although no limitation is given to steel stirrups, the literature indicates that the same limitations apply to both steel reinforcements regardless of their type [17,24,25]. In addition, the same limit for the magnitude of the stress amplitude was implemented by the fib for internal steel reinforcement [26].
1.3. Literature Review on Numerical Modeling of Fatigue Behavior of RC Beams
A considerable number of experimental investigations on RC beams subjected to fatigue loads are reported in the literature [9,27,28,29,30,31]. Contrariwise, to the best of the author’s knowledge, only limited research has focused on the FE simulation of the fatigue behavior of RC beams. The FE model represents an excellent candidate to fill this informational gap and eliminate conflicts due to controversial results.
Banjara and Ramanjaneyulu [5] created an FE model to examine the fatigue behavior of plain concrete utilizing ATENA software. Three maximum load ranges were considered for the fatigue load tests. Tetrahedral elements were used to model the concrete, while its nonlinear behavior was described by a uniaxial stress–strain curve. The steel plates at the load and support locations were modeled. The numerically acquired fatigue life outcomes correlated well with the experimentally determined results. The numerical models and methods proposed in this study represent an alternative way to evaluate the fatigue life of plain concrete.
Banjara and Ramanjaneyulu [6] developed an FEM using the ATENA software to consider the presence of steel reinforcement in RC beams. In this model, tetrahedral elements and a uniaxial stress–strain curve were used to model the concrete. The steel reinforcements were modeled as discrete elements, and a bilinear stress–strain curve was assumed. In addition, the load and support points were represented with steel plates. It was concluded that the fatigue strength and fatigue life determined by numerical simulations confirmed the values measured by experimental tests. Furthermore, the model assisted in minimizing the need for costly and time-consuming experimental studies.
Huang et al. [32,33] conducted experimental tests and FE simulations using nonlinear FE analysis of the direct path integration of strain fields that were developed by Maekawa et al. [34]. In their study, they suggested using a design approach that considers fatigue for both extreme and minimal load cycles. This is because the load experienced by RC beams during their service life can constantly change, resulting in mixed fatigue failure at high and low load cycles. The sequential effect of the different load levels was demonstrated, and the numerical outcomes showed good agreement with the experimental results for both fixed and variable amplitudes.
Ibrahim et al. [35] generated an FE model utilizing VecTor2 computer software to study the fatigue performance of RC beams. Various specimens with diverse cross sections, fatigue loading conditions, and fatigue lives were engaged in the study. Hognestad’s parabola model was employed to simulate the pre-peak compression behavior exhibited by the concrete, whereas a modified Park–Kent model was implemented to simulate its post-peak compression behavior. A bilinear stress–strain curve was assumed to model the steel reinforcement. The modeled samples exhibited similar behaviors to the experimental ones when comparing their load–deflection relationships, failure modes, and crack patterns under static and fatigue loading.
In the present study, the VecTor2 computer program for nonlinear FE analysis of RC members is introduced, because VecTor2 is a specialized nonlinear finite element software created especially for reinforced concrete (RC) structures. It incorporates the disturbed stress field model (DSFM) and modified compression field theory (MCFT), which are especially good at capturing the cracking behavior and failure mechanisms of RC beams and providing a notably accurate simulation of structural performance. Furthermore, it offers a special capacity to carry out analyses under various loading scenarios: monotonic, cyclic, and reverse cyclic loading. The software is characterized by the facile entry and modification of the diverse material properties of the element [36]. It is also able to monitor the effects of their complex geometries and the type of loading they are subjected to [19,37,38,39,40].
In the current study, the accuracy of the generated FE models was first verified under static loading. The reliability of the VecTor2 software was then examined under monotonic fatigue loading. Once the accuracy of the finite element model was established, it was used to (1) study the complex fatigue behavior and acquire deeper insight into the nature of fatigue; (2) understand the software mechanism to account for the concrete damage model under fatigue loading, and (3) investigate the impact of implementing an external concrete damage model (Lü et al.’s model) on the effectiveness of the software when estimating fatigue damage accumulation with increasing numbers of loading cycles. The novelty of the current research study is its integration and calibration of a nonlinear finite element (FE) modeling framework for RC beams under monotonic fatigue loading; this area has not received much numerical attention.
2. Finite Element Simulation
VecTor2 computer software was developed based on the modified compression field theory (MCFT) combined with the disturbed stress field model (DSFM) [39,40,41,42]. The modified compression field theory was approved by the American Association of State Highway and Transportation Officials [22] and the Canadian Standard Association’s design regulations [43]. The theory was originally developed by Vecchio and Collins [44], in which cracked concrete is represented as an orthotropic material. This is accomplished by implementing a rotational smeared crack method that produces crack patterns similar to those detected in many reinforced concrete structures [41,42,45]. The simulation of cracked concrete involves compression softening, tension softening, and tension stiffening [39,45,46]. To this end, the application of VecTor2 software is limited to numerical modeling of beam–column connections [47] and deep beams when fatigue loading is applied monotonically [19,46,48,49]. Alternatively, modeling approaches such as concrete damaged plasticity (CDP) or phase-field models may require further parameters for calibration and substantially greater computational resources when applied to large-scale structural components under fatigue load. This limits its practical application in the context of fatigue life prediction. In addition, discrete-crack formulas work well for situations that concentrate on specific crack paths and local fracture processes. The current fatigue study places more emphasis on global deterioration trends across structural regions than on specific single-crack evolution, which makes discrete-crack modeling not in line with the objectives of this study.
2.1. Material Modeling
Regarding material constitutive laws, suitable models were selected from VecTor2’s extensive model library to simulate the behavior of concrete and reinforcing steel accurately, as described in the following sections. Table 1 summarizes the structural models used to simulate concrete and reinforcing steel in this study.

Table 1.
Summary of the constitutive models employed in the current study.
2.1.1. Concrete
A significant number of concrete models for compressive and tensile behavior are available in VecTor2, where the concrete behaves differently [50]. The concrete constitutive relationships employed in the FE models, both in tension and compression, are summarized in a single diagram (Figure 1). In this diagram, and refer to the concrete compressive strength and the corresponding concrete compressive strain, also known as and , respectively, while 0.2 and symbolize 20% of the concrete compressive strength and the corresponding compressive strain, respectively. Furthermore, indicates the tensile strength of the concrete.
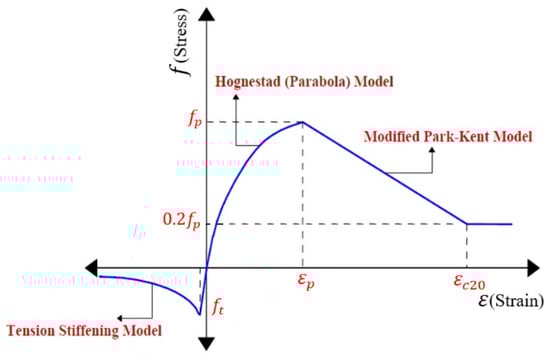
Figure 1.
Concrete models.
For concrete under compression, a constitutive concrete model for the increasing branch of the stress–strain response (pre-peak compression) was represented in the FE model through the “Hognestad parabola” model to describe the concrete’s behavior until its peak strength. The concrete in this model shows a linear stress–strain relationship up to 70% of its full compressive strength. The behavior of the concrete then turns into a nonlinear stress–strain relationship until failure. The widely used “Modified Park-Kent” model was implemented to model the descending branch of the concrete stress–strain curve (post-peak compression). In the “Modified Park-Kent” model, the concrete’s strength decreases gradually in a linear pattern to about 20% of its peak strength. In addition, a confinement effect is incorporated into the model to improve the ductility and strength of the concrete [39,47,51]. Moreover, fatigue loading modifies the stress–strain curve’s slope when the number of loading cycles increases. The compression softening impact was predicted using the “Vecchio 1992-A” model. In this model, the mechanical properties of cracked concrete, which include compressive strength and stiffness, progressively decrease due to the coexistence of transverse cracks and tensile strain [39,41,42,44,51].
The tensile behavior of concrete is characterized by a linear elastic response until crack formation at the ultimate tensile strength. The subsequent tension stiffening describes the post-cracking performance and was simulated with the “Modified Bentz” model [41,50,51,52]. This model was specifically used because it allows for the simulation of tension stiffening, which is an important feature for capturing the load–deformation relationship. The bond action between concrete and reinforcing steel produces tensile stresses among the cracks in the concrete; thus, this model addresses this effect. As suggested by Hordijk [53], the tension softening curve of concrete is represented as a nonlinear behavior.
The material characteristics of concrete, including compressive strength, tensile strength, and elastic modulus () are usually determined from experimental data. However, in cases where any of these properties are not declared, the software makes an appropriate estimation based on the equations of the IS 456 [54] as follows:
2.1.2. Steel Reinforcement
For modeling purposes, steel reinforcement behaves similarly in tension and compression to a typical elastic-plastic model. It initially displays a linear response that stops at the yield point, after which it offers a yielding plateau. Depending on the type of steel, linear or nonlinear strain hardening then takes place. However, the ACI guidelines [3] omit this strain hardening effect and assume a linear level after the plasticity stage. VecTor2 software models the fatigue damage (plasticity) of the reinforcement in the form of a reduction in the reinforcement area. The steel plates at the support and load points were modeled as linear elastic because no failure was observed in these plates.
2.2. Structural Modeling
Finite element models were created based on the discretization of the samples of two different element types. To represent the concrete, varying numbers of plane stress rectangular elements with four nodes and eight degrees of freedom (two degrees of freedom per node) were used. The load and support plates were likewise modeled. Discrete truss elements with two nodes and two degrees of freedom for each node were adopted for the longitudinal and transverse reinforcement as they were positioned at specific points of the structure. They adhered perfectly to the concrete elements. However, the bond stress-slip behavior was indirectly accounted for in terms of tension stiffening models, crack spacing, fracture width formulas embedded into the MCFT, and redistribution of stresses between concrete and reinforcement.
2.3. Concrete Damage Models
2.3.1. VecTor2 Concrete Damage Model
The MCFT assesses the widths and orientations of the cracks in addition to the local and average stresses and strains of both the concrete and reinforcement in the area between the cracks during loading. As a result, this data makes it possible to identify the element’s mode of failure. According to this theory, cracked concrete is regarded as an orthotropic material with a smeared, fully rotating crack. The theory considers the following assumptions: (1) the average principal stresses and strains are aligned; (2) a perfect bond between the concrete and reinforcing steel; and (3) cracks are uniformly distributed with the ability to rotate in response to changes in stress conditions [33,55]. It was discovered that the MCFT can predict dependable strength, load–deformation behavior, and mode of failure with high accuracy and reliability. However, the theory has shown some limitations in certain cases since the MCFT relies on a number of simplistic assumptions. To address these deficiencies, a new concrete damage model was developed, which considered the fatigue governing parameters, irreversible damage accumulation, and steel reinforcement crack propagation (Figure 2).
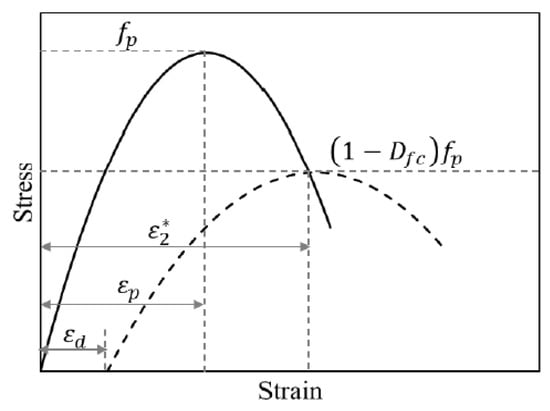
Figure 2.
Modified concrete damage model in VecTor2.
Initial assumptions for the net concrete strain () and total strain () were proposed. The net and total strain values were then determined once the initial assumed values were equivalent to the acquired ones derived by an iterative procedure [19,38,56,57,58]. By implementing the values of net strains using Mohr’s circle, the concrete principal strains () and their crack’s inclination angle could be determined as follows:
At this stage, the concrete average compressive stress could be acquired through the introduction of a concrete compressive strength damage factor designated as and calculated according to Equations (6)–(11) to account for the irreparable fatigue damage (plasticity).
where D is the fatigue damage; is the critical damage equivalent to 0.35 for concrete strength; is the current fatigue cycle; is the fatigue cycle to failure; and is the maximum stress level, calculated as follows:
where is a constant ; is a dimensionless coefficient given a value of 0.15 for sinusoidal waves; is the fatigue cycle to failure; and is the period of a fatigue loading cycle.
where is a factor that accounts for the loading frequency; is the frequency of the fatigue load; and a, b, and c are 0.249, 0.920, and 0.796, respectively.
where is known as a damage parameter.
where R is the minimum-to-maximum stress ratio.
Hognestad’s and Popovic’s models for normal and high-strength concrete were adjusted as provided in Equations (12) and (18), respectively, to accommodate the damage that occurs in the concrete mechanical properties induced by the fatigue phenomenon [56,57]. It is given as follows:
where is the average concrete compressive stress; is the degraded concrete compressive strength.
where is the concrete initial compressive strength.
where is the concrete strain corresponding to the lowered compressive strength; is the primary strain corresponding to the primary concrete compressive strength.
where is the irreversible fatigue strain.
where is the maximum stress level; is the fatigue secant modulus; for high-strength and normal-strength concrete, respectively; ; is the concrete compressive secant modulus damage; and is the static secant modulus.
2.3.2. Lü et al. Concrete Damage Model
Lü et al.’s [59] concrete damage model was created on the basis of 76 experimentally tested concrete specimens in the form of dog bones (350 mm length, 100 mm width, and 100 mm thickness) with concrete compressive strength equivalent to 31.48 MPa. These concrete specimens were all monotonically fatigued under different frequencies and stress levels. Accordingly, a concrete damage model was developed based on experimental fatigue curves of stress versus number of fatigue cycles (S-N) to ensure that the model parameters accurately represented the effect of cyclic loading. The model could take into consideration cumulative damage, tensile damage, softening, and residual stiffness recovery.
The cumulative damage values corresponding to each cyclic ratio that typically results from monotonic fatigue loading on concrete’s compressive strength were estimated using the damage model proposed by Lü et al. [59]. Subsequently, the values of the degraded concrete compressive strength at different loading cycles were computed using Equation (20). Then, the values were calculated and manually inserted into the software.
where the concrete compressive strength damage factor was previously defined in Equation (6). The Lü concrete damage model’s primary parameters are s and v. The parameter v controls the nonlinearity of the damage development, whereas the parameter s is associated with the pace of damage growth and represents the sensitivity of concrete stiffness degradation to stress level. A sensitivity analysis was carried out based on the results suggested in the existing literature. The experimental results and the proposed values for the simulation demonstrated very good agreement. Furthermore, Yadav and Thapa [31] numerically validated the concrete damage model produced by Lü et al. [59] under monotonic fatigue loading. The experimental results and simulation predictions demonstrated very good agreement, indicating the accuracy of the numerical model. It demonstrated its capability to predict the evolution of fatigue damage as well as its accumulation. Subsequently, the numerical model was extended to determine a relationship between the fatigue life (cyclic ratio) and the fatigue damage parameter, as shown in Figure 3. The cyclic ratio is the ratio of the number of failed fatigue load cycles to the present fatigue load cycle [9].
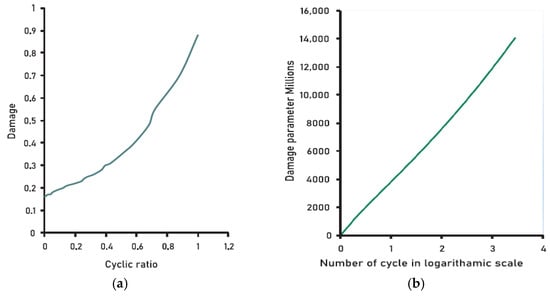
Figure 3.
External concrete damage model: (a) generated experimentally; (b) validated numerically.
The smoothed particle hydrodynamics (SPH) numerical method described in Yu et al. [60] is a meshless method that can be used to model the behavior of concrete cracking processes, random aggregate distribution, and crack initiation without mesh reliance. However, the direct application of this technique to large-scale structural components may be limited due to its generally greater computational costs. The concrete damage model is appropriate and adopted in this study because it can capture the average cracking behavior at the structural level.
2.4. Experimentally Modeled Specimens
The numerical models generated in this study were used to perform nonlinear analyses of selected published experimental data to demonstrate their fatigue behavior. Initially, static tests were conducted on a total of eight RC specimens to confirm the accuracy of the proposed FE model. The static load was applied incrementally in an iterative process in the form of a displacement control regime. This was carried out to observe the load–deflection response more precisely. After the successful completion of this phase, the models were modified to allow the application of monotonic fatigue loads. It was accomplished using a load control system in the form of a temporal sinusoidal wave with distinctive maximum and minimum load levels and frequencies.
The first set of numerically simulated specimens was tested by Murthy et al. [61] to verify the reliability of the nonlinear FE model. Fifteen RC specimens were tested experimentally. They all had a concrete compressive strength of 35 MPa and a rectangular cross-section of 200 100 mm. These beams spanned over 1200 mm. In the present study, only two of the fifteen specimens were adopted: “CBA” denotes the control beam tested under static loading, and “FBA” indicates the fatigue-loaded beam at a rate of 2 Hz with peak and lowest stresses of 87% and 8.7% of the control beam, respectively.
A second set of independent experimental tests conducted by El-Saikaly and Chaallal [15] was also considered. Their experimental program consisted of three sets of samples, each containing a control beam that was studied under static and fatigue loadings. The control specimens for all groups were selected and numerically analyzed in this study. They had a T-shaped cross-section with a flange dimension of 508 102 mm, a web dimension of 304 152 mm, and a span of 3110 mm. The special characteristic that set these three control specimens apart was the existence of internal transverse steel. One specimen had no steel stirrups and was marked as “CON-S0”, whereas the last two examples had steel stirrups spaced at 175 mm and 260 mm, marked as “CONS-S1” and “CON-S3”, respectively. Furthermore, the fatigue load was applied at a maximum load level of 65% and a minimum load level of 35% of the ultimate load of the control beam, which was tested under static loading only. In addition, the test was conducted with a frequency of 3 Hz in the form of a sinusoidal wave.
To further explore the fatigue behavior of RC beams, an experimental study carried out by Papakonstantinou et al. [8,62] was numerically modeled. A total of 17 reinforced concrete beams were used, with a square cross-section of 152.4 152.4 mm, an effective span of 1220 mm, and a concrete compressive strength of 40 MPa. In their experimental program, three specimens labeled as “N-1”, tested under a static load, “N-6” and “N-8”, tested under fatigue loading at a rate of 2 Hz and 3 Hz, respectively, were adopted. Furthermore, the maximum fatigue load was executed at a level of 73% for the “N-6” specimen and at a level of 54% for the “N-8” specimen. A comprehensive explanation of the investigated specimens in terms of geometry, identification, loading, and material properties is presented in Table 2, Table 3 and Table 4, which provide the ratio of maximum and minimum applied loads along with the load amplitude for each tested specimen. In addition, the tables show the magnitude of the maximum and minimum loads and the loading frequency. It is worth noting that references are provided for more detailed information about the samples. Relevant information can be found and reviewed in the relevant document.
Table 2.
Geometrical characteristics of the modeled specimens.
Table 3.
Material properties of the modeled specimens.
Table 4.
Properties of experimental fatigue loading.
It can be mentioned that experimental tests provide important findings of global responses, such as the maximum deflection behavior and obvious crack patterns. Nevertheless, the internal stress redistribution, fracture evolution sequence, and localized damage development that take place inside concrete under loading are frequently not captured by these tests. The finite element (FE) simulations in this study provide fresh perspectives to visualize damage evolution and progressive cracking within the web regions and beam depth, which are challenging to monitor experimentally. In addition, finite element models offer a deeper understanding of fatigue-induced stiffness degradation since they capture stress transfer between steel reinforcement and concrete under various monotonic fatigue loading conditions.
To account for the load amplitude, which is the two load bounds, VecTor2 applied a repeated load history between these two load constraints, causing the structure to cycle around a fixed mean load level. This method controlled the damage evolution by the constitutive response at each load level, whereas damage accumulation between cycles was considered through the concrete damage model. The damage accumulation between cycles was represented by the steady deterioration of material stiffness and strength within the constitutive formulations, which resulted in gradual fracture development and larger crack widths and decreased load-carrying capability as the number of cycles increased.
2.5. Sensitivity Analysis
Model optimization using sensitivity analysis is an important procedure for evaluating structural behavior and achieving high numerical accuracy [63,64]. A mesh sensitivity analysis was performed to determine the sufficient mesh size. Different element sizes were tested for each sample before proceeding to subsequent simulation steps. It was found that a 10 10 mm square mesh provided more accurate numerical results compared to the experimental results for specimen N-6 of Papakonstantinou et al.’s [8,62] specimens. However, a square mesh size of 25 25 mm showed the best response regarding specimen N-8 of Papakonstantinou et al. [8,62] and Murthy et al.’s [61] specimens. On the contrary, mixed mesh sizes were used by El-Saikaly and Chaallal [25]. A square mesh size of 20 20 mm was implemented in the shear span region since it was the critical area under examination, while a 50 20 mm mesh size was used in the remaining areas.
3. Numerical Results and Discussion
In the current investigation, various numerical outcomes for each specimen were addressed. These simulations were carried out to evaluate the static and monotonic fatigue behavior of RC beams compared to the experimental findings. The results are represented in terms of maximum deflection versus number of cycles, strain profile, mode of failure, crack pattern, and the evolution of the maximum deflection over the fatigue life.
The preliminary stage of this research represents an evaluation of the derived finite element models’ accuracy in comparison to a number of experimental tests carried out under static loading, as provided in Figure 4. Upon attaining the accuracy of the numerical models of the RC specimens under static loading, further numerical simulations under monotonic fatigue loading were conducted utilizing the formerly validated FE models.
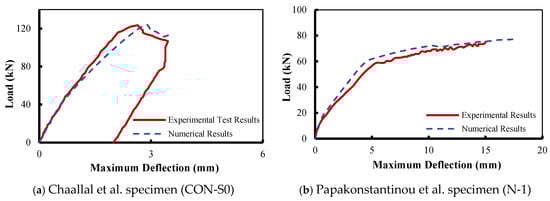
Figure 4.
Load–deflection response under static load.
3.1. Deflection vs. Number of Load Cycles Response
3.1.1. VecTor2 Damage Model
Figure 5 and Table 5 present the numerical deflection versus the number of cycles predicted by the VecTor2 damage model for each beam, along with their experimental counterparts. Figure 5a displays the numerical results of the relationship between deflection versus the number of load cycles for Murthy’s [61] FBA specimen computed by the VecTor2 concrete damage model. It can be observed that the central deflection of the experimental results abruptly increased at the onset of failure, while the numerical results of deflection remained constant during the entire failure progress. This indicates that the software was unable to capture the degradation corresponding to the increase in the load cycles, and the concrete damage model of VecTor2 software failed to track the breakdown scenario. The VecTor2 concrete damage model was not able to capture the progress of failure because the rotating smeared crack assumption updates fracture orientation depending on the current principal strain state without retaining cycle history. In addition, the concrete damage model lacks an explicit cycle-dependent degradation law. As a result, stiffness and crack opening under constant-amplitude cyclic loading do not gradually deteriorate until new peak strain values are reached, resulting in almost constant deflection responses with increasing cycle count.
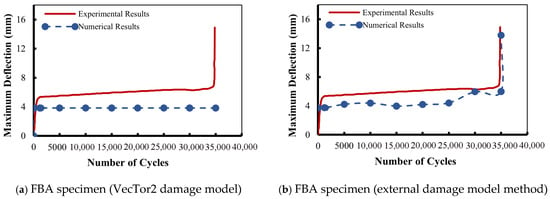
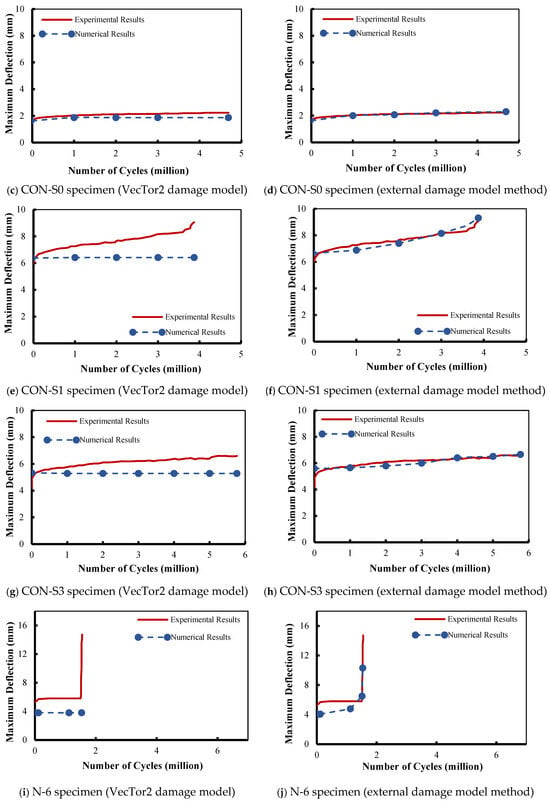
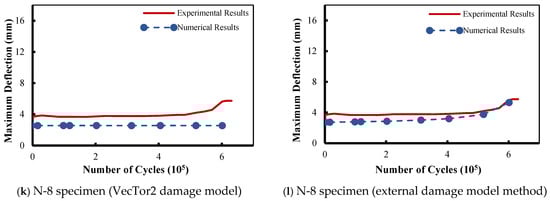
Figure 5.
Maximum deflection vs. number of cycles under monotonic fatigue load.
Table 5.
Comparison between the experimental and numerical results.
The behavior of deflection versus the number of load cycles produced by the VecTor2 damage model for El-Saikaly and Chaallal’s [15,25] CON-S0, CON-S1, and CON-S3 specimens is illustrated in Figure 5c, Figure 5e, and Figure 5g, respectively. As in the previous group of specimens, the VecTor2 damage model was also unable to detect the fatigue degradation with the increase in fatigue cycles as measured experimentally, especially for specimens CON-S1 and CON-S3. This is well represented since the resulting deflection values remain constant throughout the entire course of the fatigue test, and a clear discrepancy between the experimental results and the numerical predictions can be observed.
To further confirm the results, two additional specimens (N-6 and N-8) from Murthy et al. [61] were simulated. Figure 5i,k clearly show that although the two specimens (N-6 and N-8) were tested under different fatigue load frequencies and load cycles, they exhibited the same deflection behavior. The numerical predictions had a constant plateau up to failure, and they were not able to follow the experimental results at the pre-failure loading cycles. This confirms the software’s inability to capture cumulative fatigue degradation when the deflection is continuously constant regardless of the increase in fatigue loading cycles.
Regarding the outcomes shown in Figure 5, it is proven that the VecTor2 concrete damage model showed a wide discrepancy at a higher number of loading cycles, which posed a significant challenge. Although it was able to capture the behavior at early cycles to some extent, the software was unable to account for the material properties’ degradation when the number of loading cycles increased. Furthermore, the estimated deflection values were distant from the experimental ones. Hence, extensive attention by the authors was directed toward concrete damage models in the existing literature to overcome the limitations of the software.
3.1.2. Lü et al. Damage Model
To enhance the numerical predictions and to attain higher accuracy, the degradation of concrete compressive strength was considered by adopting a concrete damage model from the available literature. The modeled specimens under monotonic fatigue loading using the VecTor2 damage model were re-simulated using the Lü et al. [59] concrete damage model (external damage model), as illustrated in Figure 5.
In Figure 5b, the maximum deflection versus number of load cycles relationship reported by Murthy et al. [61] was significantly enhanced when the concrete strength was computed based on the Lü et al. concrete damage model. The degree of correlation between the experimental and the numerical results when implementing this damage model increased. This was the case especially as the cycles approached to failure. The integration of Lü et al.’s concrete damage model improved the precision and adaptability of the nonlinear analysis, especially in capturing the post-cracking and softening behavior of the beams. The observed discrepancy between the numerical and experimental results can be linked to the assumption that the concrete and reinforcement had a complete contact connection and to the missing data regarding material properties in some experimental programs, which were assumed by the authors.
Numerical modeling was carried out for the three specimens of El-Saikaly and Chaallal [15,25] under monotonic fatigue loading of six million cycles. As depicted in Figure 5d,f,h, a significant improvement was achieved once the Lü et al. concrete damage model was utilized. The majority of these improvements were monitored when loading cycles were approaching failure. Nonetheless, during the early fatigue cycles, the accuracy of the numerical modeling results using Lü et al.’s concrete damage model was sufficient. It can be mentioned that the numerical predictions were almost identical to the experimental results for specimens CON-S0 and CON-S3. This can be attributed to the fact that Lü et al.’s concrete damage model includes coupled tensile–compressive damage evolution as well as energy-based damage parameters, which enables more realistic stiffness degradation, and it enhances the representation of the modeling of tension stiffening and crack localization.
Regarding Papakonstantinou et al.’s [8,62] specimens. shown in Figure 5j,l, the numerical deflection values followed a similar trend compared to the experimental ones, affirming the authenticity of the adopted external damage model. However, there were a few discrepancies between the experimental results and the numerical prediction; this can be attributed to the mesh size and number of nodes per element.
3.1.3. Comparison Between Concrete Damage Models
In order to provide better insight into the outcomes from the two concrete damage models, Figure 6 presents a comparison of the maximum deflection associated with each specimen at various fatigue loading cycles for each model in the form of percentage difference values, as shown in Table 4.
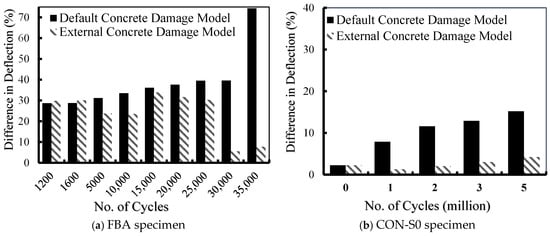
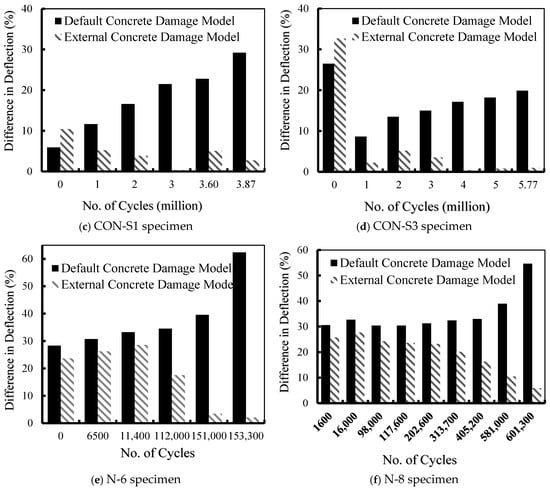
Figure 6.
Percentage difference in VecTor2 damage model vs. external damage model.
Figure 6a provides the difference in deflection between the experimental results and the numerical predictions for both concrete damage models (VecTor2 and Lü et al.) at various load cycles. For specimen FBA, both concrete damage models showed similar results up to 1600 load cycles. Thereafter, the difference appeared to be obvious between the experimental results and the VecTor2 damage model (default damage model). The percentage difference regarding the deflection of specimen FBA at 35,000 load cycles was 74% using the VecTor2 damage model. This difference was significantly improved to 8% when using the Lü et al. (external) damage model, as illustrated in Figure 6a.
Similar results were obtained for El-Saikaly and Chaallal’s [15,25] specimens, which are presented in Figure 6b–d for specimens CON-S0, CON-S1, and CON-S3, respectively. For these specimens, a noticeable difference in deflection was observed towards the maximum deflection. It should be mentioned that a higher degree of improvement was obtained when using the Lü et al. (external) damage model. For specimen “CON-S0”, the percentage difference in the maximum deflection at 5,000,000 load cycles was improved from 15% using the VecTor2 damage model to 4% using the Lü et al. (external) damage model. However, at the same number of load cycles, specimen “CON-S3” was detected to cause a reduction in the percentage difference from 20% using the VecTor2 damage model to 1% using the Lü et al. (external) damage model. For specimen “CON-S1”, the Lü et al. (external) damage model offered improvement in the numerical predictions by converting the percentage difference from 29% to 3% at 4,000,000 fatigue load cycles, as presented in Figure 6b–d.
The difference in deflection for the Papakonstantinou et al. [8,62] specimens “N-6” and “N-8” is shown in Figure 6e,f. For the VecTor2 (default) damage model, the discrepancy between the experimental and numerical results increased with the increase in the number of fatigue loading cycles, whereas, for the Lü et al. (external) damage model, the deflection difference decreased with the increase in fatigue loading cycles. This is visible in specimen “N-6” at 135,000 load cycles, where the percentage difference was reduced from 62% with the VecTor2 concrete damage model to only 2% when the Lü et al. (external) damage model was employed. This confirms the effectiveness of the Lü et al. (external) damage model in predicting concrete fatigue degradation over fatigue life. It also reveals that the VecTor2 concrete fatigue damage model suffers from a deficiency in taking into consideration the fatigue degradation that usually occurs to the material’s mechanical properties as the fatigue load cycles increase, causing the material to grow closer to failure.
To highlight the improvement of the deflection results using Lü et al.’s damage model, the predictions of the finite element model for deflection using the VecTor2 damage model and the external damage model were validated against the experimental outcomes in Table 5. It can be observed that implementing the Lü et al. (external) damage model predicted the deflection with an average numerical-to-experimental ratio of 10.6% with a standard deviation of 14.6, whereas the VecTor2 (default) damage model had an average numerical-to-experimental ratio of 26.1% with a standard deviation of 17.4. These results prove the capability of the finite element model to accurately predict deflection versus loading cycles when the external damage model is utilized. The Lü et al. concrete damage model showed differences in predicting the deflection behavior, especially in the early cycles, due to a number of reasons. First, microcracking and early stiffness deterioration have a significant impact on the initial response of reinforced concrete during fatigue and are challenging to accurately represent using constitutive models for reinforcing steel and concrete. Second, because there was insufficient experimental data, some material properties in the model were obtained from code equations. Thirdly, the MCFT relies on average stress–strain relationships, which might not accurately capture the localized damage found in early fatigue cycles.
A computational efficiency comparison between the concrete damage model and the default damage model in VecTor2 was carried out in order to provide insight into the prediction accuracy and computational cost. Note that the specimens displayed in Table 5 and Figure 5 and Figure 6 were simulated using identical mesh size, loading, and convergence conditions. It should be mentioned that the computational time using Lü et al.’s damage model is somewhat higher due to its more complex damage evolution formulation and additional internal variable updates during nonlinear iterations. However, the increase in computational time was found to be acceptable for practical engineering applications since, on average, the Lü model increased the total computational time by approximately 10% compared with the default VecTor2 damage model, while providing a noticeable improvement in prediction accuracy of 10.6% compared to 26.1% with the default VecTor2 damage model, particularly in the post-cracking and damage-dominated stages.
3.2. Strain Response
Since the Lü et al. (external) concrete damage model proved its superiority over the VecTor2 damage model, the Lü et al. model was implemented to obtain some quantities that are important for RC beam behavior. Numerical predictions for the strain profiles of the concrete, longitudinal steel, and steel stirrups were compared to the experimental results. Figure 7, Figure 8 and Figure 9 compare the experimental and numerical maximum strain values, which corresponded to the maximum fatigue load at each load cycle. The comparisons were only conducted for specific specimens due to the absence of experimental results.
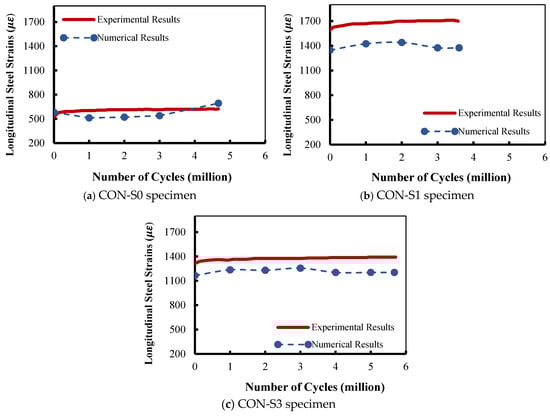
Figure 7.
Comparison between experimental and numerical longitudinal steel strain results.
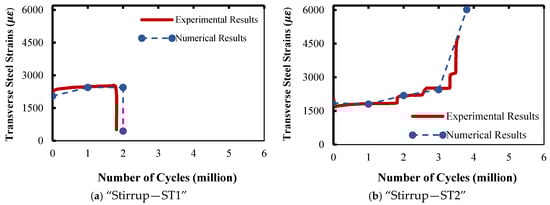
Figure 8.
Transverse steel strain of specimen CON-S1.
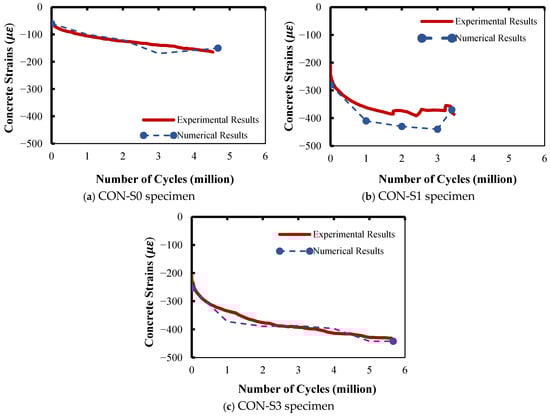
Figure 9.
Comparison between experimental and numerical concrete strain results.
3.2.1. Strain in Longitudinal Steel
Regarding the strain in longitudinal steel, an identical response was numerically predicted by the FE model compared to the experimental outcomes. High correlation was observed between the numerical and the experimental outcomes, as illustrated in Figure 7.
In the beams studied by El-Saikaly and Chaallal [15,25], the general trend of strain in longitudinal steel was nearly constant, without a considerable increase with the number of load cycles. For specimen CON-S0 (Figure 7a), the numerical model predicted longitudinal steel strains identical to the experimental measurements. The experimental strain at failure of the beams was 693 με, whereas the numerical maximum strain was 624 με at the same number of load cycles. The difference in the longitudinal steel strain was 10% compared to the experimental results.
A clear discrepancy was observed between the numerical predictions and the experimental results for specimen CON-S1, as depicted in Figure 7b. The numerical prediction for the strain in longitudinal steel was 1376 με, which was lower than the experimental strain of 1700 με. The difference between the numerical predictions and experimental results was 19%. This difference can be attributed to the hygiene mesh selected, which combined small-sized elements (20 × 20 mm) along the shear span and large-sized elements (50 × 20 mm) along the rest of the beam. It should be noted that specimen CON-S1, provided in Figure 7b, was recorded to have, experimentally and numerically, the highest strain compared to the other tested specimens during the first and the last cycles, with experimental values of 1560 με and 1700 με, respectively, and numerically recorded values of 1347 με and 1376 με.
The experimental and numerical results for strain in longitudinal reinforcement for specimen CON-S3 are plotted in Figure 7c. The discrepancy between the numerical predictions and experimental results is smaller compared to the previous specimens. The numerical model predicted a longitudinal steel strain of 1203 με, whereas the experimental result for the strain was 1392 με. The difference between the numerical predictions and the experimental results is 14%. The primary cause of deviation was the impact of mesh size, where excessive mesh refinement may have resulted in numerical instability and higher computing costs. Coarser meshes typically underestimate local strain concentrations close to crucial locations. The influence of material constitutive assumptions was also a cause of discrepancy. The tension–compression asymmetry and localized cracking behavior may not have been perfectly captured by concrete damage models, which could result in inconsistent strain prediction for specific specimens. Specifically, strain in the post-cracking stage may have been overestimated or underestimated due to the assumption of uniform damage evolution and ideal bond conditions.
3.2.2. Strain in Transverse Steel
Figure 8a,b show the numerical strain of the ST1 and ST2 stirrups, respectively, compared to the measured results. As shown in the figure, the FE model’s accuracy was validated because it exhibited behavior similar to that observed in the experimental tests. The numerical predictions were able to track the experimental results, especially for the ST1 stirrups. As demonstrated in Figure 8a, the steel stirrups at early load cycles in specimen CON-S1 achieved the highest strain, with numerical and experimental values of 2050 με and 2445 με, respectively.
For the ST2 stirrups, the numerical model obtained a value of strain of 6021 με, whereas the reported experimental value of 4840 με was the highest strain value in the transverse steel at the last fatigue loading cycle. This indicates a difference of 24% between the experimental and the numerical results. It can be mentioned about the FE model that the ST1 stirrups failed abruptly due to a sudden decrease in their strain after about 2.0 million cycles (Figure 8a). This was followed by stirrup “ST2” being in charge until a sudden jump in its strain, leading to its rupture, which occurred after 3.8 million load cycles (Figure 8b). This was an identical behavior to the one experimentally reported. This discrepancy between the experimental results and numerical predictions can be explained by the steel–concrete constraint modeling assumption.
3.2.3. Strain in Concrete
Figure 9a–c compares the experimental concrete strain to the numerical one for specimens CON-S0, CON-S1, and CON-S3, respectively. The finite element model using Lü et al.’s concrete damage model was successful in predicting the degradation behavior of the concrete, which was identical to the experimental observations. Generally, the concrete strain typically experiences three stages. The first and last stages are characterized, in particular, by prompt increases. The first stage reaches approximately 10% of the total life, while the last continues up to failure. These two stages are separated by an intermediate stage, in which the strain increases steadily (quasi-linear) from 10% to about 80% of the fatigue life. The second stage is longer for high-strength concretes [9,18,65]. In this study, significant degradation occurs at the early stages under a few load cycles. This is kept constant for a while (second stage), after which an abrupt failure can be noticed (third stage). This behavior is explicitly depicted in Figure 9, where the experimental and numerical results demonstrate good consistency with respect to El-Saikaly and Chaallal’s [15,25] specimens.
It should be highlighted that the numerical predictions of the concrete strain were affected by the amount of transverse steel along the shear span. This can explain the high accuracy of the numerical model in predicting the concrete strain for specimens CON-S0 and CON-S3, as shown in Figure 9a and Figure 9c, respectively. Note that there were no steel stirrups in specimen CON-S0, and few steel stirrups in specimen CON-S3. The accuracy of the numerical model was low for specimen CON-S1, where a larger number of steel stirrups were provided along the shear span. The low accuracy of the finite element model at a larger number of steel stirrups is attributed to the fact that more shear cracks would appear along the shear span as the number of steel stirrups increased [66].
From Figure 9a–c, it can be observed that the predicted maximum concrete strain at failure was approximately identical to the one experimentally measured. This proved the superiority of the concrete damage model in representing the concrete degradation.
3.3. Failure Modes
Figure 10 compares the experimental crack pattern for specimen CON-S1 to the one obtained from the numerical model. As provided in Figure 10a, the specimen (CON-S1) experimentally exhibited catastrophic shear failure once the major diagonal shear crack occurred. The diagonal shear crack propagated until it reached the loading point. The finite element model successfully showed diagonal cracks in the region between the applied load and the support ‘shear span’. The diagonal cracks commenced from the bottom end of the beam and propagated to the beam flange. The experimental failure mode was concrete crushing, which is identical to the failure mode obtained numerically.
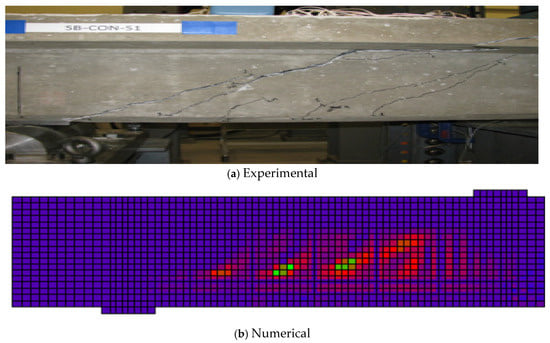
Figure 10.
Crack pattern and failure mode of El-Saikaly and Chaallal’s [15,25] specimen (CON-S1).
Specimen FBA, tested by Murthy et al. [61], suffered from flexural failure, which was experimentally and numerically shown in Figure 11a and Figure 11b, respectively. The experimental results of the crack pattern (Figure 11b) showed vertical cracks in the region between the points of applied loads, whereas diagonal cracks were observed in the region between the applied load and the support. Furthermore, the cracks only covered the tension part of the cross-section. Likewise, the numerical simulation performed in this study confirmed this crack pattern (Figure 10b). Notably, the nonlinear finite element model asserted its capability to accurately predict mode of failure under monotonic fatigue loading.
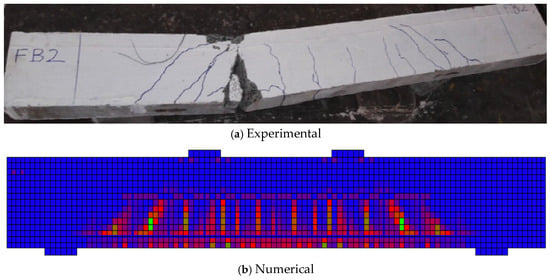
Figure 11.
Crack pattern and failure mode of Murthy et al.’s [61] specimen (FBA).
It should be mentioned that the application of the results of the current study to ultra-high-performance concrete (UHPC, >120 MPa) and high-performance concrete (HPC, 50–80 MPa) types requires caution compared to normal-strength concrete. This is because the increase in compressive strength and elastic stiffness lowers the tensile strain and post-cracking ductility, leading to more brittle fracture behavior, reducing energy dissipation after cracking, altering aggregate interlock, and changing crack roughness mechanisms [67]. The MCFT’s fundamental assumptions, such as rotating smeared cracks, average stress–strain compatibility, and shear transfer through aggregate interlock, may be less effective in simulating the behavior of UHPC and HPC. Note that applying MCFT directly without modification may result in inaccurate predictions of fatigue life, shear capacity, and cracking patterns for these materials. The findings of the current manuscript are limited to reinforced concrete beams made with normal-strength concrete.
The analyses of this study concentrated on the fatigue response under cyclic loading, where short-term material behavior, creep, and shrinkage were not included in the MCFT-based simulations. Creep and shrinkage affect fatigue performance within the MCFT method by changing the average stress–strain ratios, raising tensile strains in cracked concrete, and changing crack widths and shear transfer through aggregate interlock [68,69,70,71]. In particular, under monotonic fatigue loads, these time-dependent effects may produce earlier crack initiation, decreased stiffness, and accelerated fatigue damage.
4. Conclusions
The current study aimed to model the performance of reinforced concrete beams subjected to monotonic fatigue loads. In this study, a robust nonlinear FE model was developed using promising computer software (VecTor2). This study was undertaken in two main phases: (1) the accuracy of the model was validated under static load and numerical predictions were compared against various sets of experimental studies to assess the quality of the model, and (2) these numerical models were utilized afterward to inspect the fatigue performance, in its monotonic form, to obtain better insight into the fatigue behavior of RC beams. Two different concrete damage models for fatigue loading were implemented, since the concrete progressively lost its capability to detect fatigue degradation, which accumulated as the number of fatigue loading cycles increased. In addition to an existing model using software that accounts for damage in concrete due to compressive strength, Lü et al.’s damage model was selected from the available literature and implemented in the FE model. The study findings can be summarized in the following conclusions:
- (i)
- Generally, the numerical model was capable of simulating the behavior of RC beams under monotonic fatigue loading. The numerical model was successful in predicting the response of experimental beams in terms of the maximum deflection versus the number of loading cycles and failure modes.
- (ii)
- The VecTor2 concrete damage model was able to capture the fatigue behavior at early load cycles. Wide discrepancies between the FE model results and the experimental ones were observed when the number of cycles increased. This can be attributed to the rotating smeared crack assumption, which affected the stiffness and crack opening under constant-amplitude cyclic loading, resulting in almost constant deflection responses with an increasing number of cycles.
- (iii)
- The external damage model (Lü et al.) adopted in this study provided a response identical to the experimental response when the specimens were subjected to monotonic fatigue loading. However, the Lü et al. concrete damage model showed differences in predicting strain behavior in the early cycles due to microcracking and early stiffness deterioration, and the average stress–strain relationships adopted by the MCFT.
- (iv)
- When implementing the Lü et al. damage model, comparisons between the numerical and experimental results showed strong correlations in terms of the strain in longitudinal reinforcement, transverse reinforcement, and concrete. This research has demonstrated that accurate FE models are valuable resources for obtaining information about the useful quantitative characteristics of RC beams.
Environmental factors such as temperature and variations are known to have a substantial impact on the development of cracks, the accumulation of fatigue damage, and the deterioration of concrete stiffness, changing material characteristics and speeding up the formation of microcracks under cyclic stress, migration, and shrinkage behavior. The strain distribution, fatigue life, and post-cracking performance of RC beams may be altered as a result of these impacts. RC bridge structures frequently experience both changeable environmental exposure and long-term cyclic pressure. For better evaluation of damage progression in bridge structures, it can be suggested that the numerical model should take into account both environmental factors and traffic-induced fatigue. Future research directions may include (1) integrating material parameters that depend on temperature and humidity into the damage model; (2) integrating fatigue loading with environmental effects like freeze–thaw cycles and thermal gradients; and (3) validating the model with long-term experimental data from RC bridge members exposed to realistic service environments.
Author Contributions
Conceptualization, N.I., S.E. and A.G.; methodology, N.I., S.E. and A.G.; software, N.I. and S.E.; validation, N.I., S.E. and A.G.; formal analysis, N.I., S.E. and A.G.; investigation, N.I., S.E. and A.G.; resources, N.I., S.E. and A.G.; writing—original draft preparation, N.I., S.E. and A.G.; writing—review and editing, N.I., S.E. and A.G.; visualization, N.I., S.E. and A.G.; supervision, S.E. and A.G.; project administration, A.G.; funding acquisition, A.G. All authors have read and agreed to the published version of the manuscript.
Funding
This research was funded by the Research Affairs Office at the UNITED ARAB EMIRATES UNIVERSITY, grant number #31N375.
Data Availability Statement
All data, models, and code generated or used during the study appear in the submitted article.
Acknowledgments
The authors thank the Research Office at Ajman University for supporting the article processing charges.
Conflicts of Interest
The authors declare no conflicts of interest. The funders had no role in the design of the study; in the collection, analyses, or interpretation of data; in the writing of the manuscript; or in the decision to publish the results.
References
- Glucklich, J. Static Fatigue in Concrete. Rheol. Acta 1961, 1, 356–361. [Google Scholar] [CrossRef]
- Junior, S.; Parvin, A. Performance of Continuous Concrete Beams with Reinforced FRP Bars and Sheets. In Proceedings of the Fifth Conference on Smart Monitoring, Assessment and Rehabilitation of Civil Structures (SMAR), Potsdam, Germany, 27–29 August 2019; pp. 27–29. [Google Scholar]
- ACI Committee 215. Considerations for Design of Concrete Structures Subjected to Fatigue Loading; Report No. PRC-215-21; American Concrete Institute: Framington Hills, MI, USA, 2021. [Google Scholar]
- Dineshkumar, R.; Ramkumar, S. Review paper on fatigue behavior of reinforced concrete beams. Mater. Today Proc. 2020, 21, 19–23. [Google Scholar] [CrossRef]
- Banjara, N.K.; Ramanjaneyulu, K. Experimental Investigations and Numerical Simulations on the Flexural Fatigue Behavior of Plain and Fiber-Reinforced Concrete. J. Mater. Civ. Eng. 2018, 30, 04018151. [Google Scholar] [CrossRef]
- Banjara, N.; Ramanjaneyulu, K. Investigations on Behaviour of Flexural Deficient and CFRP Strengthened Reinforced Concrete Beams under Static and Fatigue Loading. Constr. Build. Mater. 2019, 201, 746–762. [Google Scholar] [CrossRef]
- Bastidas-Arteaga, E.; Bressolette, P.; Chateauneuf, A.; Sánchez-Silva, M. Probabilistic lifetime assessment of RC structures under coupled corrosion–fatigue deterioration processes. Struct. Saf. 2009, 31, 84–96. [Google Scholar] [CrossRef]
- Papakonstantinou, C.; Petrou, M.; Harries, K. Fatigue Behavior of RC Beams Strengthened with GFRP Sheets. J. Compos. Constr. 2001, 5, 246–253. [Google Scholar] [CrossRef]
- Kim, J.; Kim, Y. Experimental study of the fatigue behavior of high strength concrete. Cem. Concr. Res. 1996, 26, 1513–1523. [Google Scholar] [CrossRef]
- Meneghetti, L.C.; Garcez, M.R.; da Silva Filho, L.C.P.; Gastal, F.d.P.S.L.; Bittencourt, T.N. Fatigue life of RC beams strengthened with FRP systems. Struct. Concr. 2014, 15, 219–228. [Google Scholar] [CrossRef]
- Heffernan, P.J.; Erki, M.A. Fatigue Behavior of Reinforced Concrete Beams Strengthened with Carbon Fiber Reinforced Plastic Laminates. J. Compos. Constr. 2004, 8, 132–140. [Google Scholar] [CrossRef]
- Wang, Y.; Li, Y.; Lu, L.; Wang, F.; Wang, L.; Liu, Z.; Jiang, J. Numerical prediction for life of damaged concrete under the action of fatigue loads. Eng. Fail. Anal. 2024, 162, 108368. [Google Scholar] [CrossRef]
- Haghighi, M.; Asadi, P.; Hashemolhosseini, H.; Baghbanan, A. An experimental study on the bending fatigue behavior of concrete beams by a proposed machine. Mech. Based Des. Struct. Mach. 2024, 52, 9082–9098. [Google Scholar] [CrossRef]
- Maljaars, J.; Leonetti, D.; Hashemi, B.; Snijder, H.H. Systematic derivation of safety factors for the fatigue design of steel bridges. Struct. Saf. 2022, 97, 102229. [Google Scholar] [CrossRef]
- El-Saikaly, G.; Chaallal, O. Extending the Fatigue Life of Reinforced Concrete T-Beams Strengthened in Shear with Externally Bonded FRP: Upgrading versus Repairing. J. Compos. Constr. 2015, 19, 04014027. [Google Scholar] [CrossRef]
- Ekenel, M.; Myers, J. Fatigue Performance of CFRP Strengthened RC Beams under Environmental Conditioning and Sustained Load. J. Compos. Constr. 2009, 13, 93–102. [Google Scholar] [CrossRef]
- Barnes, R.A.; Mays, G.C. Fatigue Performance of Concrete Beams Strengthened with CFRP Plates. J. Compos. Constr. 1999, 3, 63–72. [Google Scholar] [CrossRef]
- El-Tawil, S.; Ogunc, C.; Okeil, A.; Shahawy, M. Static and Fatigue Analyses of RC Beams Strengthened with CFRP Laminates. J. Compos. Constr. 2001, 5, 258–267. [Google Scholar] [CrossRef]
- Isojeh, B.; El-Zeghayar, M.; Vecchio, F. Numerical Analysis of Reinforced Concrete and Steel-Fiber Concrete Elements under Fatigue Loading. J. Struct. Eng. 2019, 145. [Google Scholar] [CrossRef]
- Ray, S.; Kishen, J.M. Analysis of fatigue crack growth in reinforced concrete beams. Mater. Struct. 2013, 47, 183–198. [Google Scholar] [CrossRef]
- Williams, G.; Higgins, C. Fatigue of Diagonally Cracked RC Girders Repaired with CFRP. J. Bridge Eng. 2008, 13, 24–33. [Google Scholar] [CrossRef]
- American Association of State Highway and Transportation Officials (AASHTO). Standard Specifications for Highway Bridges, 41st ed.; AASHTO: Frederick, MD, USA, 2021. [Google Scholar]
- ACI Committee 440. Guide for Design and Construction of Structural Concrete Reinforced with Fiber-Reinforced Polymer (FRP) Bars; Report No. 440 1R-15; American Concrete Institute: Farmington Hills, MI, USA, 2015. [Google Scholar]
- Chaallal, O.; Boussaha, F.; Bousselham, A. Fatigue Performance of RC Beams Strengthened in Shear with CFRP Fabrics. J. Compos. Constr. 2010, 14, 415–423. [Google Scholar] [CrossRef]
- El-Saikaly, G.; Chaallal, O. Fatigue behavior of RC T-beams strengthened in shear with EB CFRP L-shaped laminates. Compos. Part B Eng. 2015, 68, 100–112. [Google Scholar] [CrossRef]
- EAR fib Working Group and Stijn Matthys (UGent). Externally Applied FRP Reinforcement for Concrete Structures; International Federation for Structural Concrete: Lausanne, Switzerland, 2019; Volume 90, ISSN 1562-3610. Available online: https://hdl.handle.net/1854/LU-8657278 (accessed on 1 July 2019).
- Alliche, A. Damage model for fatigue loading of concrete. Int. J. Fatigue 2004, 26, 915–921. [Google Scholar] [CrossRef]
- Breitenbücher, R.; Ibuk, H. Experimentally Based Investigations on the Degradation-Process of Concrete Under Cyclic Load. Mater. Struct. 2006, 39, 717–724. [Google Scholar] [CrossRef]
- Göringer, J.; Foglar, M.; Jiříček, P. Impact performance of specimens subjected to fatigue loading—Experimental investigation. EPJ Web Conf. 2015, 94, 01058. [Google Scholar] [CrossRef]
- Liu, F.; Zhou, J. Fatigue Strain and Damage Analysis of Concrete in Reinforced Concrete Beams under Constant Amplitude Fatigue Loading. Shock Vib. 2016, 2016, 1–7. [Google Scholar] [CrossRef]
- Yadav, I.; Thapa, K. Fatigue Damage Model of Concrete Materials. Theor. Appl. Fract. Mech. 2020, 108. [Google Scholar] [CrossRef]
- Huang, W.; Gong, F.; Jin, W.; Maekawa, K. Numerical analysis of high and low-cycle flexural fatigue for reinforced concrete beams under full-range of varying amplitudes. Struct. Concr. 2021, 22, 2167–2183. [Google Scholar] [CrossRef]
- Huang, C.; Zhang, R.; Zhang, J.; Guo, X.; Wei, P.; Wang, L.; Huang, P.; Li, W.; Wang, Y. A novel method for fatigue design of FRP-strengthened RC beams based on machine learning. Compos. Struct. 2025, 359, 118867. [Google Scholar] [CrossRef]
- Maekawa, K.; Toongoenthong, K.; Gebreyouhannes, E.; Kishi, T. Direct Path-Integral Scheme for Fatigue Simulation of Reinforced Concrete in Shear. J. Adv. Concr. Technol. 2006, 4, 159–177. [Google Scholar] [CrossRef]
- Ibrahim, N.; Elkholy, S.; Godat, A. Finite Element Simulation of Reinforced Concrete Beams under Fatigue Loading. In Proceedings of the Seventh World Congress on Civil, Structural, and Environmental Engineering (ICSECT’22). 2022, Seventh World Congress on Civil, Structural, and Environmental Engineering (ICSECT’22), Lisbon, Portugal, 10–12 April 2022. [Google Scholar]
- Elkholy, S.; Salem, M.; Godat, A. Finite Element Models on Shear Behavior of Deep Beams Prepared Using Steel Fiber-Reinforced Recycled Coarse Aggregate Concrete. Fibers 2025, 13, 160. [Google Scholar] [CrossRef]
- Isojeh, B. Fatigue Damage Analysis of Reinforced Concrete Structural Elements. Ph.D. Thesis, University of Toronto, Toronto, ON, Canada, 2017. [Google Scholar]
- Isojeh, B.; Vecchio, F. Manual for Fatigue Analysis of RC Structural Elements Using Vector 2; Safe Technology Limited: Singapore, 2017. [Google Scholar]
- Wong, P.S.; Vecchio, F.J.; Trommels, H. Vector2 Formworks User’s Manual, 2nd ed.; University of Toronto: Toronto, ON, Canada, 2013. [Google Scholar]
- Baingo, D. A Framework for Stochastic Finite Element Analysis of Reinforced Concrete Beams Affected by Reinforcement Corrosion. Ph.D. Thesis, University of Ottawa, Ottawa, ON, Canada, 2012. [Google Scholar] [CrossRef]
- Mohamed, K.A. Performance and Strut Efficiency Factor of Concrete Deep Beams Reinforced with GFRP Bars. Ph.D. Thesis, Université De Sherbrooke, Sherbrooke, QC, Canada, 2015. [Google Scholar]
- Rezvanisharif, M.; Ketabi, M.S. FE Modeling and Seismic Performance Evaluation of Hybrid SMA-Steel RC Beam-Column Joints. Lat. Am. J. Solids Struct. 2019, 16, e192. [Google Scholar] [CrossRef]
- CSA A23.3-19; Design of Concrete Structures. Standard CSA-A23.3-19. Canadian Standards Association: Toronto, ON, Canada, 2019.
- Vecchio, F.; Collins, M. The Modified Compression-Field Theory for RC Elements Subjected to Shear. J. Am. Concr. Inst. 1986, 83, 219–281. [Google Scholar]
- Habibi, S. Finite Element Modelling of Corrosion-Damaged Reinforced Concrete Structures. Master’s Thesis, University of Toronto, Toronto, ON, Canada, 2017. Available online: https://www.proquest.com/docview/1934400235?pq-origsite=gscholar&fromopenview=true (accessed on 1 January 2017).
- Salgado, R.; Guner, S. A Numerical Analysis Methodology for the Strengthening of Deep Cap Beams. Spec. Publ. Adv. Concr. Bridges Des. Constr. Eval. Rehabil. 2019, 333, 1–18. [Google Scholar] [CrossRef]
- Baji, H.; Eslami, A.; Ronagh, H.R. Development of a nonlinear FE modelling approach for FRP-strengthened RC beam-column connections. Structures 2015, 3, 272–281. [Google Scholar] [CrossRef]
- Dutta, B.; Nath Nayak, A.; Nanda, B.; Dirar, S. Reinforced concrete deep beam shear retrofitted with deep embedded bars: A numerical investigation. Mater. Today Proc. 2022, 60, 281–287. [Google Scholar] [CrossRef]
- Isojeh, B.; Vecchio, F. Parametric Damage of Concrete under High-Cycle Fatigue Loading in Compression. In Proceedings of the 9th International Conference on Fracture Mechanics of Concrete and Concrete Structures, Berkeley, CA, USA, 29–1 May–June 2016. [Google Scholar] [CrossRef]
- Al-Rousan, R.; Issa, M. Fatigue performance of reinforced concrete beams strengthened with CFRP sheets. Constr. Build. Mater. 2011, 25, 3520–3529. [Google Scholar] [CrossRef]
- Arafa, A.; Ahmed, N.; Farghaly, A.S.; Chaallal, O.; Benmokrane, B. Exploratory Study on Incorporating Glass FRP Reinforcement to Control Damage in Steel-Reinforced Concrete Bridge Pier Walls. J. Bridge Eng. 2021, 26, 04020116. [Google Scholar] [CrossRef]
- Kent, D.C.; Park, R. Flexural Members with Confined Concrete. J. Struct. Div. 1971, 97, 1969–1990. [Google Scholar] [CrossRef]
- Hordijk, D.A. Local Approach to Fatigue of Concrete. Ph.D. Thesis, Technische Universiteit Delft, Delft, The Netherlands, 1993; p. 0368. Available online: https://www.elibrary.ru/item.asp?id=6852485 (accessed on 29 October 1993).
- IS 456; Plain and Reinforced Concrete—Code of Practice. Bureau of Indian Standards: New Delhi, India, 2000.
- Menin, R.; Trautwein, L.; Bittencourt, T. Smeared Crack Models for Reinforced Concrete Beams by Finite Element Method. Rev. Ibracon Estrut. E Mater. 2009, 2, 166–200. [Google Scholar] [CrossRef]
- Isojeh, B.; El-Zeghayar, M.; Vecchio, F. Concrete Damage under Fatigue Loading in Uniaxial Compression. ACI Mater. J. 2017, 114, 225–235. [Google Scholar] [CrossRef]
- Isojeh, B.; El-Zeghayar, M.; Vecchio, F. Simplified Constitutive Model for Fatigue Behavior of Concrete in Compression. J. Mater. Civ. Eng. 2017, 29. [Google Scholar] [CrossRef]
- Vecchio, F. Disturbed Stress Field Model for RC: Validation. J. Struct. Eng. 2001, 127, 350–358. [Google Scholar] [CrossRef]
- Lü, P.; Li, Q.; Song, Y. Damage Constitutive of Concrete under Uniaxial Alternate Tension–Compression Fatigue Loading Based on Double Bounding Surfaces. Int. J. Solids Struct. 2004, 41, 3151–3166. [Google Scholar] [CrossRef]
- Yu, S.; Sun, Z.; Yu, J.; Yang, J.; Zhu, C. An improved meshless method for modeling the mesoscale cracking processes of concrete containing random aggregates and initial defects. Constr. Build. Mater. 2023, 363, 129770. [Google Scholar] [CrossRef]
- Murthy, A.R.; Karihaloo, B.L.; Vindhya Rani, P.; Shanmuga Priya, D. Fatigue behaviour of damaged RC beams strengthened with ultra high performance fibre reinforced concrete. Int. J. Fatigue 2018, 116, 659–668. [Google Scholar] [CrossRef]
- Papakonstantinou, C.; Balaguru, P.; Petrou, M. Analysis of Reinforced Concrete Beams Strengthened with Composites Subjected to Fatigue Loading. ACI Spec. Publ. SP 2002, 206, 41–60. [Google Scholar] [CrossRef]
- Asgari, B.; Osman, S.; Adnan, A. Sensitivity Analysis of the Influence of Structural Parameters on Dynamic Behaviour of Highly Redundant Cable-Stayed Bridges. Adv. Civ. Eng. 2013, 2013, 1–11. [Google Scholar] [CrossRef]
- Vass, G. Finite Element Modelling of Different Strengthening Strategies for Reinforced Concrete Deep Beams. [Université de Liège > conv Erasmus en sc Appl]. Master’s Thesis, Université de Liège, Liège, Belgium, 2018. Available online: https://matheo.uliege.be/handle/2268.2/4439 (accessed on 1 January 2018).
- Baktheer, A.; Chudoba, R. Experimental and theoretical evidence for the load sequence effect in the compressive fatigue behavior of concrete. Mater. Struct. 2021, 54, 82. [Google Scholar] [CrossRef]
- Godat, A.; Qu, Z.; Lu, X.Z.; Labossière, P.; Ye, L.P.; Neale, K.W. Size Effects for Reinforced Concrete Beams Strengthened in Shear with CFRP Strips. J. Compos. Constr. 2010, 14, 260–271. [Google Scholar] [CrossRef]
- Luo, C.; Yang, P.; Niu, Y.; Zhang, Y.; Cheng, C. Analytical method of incorporating failure probability to predict the fatigue life of ultra-high-performance concrete (UHPC). Front. Built. Environ. 2024, 10, 1403245. [Google Scholar] [CrossRef]
- Al-musawi, H.; Figueiredo, F.P.; Guadagnini, M.; Pilakoutas, K. Shrinkage properties of plain and recycled steel–fibre-reinforced rapid hardening mortars for repairs. Constr. Build. Mater. 2019, 197, 369–384. [Google Scholar] [CrossRef]
- Ding, Y.; Fang, Y.; Jin, W.; Zhang, J.; Li, B.; Mao, J. Numerical Method for Creep Analysis of Strengthened Fatigue-Damaged Concrete Beams. Buildings 2023, 13, 968. [Google Scholar] [CrossRef]
- Zhu, L.; Wang, J.; Li, X.; Zhao, G.Y.; Huo, X.J. Experimental and numerical study on creep and shrinkage effects of ultra high-performance concrete beam. Compos. Part B 2020, 184, 107713. [Google Scholar] [CrossRef]
- Dellepiani, M.G.; Vega, C.R.; Pina, J.C.; Flores, E.I. Numerical investigation on the creep response of concrete structures by means of a multi-scale strategy. Constr. Build. Mater. 2020, 263, 119867. [Google Scholar] [CrossRef]


Disclaimer/Publisher’s Note: The statements, opinions and data contained in all publications are solely those of the individual author(s) and contributor(s) and not of MDPI and/or the editor(s). MDPI and/or the editor(s) disclaim responsibility for any injury to people or property resulting from any ideas, methods, instructions or products referred to in the content. |
© 2025 by the authors. Licensee MDPI, Basel, Switzerland. This article is an open access article distributed under the terms and conditions of the Creative Commons Attribution (CC BY) license.