Abstract
This paper investigates risk factors and their propagation pathways in multinational building projects. An initial set of 30 key risk variables associated with transnational engineering projects was identified. Using Interpretive Structural Modeling (ISM), we constructed a hierarchical framework to elucidate the interrelationships and transmission dynamics among risk factors. The Cross-Impact Matrix Multiplication Applied to Classification (MICMAC) method was then employed to categorize these factors into three distinct layers: root causes, intermediaries, and surface-level outcomes. Our analysis revealed 16 risk transmission pathways. Among the 30 variables, four were identified as root drivers, 22 as propagation factors, and four as surface triggers. Risk typically migrates from the root layer to the surface within three to four steps. Notably, ten factors—most prominently stakeholder demand mismatch, sociocultural conflict, and inefficient information exchange—collectively account for 55% of the total causal influence, forming the “risk core” of the system. This study enhances the theoretical understanding of risk evolution in international construction projects and offers practical guidance for effective risk management.
1. Introduction
In the context of the accelerating pace of globalization, transnational construction projects have emerged as a vital force in driving international economic cooperation and infrastructure development. However, these large-scale projects are fraught with complex and interrelated risks, leading to frequent project failures, significant economic losses, and far-reaching socio-economic impacts. Although existing research has made progress in identifying risk factors, it remains largely fragmented—often focusing on a single isolated dimension of project vulnerability and lacking a systematic or empirical classification of their interrelationships. This fragmented approach fails to capture the overall risk structure of transnational projects, leaving managers and policymakers without a clear roadmap for predicting, mitigating, or responding to cascading failures. As the scale and geographical scope of such projects continue to expand, the urgency of establishing a holistic and hierarchical understanding of their risk mechanisms has become increasingly apparent.
This study offers novel insights into the mechanisms underlying the impact of risk factors in transnational construction projects. By virtue of this study, engineering managers can clarify the hierarchy of risks and the transmission pathways of risks in transnational construction projects, thereby facilitating the development of risk control measures by managers of such projects.
2. Literature Review
2.1. Risk Classification
Researchers have classified risk concerns in multinational engineering projects from multiple viewpoints. Initial studies often classified these risk factors into two main categories: external risks and internal risks. External risks pertain to uncertainties in the project’s external environment and mainly consist of natural environment risks (such as earthquakes, floods, and extreme weather conditions) [1], political risks (such as policy changes, wars, and expropriation) [2], economic risks (such as exchange rate fluctuations, inflation, and changes in market demand) [3], and socio-cultural risks (such as labor conflicts, religious customs, and community resistance) [4]. Internal risks, on the other hand, refer to uncertainties within the organization during project implementation and primarily include technical risks (such as design flaws and immature construction techniques) [3], management risks (such as decision-making errors and improper resource allocation), and contractual risks (such as ambiguous terms and claim disputes). Additionally, some scholars [5] have classified risks from the perspective of the entire project life cycle, dividing them into pre-project risks (such as deviations in feasibility studies and errors in bidding strategies), design phase risks (such as conflicts in standards and design changes), construction phase risks (such as supply chain disruptions and safety accidents), and operation phase risks (such as overruns in maintenance costs and insufficient market demand).
Recent research has increasingly utilised more thorough classification frameworks for risks in multinational engineering projects. These frameworks generally include target risks (such as conflicts among stakeholders’ objectives and compliance failures) [6], environmental risks (including geopolitical issues, market volatility, and natural disasters) [7], technical risks (involving differences in technical standards and insufficient maturity of innovative technologies), organizational risks (such as barriers in cross-cultural management and inefficient team collaboration) [8], information risks (arising from delays in data transmission and the presence of information silos) [9], and management risks (including lengthy decision-making processes and reliance on single financing channels) [10]. This classification approach provides a more systematic coverage of the diverse uncertainties faced by transnational engineering projects, thereby offering clearer guidance for risk management.
Current taxonomies of risk are overly broad, lacking the detailed specificity required for the unique context of transnational engineering projects. A significant portion of the literature [5,11] continues to depend on simplistic dichotomies such as “internal vs. external risks” or “political–economic–technological” classifications, thereby failing to differentiate risk types according to the project-specific contingencies inherent in transnational endeavors—specifically, the EPC (Engineering-Procurement-Construction) turnkey contracting model, consortium governance complexities, and conflicts among diverse technical standards.
2.2. Methods for Risk Identification
The evolution of the methodology for risk analysis in transnational engineering projects reflects the synergistic development of risk management theory and engineering practice. Early research primarily relied on qualitative analysis methods. Expert interviews, for instance, demonstrated unique value in identifying latent risks such as political risks, yet they were subject to significant subjectivity [12]. Case analysis, through systematic examination of failure cases, established a framework for risk pattern recognition, but its generalizability was constrained by the specificity of the cases studied [13]. The Delphi method, by conducting multiple rounds of expert surveys, effectively converged risk lists, but it was limited by its time-consuming nature and dependence on experts [14].
In recent years, risk analysis methods have shown a trend of integrating qualitative and quantitative approaches. Pitchaimuthu et al. [15] combined Interpretive Structural Modeling (ISM) with System Dynamics (SD), using ISM to identify key risk factors and then employing SD to simulate the dynamic evolution process. This approach was successfully applied to risk analysis in Belt and Road projects. Chen et al. [16] innovatively introduced Social Network Analysis (SNA), using centrality analysis to identify key nodes in the risk network and uncovering risk aggregation phenomena that were difficult to detect with traditional methods. Machine learning methods, such as the XGBoost (eXtreme Gradient Boosting) algorithm [17], have achieved an accuracy rate of 89% in risk early warning, while Long Short-Term Memory (LSTM) neural networks have shown excellent performance in time-series risk prediction, although they face the issue of being a “black box.” Digital twin technology [18] has enabled real dynamic risk assessment by establishing real-time interaction between physical projects and virtual models, but it requires a robust Internet of Things (IoT) infrastructure to support its implementation.
The methodological literature [19] indicates that ideal research on engineering risk management should achieve “triangulation”: the theoretical dimension (literature review), the expert dimension (Sheffield method), and the practice dimension (questionnaire survey). This study strictly follows this paradigm by first establishing an initial framework through a literature review, then refining it iteratively with expert input, and finally validating it with questionnaire data, thus forming a complete methodological chain. Particularly in addressing unique issues of transnational engineering projects, such as cultural risks and conflicts in technical standards, this mixed-method approach identifies 23% more key risk factors than a single method [20].
Nevertheless, prevailing approaches to risk-factor identification have yet to embrace triangulated validation, thereby undermining the credibility of their findings. Most studies rely on a single method—such as expert elicitation or machine-learning algorithms—without addressing the absence of theory-expert-practice triangulation [21]. For instance, although Yang et al. [22] report an 89% accuracy for their XGBoost model, the training data remain undisclosed and thus non-replicable, and the model offers no theoretical or empirical account of how latent risks such as “technical-standard conflicts” are identified.
2.3. Contributions of This Study
Question 1: Existing risk frameworks for transnational construction projects suffer from coarse contextual granularity and limited practical applicability. Can a more fine-grained and systemically comprehensive risk taxonomy be developed?
To address this question, we propose a six-dimensional risk taxonomy that decomposes into 30 specific risk factors. The schema furnishes an operationally detailed, systemic theoretical lens for mapping the full risk profile of transnational construction endeavors.
Question 2: Existing research offers insufficient specification of the mechanisms by which risks propagate across factors, thereby depriving managers of the means to pinpoint root causes and disrupt propagation routes. Can an empirically validated, multi-layer causal hierarchy and set of propagation channels be uncovered?
In response, we integrate Interpretative Structural Modeling (ISM) with MICMAC analysis to construct a four-level causal hierarchy and identify sixteen empirically grounded risk-propagation pathways. This transforms an otherwise unordered risk set into a stratified, relationally transparent decision model, supplements the literature with evidence-based risk-transmission mechanisms, and equips practitioners with concrete levers for locating root causes and severing propagation routes.
3. Risk Factor Identification
3.1. Preliminary Identification of Risk Factors
To comprehensively identify the risk factors of transnational engineering projects, this paper integrates the characteristics of transnational construction projects with relevant literature to preliminarily identify various types of risks associated with transnational construction projects. External risks mainly include natural risks, geological risks, political risks, economic risks, social risks, and cultural risks; internal risks are primarily composed of technical risks, project execution risks, organizational management risks, and contract risks.
Based on the screening of the aforementioned risk factors and in combination with the characteristics of transnational engineering projects, we have categorized the risk factors of overseas construction projects into six dimensions, namely objectives, environment, technology, organization, information, and management. Drawing on existing research, we have compiled the risk factors of transnational engineering projects across these six dimensions and developed a survey questionnaire. The questionnaire was distributed to experts in this field. This study employed a two-round Delphi approach, inviting domain experts who had participated in transnational construction projects to assess the reasonableness of the risk factors and to propose revisions to the draft questionnaire based on their feedback. Table 1 summarizes their profiles.

Table 1.
Profiles of the Experts.
In Round 1 of the Delphi survey, risk factors for overseas construction projects were discussed with the experts. Based on their responses, the risk factors initially extracted from the literature were supplemented and refined as follows.
① The scope of “project complexity” is too broad; it can cover objectives, organization, technology, environment, management, and more. Therefore, this paper replaces “project complexity” with “technical complexity.”
② The term “organizational risk” is inappropriate and is rephrased as “risk of dynamic adaptation of organizational structure.”
③ The expression “BIM technology risk” is also unsuitable and is revised to “risk of digital collaboration technology failure.”
In the second-round Delphi interview, experts were asked to evaluate the risk factors revised in Round 1. The results showed that the experts essentially reached a consensus on the revisions.
After two rounds of Delphi interviews, a consolidated set of 34 risk factors specific to transnational construction projects was established across six dimensions: objectives, environment, technology, organization, information and management, as detailed below.
Objectives dimension: Inconsistency in Project Objectives at Various Stages (V1); Compliance Objectives Failure Risk (V2); Conflict of Sustainable Development Goals (V3); Stakeholder Coordination Failure Risk (V4); Inconsistent Needs of Stakeholders (V5); Project Milestone Breach Risk (V6).
Technology dimension: Dynamic Adaptation Risk of Technical Standards (V7); Engineering Design Integrity Risk (V8); Process Change Chain Risk (V9); Innovation Technology Maturity Risk (V10); Digital Collaboration Technology Failure Risk (V11); Technical Complexity Risk (V12).
Organization dimension: Cross-Cultural Governance Efficiency Risk (V13); Dynamic Adaptation Risk of Organizational Structure (V14); Team Collaboration Efficiency Decline Risk (V15); Improper Allocation of Project Management Resources Risk (V16); EPC Collaboration Failure Risk (V17).
Environment dimension: Consortium Strategic Deviation Risk (V18); Localization of Resource Integration Risk (V19); Geopolitical Extreme Risk (V20); Market Environment Perception Bias Risk (V21); Supply Chain Resilience Insufficiency Risk (V22); Socio-Cultural Conflict Risk (V23); Natural Disasters and Climate Risk (V24).
Information dimension: Information Uncertainty (V25); Inefficient Information Communication (V26).
Project Information Collaboration Barrier Risk (V27); Information Acquisition Capability and Extent (V28).
Management dimension: Improper Project Management Decision-Making Process (V29); Uncertainty in Project Management Methods and Tools (V30); Insufficiently Diversified Financing Channels (V31); Project Contract Relationship (V32); Technology Transfer Compliance Risk (V33); Improper Allocation of Project Management Resources Risk (V34).
3.2. Design and Distribution of the Questionnaire
This study developed questionnaire items and used a 5-point Likert scale to evaluate the 34 risk variables across the six dimensions, based on the six risk dimensions and 34 risk factors listed in Table 2. The following is how the scale was adjusted based on how significant each risk element was thought to be in relation to international building projects: 3 = “Moderate,” 4 = “Important,” and 5 = “Very Important,” Two is “Unimportant,” and one is “Very Unimportant.”
Table 2.
Further Reliability Analysis of Measurement Data for Risk Factors in Multinational Construction Projects.
In addition to academic specialists, university teachers, and doctoral and master’s degree students involved in engineering research, the poll also targeted practitioners with experience in international construction projects. 246 people answered the survey, which was sent out between April and May of 2025. A final sample of 211 valid responses, with an effective response rate of 86.1%, was obtained after 35 invalid questionnaires were eliminated throughout the screening process. Incomplete or missing responses, duplicate responses within the same project, and responses that were uniform or systematic, suggesting a lack of effort, were among the criteria used to weed out surveys that were deemed invalid. A total of 53.6% of the respondents had at least four years of work experience in international construction projects, and 79.6% of the valid questionnaires were filled out by people with a bachelor’s degree or above. The respondents’ extensive work experience and high level of education guaranteed both the efficacy of the survey and the calibre of the questionnaire responses. Stata 15 software was used to analyse the data.
3.3. Multivariate Data Analysis of the Sample
3.3.1. Reliability Analysis
Cronbach’s α coefficient, Cronbach’s α values after item deletion, and corrected item–total correlation (CITC) were used in this study to assess the data’s reliability. Better internal consistency and reliability of the questionnaire are indicated by higher Cronbach’s α values, which range from 0 to 1. Generally speaking, an α score less than 0.7 indicates poor consistency, which may call for the addition or removal of pertinent items. The CITC value is used to assess the consistency of individual items with the rest of the items. A CITC value of no less than 0.3 is considered acceptable for the consistency of the item with other items.
The Cronbach’s α value after item deletion reflects the change in the internal consistency coefficient of the subscale composed of the remaining items after removing a particular item. Generally, if the Cronbach’s α value after deleting a specific item is lower than the overall Cronbach’s α value, it indicates that the item has a positive effect on the internal consistency of the entire questionnaire, suggesting better internal consistency of the questionnaire.
For 34 risk factors, we performed a reliability analysis on the survey data. The total measuring scale has a high degree of reliability, as indicated by the overall Cronbach’s α coefficient of 0.8825, which is higher than 0.7. However, V16, V17, V32, and V34 did not fulfil the criterion since their Corrected Item-Total Correlation (CITC) values were all less than 0.3. Consequently, it is necessary to eliminate V16, V17, V32, and V34 from the analysis.
Table 2 provides additional examination of the measurement data’s dependability following item deletion. When V16, V17, V32, and V34 are eliminated, the total Cronbach’s α is 0.9094, which is higher than 0.7. Following the deletion of each item, the Cronbach’s α values are all less than the total Cronbach’s α value. Thus, after removing V16, V17, V32, and V34, the measurement data’s overall reliability satisfies the criteria.
3.3.2. Exploratory Factor Analysis
Considering that there may be relatively strong correlations among the risk factors of overseas construction projects, it is necessary to employ exploratory factor analysis (EFA) to classify the 30 risk factors analyzed above. Prior to conducting the EFA, the Kaiser–Meyer–Olkin (KMO) measure and Bartlett’s test of sphericity should be performed to determine whether the variables are suitable for factor analysis. The KMO value ranges from 0 to 1. Higher values indicate stronger correlations among variables and greater suitability for factor analysis. The KMO value for the measurement data of risk factors in multinational construction projects is 0.806 (greater than 0.7), and the significance level of Bartlett’s test of sphericity is 0.000 (less than 0.001), indicating that there are correlations among the risk factors of overseas construction projects, and exploratory factor analysis can be conducted.
Since the risk factors in Section 3.1 are not consecutively numbered, we have renumbered the risk factors. The renumbered risk factors for multinational construction projects are shown in Table 3.
Table 3.
List of Risk Factors for Multinational Construction Projects.
The rotated factor loading matrix of risk factors for multinational construction projects is shown in Table 4. The 30 risk factors of multinational construction projects are classified into six principal components, each of which includes several sub-factors. The cumulative variance explained is 69.857% (greater than 60%), and the loadings of the 30 factors are all greater than 0.5, indicating that the classification of the six principal components is appropriate. The six principal factors are named as follows: Objective Risk, Environmental Risk, Technical Risk, Organizational Risk, Information Risk, and Management Risk.
Table 4.
Rotated Factor Loading Matrix of Risk Factors for Multinational Construction Projects.
3.3.3. Confirmatory Factor Analysis
In the confirmatory factor analysis, we employed multiple indices to evaluate the fit of the confirmatory factor analysis model for the six dimensions of risk in overseas construction projects. The criteria for judgment are detailed in Table 5.
Table 5.
Fit Indices and Criteria for Confirmatory Factor Analysis Model.
The fit indices statistics for the confirmatory factor analysis 6 models of the risk factors in multinational construction projects are shown in Table 6. Table 6 indicates that the model has a good fit, suggesting that objective risk can be measured as a single dimension.
Table 6.
Fit Indices Statistics for Risk Factor Models.
4. Analysis of the Relationships and Pathways of Risk Factors
4.1. Principle of the ISM-MICMAC Method
4.1.1. Principle of ISM
ISM integrates expert experience, practical knowledge, and computer technology to decompose a complex system into subsystems, analyzes the relationships among elements with logical operations, and finally builds a hierarchical multilevel structural model. The ISM workflow comprises four sequential steps:
Definition of the factor set S: Identify and select all elements S that are pertinent to the problem or system under investigation.
- (1)
- Construction of the adjacency matrix A: Systematically compare each pair of factors to determine the presence or absence of a direct causal relationship, and encode these pairwise judgments in the binary adjacency matrix A.where aᵢⱼ denotes whether factor sᵢ exerts a direct influence on factor sⱼ (aᵢ = 1 if the influence exists, and aᵢⱼ = 0 otherwise).
- (2)
- Computation of the reachability matrix M is performed using the following formula:where I denotes the identity matrix, and n represents the maximum path length (i.e., the largest number of transitive steps in the absence of feedback loops) required to achieve the reachability matrix.
- (3)
- Partition the factors into distinct regions and hierarchical levels to construct the interpretive structural model.
The hierarchical levels and directional influences among factors are then derived from the adjacency matrix. By integrating these levels and directed links, a structured model is generated that explicitly depicts the causal relationships among the influencing factors.
4.1.2. Principle of MICMAC
In the analysis of complex systems, ISM alone is not sufficient to fully assess the dynamic roles of various factors within the system. To address this limitation, the present study incorporates the Cross-Impact Matrix Multiplication Applied to Classification (MICMAC) method to further dissect the influence of each factor. MICMAC quantifies two key attributes for every factor—driving power and dependence—thereby offering a critical complement to system analysis. Specifically, driving power denotes the extent to which a factor influences others (i.e., the number of factors it can affect), whereas dependence measures the degree to which a factor is influenced by others (i.e., the number of factors that affect it). The MICMAC procedure comprises four sequential steps:
- (1)
- Compute the driving power and dependence for each influencing factor.
- (2)
- Construct a four-quadrant matrix.
- (3)
- Classify the influencing factors accordingly.
- (4)
- Generate the MICMAC diagram.
4.2. ISM Model for Risk Factors in Transnational Construction Projects
4.2.1. Adjacency Matrix Based on Interrelationships Among Factors
This study identifies 30 critical risk factors in transnational construction projects, confirming their interdependence and formation of a complex risk network. Using ISM and MICMAC methods, it transforms fragmented risks into a hierarchical model, clarifying each factor’s position and role. This provides a systematic framework for risk management. Semi-structured interviews with eight experts (details in Table 1) across three iterative rounds refined assessments and identified direct causal linkages among the factors.
Round 1: Each expert received a 30 × 30 matrix and independently indicated whether factor i “directly influences” factor j (yes/no). A preliminary adjacency matrix was constructed using a 5-out-of-8 majority rule (yes ≥ 5 → 1; yes ≤ 2 → 0).
Round 2: Factor pairs that fell in the “intermediate zone” (3 ≤ yes ≤ 5) were re-submitted to the panel together with Round 1 frequency distributions and brief justifications. Experts could revise their earlier answers; the revised scores were aggregated using the same threshold.
Round 3: The third-round interviews validated the accuracy and reliability of the findings from the first two rounds. The same eight experts reviewed the consolidated results to ensure the derived relationships matched real-world conditions and accurately reflected the direct influences among risk factors.
Based on the inventory of risk factors in transnational construction projects presented in Table 6 and following deliberation by the expert panel, the pairwise direct-influence relationships were determined. These relationships were encoded to construct the adjacency matrix, as depicted in Figure 1.

Figure 1.
Adjacency Matrix.
4.2.2. Reachability Matrix and Hierarchical Representation of Risk Influencing Factors
The reachability matrix can be derived from the adjacency matrix by applying the transitive-closure principle: if factor a can directly or indirectly influence factor b, and factor b can directly or indirectly influence factor c, then factor a must be able to influence factor c. Given the large number of risk factors considered in this study, the computational formula is expressed as M = (A + I) n + 1 = (A + I) n ≠ …(A + I) 2 ≠ (A + I), where I denotes the identity matrix, and n represents the maximum number of transitive steps (i.e., the longest acyclic path length) required to achieve the reachability closure. Consequently, the computation was implemented in MATLAB (2018a). Iterative analysis reveals that the adjacency matrix converges to the reachability matrix after six iterations, indicating that the 30 factors are stratified into six hierarchical levels. The resulting reachability matrix is presented in Figure 2.
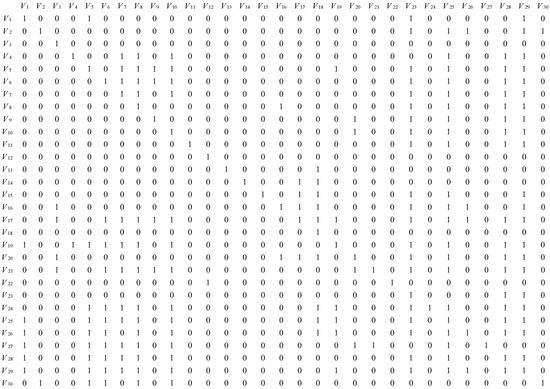
Figure 2.
Reachability Matrix.
Based on the reachability matrix, the reachability set, antecedent set, and their intersection were computed for each factor. For instance, the reachability set of V1 comprises factors (V1, V5, V23, V29), its antecedent set is (V1, V19, V25, V26, V27, V28, V29), and their intersection is (V1, V19, V29). A factor is retained at the current hierarchy level if and only if its reachability set is identical to this intersection. Factors V3, V12, V15, and V23 satisfy this criterion and are therefore assigned to Level 1.
After removing the Level 1 risk factors V3, V12, V15, and V22, a new reachability matrix is generated. Repeating the computations for the reachability set, antecedent set, and their intersection identifies the Level 2 risk factors as V8, V9, V13, V16, V24, and V25. Finally, the risk factors of multinational construction projects are divided into six levels: Level 1 (V3, V12, V15, V23); Level 2 (V8, V9, V13, V16, V24, V25); Level 3 (V2, V4, V10, V11, V17, V29, V30); Level 4 (V6, V7, V14, V20); Level 5 (V18, V19, V21, V27, V28); Level 6 (V1, V5, V22, V26).
4.2.3. Hierarchy of Transnational Construction Project Risks
Based on the hierarchical partitioning derived from the reachability matrix and the direct mutual-influence relationships between any two distinct factors recorded in the adjacency matrix, the ISM model of risk-inducing factors was constructed and is presented in Figure 3.
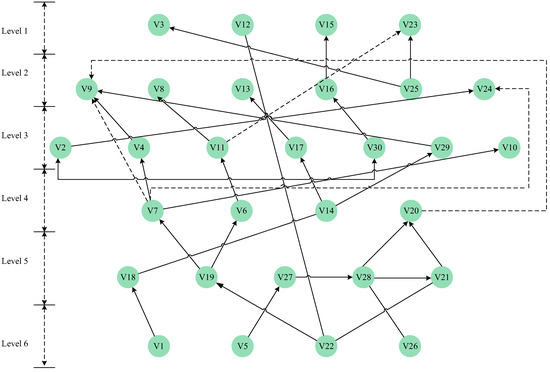
Figure 3.
ISM of Risk Factors in Transnational Construction Projects.
Six different levels are created by stratifying the elements according to the direction in which risk influences propagate. At the bottom of the interpretive structural model are goal-related and environmental variables, which dominate levels L4, L5, and L6. On the other hand, the elements in L2 and L3 mostly consist of management and organisational aspects. These dimensions are located in the levels in between the fundamental and surface-level elements. These intermediary elements directly impact and limit the items in L1. Even though their effects are not as obvious as those in L1, they are nevertheless important factors that should not be disregarded when determining whether international building projects succeed or fail.
4.3. MICMAC Model of Risk Factors in Transnational Construction Projects
4.3.1. Dependence–Driving Power of Risk Factors
Using the reachability matrix shown in Figure 2, we calculated the driving power (D) and dependence (De) of each risk-inducing factor within the transnational construction project system. Specifically, the driving power of a factor is obtained by summing the “1”s in its corresponding row, whereas the dependence is determined by summing the “1”s in its corresponding column. To quantify the relative relationship between driving power and dependence, we introduce the ratio λ = D/De. Table 7 presents the computed λ values for all risk-inducing factors.
Table 7.
Dependence and Driving Power of Each Risk Factor.
4.3.2. MICMAC Classification
Utilizing the dependence and driving-power values reported in Table 7, a MICMAC diagram was constructed to delineate the relational clusters among the risk-inducing factors. Four distinct groups—labeled Quadrants I, II, III, and IV—were identified and termed the Autonomous, Dependent, Linkage, and Independent (Driver) groups, respectively (Figure 4).
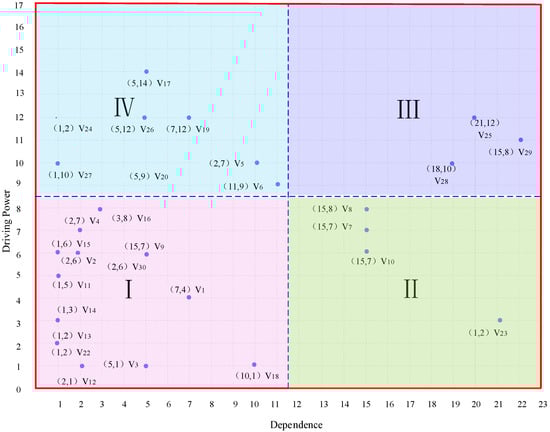
Figure 4.
Classification of transnational construction-project risk factors by dependence and driving power.
Quadrant I—Autonomous factors: These factors exhibit comparatively low dependence and low driving power. Their interconnections with other elements are relatively weak; nevertheless, they are not entirely isolated, as they both exert limited influence on, and are marginally affected by, the remaining factors.
Quadrant II—Dependent factors: Characterized by high dependence and low driving power, these factors are markedly susceptible to the influence of Linkage and Driver factors, yet they exert minimal influence themselves. Elevated dependence signifies dense systemic linkages and high malleability.
Quadrant III—Linkage factors: Simultaneously possessing high driving power and high dependence, these factors are intrinsically sensitive. Any managerial action directed at them will propagate throughout the system and simultaneously induce feedback effects on themselves. Only a small subset of risks resides in Quadrant III, indicating that while inter-factor influences exist, the overall systemic connectivity remains moderate; consequently, controlling a limited number of Linkage factors is insufficient to achieve comprehensive risk governance.
Quadrant IV—Independent (Driver) factors: With strong driving power and low dependence, these factors are capable of exerting pronounced influence on the remainder of the system. Therefore, managerial attention should be disproportionately concentrated on Driver factors during the risk-management process.
4.4. Hierarchical Analysis of Risk Factors in Transnational Construction Engineering Projects
4.4.1. Root-Level Causal Risk Determinants
The drivers in quadrant IV of the MICMAC categorisation diagram have significant driving power but weak dependence, which causes them to have a disproportionate amount of impact over the other elements. These root-level determinants comprise: (V5) misaligned stakeholder requirements, (V6) milestone slippage risk, (V17) localized resource-integration risk, (V19) market-environment misperception risk, (V20) insufficient supply chain resilience, (V24) information-transfer impediments, (V26) information uncertainty, and (V27) flawed project-management decision workflows.
Concurrently, the following latent variables display elevated λ values and thus warrant designation as root-level risks: (V4) sustainable-development goal conflicts (λ = 7/2), (V11) digital collaboration technology failure (λ = 5), (V14) dynamic organizational-structure misalignment (λ = 3), (V16) consortium strategic divergence (λ = 2), and (V22) socio-cultural conflict (λ = 12). Additionally, the risk of inconsistent project objectives across life-cycle phases (V1), positioned at level 6, should likewise be treated as a root-level causal determinant.
4.4.2. Outcome-Level Risk Determinants
The risk factors of level L1 are exclusively influenced by other factors. They exert no causal influence on any other element. Hence, they are classified as outcome-level determinants. These factors include: (V3) stakeholder-coordination failure risk, (V12) technological-complexity risk, (V15) team-collaboration performance decay, and (V23) information-acquisition capacity inadequacy. Although each is situated in quadrant I (autonomous cluster) of the MICMAC diagram, their λ values—1/5, 1/2, 1/6, and 1/7, respectively—indicate a markedly higher dependence than driving power, given that λ is defined as the ratio of driving power to dependence. Consequently, the four aforementioned factors are confirmed as outcome-level risks residing at L1 of the ISM hierarchy.
4.4.3. Transmission-Level Risk Determinants
Excluding the 17 factors classified as root-level (drivers) and outcome-level (dependents), the remaining 13 risk variables constitute the transmission stratum. These are: (V1) misaligned objectives across project phases, (V2) compliance-target failure, (V7) dynamic adaptation of technical standards, (V8) engineering-design integrity deficit, (V10) immaturity of innovative technologies, (V13) cross-cultural governance inefficacy, (V22) natural-hazard and climatic risks, (V25) information-integration barriers, (V28) managerial decision-making inertia, (V29) insufficient financing-channel diversification, and (V30) contractual disputes.
4.5. Pathway Analysis of Risk Factors in Transnational Construction Projects
4.5.1. Modes of Risk Elicitation
Systemic risk elicitation can be classified into two archetypes: primary (direct) elicitation and secondary (propagated) elicitation. Primary elicitation is the direct impact of endogenous and exogenous risk factors on the system, generating perturbation events that affect the normal operation of the system. Secondary elicitation, however, is triggered by the chain reaction of perturbation events, leading to additional perturbation events and the disruption of other subsystems. In transnational construction projects, these two elicitation modes frequently coexist.
However, this self-regulation breaks down and risk is triggered when the accumulated systemic risk load exceeds the adaptive threshold. Systemic risk is dynamic by nature, changing in reaction to changing influencing variables and interference sources. An increase in the quantity or severity of these sources increases the likelihood of system flaws and vulnerabilities, which in turn increases the departure from the desired goals. Figure 5 depicts the risk evolution trajectories for transnational construction projects under both primary and secondary elicitation scenarios.
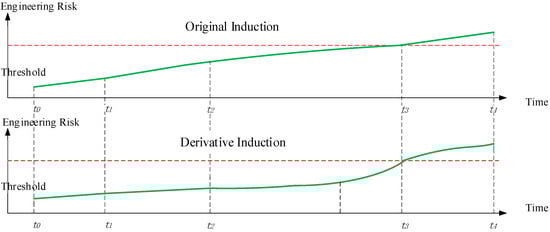
Figure 5.
Risk evolution trajectories in transnational construction projects.
4.5.2. Risk Propagation Pathways
The 16 propagation paths are derived from Figure 3: starting from the root-level risk factors, there are 16 main routes leading to the surface-level outcomes.
Path 1 Inconsistent objectives across project phases → consortium strategic divergence → dynamic misalignment of organizational structure → insufficient financing-channel diversification → cascading engineering-change risk.
Path 2 Inconsistent objectives across project phases → consortium strategic divergence → dynamic misalignment of organizational structure → localized resource-integration risk → cross-cultural governance inefficacy.
Path 3 Stakeholder requirement misalignment → inappropriate project-management decision workflow → managerial decision-making inertia → inadequate supply chain resilience → cascading engineering-change risk.
Path 4 Stakeholder requirement misalignment → inappropriate project-management decision workflow → managerial decision-making inertia → socio-cultural conflict → inadequate supply chain resilience → cascading engineering-change risk.
Path 5 Natural-hazard and climatic risks → market-environment misperception → dynamic misalignment of technical standards → cascading engineering-change risk.
Path 6 Natural-hazard and climatic risks → market-environment misperception → dynamic misalignment of technical standards → sustainable-development goal conflicts → cascading engineering-change risk.
Path 7 Natural-hazard and climatic risks → market-environment misperception → milestone slippage risk → inconsistent objectives across project phases → information-acquisition capacity inadequacy.
Path 8 Natural-hazard and climatic risks → technological complexity risk.
Path 9 Natural-hazard and climatic risks → socio-cultural conflict → inadequate supply chain resilience → cascading engineering-change risk.
Path 10 Information uncertainty → managerial decision-making inertia → inadequate supply chain resilience → cascading engineering-change risk.
Path 11 Dynamic misalignment of technical standards → contractual disputes → consortium strategic divergence → team-collaboration performance decay.
Path 12 Compliance-target failure → contractual disputes → consortium strategic divergence → team-collaboration performance decay.
Path 13 Contractual disputes → compliance-target failure → information-transfer impediments.
Path 14 Project information-integration barriers → stakeholder-coordination failure.
Path 15 Project information-integration barriers → information-acquisition capacity inadequacy.
Path 16 Dynamic misalignment of technical standards → information-transfer impediments.
To ensure that the 16 risk-transmission pathways derived from the ISM model are not merely logical constructs but also reflect real-world project situations, we conducted an empirical validation. Eight experts who participated in constructing the adjacency matrix (Table 1) rated the realism of each pathway on a five-point Likert scale. A pathway was considered validated if its mean score was ≥ 4.0 and the agreement rate (proportion of scores ≥ 4) was ≥75%. All pathways met these criteria, with an overall mean of 4.34, demonstrating that they capture actual project conditions. In addition, we assessed inter-rater consistency using Kendall’s coefficient of concordance; Kendall’s W was 0.77, indicating significant and strong agreement among the experts [23]. Therefore, the 16 risk-transmission pathways are empirically valid.
5. Implications for Engineering Managers
- (1)
- Management Implications for Addressing Root-Level Risks
The ISM model shows that inconsistent project phase goals (V1) and misaligned stakeholder needs (V5) are at the bottom level (Level 6) and act as the original driving force for higher-level risks. Engineering managers should focus on managing project goals. For example, they can use an “Objective-Requirement Coupling Matrix” at the project start to measure how well project goals (V1) match stakeholder needs (V5).
Natural disasters and climate risk (V22), which are external driving factors that internal project management cannot directly control, are likewise at the bottom level (Level 6). It is yet another unique factor that propels higher-level hazards. Project governance should first adopt a “resilience-oriented” approach at the strategy level, taking into account the probability distribution of extreme events while making decisions about the project life cycle. Second, engineering insurance and regionally distributed redundant supply chains can be used at the operations level to convert possible catastrophic losses into measurable financial expenses. Third, establishing a climate emergency response strategy at the organisational level helps guarantee that the project is stable even in the event of natural disasters.
One of the main causes of project risks is poor information flow (V26), which is also at the bottom level (Level 6). To enhance horizontal departmental coordination and vertical decision-making, a cross-functional information governance committee comprising representatives from project management, IT, legal, and local areas should be established. Operationally, to minimise the spread and amplification of uncertainty risks, an information synchronisation system should be put in place to promptly detect, escalate, and resolve information flow problems on the job site.
- (2)
- Management Implications for Addressing Transmission-Level Risk Factors
Engineering managers should regard the transmission layers (ISM Levels 3–5) as “amplifiers” for risk cascades. The primary concern is that interactions across different dimensions, such as those between technology and management or between organization and environment, can exacerbate risks. To address this issue, project managers can develop a three-step risk management model, namely “foresee, block, and immunize.”
Foresee: Use the risk transmission network to spot key points where risks can spread (like conflicts between tech standards and supply chain disruptions). Analyze how these risks might grow using coupling coefficients.
Block: Set up cross-functional buffers for sensitive points (like adding extra design capacity or backup plans) to stop risks from getting bigger early on.
Immunize: Keep some extra time in the schedule, build a flexible org structure, and spread out resources to make the project stronger against risks and better at bouncing back.
- (3)
- Management Implications for Addressing Outcome-Level Risk Factors
Risks in international construction projects can be readily triggered by outcome-level risk variables. Therefore, it is critical to eliminate or reduce these dangers as soon as possible. Use the risk transmission network as a roadmap to manage hazards in international building projects more effectively. In addition to managing the risks directly, pay attention to important transmission routes and parent node control. This can prevent the issue from spreading further and reduce the likelihood that it will occur. For instance, lessen the influence and probability of its parent nodes, such as “consortium strategic deviation risk” (V16), “project contract relationship” (V30), and “technical standards adaptation risk” (V7), while addressing “team collaboration decline risk” (V15).
6. Discussion
The Interpretive Structural Modeling (ISM) reveals a clearly defined six-level hierarchy, positioning fundamental elements including inconsistent project objectives (V1), misaligned stakeholder requirements (V5), and natural disaster and climate risks (V22) at the foundational level (Level 6). These factors function as deep-level drivers, exerting substantial influence throughout the entire system. This hierarchical structure underscores a critical management reality: addressing superficial symptoms without managing their root causes is likely to constitute an ineffective strategy.
In contrast to earlier frameworks that relied on broad classifications such as “internal vs. external” risks, this study contributes a structured and granular risk taxonomy specifically tailored to the context of transnational construction projects. Furthermore, by mapping 16 distinct risk propagation pathways, this research addresses a gap in the literature concerning how risks transmit across project subsystems.
The ISM-MICMAC analysis indicates that key risk factors (V5, V17, V19, V21, V24, V25, V26, V27, V28, V29) collectively contribute 55% of the total risk driving power. This finding validates the “risk kernel” principle suggested by loose coupling theory, wherein a very small number of latent variables can account for over half of the causal influence. Moreover, the sixteen identified transmission pathways provide a “roadmap” of risk propagation, clearly illustrating the process through which localized events can trigger project failure. This enables managers to monitor critical nodes and implement timely interventions to disrupt risk transmission.
While the ISM-MICMAC method excels at delineating structural relationships, it does not quantify the probability or intensity of these relationships. The model demonstrates that risks can propagate but does not indicate the likelihood of propagation or the scale of potential impacts. Future work should integrate quantitative techniques such as Bayesian Networks or Structural Equation Modeling to calibrate the strength and probability of the identified pathways, thereby enabling predictive risk analysis.
7. Conclusions
The main conclusions of this paper are as follows:
Inconsistency in Project Objectives at Various Stages (V1), Inconsistent Needs of Stakeholders (V5), Natural Disasters and Climate Risk (V22), and Information Uncertainty Risk (V26) function as the deep-seated “root drivers” of risk in transnational construction projects, whereas Stakeholder Coordination Failure Risk (V3), Information Acquisition Capability and Extent (V23), Technical Complexity Risk (V12), and Team Collaboration Efficiency Decline Risk (V15) operate as surface-level triggers.
Localization of Resource Integration Risk (V17), Market Environment Perception Bias Risk (V19), Inconsistent Needs of Stakeholders (V5), Socio-Cultural Conflict Risk (V21), Inefficient Information Communication (V24), Project Information Collaboration Barrier Risk (V25), Information Uncertainty Risk (V26), Improper Project Management Decision-Making Process (V27), Management Team Decision Lag Risk (V28), and Insufficiently Diversified Financing Channels (V29)—ten factors in total—collectively account for 55% of the total causal influence, constituting the system’s “risk kernel.”
Once a transnational project risk is triggered, it typically converges on one of two collapse endpoints, cascading engineering change or team collaboration decline within an average of three to four steps, with the contract, organization, and supply chain serving as the critical transmission channels.
Author Contributions
Conceptualization, Q.Y.; methodology, Q.Y.; software, Q.Y.; validation, Q.Y. and L.L.; formal analysis, Q.Y.; investigation, Q.Y.; resources, Q.Y.; data curation, Q.Y.; writing—original draft preparation, Q.Y.; writing—review and editing, L.L.; visualization, Q.Y.; supervision, L.L.; project administration, Q.Y.; funding acquisition, Q.Y. All authors have read and agreed to the published version of the manuscript.
Funding
This research was supported by the Social Science Planning Foundation of Liaoning Province, China (Grant No. L22AJY007) and the Basic Scientific Research Project of the Liaoning Provincial Department of Education (Grant No. LJKMR20221944).
Data Availability Statement
All data in this paper can be obtained by contacting the corresponding author.
Acknowledgments
We would like to acknowledge the support and feedback provided by researchers at Liaocheng University, Liaoning Institute of Science and Engineering, Fuyang Normal University and China State Construction Engineering Corporation.
Conflicts of Interest
The authors declare no conflicts of interest.
References
- Ebekozien, A.; Aigbavboa, C.; Ramotshela, M. A qualitative approach to investigate stakeholders’ engagement in construction projects. Benchmark. Int. J. 2024, 31, 866–883. [Google Scholar] [CrossRef]
- Gupta, R.; Das, B.; Jain, K. Risk management of oil refinery construction project: An Indian case study. Int. J. Proj. Organ. Manag. 2021, 13, 218–244. [Google Scholar] [CrossRef]
- Nguyen, T.; Nguyen, L.H.; Chileshe, N.; Hallo, L. Investigating critical risk factors of selecting joint venture contractors for infrastructure projects implementation in Vietnam. Int. J. Constr. Manag. 2023, 23, 2438–2451. [Google Scholar] [CrossRef]
- Larrondo-Ureta, A.; Ferreras-Rodríguez, E.-M. The potential of investigative data journalism to reshape professional culture and values. A study of bellwether transnational projects. Commun. Soc. 2021, 34, 41–56. [Google Scholar] [CrossRef]
- Afzal, F.; Yunfei, S.; Nazir, M.; Bhatti, S.M. A review of artificial intelligence based risk assessment methods for capturing complexity-risk interdependencies: Cost overrun in construction projects. Int. J. Manag. Proj. Bus. 2021, 14, 300–328. [Google Scholar] [CrossRef]
- Sang, S.; Lu, Z. Optimal Strategies for the Green Supply Chain with Reference Price Effect. Eng. Lett. 2025, 33, 3410–3419. [Google Scholar]
- Xiang, P.; Yang, S.; Yuan, Y.; Li, R. Integrated measurement of public safety risks in international construction projects in the belt and road initiative. Eng. Constr. Archit. Manag. 2024, 32, 4673–4699. [Google Scholar] [CrossRef]
- Jung, S.; Kim, S.-C.; Kim, D.-C. Analysis of the Impact of Enterprise Risk Management (ERM) on the Project Success through PRM Process: Focused on the Overseas Construction Projects. J. Korean Soc. Ind. Syst. Eng. 2024, 47, 93–106. [Google Scholar] [CrossRef]
- Chen, H.; Wan, A.; Peng, B. Configuration path identification of investment risk in China’s overseas energy projects: An exploration based on LDA and fsQCA. Environ. Prog. Sustain. Energy 2025, 44, e14549. [Google Scholar] [CrossRef]
- Yao, Q.; Shao, L. Selection of Low-Carbon Contractors in a Fuzzy Multi-Objective Environment. Eng. Manag. J. 2025, 1–19. [Google Scholar] [CrossRef]
- Faber, M.H.; Stewart, M.G. Risk assessment for civil engineering facilities: Critical overview and discussion. Reliab. Eng. Syst. Saf. 2003, 80, 173–184. [Google Scholar] [CrossRef]
- Wang, R.; Yang, K.; Guo, J.; Ma, C.; Chu, E.; Zhu, Y. Research on Design and Ideal Variable Transmission Ratio Control of Distributed Steering-By-Wire System. Eng. Lett. 2025, 33, 3345–3362. [Google Scholar]
- Tadayon, M.; Jaafar, M.; Nasri, E. An assessment of risk identification in large construction projects in Iran. J. Constr. Dev. Ctries. 2012, 17, 57–69. [Google Scholar]
- Ameyaw, E.E.; Hu, Y.; Shan, M.; Chan, A.P.; Le, Y. Application of Delphi method in construction engineering and management research: A quantitative perspective. J. Civ. Eng. Manag. 2016, 22, 991–1000. [Google Scholar] [CrossRef]
- Pitchaimuthu, S.; Thakkar, J.J.; Gopal, P. Modelling of risk factors for defence aircraft industry using interpretive structural modelling, interpretive ranking process and system dynamics. Meas. Bus. Excell. 2019, 23, 217–239. [Google Scholar] [CrossRef]
- Chen, W.; Deng, J.; Niu, L. Identification of core risk factors and risk diffusion effect of urban underground engineering in China: A social network analysis. Saf. Sci. 2022, 147, 105591. [Google Scholar] [CrossRef]
- Wei, Z.; Chen, Y.; Guo, K.; Liu, B.; Liu, Y.; Li, Y. Efficient Beam Search For Satellite Communications On The Move Systems. Eng. Lett. 2025, 33, 3311–3317. [Google Scholar]
- Luo, Q.; Sun, C.; Li, Y.; Qi, Z.; Zhang, G. Applications of digital twin technology in construction safety risk management: A literature review. Eng. Constr. Archit. Manag. 2025, 32, 3587–3607. [Google Scholar] [CrossRef]
- Dzwigol, H. Research methodology in management science: Triangulation. Virtual Econ. 2022, 5, 78–93. [Google Scholar] [CrossRef]
- Renz, S.M.; Carrington, J.M.; Badger, T.A. Two strategies for qualitative content analysis: An intramethod approach to triangulation. Qual. Health Res. 2018, 28, 824–831. [Google Scholar] [CrossRef]
- Fetters, M.D.; Curry, L.A.; Creswell, J.W. Achieving integration in mixed methods designs—Principles and practices. Health Serv. Res. 2013, 48, 2134–2156. [Google Scholar] [PubMed]
- Yang, J.; Li, Y.; Harper, D.; Clarke, I.; Li, J. Macro Financial Prediction of Cross Border Real Estate Returns Using XGBoost LSTM Models. J. Artif. Intell. Inf. 2025, 2, 113–118. [Google Scholar]
- Gadedjisso-Tossou, A.; Adjegan, K.I.; Kablan, A.K.M. Rainfall and temperature trend analysis by Mann–Kendall test and significance for Rainfed Cereal Yields in Northern Togo. Sci 2021, 3, 17. [Google Scholar] [CrossRef]
Disclaimer/Publisher’s Note: The statements, opinions and data contained in all publications are solely those of the individual author(s) and contributor(s) and not of MDPI and/or the editor(s). MDPI and/or the editor(s) disclaim responsibility for any injury to people or property resulting from any ideas, methods, instructions or products referred to in the content. |
© 2025 by the authors. Licensee MDPI, Basel, Switzerland. This article is an open access article distributed under the terms and conditions of the Creative Commons Attribution (CC BY) license (https://creativecommons.org/licenses/by/4.0/).