Abstract
To investigate age-related differences in preferred air speed in warm conditions, experiments were conducted in a climate-controlled chamber. 24 young and 24 elderly participants were tested in windless and preferred wind conditions. A resting metabolic rate (RMR) prediction model based on body composition was proposed to examine the effects of individual differences on preferred air speed. Results showed that the elderly exhibited lower RMR than the young, but their mean preferred air speed was 1.3 m/s, significantly higher than that of the young (0.9 m/s), corresponding to their higher mean skin temperatures. Preferred airflow effectively reduced thermal sensation and perceived sweating, thereby improving thermal comfort and airflow acceptance. During airflow exposure, mean skin temperature decreased, while LF/HF index of heart rate variability and skin conductance level increased, indicating enhanced sympathetic activity. These findings suggest that reduced sweat gland function and evaporative heat dissipation cause the elderly to require higher air speeds to achieve thermal neutrality. Their reduced thermal sensitivity further highlights the need for more precise environmental control. RMR exerted a more pronounced influence on the preferred air speed among the elderly, underscoring its significance in designing thermally adaptive environments for aging populations.
1. Introduction
With global warming and population aging, the issue of thermal comfort for the elderly has become increasingly important [1,2]. Human physiological functions change with age, elderly individuals generally exhibit lower metabolic rates [3], and thinner skin combined with reduced vasodilation capacity weakens their ability to regulate body temperature in hot environments [4]. Consequently, elderly individuals are at greater risk of heat-related illnesses such as heat stroke and cardiovascular stress, making them more dependent on environmental control.
In warm environments, air flow can effectively compensate for increased temperature [5] and improve human thermal perception. Compared with air-conditioning systems, the use of fans can enhance thermal comfort while significantly reducing building energy consumption [6,7]. Therefore, a “fan-first” strategy is recommended to mitigate heat-related health risks [8]. Health guidelines have raised the upper environmental temperature limit for safe fan use to 40 °C [9], and experimental evidence has confirmed the effectiveness of fans even at higher temperatures [10].
Although airflow has a strong cooling effect, excessive air speed may cause draft discomfort or overcooling. According to ASHRAE Standard 55, the upper air speed limit is 0.8 m/s when no local control is available [11], whereas no upper limit is imposed when occupants can control airflow themselves, underscoring the importance of personal control. Comfortable air speed varies under different thermal conditions [12], and due to individual differences, each person has a distinct preferred air speed [13]. The preferred air speed also changes with a person’s thermal state, influenced by heat production and dissipation. Evidence from controlled laboratory studies indicates that the acceptable upper air speed limit is much higher than that specified for conditions without local control [13,14]. In practical applications, users should be allowed to adjust airflow to prevent discomfort from overcooling. Moreover, dynamic airflow has been shown to effectively improve thermal comfort and reduce draft sensation [15,16].
Another advantage of user-controlled airflow lies in perceptual control, which can enhance comfort [17,18]. Allowing occupants to control airflow individually helps reduce thermal sensation and widen the comfort range. However, manual adjustment requires active attention and may involve response delay. Automatic air speed regulation, therefore, necessitates identifying individual airflow demands and preferences under different environmental and physiological conditions. Research emphasis should gradually shift from subjective sensation toward physiological responses, introducing objective parameters such as skin temperature for assessing thermal comfort [13]. Automatic fan-speed regulation has been shown to improve perceived air quality (PAQ) [6] and is essential for effective cooling [19] and personal comfort system (PCS) design [20].
Due to lifestyle and economic factors, elderly individuals are more likely to rely on fans to improve warm environments. However, their elevated sensory thresholds [21] and delayed behavioral responses make them prone to insufficient or excessive cooling under dynamic airflow conditions, which may pose health risks. It is therefore crucial to determine the comfortable and safe air speed ranges suitable for the elderly. For this population, adjusting thermal parameters based on objective physiological measures rather than subjective feedback is particularly important. Existing thermal sensation prediction models mainly focus on young adults, with limited research on elderly groups. Studies have demonstrated differences between the two age groups [22], indicating that conclusions drawn from young participants cannot be directly applied to the elderly [2].
When predicting thermal sensation using objective parameters, commonly used environmental variables include air temperature, relative humidity, globe temperature, and air speed [6,13], while physiological indicators include skin temperature, core temperature, heart rate, and sweating rate, etc. [10,13,23,24]. As a measure of human heat production, metabolic rate significantly affects thermal sensation and comfort prediction models [25,26], necessitating high-precision measurement techniques. Current approaches to estimating metabolic rate include empirical estimation [13], heart rate-based calculation [24], accelerometer-based assessment [27], and indirect calorimetry [28]. However, simplified methods, while convenient, often yield large errors, and precise measurements require specialized equipment that limits practical application [29]. Future research should therefore focus on developing high-accuracy, low-cost metabolic rate prediction models and monitoring devices [25,30] to meet the needs of dynamic thermal comfort evaluation and personalized environmental control.
Metabolic rate is influenced by activity level and individual characteristics. Commonly considered factors include body weight, height, body surface area, body mass index (BMI), age, and sex [31,32]. Incorporating individual parameters such as sex, age, height, weight, and fat-free mass (FFM) has been shown to improve prediction accuracy, particularly during low-metabolic-rate activities [27]. Studies on desktop fans have found that gender and BMI significantly affect thermal preference, but exert no significant influence on thermal comfort [33].
Variations in body shape result in differences in body composition, thereby affecting metabolic heat production in the human body. FFM, a key indicator of body composition, is frequently used in metabolic rate models and often serves as a representative factor for individual differences. At low activity levels, when the contribution of skeletal muscles to total heat production decreases, body composition becomes a more significant determinant of metabolic rate. Approximately 80% of individual differences in resting energy expenditure (REE) can be explained by FFM and its components [34]. Predictive equations based on body composition and anthropometric parameters perform well across normal-weight and overweight/obese children [35]. For the elderly, age-related changes in body composition also affect the accuracy of resting metabolic rate (RMR) prediction [36]. Models using FFM as a predictor generally outperform those using lean body weight (LBW).
Body composition can be analyzed using dual-energy X-ray absorptiometry (DXA) or bioelectrical impedance analysis (BIA). RMR predicted from FFM obtained by both methods shows high consistency [37], and models based on other body composition parameters yield results close to those measured by indirect calorimetry [38,39]. Compared with the more expensive DXA, BIA is a low-cost and widely used clinical method suitable for evaluating low metabolic rates. Incorporating basal metabolic rate (BMR) and physical activity ratio (PAR) enables more accurate estimation of elderly metabolic rates [40].
In warm environments, the preferred air speed depends on both the balance between heat production and dissipation and skin sensitivity. Because elderly individuals exhibit reduced skin sensitivity, the role of heat balance becomes more pronounced, making metabolic rate a critical factor. As existing metabolic rate estimation models show considerable deviation, and elderly individuals have lower muscle mass and activity levels, the proportion of heat production from skeletal muscle decreases. Consequently, RMR can be used as an alternative indicator to represent individual differences. Given that RMR prediction models generally exhibit higher accuracy, they offer greater potential for obtaining reliable results.
Considering the limited information available on airflow-related thermal comfort and personalized control models for elderly individuals, this study investigates their preferred air speed and physiological responses in warm environments. By analyzing the relationships between subjective perceptions and objective physiological parameters, the study explores the feasibility of predicting thermal sensation and airflow preference using objective indicators. Young participants were included as a control group with the same sample size to reveal age-related differences. Subjective parameters include thermal sensation vote (TSV), thermal comfort vote (TCV), airflow acceptance, perceived airflow, and perceived sweating, while environmental parameters include air temperature, humidity, and air speed. Physiological indicators include skin temperature, heart rate, heart rate variability (HRV), and electrodermal activity (EDA), the latter reflecting sweat gland activity.
Three approaches were adopted to determine RMR: an empirical model, a BIA-based prediction model, and a modified prediction model proposed in this study after incorporating additional body composition parameters. The modified model divides body heat production into relatively stable components (brain and visceral organs) and variable components (skeletal muscle tissues) according to their heat-release characteristics, while accounting for FFM and body surface area to represent the heat production-dissipation balance.
By combining subjective evaluations with objective physiological indicators, this study investigates differences in preferred air speed and underlying physiological response mechanisms among different age groups in warm environments, providing empirical evidence for personalized airflow and temperature control strategies for the elderly.
The proposed RMR model explicitly considers individual variations in body composition, providing a more reliable basis for thermal physiology research and thermal comfort model optimization. Studies based on objective physiological parameters can facilitate the transition from questionnaire-based subjective evaluation to predictive models grounded in measurable physiological data, which is particularly suitable for elderly individuals, who require more precise control of their thermal environment.
2. Materials and Methods
2.1. Subject Information
The study was conducted in Qingdao, China. A total of 48 participants were recruited, including 24 elderly adults aged 60 years and above who had lived in Qingdao for more than three years (school logistics staff with moderate work intensity) and 24 university students. The basic characteristics of the participants are summarized in Table 1.

Table 1.
Basic Information of Subjects.
The study was conducted in accordance with the Declaration of Helsinki and approved by the Ethics Committee of Qingdao University (protocol code QDU-HEC-2025424 and date of approval [April 2025]).
All elderly participants had passed the mandatory pre-employment medical examination, which screens for chronic diseases. Participants were also screened for medication use; individuals taking drugs known to influence sweating function (e.g., anticholinergic agents) were excluded.
2.2. Subjective Questionnaires and Objective Measurements
Subjective evaluations were collected through questionnaires under different experimental conditions. The questionnaire consisted of five voting items: thermal sensation vote (TSV), thermal comfort vote (TCV), airflow acceptance, perceived airflow, and perceived sweating. TSV, TCV and airflow acceptance were rated using the ASHRAE 55 scale [11], while the other two items adopted a five-point scales [24]. The detailed scales are as follows:
TSV: −3 (cold), −2 (cool), −1 (slightly cool), 0 (neutral), 1 (slightly warm), 2 (warm), 3 (hot). TCV: −4 (extremely uncomfortable), −3 (very uncomfortable), −2 (uncomfortable), −1 (slightly uncomfortable), 1 (comfortable). Airflow acceptance: −2 (clearly unacceptable), −1 (just unacceptable), 0 (neutral), 1 (just acceptable), 2 (clearly acceptable). Perceived airflow and perceived sweating: 0 (no feeling), 1 (slight feeling), 2 (obvious feeling), 3 (strong feeling), 4 (very strong feeling).
Detailed descriptions for the perceived sweating were provided to ensure consistency: 0 (skin dry), 1 (skin slightly sticky), 2 (skin wet, light sweating), 3 (small, localized beads of sweat), 4 (many beads of sweat sliding down).
Objective parameters included environmental temperature, relative humidity, and air speed, while physiological measurements included skin temperature, heart rate, HRV, EDA, and body composition. The instruments used in the experiment are listed in Table 2.
Table 2.
Experimental equipment parameters.
The mean skin temperature was measured using the 7-site method [41], as calculated by Formula (1):
where tforehead, tchest, tforearm, thand, tthigh, tcalf, tfoot correspond to the temperature of forehead, chest, forearm, hand, thigh, calf, and foot, respectively (unit: °C).
Tsk = 0.07 tforehead + 0.35 tchest +0.14 tforearm +0.05 thand + 0.19 tthigh +0.13 tcalf + 0.07 tfoot
The body fat scale is an eight-electrode BIA device for body composition measurement. The measured parameters included body weight, body fat percentage, FFM, skeletal muscle mass, and RMR, etc. Before the measurement, participants were instructed to fast or refrain from eating for at least 2 h, avoid excessive water intake and strenuous physical activity, wear light clothing, and remove heavy items and metallic accessories. During the measurement, participants stood barefoot on the foot electrodes, held the hand electrodes, and maintained calm breathing until the device completed the measurement according to the on-screen instructions.
EDA signals were sampled at 200 Hz as hexadecimal resistance values. The raw data were converted to decimal format, down-sampled to 1 Hz using a Butterworth low-pass filter, and transformed into standard units. Processed signals were analyzed using Ledalab V3.4.9, applying adaptive smoothing and Continuous Decomposition Analysis to extract tonic and phasic components.
The airflow device used in the experiment was modified from a seven-blade pedestal fan. An STM32C8T6 microcontroller (Zhaoxin Atom, Guangzhou, China) was employed to control the fan’s DC motor speed and on/off cycles through pulse–width modulation (PWM). Users could adjust the fan speed and timing parameters via a computer interface.
2.3. Experimental Conditions and Procedures
The experiment was conducted in a climate-controlled chamber at Qingdao University of Technology. Although the upper temperature limit for effective fan cooling remains a matter of debate [5], 35 °C is generally considered a safe threshold. Given that the elderly exhibit reduced thermoregulatory and heat dissipation capacities and that fan cooling alone is insufficient under extreme heat [2], the experiments were conducted only under warm conditions to ensure participant safety. During the tests, the ambient temperature and relative humidity were maintained at 29.2~30.5 °C and 70~85% RH, respectively.
Participants were instructed to abstain from alcohol, coffee, and medication on the day prior to the experiment and to maintain regular sleep habits. All participants wore standardized clothing with an estimated thermal resistance of approximately 0.36 clo. To minimize the influence of metabolic heat generated by skeletal muscles, the experiment focused on low-metabolic-rate conditions. Participants remained seated throughout the test, and their metabolic rate was assumed to be close to the RMR.
Participants were seated at a desk, with the fan positioned 1.5 m directly in front of them. Regarding the airflow mode, direct blowing can provide rapid cooling but may disrupt thermal balance, particularly among elderly individuals. Intermittent airflow, by contrast, helps prevent excessive cooling through periodic modulation and better accommodates human thermoregulation. Therefore, intermittent airflow was adopted as the experimental mode. Based on the results of a pilot study, the on and off durations were set to 10 s and 4 s, respectively.
The experimental procedure is illustrated in Figure 1.
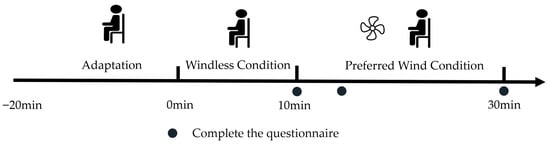
Figure 1.
Experimental procedure.
Participants first underwent an adaptation period of approximately 20 min. After physiological and thermal parameters stabilized, the windless condition began and lasted for about 10 min. This was followed by a 20 min wind condition, during which participants selected their preferred air speed according to their own thermal perception.
2.4. Resting Metabolic Rate Modeling
Because heart rate-based metabolic models exhibit limited accuracy under low-metabolic conditions, the RMR was used to characterize individual differences in heat production.
Three approaches were adopted to calculate RMR: (1) Estimation using an empirical model; (2) Direct measurement using body fat scale (BIA method); (3) A new proposed prediction based on a body composition-derived regression model that considered individual body shape differences.
The empirical estimation of RMR was performed using the Mifflin–St Jeor equations, which are among the most widely used predictive models [42]. By inputting body weight, height, age, and sex, RMR (kJ/day) was calculated as follows:
For males:
RMR = 41.8 W + 26.2 H − 20.6 A + 21
For females:
where W is body weight (kg), H is height (m), and A is age (years).
RMR = 41.8 W + 26.2 H − 20.6 A − 674
Prediction models developed based on Western populations tend to overestimate RMR in Asian individuals [25,43], highlighting the need for more accurate models that account for individual variability.
Body shape differences were considered an important factor influencing basal metabolism. A higher FFM indicates greater heat production, a larger body surface area (BSA) enhances heat dissipation, and a higher body fat percentage (BF%) provides stronger thermal insulation. Different body composition parameters influenced the balance between heat production and heat dissipation.
Therefore, from the perspective of body shape differences and the balance between heat production and loss, BF%, FFM/BSA, brain and visceral organs heat production, and skeletal muscle heat production were used as independent variables. Using RMR data from the body fat scale, a multiple linear regression analysis was conducted to establish an RMR prediction model based on body shape difference analysis (SDA). Unlike conventional models, this model directly incorporated the heat production of human organs and tissues as independent variables.
Regression equation for young participants (kJ/day):
where X1 is body fat percentage (%), X2 is FFM/BSA (kg/m2), QO is organ heat production (kJ/day), and Qs is skeletal muscle heat production (kJ/day). The coefficient of determination (R2) for the model is 0.99997.
RMR = 1882.663 − 0.057 X1 − 5.042 X2 + 0.155 QO + 2.617 Qs
Regression equation for elderly participants (kJ/day):
RMR = 1932.566 − 0.068 X1 − 7.869 X2 + 0.060 QO + 2.867 Qs
The coefficient of determination (R2) for the model is 0.99993.
Regression equation for all age groups (kJ/day):
RMR = 1930.299 − 0.056 X1 − 6.888 X2 + 0.032 QO + 2.929 Qs
The coefficient of determination (R2) for the model is 0.99992.
The model considered two main components of human heat production: organ heat production dominated by the brain and visceral organs, and tissue heat production dominated by skeletal muscles. The former remained relatively stable under all conditions, whereas the latter, though affected by activity level, was also relatively stable under resting conditions.
The heat production of each organ and tissue component (Qi, kJ/day) was calculated as follows:
where Mi is the mass (kg) of component i, hi is the metabolic rate coefficient (kJ/kg/day), and i represents different components: organs (brain, liver, heart, and kidneys) and tissues (primarily skeletal muscle).
Qi = Σ(Mi × hi)
Data of body fat, FFM and mass of skeletal muscle were measured using the body fat scale. The FFM of the young participants was 52.53 ± 11.45 kg, which was significantly higher than that of the elderly participants (46.72 ± 9.28 kg, p < 0.001).
Organ-to-body weight ratios were based on empirical values: brain 2.5%, liver 3.2%, heart 0.6%, and kidneys 0.8%.
Based on previous studies [44,45], the metabolic rate coefficients (hi, kJ/kg/day) were set as follows: 1000 for the brain and liver, 1840 for the heart and kidneys, 54 for skeletal muscles, 20 for adipose tissue, and 50 for residual mass, including bone, skin, stomach, intestines, glands, and lungs.
The proportions of total heat production for each component (compared with literature values [44]) were as follows: brain 20.9% (20.1%), liver 22.2% (17.6%), heart 9.2% (8.6%), kidneys 10.9% (8.0%), and skeletal muscles 23.0% (21.7%).
The body surface area was calculated using the following equation [46]:
where H is height (m) and W is body weight (kg). The BSA of the young participants was 1.99 ± 0.26 m2, which was significantly higher than that of the elderly participants (1.77 ± 0.24 m2, p < 0.05).
Aman = 0.0057 H + 0.0121 W + 0.0882
Awoman = 0.0073 H + 0.0127 W − 0.2106
2.5. Statistical Analysis
The Shapiro–Wilk test was used to determine whether the data followed a normal distribution. When p > 0.05, the data were considered normally distributed; otherwise, a non-normal distribution was assumed.
For normally distributed data, independent-samples t-tests were used to examine differences between the two age groups, and paired t-tests were applied to compare the two conditions within the same age group. For non-normally distributed data, the Mann–Whitney U test was used for between-group comparisons, and the Wilcoxon signed-rank test was used for within-group comparisons.
Spearman’s rank correlation coefficient was employed to assess correlations among parameters.
All statistical analyses were performed using SPSS Statistics 25.
3. Results
3.1. Preferred Air Speeds
The preferred air speeds of the young and elderly participants are shown in Figure 2.
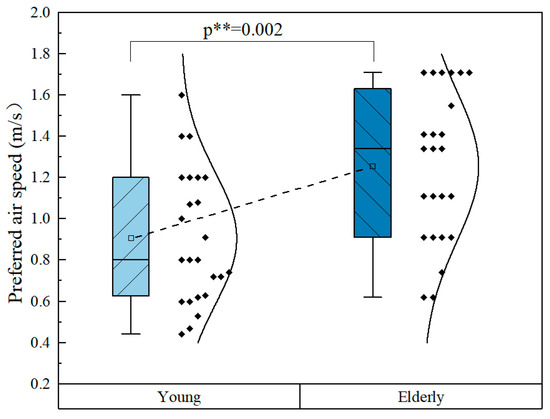
Figure 2.
Comparison of preferred air speeds.
For the young participants, the preferred air speeds were distributed within the range of 0.4~1.6 m/s, with a few individuals reaching up to 1.6 m/s, and an average value of 0.9 m/s. In contrast, the preferred air speeds of the elderly participants range from 0.6 to 1.7 m/s, with an average value of 1.3 m/s. The preferred air speeds of the elderly were significantly higher than those of the young participants.
87.5% of the elderly participants preferred an air speed exceeding 0.8 m/s, higher than 45.8% of the young.
It can be seen that the resolution of preferred air speed differed slightly between the two groups. During the experiment, air speed was first adjusted in 0.1 m/s steps, followed by finer tuning as needed. Many young participants typically required these fine adjustments, whereas elderly participants rarely did. This difference likely reflects the elderly participants’ habitual adaptation to non-air-conditioned environments, resulting in higher thermal tolerance. It may also be related to their cautious behavior in an unfamiliar experimental setting.
It should be noted that the normal distribution curve shown in the figures is fitted to the data for comparison purposes and does not require the data to strictly follow a normal distribution. This approach can be applied to any variable. However, when the data deviate substantially from normality, the fitted “Normal” curve may appear distorted, which provides a visual and intuitive indication of the degree to which the data conform to a normal distribution.
3.2. Subjective Responses
The thermal sensation and thermal comfort votes of the elderly and young participants under the windless and preferred wind conditions were analyzed, and the results are shown in Figure 3.
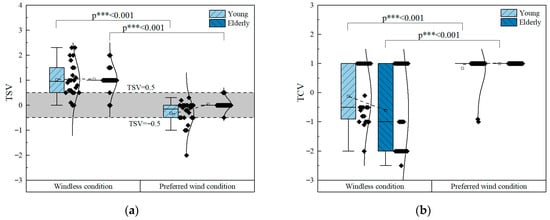
Figure 3.
Thermal sensation and thermal comfort votes. (a) TSV; (b) TCV.
Airflow at the preferred air speed set by participants according to their own needs effectively improved thermal perception. Under the windless condition, the mean TSV for both young and elderly participants was approximately 1.0 (slightly warm). However, the proportion of young participants with TSV > 1 was notably higher than that of the elderly, and a larger proportion of young participants fall within the comfort range (−0.5 < TSV < 0.5).
In the preferred wind condition, all elderly participants remain within the thermoneutral range, while most young participants also reported thermal neutrality; a few young individuals reported TSV < −0.5, with some even perceiving slightly cool or cool.
The TCV results are shown in Figure 3b. Dynamic airflow under warm conditions markedly improved thermal comfort. In the windless condition, although the TSVs of both age groups were nearly identical, the thermal comfort votes of the elderly (TCV = −0.60) were lower than those of the young (TCV = −0.12). Approximately 40% of the participants reported feeling comfortable. Among those who reported uncomfortable, a noticeably larger number of elderly participants voted around −2 (uncomfortable), whereas young participants were mostly concentrated around −1 (slightly uncomfortable). In the preferred wind condition, all participants reported comfortable, except for two young subjects whose votes were discomfort. The young participant who voted TSV = –2 (cool) under airflow exposure reported a TCV of 1 (comfortable) in both conditions.
It should be noted that fractional values were allowed in the voting although integer scoring was sufficient for this study. However, the data distribution showed that the votes from the young participants were more scattered, whereas those from the elderly were clustered around integer values. Since all participants received identical instructions, differences in prior experience, perceptual ability, and familiarity with the scale led to different voting resolutions. Young participants, who had prior experience with thermal comfort experiments and received prior training, often used decimal scores, whereas elderly participants generally used integer scores or occasionally half-integer scores. This reflects both practical familiarity and potential differences in thermal sensitivity.
Airflow-related voting results are presented in Figure 4.
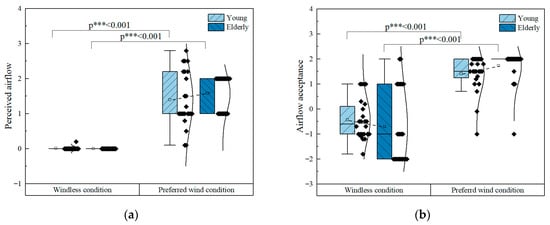
Figure 4.
Airflow-related votes. (a) Perceived airflow; (b) Airflow acceptance.
Under the windless condition, the indoor air speed was less than 0.01 m/s, and none of the participants reported any sensation of airflow. Under the preferred wind condition, the perceived airflow sensation increased significantly. Because each participant selected a different preferred air speed, their perceived airflow votes also varied. The votes among the young participants were more dispersed, whereas those among the elderly were relatively concentrated.
Airflow significantly improves airflow acceptance under warm conditions. Under the windless condition, most participants in both age groups reported negative acceptance votes (just unacceptable or unacceptable). However, the elderly exhibited lower acceptance than the young, indicating a higher demand for airflow among the elderly, which corresponded to their lower TCVs. Under the preferred wind condition, overall airflow acceptance improved markedly, and the elderly participants reported higher acceptable votes than the young, further suggesting that airflow plays a more pronounced role for the elderly.
As mentioned above, two young participants reported discomfort in the preferred airflow condition (TCV = −1 and −0.9). There airflow acceptance votes were −0.1 and −1, while no notable differences were observed in the other voting parameters. Therefore, the discomfort was likely attributable to dissatisfaction with the airflow. In contrast, airflow acceptance score of one elderly participant was −1, yet they still reported thermal comfort.
Figure 5 shows the perceived sweating votes.
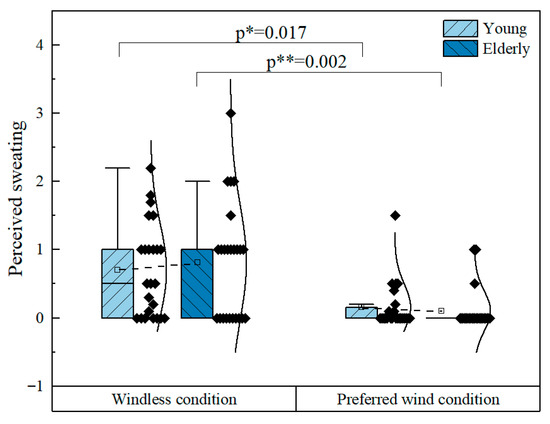
Figure 5.
Perceived sweating votes.
Under the windless condition, most participants reported sweating sensation votes of 0~1, indicating no feeling or skin slightly sticky with light perspiration. Despite the decline in sweat gland function among the elderly, no significant differences in perceived sweating were observed between the two age groups. In fact, a few elderly participants even reported relatively high perceived sweating scores. Under the preferred wind condition, enhanced convective heat transfer effectively reduced the sweating sensation, with most participants reporting a value of 0 (no feeling). Only a few participants still reported sweating, and the number of elderly participants with this sensation was notably lower than that of the young participants. The participant who reported a score of 3 (strong feeling, small, localized beads of sweat) under the windless condition gave a score of 0 under the preferred airflow condition, with perceived sweating markedly reduced. This participant’s preferred air speed was relatively high, at 1.71 m/s.
3.3. Physiological Parameters
Subjective questionnaires reflect participants’ perceived responses to environmental stimuli; however, their results are highly subjective and easily influenced by individual cognitive differences and interpretation biases of the rating scales. In contrast, physiological responses under thermal stimulation are primarily regulated by the autonomic nervous system, independent of conscious control, and therefore can provide a more objective assessment of the body’s actual physiological state. Consequently, combining subjective questionnaire results with physiological indicators allows for a more accurate and comprehensive evaluation of human responses.
Compared with the windless condition, participants exhibited substantial physiological changes under airflow conditions, and some physiological parameters also varied significantly between age groups under the same condition.
The results of mean skin temperature are shown in Figure 6.
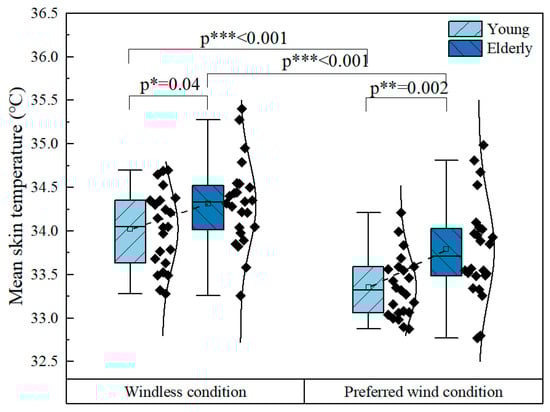
Figure 6.
Mean skin temperature.
Under both conditions, the elderly exhibited higher mean skin temperatures than the young, with differences ranging from 0.3~0.4 °C. This difference can be attributed to reduced sweat gland activity in the elderly. Due to the decreased evaporative heat loss, higher skin temperature is required to enhance convective and radiative heat dissipation. Under airflow, the mean skin temperature of all participants decreased significantly, with a greater temperature drop in the young (0.7 °C) than in the elderly (0.5 °C). This occurred because airflow enhances both convective and evaporative heat loss. Although the elderly had higher skin temperatures, resulting in greater increases in convective heat loss, their lower evaporative heat loss led to a smaller total cooling effect compared to the young.
Heart rate reflects, to some extent, changes in metabolic rate. During the entire experiment, heart rate fluctuated only slightly, suggesting that metabolic rate remained stable and that airflow did not affect metabolism. The elderly exhibited a lower average heart rate (72.0 ± 9.0 bpm) than the young (82.0 ± 8.0 bpm), consistent with their lower RMR.
Figure 7 presents the HRV and EDA results, with LF/HF (Low Frequency/High Frequency) ratio representing HRV and skin conductance level (SCL) representing EDA.
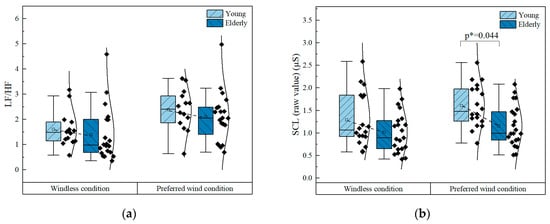
Figure 7.
HRV and EDA. (a) LF/HF index of HRV; (b) SCL index of EDA.
HRV indicates the regulatory capacity of the autonomic nervous system. The LF/HF ratio, a frequency-domain index of HRV, reflects the balance between sympathetic and parasympathetic activity.
Under the windless condition, the elderly exhibited slightly lower LF/HF values than the young, which is consistent with the age-related decline in sympathetic activity. When airflow applied, LF/HF values increased in both groups (by 0.6 in the young and 0.7 in the elderly), indicating a relative dominance of sympathetic activity. Since no factors in the experiment were expected to activate the parasympathetic nervous system, the increase in LF/HF suggests that airflow enhances sympathetic activation. The measured data also indicated that higher air speeds correspond to higher LF/HF values, indicating stronger sympathetic activation.
EDA further supports the role of airflow in sympathetic activation. EDA, a classic indicator of sympathetic nervous activity, consists of the skin conductance level (SCL) and skin conductance response (SCR). The eccrine sweat glands of the palms and soles are innervated exclusively by cholinergic sympathetic fibers; thus, increased sympathetic activity enhances glandular secretion, leading to elevated SCL. Therefore, higher SCL values correspond to increased sympathetic activity.
Under the windless condition, the elderly exhibited SCL values 21% lower than those of the young, which may be attributed both to their reduced sympathetic activity and to the decline in sweat glands function, with both factors acting in the same direction. Under airflow exposure, SCL increases in both groups (by 0.31 in the young and 0.14 in the elderly). However, the SCL of the elderly remained 28% lower than that of the young, suggesting that airflow induces stronger sympathetic activation in the young.
It should be noted that SCL is also affected by skin hydration, as evaporation can decrease SCL. However, this influence is outweighed by the sweat gland activation driven by sympathetic stimulation. Therefore, SCL continued to rise under airflow exposure.
3.4. Resting Metabolic Rate
The results of RMR calculated using the three different methods for the two age groups are shown in Figure 8.
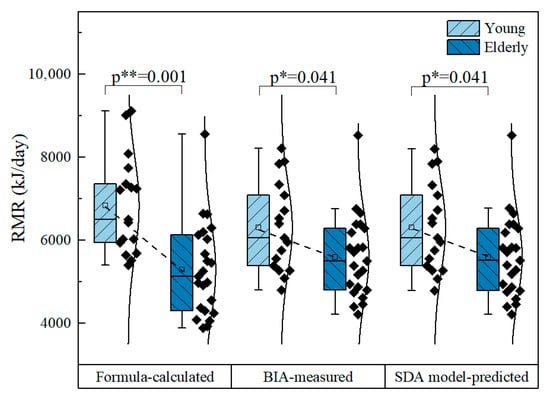
Figure 8.
Comparison of three RMR calculation methods.
As illustrated, the RMR values obtained from the BIA and the SDA model were close to each other, whereas those estimated using the empirical equation exhibited greater deviation. A significant difference was observed between the average RMR of the young (6300 kJ/day) and that of the elderly (5600 kJ/day), aligning with the age-related reductions in skeletal muscle mass and overall physical activity.
4. Discussion
4.1. The Importance of Airflow Control for the Elderly
It is generally recognized that metabolic rate decreases with age, leading elderly individuals to prefer warmer environments, while young individuals are more tolerant of lower temperatures [47]. In daily life, elderly adults also tend to use electric fans rather than air conditioners for cooling during summer. However, in this study, it was found that under identical thermal conditions, the elderly exhibited significantly higher preferred air speeds despite having lower metabolic rates than the young. This suggests that elderly adults require stronger cooling to achieve thermal comfort in warm environments.
The decline in thermoregulatory capacity among the elderly is associated with cardiovascular deterioration [48]. In cold environments, this is reflected by lower skin and core temperatures [4], while in hot environments, it is mainly influenced by reduced sweat gland function. As ambient temperature increases, convective and radiative heat losses decrease, requiring enhanced evaporative heat loss to maintain thermal balance. Due to limited sweat evaporation capacity [5], elderly individuals passively experience a rise in body temperature. As shown in the previous results, compared with the young, the elderly exhibited lower HRV parameters representing autonomic regulation, lower SCL indicating reduced sweat gland activation, and higher mean skin temperatures, consistent with the above interpretation.
The decline in evaporative capacity poses serious challenges for the elderly in adapting to hot environments, as reflected by the reduced upper temperature limits for fan use [49]: 39 °C for healthy young adults, 38 °C for healthy elderly, and 37 °C for elderly individuals taking anticholinergic medications. The reduced temperature threshold for the elderly can be attributed to sweat gland deterioration, while anticholinergic drugs further inhibit sweating and impair heat dissipation.
During heat waves, elderly adults are more prone to hyperthermia and related health issues [50]. Although airflow enhances evaporative heat loss, sufficient body water is required to sustain this process. Excessive evaporation can lead to discomfort such as eye dryness [12], and if fluid replacement is inadequate, dehydration may occur, impairing cognition [51] and affecting multiple organs and systems, resulting in more severe consequences [52]. Therefore, from a comfort perspective, the upper temperature limit for fan use among the elderly should be appropriately reduced, and alternative cooling methods should be applied when necessary.
Another challenge for thermal regulation in the elderly is the diminished sensitivity to temperature changes [19,53], which impairs timely responses to variations in both environmental and physiological thermal states, resulting in greater cold tolerance [4]. As shown by the subjective votes, although the elderly exhibit higher mean skin temperatures than the young, their thermal sensation scores show no significant difference. This reduced thermal sensitivity should not be interpreted as improved heat tolerance, but rather as an increased risk of overheating. Similarly, although the elderly preferred higher air speeds, their votes did not reflect a stronger perceived airflow.
This weakened thermoregulatory response can be attributed to reduced responsiveness of thermal receptors [54] and age-related declines in neural and cognitive function. The more concentrated distribution of subjective votes among the elderly also reflects lower perceptual resolution.
The elderly participants in this study were in good health, yet significant physiological differences were still observed, suggesting that the effects would be even more pronounced among frailer elderly adults.
Overall, elderly individuals are physiologically less capable of dissipating heat efficiently and rely more heavily on environmental control systems. Their reduced ability to perceive and respond accurately to thermal changes requires higher precision in environmental regulation to avoid excessive cooling or heating. When airflow is used as a cooling strategy, accurate prediction and control of preferred air speed become particularly important.
Under airflow exposure, skin temperature decreased, while HRV (LF/HF) and EDA (SCL) increased, indicating that these objective parameters can serve as feedback indicators for air speed control. In addition to the commonly used skin temperature, HRV has been shown to correlate with changes in thermal comfort [55], and EDA shows promise as a measure of human responses to airflow, with the added advantage of reflecting individual differences more sensitively.
The positive aspect is that, unlike air conditioning, which provides uniform cooling, fan-based cooling primarily targets the upper body, corresponding to the elderly’s greater heat sensitivity in the upper body and cool sensitivity in the lower body [53]. Therefore, local cooling devices should prioritize the head and hand regions [56], and fans can effectively achieve this goal while avoiding cold discomfort in the lower limbs.
4.2. Analysis of Factors Affecting Preferred Air Speed
The role of airflow in a warm environment is to enhance heat dissipation; therefore, the preferred air speed is related to the body’s heat balance and also influenced by individual perception of airflow. Due to large individual differences, each person’s preferred air speed varies considerably, and even the same person may exhibit different preferences under different physiological states.
Human heat balance involves both heat production and heat dissipation. Heat production mainly depends on the metabolic rate, while heat dissipation is associated with parameters such as skin area, skin temperature, skin moisture, ambient temperature and humidity, mean radiant temperature, and air speed. Environmental parameters can be measured through experimental methods, whereas practical applications primarily require determining human-related parameters.
Skin temperature is associated with thermal sensation and reflects the body’s heat dissipation; thus, it has been widely used in thermal sensation prediction [57]. However, under sweating conditions, the increased evaporative heat loss lowers the skin temperature, altering its relationship with thermal sensation and reducing prediction accuracy. The estimation of evaporative heat loss requires the sweat evaporation rate or skin moisture level. Because of individual differences in the number, distribution, and activation thresholds of sweat glands, precise measurement is difficult. Therefore, no clear relationship is found between skin temperature and preferred air speed.
The metabolic rate also exhibits considerable individual variability. In this study, after restricting the activity level to sedentary, the RMR was used to replace the general metabolic rate for analysis, and a new SDA predictive model was proposed. To account for individual variability, the model introduces additional heat production terms from human organs and tissues, including relatively stable heat generation from the brain and viscera, and variable heat generation from skeletal muscles, beyond body fat percentage, FFM, and BSA. RMR has been found to correlate with thermal perception [58], and as the primary contributor to body heat production, the influence of muscle and fat on thermal preference has been confirmed [47].
The RMR obtained by the SDA method is highly consistent with that derived from the BIA method. Compared with results from the commonly used M-S equation, the SDA-derived metabolic rate of young participants is lower, consistent with the generally lower metabolic rate of Asian populations [43]. However, the SDA method yields higher metabolic rates for the elderly. This discrepancy arises because the M-S equation includes an age factor that causes metabolic rate to decline with age, reflecting an average trend for that age group. In contrast, the elderly participants in this study, though older, still engage in physical labor, resulting in relatively high metabolic rates. Since the SDA method calculates metabolic rate based on body composition, it accurately reflects this difference.
From the structure of the formula, the SDA method depends solely on body composition, without considering factors such as age or sex, thereby better capturing individual variability. This method combines the relatively stable heat production of the brain and viscera into one term and treats the variable skeletal muscle heat production as another. During RMR prediction, the metabolic rate coefficients are set as constants but can be adjusted according to activity levels to adapt to other metabolic states. Additionally, electromyographic and other signals may be incorporated to specifically correct skeletal muscle heat production under active conditions, or parameters such as blood flow and oxygen metabolism rate may be included to refine brain heat production during sleep or various mental activities.
The SDA model captures individual differences and improves the accuracy of body heat production prediction. The other two major factors influencing preferred air speed are sweat evaporation and subjective psychological perception. Among young individuals, both factors show large individual variability and are difficult to quantify, whereas age-related physiological changes in the elderly exert favorable effects: the decline in sweat gland function reduces the proportion of evaporative heat loss, and diminished environmental sensitivity weakens the influence of psychological factors. Consequently, the impact of metabolic rate on preferred air speed becomes more pronounced.
The relationship between preferred air speed and RMR in young and elderly participants is shown in Figure 9.
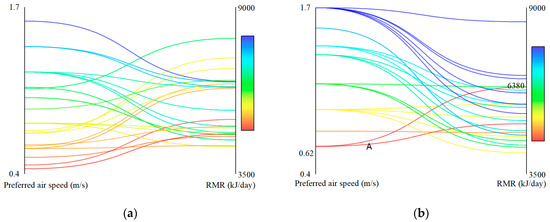
Figure 9.
The relationship between preferred air speed and RMR. (a) Young; (b) Elderly.
The relationship between preferred air speed and RMR among young participants appeared relatively scattered, whereas that of the elderly exhibited a clearer trend. Although some intersections exist in the curves, participants with higher resting metabolic rates generally prefer higher air speeds, while those with lower rates tend to prefer lower air speeds.
An clear exception is participant A, whose resting metabolic rate is 6380 kJ/day but preferred air speed is only 0.62 m/s. Analysis of body composition reveals that this participant has a high FFM (53.5 kg), which largely explains the elevated metabolic rate, whereas a large BSA (1.91 m2) contributes to greater heat dissipation, resulting in a lower preferred air speed.
Correlation analysis revealed that RMR and preferred air speed are positively correlated among young participants (r = 0.189, p = 0.468), and significantly positively correlated among the elderly (r = 0.447, p = 0.033), consistent with the above findings.
4.3. Limitations and Future Studies
Although this study systematically integrates subjective perception and objective physiological indicators to explore preferred air speed among the elderly and proposes an improved metabolic rate model, several limitations remain.
First, the sample size is limited, and factors such as participants’ physical conditions, gender distribution, and lifestyle habits may introduce individual variability. Although the key effects in this study reached statistical significance and the estimated effect sizes suggest that the sample is sufficient for detecting the main outcomes, the demographic diversity is relatively narrow. Therefore, the generalizability of the findings should be interpreted with caution and requires further validation in larger and more demographically diverse populations as well as across different climatic contexts.
Second, as the experiments were conducted under controlled conditions, the complexity of system configurations, environmental settings, airflow distributions and the interaction of multiple environmental factors (e.g., mean radiant temperature and dynamic clothing adjustments) in real buildings were not fully considered, which may lead to discrepancies between laboratory and real-life conditions.
Third, although this study incorporates multiple physiological parameters (e.g., skin temperature, HRV, and EDA), they still cannot fully capture the complexity of human thermoregulation. Additionally, only correlations between subjective and objective indicators were analyzed, without exploring potential nonlinear relationships or dynamic individual responses.
Last, deviations in environmental parameters may influence individual thermal sensation and preferred air speed. Within each participant’s session, temperature and humidity were relatively stable, but small differences existed between participants. While our analysis indicates that this variability did not affect the comparison between young and elderly adults, future studies would benefit from more precise environmental control to further reduce confounding effects.
Future studies may extend this work in several directions:
- (1)
- Expanding the sample size and participant diversity by including individuals of different age groups, health conditions, geographic and climate backgrounds to enhance representativeness and applicability, and conducting further validation in larger and more demographically diverse cohorts to strengthen the robustness of the conclusions.
- (2)
- Enriching environmental and behavioral variables by considering system configurations, environmental factors, airflow distributions, and adaptation behaviors in more realistic conditions.
- (3)
- Refining physiological modeling by integrating multimodal physiological data (including skin blood flow, core temperature, and energy metabolism, etc.) to improve the accuracy of body composition and metabolic rate estimations, and to develop more precise prediction models for metabolic rate and thermal perception.
- (4)
- Introducing intelligent and dynamic prediction methods by applying machine learning or individualized modeling techniques to capture the nonlinear relationships among physiological indicators and thermal comfort, and to develop real-time, physiology-based adaptive air speed control strategies.
- (5)
- High temperatures can impair cognitive performance [59], whereas the presence of ventilation helps maintain both cognitive and physiological performance [60]. Investigating the potential impact of preferred wind conditions on cognitive performance would provide a more comprehensive understanding of how environmental parameters affect thermal comfort and productivity.
In summary, this study provides a foundation for understanding the physiological mechanisms underlying thermal perception and preferred air speed among the elderly. However, further research is needed across broader samples, realistic settings, and advanced modeling frameworks to achieve more accurate and personalized predictions of thermal comfort and to optimize airflow environments for aging populations.
5. Conclusions
This study investigates the thermal perception and physiological responses of different age groups under airflow in warm environments. Through a combined analysis of subjective and objective data, it focuses on the differences and influencing factors of preferred air speed between the young and the elderly. To better capture the effects of individual differences, an RMR model based on body composition was proposed.
The main conclusions are as follows:
- Participants of different ages exhibit similar subjective and physiological responses under airflow. Airflow exposure reduces mean skin temperature, while increasing HRV (LF/HF index) and EDA (SCL index), indicating enhanced sympathetic nervous activity. The preferred airflow effectively reduces thermal sensation and perceived sweating, improving both thermal comfort and airflow acceptance. All participants report high satisfaction with their preferred airflow.
- Physiological differences cause the elderly to have a greater need for airflow in warm environments. Although the elderly had lower RMR than young adults, their weakened sweat gland function limits evaporative heat loss, resulting in higher mean skin temperatures and stronger cooling demands. Consequently, their preferred air speed (mean: 1.3 m/s, range: 0.6~1.7 m/s) is significantly higher than that of young adults (mean: 0.9 m/s, range: 0.4~1.6 m/s). In addition, due to reduced thermal sensitivity and lower perceptual resolution, the elderly cannot accurately and promptly perceive changes in the thermal environment, necessitating precise air speed control to prevent insufficient or excessive cooling.
- Metabolic rate serves as an important factor influencing airflow preference in the elderly. In warm environments, preferred air speed showed a positive correlation with RMR. Because of reduced evaporative heat dissipation and decreased thermal sensitivity, the impact of RMR on preferred air speed becomes more pronounced among the elderly (r = 0.447, p = 0.033), highlighting the importance of accurately predicting metabolic rate.
These findings on age-related differences in preferred air speed and thermal perception can inform the design of building ventilation systems, personal comfort devices such as adjustable fans, and heat-health management guidelines for both young and elderly populations. Such insights can help optimize airflow strategies to enhance comfort, safety, and physiological well-being in indoor environments.
Author Contributions
Conceptualization, G.W., L.W. and S.H.; methodology, H.Z. and L.W.; investigation, L.W.; data analysis and interpretation, G.W., L.W. and W.S.; writing—original draft preparation, G.W. and L.W.; writing—review and editing, H.Z. and W.S.; visualization, L.W. and W.S.; supervision, G.W. and S.H. All authors have read and agreed to the published version of the manuscript.
Funding
This research was funded by the National Natural Science Foundation of China (Project No. 52378100).
Institutional Review Board Statement
This study was approved by Ethics Committee of Qingdao University (QDU-HEC-2025424) (24 April 2025). No harm was caused to the participants during the study.
Informed Consent Statement
Informed consent was obtained from all subjects involved in the study.
Data Availability Statement
The data presented in this study are available on request from the corresponding author.
Conflicts of Interest
The authors declare no conflicts of interest.
Abbreviations
The following abbreviations are used in this manuscript:
| BF% | Body Fat Percentage |
| BIA | Bioelectrical Impedance Analysis |
| BMI | Body Mass Index |
| BMR | Basal Metabolic Rate |
| BSA | Body Surface Area |
| DXA | Dual-Energy X-ray Absorptiometry |
| EDA | Electrodermal Activity |
| FFM | Fat-Free Mass |
| HF | High Frequency |
| HRV | Heart Rate Variability |
| LBW | Lean Body Weight |
| LF | Low Frequency |
| PAQ | Perceived Air Quality |
| PAR | Physical Activity Ratio |
| PCS | Personal Comfort System |
| PWM | Pulse–Width Modulation |
| REE | Resting Energy Expenditure |
| RMR | Resting Metabolic Rate |
| SCL | Skin Conductance Level |
| SCR | Skin Conductance Response |
| SDA | Shape Difference Analysis |
| TCV | Thermal Comfort Vote |
| TSV | Thermal Sensation Vote |
References
- Jay, O.; Capon, A.; Berry, P.; Broderick, C.; de Dear, R.; Havenith, G.; Honda, Y.; Kovats, R.S.; Ma, W.; Malik, A.; et al. Reducing the health effects of hot weather and heat extremes: From personal cooling strategies to green cities. Lancet 2021, 398, 709–724. [Google Scholar] [CrossRef]
- O’Connor, F.K.; Meade, R.D.; Wagar, K.E.; Harris-Mostert, R.C.; Tetzlaff, E.J.; McCormick, J.J.; Kenny, G.P. Effect of Electric Fans on Body Core Temperature in Older Adults Exposed to Extreme Indoor Heat. JAMA 2024, 332, 1752–1754. [Google Scholar] [CrossRef]
- Zhai, Y.; Li, Z.; Qiu, X.; Lu, Z.; Yu, L.; Dai, L.; Li, Q.; Sekhar, C.; Liu, M. Prediction on Chinese elderly’s thermo-physiological and cardiovascular responses to non-uniform and transient thermal environment during getting-up process. Build. Environ. 2025, 267, 112186. [Google Scholar] [CrossRef]
- Xu, J.; Lu, Y.; He, J.; Lu, Y. A review on thermal characteristics of the elderly and methods for maintaining their thermal comfort in cold winter season. Build. Environ. 2025, 269, 112469. [Google Scholar] [CrossRef]
- Meade, R.D.; Notley, S.R.; Kirby, N.V.; Kenny, G.P. A critical review of the effectiveness of electric fans as a personal cooling intervention in hot weather and heatwaves. Lancet Planet. Health 2024, 8, e256–e269. [Google Scholar] [CrossRef] [PubMed]
- Gupta, A.; Torriani, G.; Torresin, S.; Pistore, L.; Pellegatti, M.; Piazza, L.; Miorin, F.; Pasut, W.; Belleri, A.; Lollini, R.; et al. Thermal comfort and perceived air quality (PAQ) using automatic ceiling fans in residential buildings. Energy Build. 2025, 330, 115317. [Google Scholar] [CrossRef]
- Malik, A.; Bongers, C.; McBain, B.; Rey-Lescure, O.; de Dear, R.; Capon, A.; Lenzen, M.; Jay, O. The potential for indoor fans to change air conditioning use while maintaining human thermal comfort during hot weather: An analysis of energy demand and associated greenhouse gas emissions. Lancet Planet. Health 2022, 6, e301–e309. [Google Scholar] [CrossRef] [PubMed]
- Bone, A.; Tartarini, F.; Jay, O. Fan-first heat-health protection. Med. J. Aust. 2025, 222, 538–541. [Google Scholar] [CrossRef] [PubMed]
- Heat and Health. Available online: https://www.who.int/news-room/fact-sheets/detail/climate-change-heat-and-health (accessed on 14 September 2025).
- Suresh Bhuvad, S.; You, R.; Chen, Q. Evaluation of physiological and thermal comfort effectiveness of ceiling fan and table fan during a heat wave. Energy Build. 2024, 322, 114706. [Google Scholar] [CrossRef]
- ANSI/ASHRAE Standard 55-2023ASHRAE; Thermal Environmental Conditions for Human Occupancy. ASHRAE: Atlanta, GA, USA, 2023.
- Rissetto, R.; Schweiker, M.; Wagner, A. Personalized ceiling fans: Effects of air motion, air direction and personal control on thermal comfort. Energy Build. 2021, 235, 110721. [Google Scholar] [CrossRef]
- Zhou, J.; Zhang, X.; Xie, J.; Liu, J. Occupant’s preferred indoor air speed in hot-humid climate and its influence on thermal comfort. Build. Environ. 2023, 229, 109933. [Google Scholar] [CrossRef]
- Tartarini, F.; Schiavon, S.; Jay, O.; Arens, E.; Huizenga, C. Application of Gagge’s energy balance model to determine humidity-dependent temperature thresholds for healthy adults using electric fans during heatwaves. Build. Environ. 2022, 207, 108437. [Google Scholar] [CrossRef]
- Lao, C.; Ling, J.; Li, J.; Jiang, J.; Zhang, S.; Yan, Y.; Yin, Y.; Gu, M. Subjective Perception and Cooling Effect for Dynamic Ventilation with Fluctuating Air Velocity. Buildings 2025, 15, 2871. [Google Scholar] [CrossRef]
- Li, Z.; Zhou, B.; Yang, B.; Li, H.; Jin, D.; Wang, F. Occupant thermal and draft perceptions under various intermittent regimes of an intermittent air jet strategy. Build. Environ. 2024, 262, 111839. [Google Scholar] [CrossRef]
- Luo, M.; Cao, B.; Ji, W.; Ouyang, Q.; Lin, B.; Zhu, Y. The underlying linkage between personal control and thermal comfort: Psychological or physical effects? Energy Build. 2016, 111, 56–63. [Google Scholar] [CrossRef]
- Torriani, G.; Lamberti, G.; Fantozzi, F.; Babich, F. Exploring the impact of perceived control on thermal comfort and indoor air quality perception in schools. J. Build. Eng. 2023, 63, 105419. [Google Scholar] [CrossRef]
- Chen, M.; Farahani, A.V.; Kilpeläinen, S.; Kosonen, R.; Younes, J.; Ghaddar, N.; Ghali, K.; Melikov, A.K. Thermal comfort chamber study of Nordic elderly people with local cooling devices in warm conditions. Build. Environ. 2023, 235, 110213. [Google Scholar] [CrossRef]
- Rawal, R.; Schweiker, M.; Kazanci, O.B.; Vardhan, V.; Jin, Q.; Duanmu, L. Personal comfort systems: A review on comfort, energy, and economics. Energy Build. 2020, 214, 109858. [Google Scholar] [CrossRef]
- Millyard, A.; Ogden, H.B.; Waterworth, S.P.; Pyne, D.B.; Layden, J.D.; Bloxham, S.R. Increased age and reduced physical activity level worsen thermoregulatory pacing behaviour in men during walking exercise in the heat. J. Therm. Biol. 2025, 127, 104019. [Google Scholar] [CrossRef]
- Zhou, S.; Li, B.; Du, C.; Yao, R.; Ouyang, L.; Zhou, H.; Kosonen, R.; Melikov, A.K.; Shang, L.; Liu, H. Developing thermal prediction models for the elderly under temperature step changes. Build. Environ. 2023, 245, 110902. [Google Scholar] [CrossRef]
- Jay, O.; Hoelzl, R.; Weets, J.; Morris, N.; English, T.; Nybo, L.; Niu, J.; de Dear, R.; Capon, A. Fanning as an alternative to air conditioning—A sustainable solution for reducing indoor occupational heat stress. Energy Build. 2019, 193, 92–98. [Google Scholar] [CrossRef]
- Wang, W.; Li, J.; Zhou, Y.; Lai, Z.; Chen, X. Field study on the effects of the fan mode, WBGT, and exercise intensity on post-exercise dynamic thermal responses in summer. Build. Environ. 2024, 262, 111795. [Google Scholar] [CrossRef]
- Zhao, S.; Yang, L.; Gao, S.; Yan, H.; Zhang, H.; Arens, E.; Liu, S.; Zhai, Y. Influencing factors of metabolic rates and their implications in thermal comfort research. Energy Build. 2025, 339, 115777. [Google Scholar] [CrossRef]
- Zhang, Y.; Lin, Z.; Zheng, Z.; Zhang, S.; Fang, Z. A review of investigation of the metabolic rate effects on human thermal comfort. Energy Build. 2024, 315, 114300. [Google Scholar] [CrossRef]
- Li, L.; Zhu, X.; Wang, X.; Yu, J.; Chen, S.; Gao, Y.; Zhai, Y. Estimating human metabolic rate at various activities using tri-axial accelerometers. Build. Environ. 2025, 277, 112944. [Google Scholar] [CrossRef]
- Zhang, S.; Zhao, S.; Sun, Z.; Zhai, Y. Gender differences in air movement preference after moderate-intensity exercise. Front. Archit. Res. 2025, 14, 198–209. [Google Scholar] [CrossRef]
- ISO 8996; Ergonomics of the Thermal Environment—Determination of Metabolic Rate. International Organization for Standardization: Geneva, Switzerland, 2021.
- Yang, Y.; Yu, J.; Lin, B.; Wang, Z.; Zhou, F. Effects of metabolic rate on the human thermal responses: A large cross-sectional field survey. Build. Environ. 2025, 270, 112515. [Google Scholar] [CrossRef]
- Gao, S.; Yang, L.; Zhao, S.; Liu, S.; Zhang, H.; Zhai, Y. Is the ISO 8996:2021 heart rate method accurate for predicting metabolic rate? An experimental validation based on Chinese young adults. Build. Environ. 2025, 282, 113235. [Google Scholar] [CrossRef]
- He, M.; Guo, J.; Liu, H.; Xiong, F.; Zhou, S.; Wu, Y.; Li, B.; Kosonen, R. Does BMI affect thermal comfort in young people in warm indoor environments? Evidence from a climate chamber experiment in non-normal BMIs. J. Build. Eng. 2025, 106, 112618. [Google Scholar] [CrossRef]
- André, M.; Schiavon, S.; Lamberts, R. Implementation of desk fans in open office: Lessons learned and guidelines from a field study. Build. Environ. 2024, 259, 111681. [Google Scholar] [CrossRef]
- Müller, M.J.; Geisler, C.; Hübers, M.; Pourhassan, M.; Braun, W.; Bosy-Westphal, A. Normalizing resting energy expenditure across the life course in humans: Challenges and hopes. Eur. J. Clin. Nutr. 2018, 72, 628–637. [Google Scholar] [CrossRef]
- Puyau, M.; Shypailo, R.; Butte, N.F.; Musaad, S.; Bacha, F. Prediction models of basal energy expenditure in children and adolescents across the BMI spectrum based on room calorimetry: A cross-sectional cohort study. Am. J. Clin. Nutr. 2025, 121, 284–292. [Google Scholar] [CrossRef]
- Porter, J.; Ward, L.C.; Nguo, K.; Davidson, Z.; Gibson, S.; Prentice, R.; Neuhouser, M.L.; Truby, H. Investigating the impact of body composition on the estimation of resting metabolic rate: New equations for adults aged ≥65 years developed using cross-sectional data. Am. J. Clin. Nutr. 2025, 121, 795–803. [Google Scholar] [CrossRef] [PubMed]
- Ribeiro, A.S.; Sofiati, S.L.; Kassiano, W.; Martinho, D.V.; Nascimento, M.A.; Avelar, A.; Trindade, M.C.C.; Mayhew, J.L.; Cyrino, E.S. Agreement between fat-free mass from bioelectrical impedance analysis and dual-energy X-ray absorptiometry and their use in estimating resting metabolic rate in resistance-trained men. J. Int. Soc. Sports Nutr. 2024, 21, 2357319. [Google Scholar] [CrossRef]
- Stampoulis, T.; Avloniti, A.; Draganidis, D.; Balampanos, D.; Chalastra, P.E.; Gkachtsou, A.; Pantazis, D.; Retzepis, N.-O.; Protopapa, M.; Poulios, A.; et al. New Bioelectrical Impedance-Based Equations to Estimate Resting Metabolic Rate in Young Athletes. Methods Protoc. 2025, 8, 53. [Google Scholar] [CrossRef] [PubMed]
- Marra, M.; Sammarco, R.; Cioffi, I.; Morlino, D.; Di Vincenzo, O.; Speranza, E.; Pasanisi, F. New predictive equations for estimating resting energy expenditure in subjects with normal weight and overweight. Nutrition 2021, 84, 111105. [Google Scholar] [CrossRef]
- Zhang, J.; Lu, J.; Deng, W.; Beccarelli, P.; Lun, I.Y.F. Investigation of thermal comfort and preferred temperatures among rural elderly in Weihai, China: Considering metabolic rate effects. J. Build. Eng. 2024, 97, 110940. [Google Scholar] [CrossRef]
- Wang, L.; Chen, M.; Yang, J. Interindividual differences of male college students in thermal preference in winter. Build. Environ. 2020, 173, 106744. [Google Scholar] [CrossRef]
- Camps, S.G.; Wang, N.X.; Tan, W.S.K.; Henry, C.J. Estimation of basal metabolic rate in Chinese: Are the current prediction equations applicable? Nutr. J. 2016, 15, 79. [Google Scholar] [CrossRef]
- Wang, X.; Mao, D.; Xu, Z.; Wang, Y.; Yang, X.; Zhuo, Q.; Tian, Y.; Huan, Y.; Li, Y. Predictive Equation for Basal Metabolic Rate in Normal-Weight Chinese Adults. Nutrients 2023, 15, 4185. [Google Scholar] [CrossRef] [PubMed]
- Fernández-Verdejo, R.; Sanchez-Delgado, G.; Ravussin, E. Energy Expenditure in Humans: Principles, Methods, and Changes Throughout the Life Course. Annu. Rev. Nutr. 2024, 44, 51–76. [Google Scholar] [CrossRef]
- Wang, Z.; Ying, Z.; Bosy-Westphal, A.; Zhang, J.; Schautz, B.; Later, W.; Heymsfield, S.B.; Müller, M.J. Specific metabolic rates of major organs and tissues across adulthood: Evaluation by mechanistic model of resting energy expenditure. Am. J. Clin. Nutr. 2010, 92, 1369–1377. [Google Scholar] [CrossRef]
- Hu, Y.; Wu, X.; Hu, Z.; Ren, A.; Wei, X.; Wang, X.; Wang, Y. Study of formula for calculating body surface areas of the Chinese adults. Acta Physiol. Sin. 1999, 51, 45–48. [Google Scholar]
- Wang, L.; Ren, X.; Zhu, X.; Li, W.; Yang, J.; Zhang, H.; Yang, J.; Yin, H. Effects of body muscle and fat on differences in thermal preference. Build. Environ. 2023, 243, 110643. [Google Scholar] [CrossRef]
- Millyard, A.; Layden, J.D.; Pyne, D.B.; Edwards, A.M.; Bloxham, S.R. Impairments to Thermoregulation in the Elderly During Heat Exposure Events. Gerontol. Geriatr. Med. 2020, 6, 2333721420932432. [Google Scholar] [CrossRef] [PubMed]
- Morris, N.B.; Chaseling, G.K.; English, T.; Gruss, F.; Maideen, M.F.B.; Capon, A.; Jay, O. Electric fan use for cooling during hot weather: A biophysical modelling study. Lancet Planet. Health 2021, 5, e368–e377. [Google Scholar] [CrossRef]
- McKenna, Z.J.; Foster, J.; Atkins, W.C.; Belval, L.N.; Watso, J.C.; Jarrard, C.P.; Orth, B.D.; Crandall, C.G. Age alters the thermoregulatory responses to extreme heat exposure with accompanying activities of daily living. J. Appl. Physiol. (1985) 2023, 135, 445–455. [Google Scholar] [CrossRef]
- Wittbrodt, M.T.; Millard-Stafford, M. Dehydration Impairs Cognitive Performance: A Meta-analysis. Med. Sci. Sports Exerc. 2018, 50, 2360–2368. [Google Scholar] [CrossRef]
- Pence, J.; Davis, A.; Allen-Gregory, E.; Bloomer, R.J. Hydration Strategies in Older Adults. Nutrients 2025, 17, 2256. [Google Scholar] [CrossRef]
- Mao, H.; Yu, H.; Tang, Y.; Weng, Q.; Zhang, K. Age differences in thermal comfort and sensitivity under contact local body cooling. Build. Environ. 2025, 268, 112355. [Google Scholar] [CrossRef]
- Jung, D.; Kim, H.; An, J.; Hong, T. Thermoregulatory responses of young and elderly adults under temperature ramps. Build. Environ. 2023, 244, 110760. [Google Scholar] [CrossRef]
- Zhu, H.; Huang, L.; Yu, C.W.F.; Su, H. Thermal comfort under weightlessness: A physiological prediction. Indoor Built Environ. 2020, 29, 1169–1180. [Google Scholar] [CrossRef]
- Chen, M.; Younes, J.; Farahani, A.V.; Kilpeläinen, S.; Kosonen, R.; Ghaddar, N.; Ghali, K.; Melikov, A.K. Evaluating thermal response when elderly people using local cooling devices: Correlation among overall and local thermal sensation with skin temperature. Build. Environ. 2024, 251, 111217. [Google Scholar] [CrossRef]
- Song, W.; Zhong, F.; Calautit, J.K.; Li, J. Exploring the role of skin temperature in thermal sensation and thermal comfort: A comprehensive review. Energy Built Environ. 2025, 6, 762–781. [Google Scholar] [CrossRef]
- Mun, S.; Yoo, J.; Lee, S.; Yim, M.H.; Kim, S.; Kim, D.; Kim, M.-J.; Lee, Y.; Park, J.H. Resting energy expenditure differs among individuals with different levels of perceived thermal sensitivity: A cross-sectional study. Medicine 2024, 103, e38293. [Google Scholar] [CrossRef] [PubMed]
- Chen, S.; Geng, J.; Lan, M.; He, S.; Weng, W. Study on physiological features, subjective perception, and cognitive performance of individuals in prolonged high-temperature environments. Build. Environ. 2025, 273, 112700. [Google Scholar] [CrossRef]
- Chen, S.; Mihara, K.; Wong, N.H.; Lee, J.K.W.; Tan, C.L. A Semi-Automatic Data Management Framework for Studying Thermal Comfort, Cognitive Performance, Physiological Performance, and Environmental Parameters in Semi-Outdoor Spaces. Sustainability 2023, 15, 183. [Google Scholar] [CrossRef]
Disclaimer/Publisher’s Note: The statements, opinions and data contained in all publications are solely those of the individual author(s) and contributor(s) and not of MDPI and/or the editor(s). MDPI and/or the editor(s) disclaim responsibility for any injury to people or property resulting from any ideas, methods, instructions or products referred to in the content. |
© 2025 by the authors. Licensee MDPI, Basel, Switzerland. This article is an open access article distributed under the terms and conditions of the Creative Commons Attribution (CC BY) license (https://creativecommons.org/licenses/by/4.0/).