Abstract
Conventional tunnel face stability models are constrained by idealized steady-state seepage assumptions, one-dimensional formulations for inherently three-dimensional flow, and the neglect of transient filter-cake effects. To address these limitations, this study focuses on blowout failure triggered by excess slurry pressure in slurry pressure balance shield tunneling. We establish a limit-analysis framework that couples slurry infiltration with transient seepage, developing a work rate-balance formulation and a three-dimensional rotational failure mechanism. This framework incorporates heterogeneous, time-dependent filter-cake pressure transfer and the spatiotemporal evolution of pore pressure—key factors overlooked in traditional models. Transient seepage simulations demonstrate that the spatiotemporal heterogeneity of the dynamic filter cake provides the fundamental pressure basis for blowout failure. A prominent hydraulic gradient within the potential core failure zone (Z/R ≤ 2.0, Y/R ≤ 2.0) drives failure initiation and propagation, with the vertical hydraulic gradient in the high-risk subregion (Z/R < 0.5) reaching values as high as 12. Results indicate that passive failure risk increases markedly when excess slurry pressure exceeds 200 kPa, accompanied by a sharp decline in the safety factor. Validation against the Heinenoord No. 2 Tunnel case confirms that the proposed three-dimensional model more accurately captures 3D seepage characteristics and critical failure pressures compared to traditional wedge–prism approaches. By overcoming steady-state and one-dimensional simplifications, this framework deepens the understanding of blowout evolution and provides theoretical guidance for the rational control of slurry pressure and improved tunnel-face stability assessment under complex transient conditions.
1. Introduction
In soft-ground tunneling beneath high groundwater pressures, the slurry pressure balance (SPB) shield method—employing pressurized bentonite slurry—is widely used to stabilize the excavation face. A pressure differential between the TBM chamber and the formation drives slurry to penetrate the ground ahead of the face, forming a filter cake in fine soils and a permeation zone in coarse soils; this process generates excess pore water pressure and alters soil properties, consequently influencing the stability of the excavation face [1]. Ensuring stability, therefore, requires that slurry pressure be effectively transmitted to the soil skeleton to counteract earth and hydrostatic pressures as well as the induced pore pressures; appropriately setting and delivering slurry pressure is, thus, fundamental. The traditional full-membrane model, which assumes complete pressure transfer, is only applicable in exceptional circumstances [2,3] and, in practice, the presence of excess pore pressure substantially undermines slurry support [4,5,6]; therefore, a predictive model that couples slurry penetration with face stability is essential.
Current research on slurry shield tunnel face stability mainly focuses on the interaction between slurry infiltration and the surrounding soil. Zhao et al. [7] used numerical simulations to embed infiltration forces into the wedge–prism model, calculating the ultimate slurry pressure for maintaining the tunnel face stability. They found that higher slurry pressure reduces pore pressure outside the instability zone, contributing less to face stability. Zizka and Thewes [8] introduced the concept of effective support rate, defined as the ratio of the slurry infiltration area to the wedge area, to describe overall face stability. Zizka et al. [9,10] further studied slurry–soil–cutter interactions and considered time-dependent slurry infiltration in evaluating face stability.
In practical engineering, the full-membrane model is frequently adopted to evaluate tunnel face stability [11,12]. This model assumes that an impermeable filter cake forms ahead of the shield face, fully transmitting the slurry pressure to the soil skeleton to counterbalance earth pressure—an assumption valid only under specific conditions, such as during chamber maintenance [2,3]. In reality, however, the slurry pressure often exceeds the pore water pressure in the soil, inducing continuous infiltration and generating excess pore pressure [13,14]. Extensive field measurements have confirmed this phenomenon [4,15], which significantly weakens the supporting effect of slurry pressure and compromises face stability [4,6]. Although the slurry infiltration effect (e.g., maximum penetration depth [16]) has long been a focal point of study, and filtration column tests [17,18] along with analytical approaches have elucidated certain infiltration patterns, existing evaluation methods still suffer from two major deficiencies: (1) the use of one-dimensional formulas to represent inherently complex three-dimensional seepage processes [2,15], which fails to capture the spatial distribution of pressure transmission, and (2) the consideration of excess pore pressure only in front of the tunnel face, neglecting its vertical distribution above the tunnel and its influence on the overall failure mechanism [2,15]. From a numerical standpoint, although finite element methods have been used to estimate critical slurry pressures, infiltration is typically confined to a cylindrical region ahead of the face, with the slurry pressure assumed to be vertically uniform [19]. These simplifications overlook realistic pressure variations and lack comparative analyses across different infiltration scenarios [20].
In summary, existing slurry shield tunnel face stability models still have significant limitations: they are not only constrained by idealized steady-state assumptions, making it difficult to capture transient seepage and dynamic filter cake behavior induced by cutterhead rotation, but also suffer from insufficient research on passive failure mechanisms such as blowouts triggered by excess slurry pressure, leaving the coupled process of “slurry infiltration–pressure accumulation–core zone instability” not systematically elucidated. To address these gaps, this study integrates existing theoretical models in geotechnical limit analysis [21] and engineering cases to investigate the passive failure mechanisms of tunnel faces under excess slurry pressure. A three-dimensional analytical model coupling slurry infiltration, soil mechanical properties, and excess pore water pressure is developed and validated through a real-world case study [22]. Subsequently, a transient seepage model incorporating a heterogeneous dynamic filter cake will be used to analyze the characteristics of the potential unstable core zone, providing theoretical guidance for the dynamic regulation of slurry pressure under complex construction conditions. Compared with the studies by Hou et al. (2022) [23] and Vu & Broere (2023) [24], the incremental contributions of this study are as follows: (1) In terms of passive failure formulation, the 3D discretized rotational failure mechanism is extended to the passive failure scenario, a work rate balance equation considering the negative effect of seepage work is derived, and a quantitative “excess slurry pressure-safety factor” model is established to fill the gap in the quantitative analysis of passive failure risk; (2) In terms of transient seepage/filter cake modeling, a dynamic coupled model is constructed to simulate the spatiotemporal evolution of filter cake permeability coefficient (1.0 × 10⁻¹⁰~1.0 × 10⁻⁴ m/s) under cutterhead cutting, and the characteristic that the vertical hydraulic gradient in the high-risk subzone (Z/R < 0.5) of the core failure zone (Z/R ≤ 2.0, Y/R ≤ 2.0) reaches 12 is clarified, breaking through the 1D simplification and homogeneous filter cake assumption of traditional models.
2. Methods
2.1. Three-Dimensional Discretization-Based Rotational Failure Mechanism of Tunnel Face
To assess the stability of the tunnel face using the upper bound theorem, it is necessary to calculate the external work rate and internal energy dissipation rate within the three-dimensional rotational failure mechanism to quantitatively evaluate the influence of various factors. As shown in Figure 1, the three-dimensional rotational failure mechanism generated by spatial discretization is composed of a series of discrete small elements. A series of triangular surfaces form the boundary of the failure mechanism, with the points , and being the projections of points , and onto the symmetry plane. As illustrated in Figure 1, the calculation of the work rate balance equation can be obtained by simply integrating and summing over each microelement (element volume or element surface) [23].
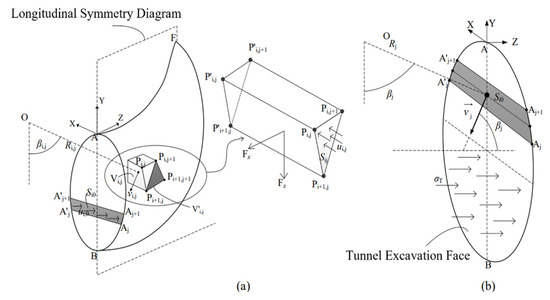
Figure 1.
Schematic diagram of energy dissipation calculation for the three-dimensional discretization-based failure mechanism of the tunnel face: (a) discretization of the failure block; (b) discretization of the tunnel face.
2.2. Blowout Failure Mechanism Due to Excess Slurry Pressure
In areas with shallow burial depth and weak strata, excess slurry pressure during construction can cause slurry fracturing in the ground ahead of the excavation face, leading to localized failures such as slurry blowouts. If the slurry pressure continues to increase, overall passive failure may occur [24,25,26]. Both active and passive instabilities increase the likelihood of shield machine downtime and could even damage the tunnel. Therefore, it is essential to study the permissible maximum support pressure. For shallow tunnels, where the overlying soil has relatively low resistance, the range for operating the support pressure at the excavation face is narrower, making this balance even more critical. Current studies on instability due to excess slurry pressure mainly utilize the wedge–prism model of limit equilibrium. Instability is determined by whether the upward vertical stress exceeds the total downward stresses, including gravity and friction. Research has shown that the pressure at which slurry blowout occurs is approximately equal to the pore water pressure plus two to three times the vertical effective stress [22]. This failure mode focuses only on the stress relationship in the vertical direction and does not consider the role of slurry infiltration within the entire failure mechanism. In this paper, we adopt a framework based on limit analysis, considering the overall passive failure mechanism influenced by slurry infiltration, and establish a work rate balance equation to solve for the critical pressure [27].
When slurry pressure is excessively high, particularly in shallow-buried tunnels, hydraulic fracturing can easily occur. As the slurry pressure further increases, surpassing the combined soil and water pressure ahead of the excavation face, fractures may extend to the surface, pushing the soil column above the excavation face upward. This can eventually lead to the escape of the support medium, causing surface deformation that may damage buildings and disrupt transportation, as shown in Figure 2. To prevent such occurrences, it is crucial to determine the maximum allowable support pressure.
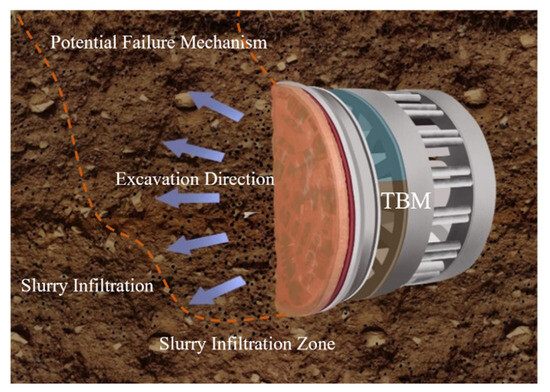
Figure 2.
Schematic diagram of a slurry shield with excess slurry pressure.
Although various passive failure mechanisms for tunnel faces have been proposed and validated in previous studies [26], none have accounted for the impact of slurry infiltration. To address passive failure caused by excess slurry pressure, a three-dimensional rotational failure mechanism was generated using the spatial discretization technique from Mollon et al. [26] within a limit analysis framework, as depicted in Figure 3. To avoid ambiguities in the calculation of work rate balance equations (e.g., seepage force work rate, cohesive energy dissipation rate) in subsequent steps and clarify the meanings of key parameters related to this failure mechanism, Table 1 systematically defines the symbols, definitions and units of core parameters for passive failure analysis, providing a unified parameter reference for subsequent mechanical modeling [23]. The failure mechanism’s profile is defined by two logarithmic spirals; the expressions are presented as follows:
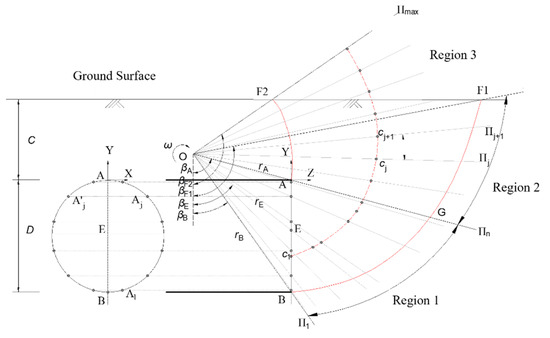
Figure 3.
Process of generating the passive failure mechanism for the excavation face of a shallow tunnel.

Table 1.
Definitions, physical meanings and units of core parameters for tunnel face stability analysis.
The passive failure mechanism is divided into three regions. The specific discretization process can refer to Mollon et al., whose principle is similar to that of the active failure mechanism. Both processes start the discretization from the tunnel excavation face and, following the associated flow rule, continuously generate new discrete points on each radial plane until both logarithmic spirals intersect the ground surface (points F1 and F2).
2.3. Work Rate Calculation and Safety Factor in Passive Failure Mode
In the case of passive failure due to excess slurry pressure, the external work rate is mainly contributed by the weight of the soil and the infiltration forces caused by pressure from slurry excess. Internal energy dissipation occurs along the surfaces of velocity discontinuity. The external work rate can be obtained by simply summing the external work rate for each micro-element (a unit volume or unit surface area). Since rigid body rotation is assumed, internal energy dissipation only occurs on the surfaces where velocity discontinuities exist. Therefore, the total internal energy dissipation rate is the sum of the dissipation rates across all the small triangular surfaces.
This study calculates the safety factor for the passive failure mode under excess slurry pressure. In the passive failure scenario of the excavation face, the infiltration force does negative work (), which facilitates the occurrence of passive failure, while gravity does positive work () and, together with the cohesive energy dissipation rate () resists failure. The derivations of these work rates (, , ) are based on the principle of virtual work, as shown in Equations (3)–(5):
where is the unit weight, () is the volume of the discrete block, and are the polar coordinates of the discrete points on the failure surface and tunnel face, () are the area of the discrete triangular surfaces on the failure surface. More details can be found in the previous Table 1 and previous literature [21].
Using the effect on tunnel face passive failure as the criterion, work and energy dissipation that resist passive failure are defined as “positive”, while work that promotes passive failure is defined as “negative”—this rule is consistent with the upward or forward movement direction of the soil during passive failure. Specifically, Equation (3) () is positive work, as gravity acts vertically downward, opposite to the soil failure direction, which can inhibit soil uplift; Equation (4) () is negative work, as the infiltration force acts along the seepage direction, which can induce slurry blowout (a typical manifestation of passive failure); Equation (5) () is positive work, as cohesion can resist soil shear deformation and hinder the expansion of the failure surface. The reason for the negative value of lies in excess slurry pressure: this pressure aligns the direction of the infiltration force with the soil failure direction, causing the infiltration force to accelerate soil instability rather than exert a resisting effect.
The safety factor is defined using the ratio method, which can be expressed as follows:
3. Comparisons of Active Failure and Passive Failure
This section presents an engineering case analysis based on the reported slurry blowout incident at the Heinenoord Tunnel 2 [28]. Located along the A29 motorway in southern Rotterdam, the Netherlands, this twin-tube non-motorized traffic tunnel has a total length of 950 m. It was excavated using an 8.55 m-diameter Herrenknecht Mixshield, which is adapted to soft soil strata with high groundwater levels and equipped with a 500 kW cutterhead and a maximum torque of 4520 kN·m [28]. The geological cross-section and the location of the slurry blowout incident are shown in Figure 4. The construction parameters are as follows: the tunnel diameter is 8.4 m, the burial depth is 8.6 m, the water table is 11 m below the surface, and the distance from the water table to the top of the tunnel is 19.6 m. The surrounding soil is primarily Pleistocene sand, which is classified as medium sand with an effective particle size = 0.3–0.5 mm, uniformity coefficient = 3.2–4.5, and curvature coefficient = 1.0–1.2. The following input parameters: soil cohesive force = 0 kPa, effective internal friction angle = 36.5°, soil unit weight = 20 kN/m3, soil permeability coefficient = 1.2 × 10⁻⁴–1.8 × 10⁻⁴ m/s [28,29]. Tunnel lining thickness = 0.35 m made of reinforced concrete, with an outer lining radius = 4.2 m. Bentonite slurry properties, unit weight = 10.5–12 kN/m3, plastic viscosity = 22–28 mPa·s, yield stress = 8–12 Pa, and API filtration loss ≤ 15 mL/30 min. These properties were obtained through laboratory tests that comply with API 13A-2020 [30]. During construction, monitoring was conducted, including real-time monitoring of excess pore water pressure along the Z-axis with a sampling frequency of 10 data points per hour and continuous recording of TBM operating parameters. This monitoring work complies with the Chinese national standard GB 50446-2017 [31]. According to the report by Bezuijen and Brassinga [28], during the slurry blowout, the support pressure measured at the tunnel crown was 405 kPa, and at the tunnel center, it was 450 kPa.
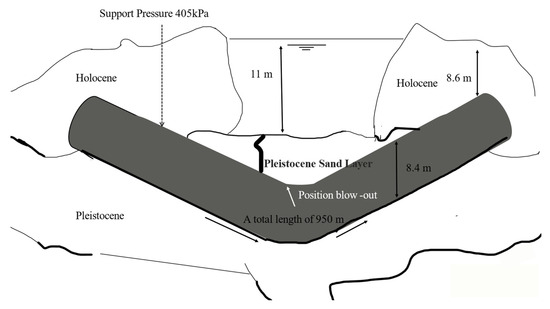
Figure 4.
Illustration of geological cross-section and location of slurry blowout incident at Heinenoord tunnel 2.
Figure 5 illustrates the variation in the safety factor under passive failure mode with changes in slurry excess pressure () at the top of the excavation face. The measured support pressures at the tunnel crown and center were converted into corresponding slurry excess pressures and are marked on the graph. For comparison, the safety factor for the active failure mode, defined using the ratio method, is also plotted. When calculating the safety factor for the active failure mode, only pure seepage without the influence of the slurry membrane was considered, where gravity does negative work, favoring passive failure, while the work performed by infiltration forces and the cohesive energy dissipation rate together resist failure. The graph shows that the risk of passive failure is negligible when the slurry excess pressure () is below 200 kPa. However, as () increases beyond 200 kPa, the safety factor rapidly decreases, eventually reaching a critical state ( = 1) at approximately 265 kPa. At this point, the total slurry pressure at the top of the excavation face (slurry excess pressure plus hydrostatic pressure) is 461 kPa, which is significantly higher than the slurry blowout pressure of 405 kPa reported by Bezuijen and Brassinga [28]. This indicates that the slurry pressure required for overall passive failure is much higher than that for slurry blowout.
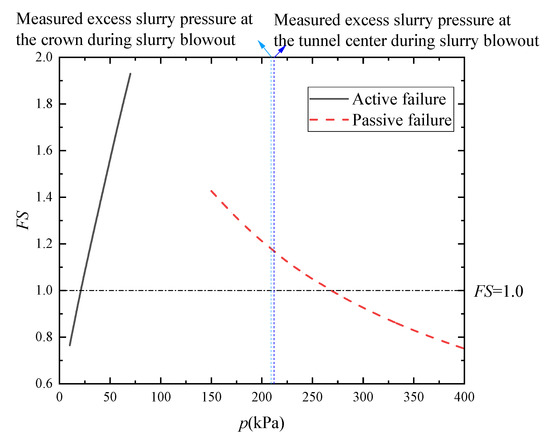
Figure 5.
Variation in safety factor with slurry excess pressure under passive failure mode.
The design of optimal support pressure involves operational considerations. Insufficient pressure may lead to collapse, while higher support pressure does not necessarily ensure safer excavation, as it can cause overburden cracking or blowouts of the support medium. A reasonable slurry pressure setting should account for both active and passive failure modes, making the optimal support pressure fall between the maximum and minimum limits. The local failure due to slurry blowout under the influence of slurry infiltration needs to be studied from a microscopic perspective involving the interaction between slurry particles and soil skeleton particles. However, current research in this area is limited, and there is a lack of a suitable model for quantitative evaluation. Therefore, the focus here is primarily on determining the upper limit of support pressure related to overall failure in the passive failure mode. To ensure construction safety, a certain margin of error should be considered between the upper and lower limits due to operational inaccuracies. The resulting operational range for slurry pressure is approximately illustrated in Figure 6.
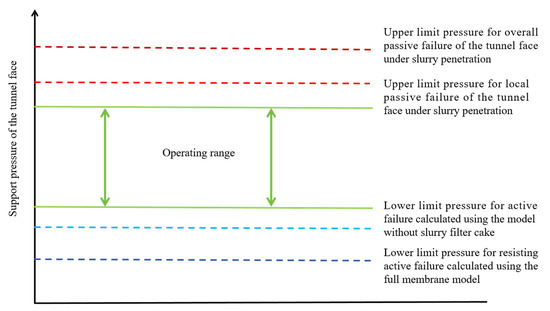
Figure 6.
Schematic of upper and lower limits of slurry pressure considering both active and passive failure modes of the tunnel face.
Using the calculation framework established in this study for both active and passive failure modes, the critical pressures ( = 1) for active and passive failure under different conditions for the Heinenoord Tunnel 2 were solved. The results are shown in Table 2. Since the slurry blowout incident reported in Heinenoord Tunnel 2 occurred in a nearly homogeneous sand layer, the soil cohesion and several approximate values of the internal friction angle based on the geological data from were considered for reference, as shown in Table 1. In the calculations, the active failure mode considered both the intact slurry membrane model, which has the highest-pressure transmission efficiency, and the pure seepage model, which has the lowest pressure transmission efficiency, for comparison. It was found that the critical pressure for passive failure can differ by hundreds of kilopascals compared to the critical pressure for active failure. Additionally, the critical slurry excess pressure corresponding to the intact slurry membrane model and the pure seepage model showed little difference when compared to the passive failure mode. When comparing the three cases, it was also evident that the value of the internal friction angle significantly impacts the critical support pressure calculated under the passive failure mode, consistent with the findings of Mollon et al. [26].
Table 2.
Upper and lower limits of slurry excess pressure (p) at the crown, considering active and passive failure modes at the excavation face [Unit: kPa].
Figure 7 illustrates the critical failure mechanisms for both active and passive modes under three different scenarios corresponding to Case 1, including an intact slurry membrane model—active failure mode where the pressure drop reduction coefficient is α = 0 and slurry pressure is completely transferred, with failure concentrated in a compact wedge near the excavation face and the intact filter cake blocking seepage to achieve maximum support efficiency; a pure seepage model—active failure mode where the pressure drop reduction coefficient is α = 1 and slurry pressure is transferred only via seepage, with a shape similar to that of the intact slurry membrane model but a slightly larger range due to seepage-weakened support effect; a passive failure mode where the excess slurry pressure is over 200 kPa, with a much larger range that penetrates the ground to form an overall instability channel. It can be observed that the failure mechanisms of the intact slurry membrane model and the pure seepage model are very similar, while that of the passive failure mode is much larger. This further indicates that the support pressure required for passive failure is significantly greater than that required for active failure, which confirms the conclusion that passive critical pressure is higher than blowout pressure and provides a basis for defining the safe slurry pressure range in engineering.
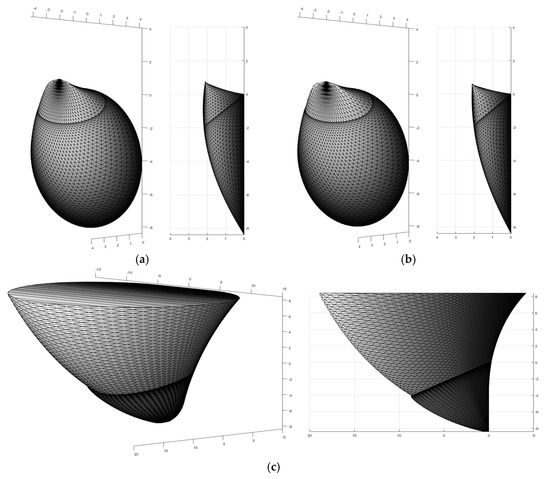
Figure 7.
Failure mechanisms considering both active and passive failure modes at the excavation face: (a) full membrane model—active failure mode; (b) pure seepage model—active failure mode; (c) passive failure mode.
4. Pressure Transfer Mechanisms Under Transient Seepage
Section 3 validated the effectiveness of the three-dimensional passive failure model through the Heinenoord No. 2 Tunnel case, establishing a quantitative relationship between excess slurry pressure and passive failure risk. It was also found that the computed critical pressure for passive failure is significantly higher than the blowout pressure observed in practice. Conventional models, which rely on the steady-state seepage assumption and simplified slurry pressure transfer patterns—such as the full-membrane, pure-infiltration, or pressure-reduction-coefficient models—fail to account for the essential cause of this discrepancy. Specifically, they neglect the cyclic cutting-induced disruption of the filter cake integrity and the transient evolution of slurry infiltration, and therefore, cannot accurately capture the localized excess pressure that triggers a non-uniform blowout failure. Indeed, comparative analyses in Section 3 indicate that the spatiotemporal fluctuation of slurry pressure transfer efficiency and the heterogeneous mechanical response of local high-risk zones constitute the critical link between excess pressure and actual blowout incidents. Such intricate mechanisms must therefore be explored from a transient seepage perspective [32,33].
A series of transient seepage simulations reveals that during the unsteady slurry infiltration process, the pressure transmission behavior of the dynamic filter cake and the mechanical response of the potential failure core zone are the two dominant factors driving excavation-face blowout under excess slurry pressure. This section elucidates the blowout mechanism from two complementary aspects—pressure transmission characteristics and core failure driving forces.
4.1. Transient Seepage Numerical Model with a Heterogeneous Dynamic Filter Cake
A three-dimensional numerical model is established to simulate transient slurry infiltration and dynamic pressure transfer, with particular emphasis on the evolution of permeability in the slurry penetration zone and the spatiotemporal variation in excess pore pressure, while incorporating the effects of cutterhead layout (Figure 8). Model parameters are defined based on the engineering case: both the cover thickness C and tunnel diameter D are 10 m, the groundwater table is fixed at the ground surface, the effective unit weight of soil is = 11 kN/m3, and the bentonite slurry has a unit weight of = 12 kN/m3. Owing to the density difference between slurry and water, the excess slurry pressure along the excavation face is linearly distributed—from at the crown to at the invert—where denotes the unit weight of water. The model = 11 kN/m3 dimensions in the X, Y, and Z directions are set as 10D × 6.5D × 10D to eliminate boundary effects, with a 10 cm-thick slurry penetration zone refined with a dense mesh. Boundary conditions fit actual seepage and dynamic construction: tunnel lining is defined as impermeable boundary, so seepage only occurs through the excavation face; dynamic boundary is realized by periodically updating filter cake segment permeability according to cutterhead rotation cycle T, simulating continuous filter cake destruction and repair by tool cutting.
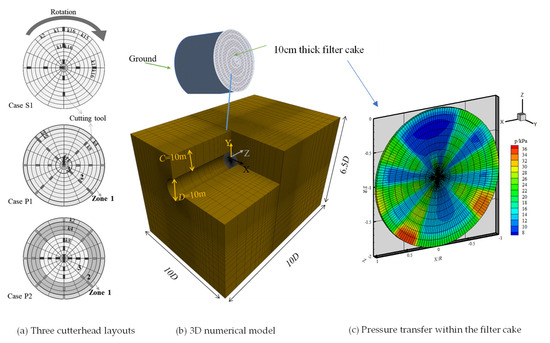
Figure 8.
Illustration of the 3D numerical model incorporating a heterogeneous dynamic filter cake.
To simulate the heterogeneous and dynamic characteristics of the dynamic filter cake, a block-assignment method is employed: the 10 cm thick dynamic filter cake is divided radially into ten layers and circumferentially into sixteen segments—a configuration proven efficient in engineering validation. Three cutterhead layouts are considered: S1 (single-track, single-cutter), P1 (outer ring 6, middle 2, inner 1), and P2 (outer ring 8, middle 4, inner 2). The permeability coefficients of each block are dynamically updated to reproduce the cutting cycle. Immediately after cutting, the permeability of the affected block surges from 1.0 × 10⁻¹⁰ m/s to 1.0 × 10⁻⁴ m/s, then decays exponentially as clogging progresses. This dynamic adjustment quantitatively represents cutter-induced degradation of filter cake integrity, providing the numerical foundation for subsequent analyses of pressure transfer behavior and the mechanical response of the core failure zone. Three cutterhead layouts are considered S1 single-track single-cutter, P1 outer ring 6 middle 2 inner 1 and P2 outer ring 8 middle 4 inner 2, corresponding to different disturbance degrees on the filter cake interface.
The model incorporates three key materials with distinct properties and constitutive models to reflect physical-mechanical behavior during transient seepage. The stratum is assumed as homogeneous isotropic medium with effective unit weight = 11 kN/m3, and its permeability anisotropy is neglected except for dynamic adjustment in the filter cake region; stratum fluid constitutive adopts Darcy’s law-based transient seepage model to describe three-dimensional flow characteristics of groundwater and slurry. Bentonite slurry has unit weight = 12 kN/m3 and viscosity, which affects infiltration rate and filter cake formation efficiency. Dynamic filter cake shows heterogeneous block distribution, with initial permeability 1.0 × 10⁻¹⁰ m/s and maximum permeability 1.0 × 10⁻⁴ m/s after cutting; its constitutive model is time-dependent permeability model, using exponential decay function to characterize permeability recovery after cutting. The overall seepage field adopts three-dimensional transient seepage constitutive model, coupling seepage interaction between filter cake and stratum to fully capture dynamic pressure transfer during slurry infiltration.
4.2. Pressure Transfer Characteristics of the Dynamic Filter Cake
Based on the three-dimensional transient seepage model with a heterogeneous dynamic filter cake established in Section 4.1 (using block simulation and cutterhead layouts S1, P1, and P2), the dynamic filter cake—serving as the key interface for slurry pressure transfer—provides the essential pressure foundation for blowout failure under excess slurry pressure through its spatiotemporal heterogeneity at the terminal interface [34]. As the slurry excess pressure within the TBM chamber follows a linear distribution, the terminal pressure of the dynamic filter cake increases progressively from the crown to the invert. At t/T ≥ 1/2, this vertical difference becomes more pronounced, with the lower part of the excavation face subjected to prolonged excess pressure, making it the most susceptible region to hydraulic fracturing and the likely initial breakthrough zone of a blowout.
The rotation and cutting action of the TBM tools induce abrupt pressure variations between freshly cut and uncut segments of the filter cake. In freshly cut zones, rapid slurry infiltration causes a sharp rise in pore pressure and a sudden drop in effective stress, weakening shear strength instantaneously. When compounded by excess pressure, these zones become instantaneous weak spots prone to blowout initiation.
A higher cutter density leads to more severe filter cake degradation and localized excess pressure. For example, at t/T = 1/8 and = 0.2, the average terminal pressure of the filter cake in the multi-cutter layout P2 is 59.1% higher than that in the single-cutter layout S1, implying a markedly greater blowout risk. As cutterhead rotation proceeds (t/T from 1/8 to 1), forward seepage and pressure accumulation continuously increase the risk until a dynamic equilibrium is achieved. Analysis of the terminal pressure drop further confirms that the maximum proportion of slurry excess pressure transferred through the dynamic filter cake is below 40%, with most pressure loss occurring near the excavation face (Figure 9, Figure 10 and Figure 11). Because S1 experiences less disturbance, it exhibits a larger pressure drop ratio and better controllability, whereas P2—with a smaller pressure drop ratio and more frequent excess pressure—constitutes a high-risk configuration. The horizontal pressure drop distribution remains relatively uniform (Figure 12), with risk variation under 5%, clearly indicating that vertical direction control is crucial for safety management.
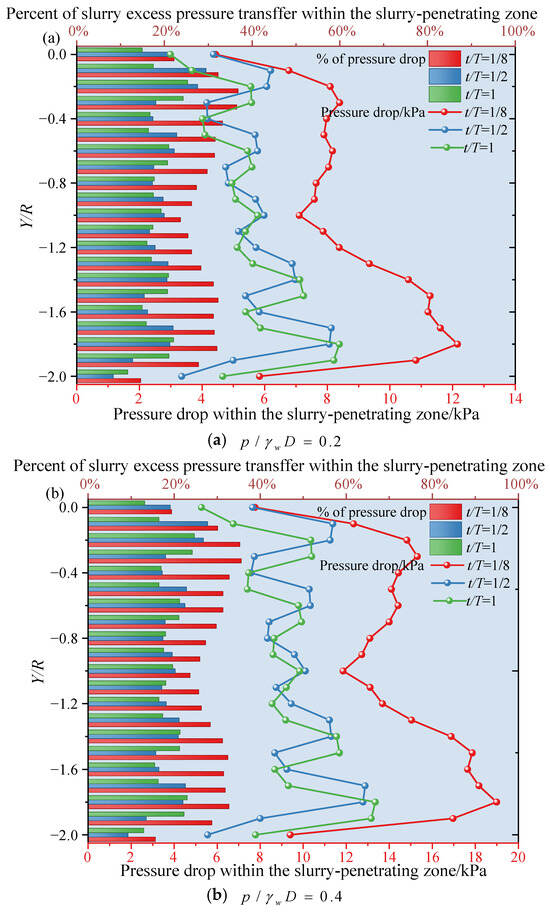
Figure 9.
Pressure drop along the vertical axis at the end of the dynamic mud film under condition S1.
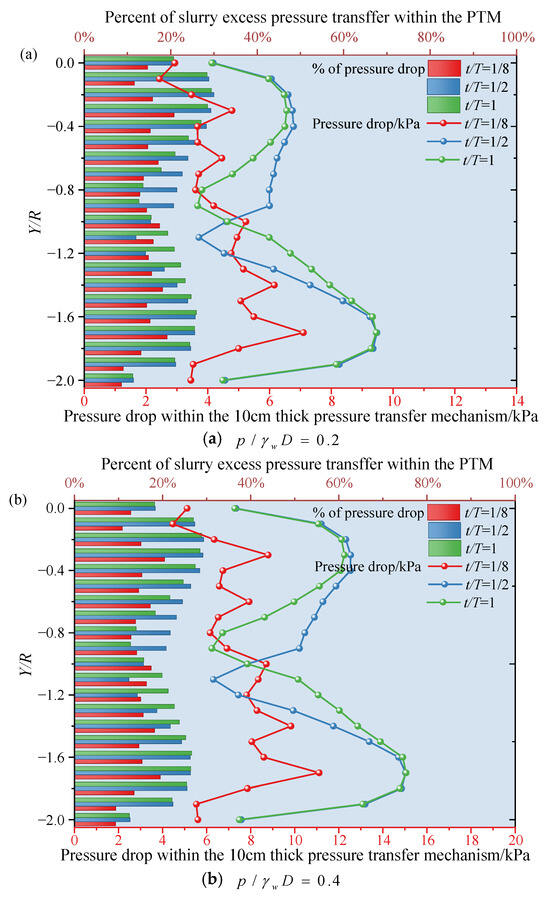
Figure 10.
Pressure drop along the vertical axis at the end of the dynamic mud film under condition P1.
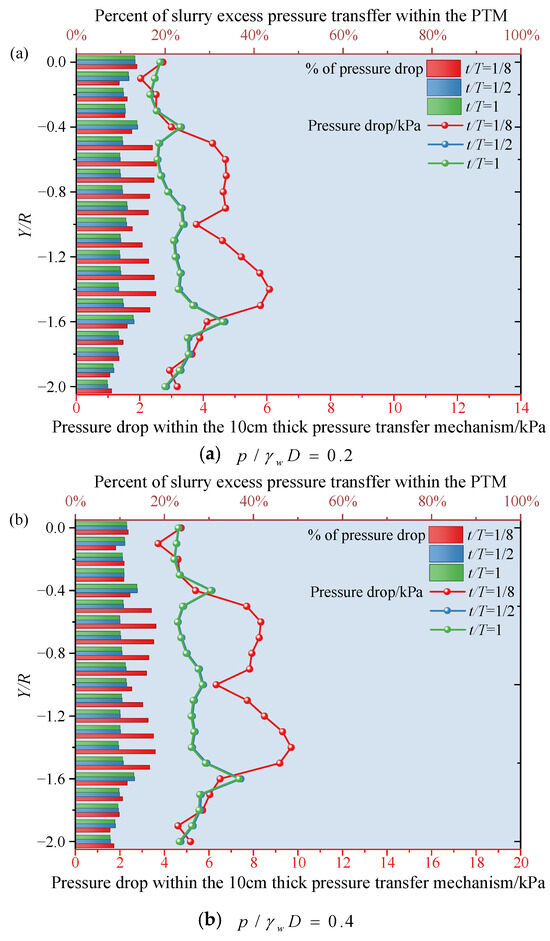
Figure 11.
Pressure drop along the vertical axis at the end of the dynamic mud film under condition P2.
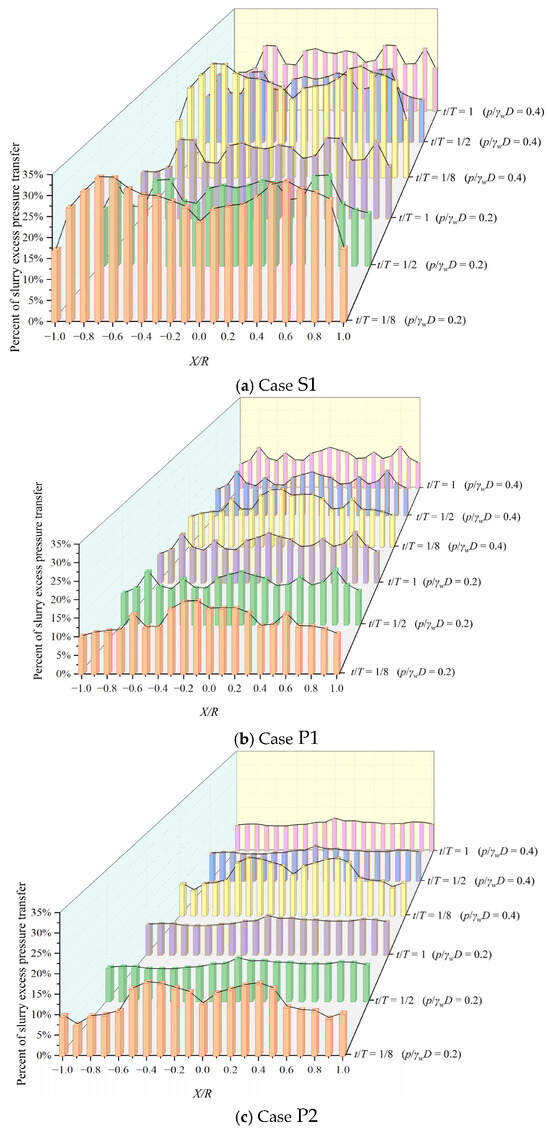
Figure 12.
Percentage of slurry excess pressure transfer on the horizontal axis at the end of the dynamic mud film in three scenarios.
4.3. Zone Hydro-Mechanical Driving Mechanisms in the Potential Core Failure Zone
Based on the results of the three-dimensional transient seepage simulations incorporating the heterogeneous dynamic filter cake (Section 4.1), the potential core failure zone—defined as Z/R ≤ 2.0 and Y/R ≤ 2.0 (Z being the advance direction and R the tunnel radius)—is identified as the high-incidence region of blowout failure [35]. The pattern of pressure transfer (Figure 13) and hydraulic gradient distribution within this zone directly governs the onset and propagation of failure. The simulations reveal spatial heterogeneity in excess pressure attenuation and its evolution with time and initial slurry pressure. The accumulation of effective excess pressure at the distal end of this core zone provides the critical driving force for blowout initiation and evolution.
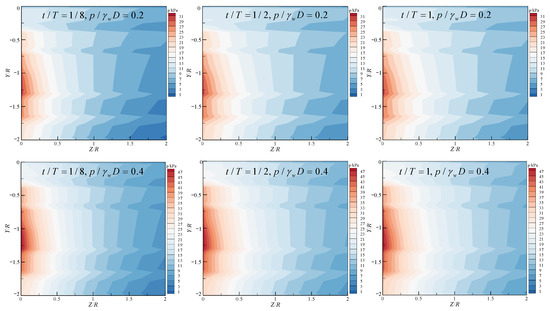
Figure 13.
Contour of pressure transfer ahead of the tunnel face for Case P1.
Figure 14, Figure 15 and Figure 16 illustrate the normalized pressure-drop distributions along three representative horizontal axes ahead of the tunnel face (Y/R = 0, −1, −2). Table 3 analyzes the attenuation law of excess pore water pressure along the advance direction (Z-axis) and its impact on blowout risk in different sub-zones. This zoning system clearly reveals the spatial evolution pattern of blowout risk: failure initiates with the sharp loss of effective stress in the high-risk subzone, propagates through the dynamically unstable transitional sub-zone, and dissipates in the low-risk sub-zone where soil stress re-stabilizes. Cutterhead rotation further amplifies the cumulative risk. As t/T increases from 1/8 to 1.0, the normalized pressure drop variation at the same location can reach 10%, indicating that the early stage of tunnel excavation (t/T < 3/8) is a critical window for risk prevention and control.
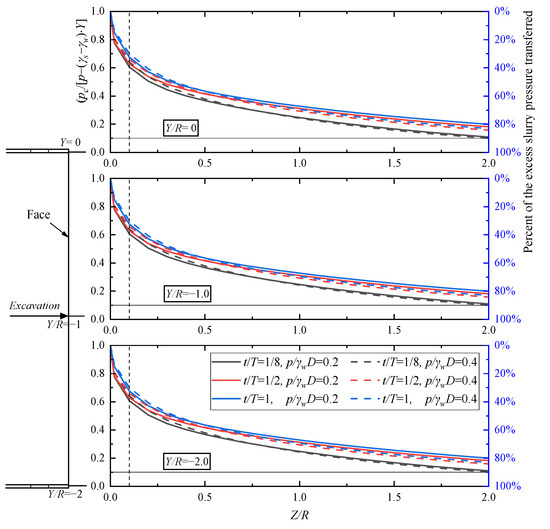
Figure 14.
Shows the normalized pressure drop distribution across three representative axes in the core zone of dynamic mud film under condition S1.
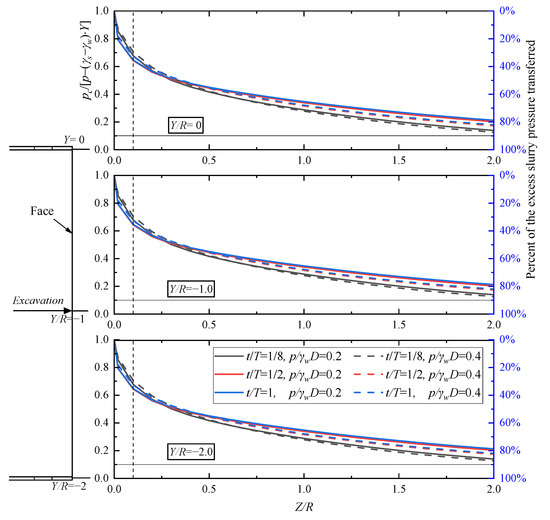
Figure 15.
Shows the normalized pressure drop distribution across three representative axes in the core zone of dynamic mud film under condition P1.
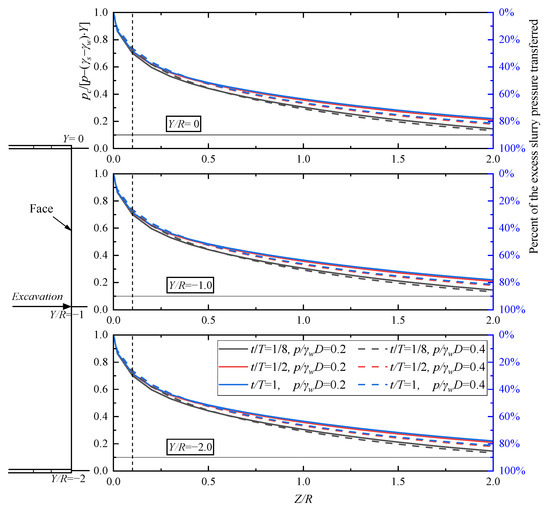
Figure 16.
Shows the normalized pressure drop distribution across three representative axes in the core zone of dynamic mud film under condition P2.
Table 3.
Classification of the Potential Core Failure Zone Ahead of the Tunnel Face.
As seepage force governs excavation-face stability, the hydraulic gradient effectively reflects the stabilizing influence of slurry pressure. Figure 17, Figure 18 and Figure 19 present hydraulic gradient projections along seven typical lines (Z1, Z2, Z3, Y1, Y2, X1, X2), with spatial locations annotated. The hydraulic gradient, as the direct source of seepage force, shows a steep rise in the Z-direction (advance direction) within the high-risk subzone (Z/R < 0.5), reaching values up to 12 before dropping rapidly to zero, while gradients in the X and Y directions fluctuate only near zero (maximum ≤ 1.5). Such a steep Z-direction gradient generates seepage forces strong enough to overcome interparticle friction, mobilizing soil grains toward the excavation face, forming shear planes, and ultimately triggering blowout. Even under identical slurry pressure, t/T-dependent variations in hydraulic gradient remain within 5–8%, implying that once a high-gradient condition forms in the core zone, it becomes a latent instability, which may evolve into actual failure with increasing slurry pressure or decreasing soil strength.
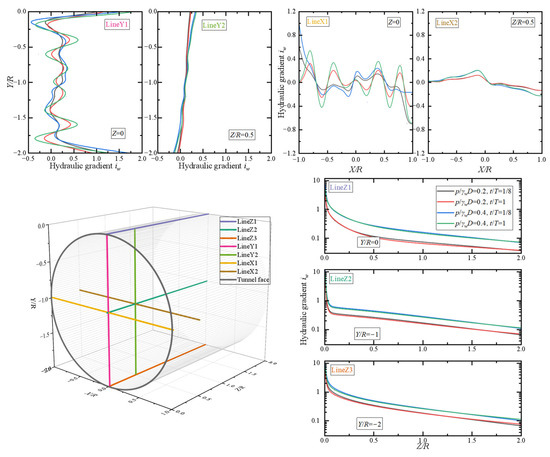
Figure 17.
Hydraulic gradient projections along seven representative axes in the core excavation zone under condition S1.

Figure 18.
Hydraulic gradient projections along seven representative axes in the core excavation zone under condition P1.
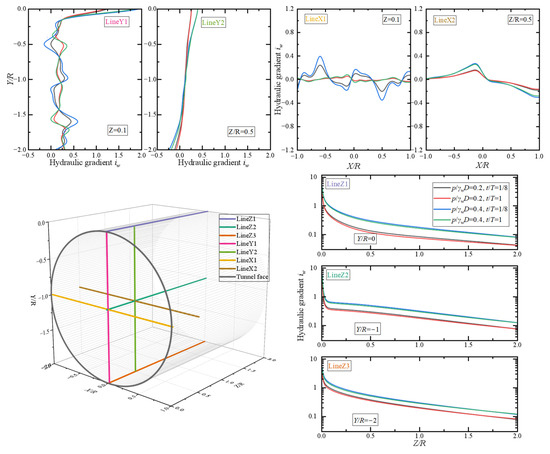
Figure 19.
Hydraulic gradient projections along seven representative axes in the core excavation zone under condition P2.
In summary, the evolution of blowout failure under transient slurry infiltration is fundamentally governed by the coupled mechanism of heterogeneous pressure accumulation and core zone dynamic driving. The dynamic filter cake establishes the foundation condition for localized excess pressure, while instability in the high-risk region of the potential core zone, coupled with elevated hydraulic gradients, provides the driving impetus for failure. Their interaction initiates localized blowout; if pressure is not promptly relieved, excess pressure propagates through the transitional zone, expanding the scope of failure. Accordingly, prevention and control strategies should focus on real-time monitoring of vertical pressure at the filter-cake interface and the Z-direction hydraulic gradient within the core zone, optimizing cutterhead configuration to minimize pressure shocks, and implementing coordinated pressure management and hydraulic energy dissipation to prevent both active and passive failure events.
4.4. Discussion
This study establishes an effective analytical framework for evaluating the safety factor of tunnel support structures subjected to excess slurry pressure. The research integrates the heterogeneous dynamic filter cake (PTM) with transient seepage mechanisms, accounting for the three-dimensional seepage variations induced by excess slurry pressure and their impact on the entire potential failure block. The model quantifies the effects of spatiotemporal heterogeneity in the filter cake—such as abrupt changes in block permeability and vertical pressure gradients—caused by cutterhead excavation on pressure transfer. It also accurately captures the failure-driving effect of high hydraulic gradients (up to 12 in the Z-direction within the high-risk zone) within the potential core failure region (Z/R ≤ 2.0, Y/R ≤ 2.0). By overcoming the limitations of traditional wedge–prism models, which fail to represent 3D transient seepage and localized failures, this approach enables efficient and realistic assessment of tunnel support stability.
The choice of analytical model should depend on the state of filter cake formation: when no filter cake forms, the steady-state seepage model should be employed; for a complete, non-flowing filter cake, the full-membrane model is appropriate; and for partial filter cake conditions, safety factors can be estimated through interpolation based on intermediate results. Application of the framework should also be optimized according to dynamic construction conditions—for instance, using safety factors from the dynamic equilibrium phase (t/T > 3/4) to design conservative chamber slurry pressures and avoid initial cutting risks. Cutterhead configurations should be optimized (e.g., single-cutter Case S1 demonstrates higher pressure transfer efficiency than multi-cutter Case P2), and slurry pressure should be regulated with reference to normalized safety factor charts. Future research should explore the full dynamic evolution of the filter cake, delve deeper into the microscale interactions between soil and slurry particles, and investigate the meso-mechanisms of passive failure under high-pressure conditions. Similarly to previous studies, this work primarily focuses on the global stabilization of tunnel support structures under slurry infiltration conditions [36].
5. Conclusions
This study focuses on the blowout failure mechanism of tunnel faces under excess slurry pressure, emphasizing the synergistic effects of slurry infiltration and transient seepage. A three-dimensional rotational failure mechanism was constructed within the theoretical framework of limit analysis, and key influencing factors were quantified using the work–energy balance equation. The model’s reliability was validated through the Heinenoord No. 2 Tunnel project, while transient seepage simulations deepened the understanding of the failure mechanism. This research systematically addresses the academic challenge of representing three-dimensional transient seepage and localized failure, offering a more precise analytical framework for evaluating passive failure at the excavation face. Parameter sensitivity analyses further elucidate the governing effects of dynamic filter cake properties, hydraulic gradients, and soil strength. The main conclusions are as follows:
(1) The three-dimensional passive failure model established under the tunnel face stability limit analysis framework accurately captures the spatial distribution characteristics of 3D seepage fields. Compared with traditional wedge–prism models, it significantly enhances the predictive accuracy of critical failure pressures. Verification using the Heinenoord No. 2 Tunnel case demonstrates that the model effectively quantifies the relationship between slurry excess pressure and passive failure risk, revealing an exponential increase in risk when slurry pressure exceeds 200 kPa.
(2) The core evolution mechanism of passive blowout failure arises from the coupling of the dynamic filter cake and the potential core failure zone. The spatiotemporal heterogeneity of the dynamic filter cake provides the pressure foundation for failure, while the high hydraulic gradient (up to 12 in the Z-direction, Z/R < 0.5) within the potential failure zone (Z/R ≤ 2.0, Y/R ≤ 2.0) delivers the driving force. Together, these two factors govern the entire failure process—from initiation to propagation.
(3) The analytical framework developed herein, integrating slurry infiltration effects with transient seepage mechanisms, overcomes the limitations of traditional steady-state and one-dimensional assumptions. It provides an in-depth understanding of the critical pressure and failure evolution while emphasizing the significance of vertical pressure monitoring, hydraulic gradient control in the core zone, and cutterhead layout optimization. This framework offers both theoretical and quantitative foundations for the dynamic regulation of slurry pressure in soft ground tunneling.
Author Contributions
Conceptualization, M.G.; Data curation, J.Z.; Formal analysis, C.H.; Funding acquisition, C.H. and Y.Q.; Investigation, P.X. and M.G.; Methodology, P.X. and J.Z.; Project administration, M.G.; Software, J.Z.; Supervision, J.Z.; Validation, M.G.; Visualization, P.X.; Writing—original draft, M.G.; Writing—review and editing, C.H. and Y.Q. All authors have read and agreed to the published version of the manuscript.
Funding
This research was funded by the National Natural Science Foundation of China (42507227), the China Post-doctoral Science Foundation under Grant Number 2024M752501 and GZC20241299, the Postdoctoral Project of Hubei Province (Grant Number 2024HBBHCXA080), and the Wuhan Talent Program of the Organization Department of Hongshan District (No. 202401jc0276).
Data Availability Statement
The original contributions presented in the study are included in the article; further inquiries can be directed to the corresponding authors.
Conflicts of Interest
Author Peihua Xia was employed by the company Wuhan Bridge Construction Group Co. Ltd. Author Jianbo Zhang and Ming Gao were employed by the company China Construction Third Engineering Bureau Group Co., Ltd. The remaining authors declare that the research was conducted in the absence of any commercial or financial relationships that could be construed as potential conflicts of interest.
References
- Cheng, H.; Wu, N.; Shi, Y.; Wang, B. Influence of Permeability of Filter Cake on Face Stability of Slurry Shield-Driven Tunnels in Sandy Gravel Stratum. ce/papers 2025, 8, 1495–1508. [Google Scholar] [CrossRef]
- Anagnostou, G.; Kovári, K. The Face Stability of Slurry-Shield-Driven Tunnels. Tunn. Undergr. Space Technol. 1994, 9, 165–174. [Google Scholar] [CrossRef]
- Thewes, M.; Schoesser, B.; Zizka, Z. Transient Face Support in Slurry Shield Tunneling Due to Different Time Scales for Excavation Sequence of Cutting Tools and Penetration Time of Support Fluid. In Proceedings of the ITA World Tunnel Congress, San Francisco, CA, USA, 22–28 April 2016. [Google Scholar]
- Bezuijen, A.; van Lottum, H. (Eds.) Tunnelling: A Decade of Progress, GeoDelft 1995–2005; Proceedings and Monographs in Engineering, Water and Earth Sciences; Taylor & Francis: London, UK; New York, NY, USA, 2006; ISBN 978-0-415-39133-7. [Google Scholar]
- Min, F.; Zhu, W.; Han, X. Filter Cake Formation for Slurry Shield Tunneling in Highly Permeable Sand. Tunn. Undergr. Space Technol. 2013, 38, 423–430. [Google Scholar] [CrossRef]
- Zhou, Z.; Ling, T.; Huang, F.; Zhang, M. The Face Stability Analysis of Shield Tunnels Subjected to Seepage Based on the Variational Principle. Sustainability 2022, 14, 16538. [Google Scholar] [CrossRef]
- Zhao, Y.; Yang, Z.; Chen, Z.; Ling, D. A Modified Wedge-Prism Model for Calculating the Limit Support Pressure of a Shallow Shield Tunnel Face in Unsaturated Sandy Soil. Int. J. Geomech. 2024, 24, 04024233. [Google Scholar] [CrossRef]
- Zizka, Z.; Schoesser, B.; Thewes, M. The Influence of Slurry and Tool Penetration Depths on the Efficiency of Slurry Face Support. In Proceedings of the 14th International Conference “Underground Construction”, Prague, Czech Republic, 3–5 June 2019. [Google Scholar]
- Zizka, Z.; Schoesser, B.; Thewes, M. Investigations on Transient Support Pressure Transfer at the Tunnel Face during Slurry Shield Drive Part 1: Case A—Tool Cutting Depth Exceeds Shallow Slurry Penetration Depth. Tunn. Undergr. Space Technol. 2021, 118, 104168. [Google Scholar] [CrossRef]
- Zizka, Z.; Schoesser, B.; Thewes, M. Investigations on the Transient Support Pressure Transfer at the Tunnel Face during Slurry Shield Drive Part 2: Case B—Deep Slurry Penetration Exceeds Tool Cutting Depth. Tunn. Undergr. Space Technol. 2021, 118, 104169. [Google Scholar] [CrossRef]
- Li, Y.; Emeriault, F.; Kastner, R.; Zhang, Z.X. Stability Analysis of Large Slurry Shield-Driven Tunnel in Soft Clay. Tunn. Undergr. Space Technol. 2009, 24, 472–481. [Google Scholar] [CrossRef]
- Kim, S.H.; Tonon, F. Face Stability and Required Support Pressure for TBM Driven Tunnels with Ideal Face Membrane—Drained Case. Tunn. Undergr. Space Technol. 2010, 25, 526–542. [Google Scholar] [CrossRef]
- Xu, T.; Bezuijen, A. Analytical Methods in Predicting Excess Pore Water Pressure in Front of Slurry Shield in Saturated Sandy Ground. Tunn. Undergr. Space Technol. 2018, 73, 203–211. [Google Scholar] [CrossRef]
- Qin, S. Slurry Infiltration and Excess Pore Water Pressure During TBM Tunneling in Sand. Ph.D. Thesis, University of Macau, Zhuhai, China, 2023. [Google Scholar]
- Kastner, R. (Ed.) Geotechnical Aspects of Underground Construction in Soft Ground: In Proceedings of the Third [i.e., Fourth] International Symposium on Geotechnical Aspects of Underground Construction in Soft Ground, IS-Toulouse 2002, Toulouse, France, 23–25 October 2002; Scientifique: Lyon, France, 2003; ISBN 978-2-9510416-3-9. [Google Scholar]
- Broere, W.; Van Tol, A.F. Time-Dependant Infiltration and Groundwater Flow in a Face Stability Analysis. In Modern Tunneling Science and Technology; Adachi, T., Tateyama, K., Kimura, M., Eds.; CRC Press: Boca Raton, FL, USA, 2020; pp. 629–634. ISBN 978-1-003-07753-4. [Google Scholar]
- Talmon, A.M.; Mastbergen, D.R.; Huisman, M. Invasion of Pressurized Clay Suspensions Into Granular Soil. J. Porous Media 2013, 16, 351–365. [Google Scholar] [CrossRef]
- Xu, T.; Bezuijen, A. Bentonite Slurry Infiltration into Sand: Filter Cake Formation under Various Conditions. Géotechnique 2019, 69, 1095–1106. [Google Scholar] [CrossRef]
- Zhong, J.; Zhao, S.; Wang, P.; Hou, C. Tunnel Face Stability Considering the Influence of Excess Slurry Pressure. Sustainability 2023, 15, 8230. [Google Scholar] [CrossRef]
- Zucca, M.; Valente, M. On the Limitations of Decoupled Approach for the Seismic Behaviour Evaluation of Shallow Multi-Propped Underground Structures Embedded in Granular Soils. Eng. Struct. 2020, 211, 110497. [Google Scholar] [CrossRef]
- Zhong, J.; Hou, C.; Yang, X. Bearing Capacity of Foundations Resting on Rock Masses Subjected to Rayleigh Waves. Soil Dyn. Earthq. Eng. 2023, 167, 107791. [Google Scholar] [CrossRef]
- Pan, Q.; Hou, C.; Xiong, H.; Yang, Z. Three-Dimensional Tunnel Face Stability Using a New Heterogeneous Dynamic Filter Cake. Can. Geotech. J. 2025, 62, 1–22. [Google Scholar] [CrossRef]
- Hou, C.; Pan, Q.; Xu, T.; Huang, F.; Yang, X. Three-Dimensional Tunnel Face Stability Considering Slurry Pressure Transfer Mechanisms. Tunn. Undergr. Space Technol. 2022, 125, 104524. [Google Scholar] [CrossRef]
- Vu, M.N.; Broere, W. A Compact Blowout Model for Shallow Tunnelling in Soft Soils. Tunn. Undergr. Space Technol. 2023, 138, 105167. [Google Scholar] [CrossRef]
- Borshchevskiy, S.V.; Petrenko, V.D.; Tiutkin, O.L.; Kulazhenko, Y.Y.; Kulazhenko, O.M. Scientific Evidence for Walls Fastening Technologies of Working Trench by the Special Method “Slurry Wall” For Shallow Subways’ Stations. Sci. Transp. Prog. 2014, 6, 154–163. [Google Scholar] [CrossRef]
- Mollon, G.; Dias, D.; Soubra, A. Rotational Failure Mechanisms for the Face Stability Analysis of Tunnels Driven by a Pressurized Shield. Int. J. Numer. Anal. Methods Geomech. 2011, 35, 1363–1388. [Google Scholar] [CrossRef]
- Zhang, Z.L.; Li, Z.W.; Hou, C.T.; Pan, Q.J. Required Strength of Geosynthetic-Reinforced Soil Structures Subjected to Varying Water Levels Using Numeric-Based Kinematic Analysis. Geotext. Geomembr. 2023, 51, 1–15. [Google Scholar] [CrossRef]
- Bezuijen, A.; Brassinga, H.E. Blow-out Pressures Measured in a Centrifuge Model and in the Field. In Modern Tunneling Science and Technology; Adachi, T., Tateyama, K., Kimura, M., Eds.; CRC Press: Boca Raton, FL, USA, 2020; pp. 619–624. ISBN 978-1-003-07753-4. [Google Scholar]
- Geological and Geotechnical Parameters Affecting Tunnelling Methods|SpringerLink. Available online: https://link.springer.com/chapter/10.1007/978-3-031-89114-4_2 (accessed on 26 November 2025).
- API SPEC 13A; Drilling Fluids Materials. American Petroleum Institute API: Washington, DC, USA, 2019; GlobalSpec. Available online: https://standards.globalspec.com/std/14204847/api-spec-13a (accessed on 26 November 2025).
- Wang, Y.; Yang, Y.; Su, F.; Wang, L. Multiscale Analytical Method and Its Parametric Study for Lining Joint Leakage of Shield Tunnel. Appl. Sci. 2020, 10, 8528. Available online: https://www.mdpi.com/2076-3417/10/23/8528 (accessed on 26 November 2025). [CrossRef]
- Xie, Y.; Zhou, D.; Liao, H.; Zhu, J. Failure Mode of Tunnel Face Under Transient Unsaturated Seepage with Temperature Influence. Mathematics 2025, 13, 1311. [Google Scholar] [CrossRef]
- Shen, J.-H.; Hu, M.-J.; Wang, X.; Zhang, C.-Y.; Xu, D.-S. SWCC of Calcareous Silty Sand Under Different Fines Contents and Dry Densities. Front. Environ. Sci. 2021, 9, 682907. [Google Scholar] [CrossRef]
- Zhang, Z.; Yin, T. A Coupled CFD–DEM Simulation of Slurry Infiltration and Filter Cake Formation during Slurry Shield Tunneling. Infrastructures 2018, 3, 15. [Google Scholar] [CrossRef]
- Liu, X.; Wang, F.; Fang, H.; Yuan, D. Dual-Failure-Mechanism Model for Face Stability Analysis of Shield Tunneling in Sands. Tunn. Undergr. Space Technol. 2019, 85, 196–208. [Google Scholar] [CrossRef]
- Yin, T.; Zhang, Z.; Huang, X.; Shire, T.; Hanley, K.J. On the Morphology and Pressure-Filtration Characteristics of Filter Cake Formation: Insight from Coupled CFD–DEM Simulations. Tunn. Undergr. Space Technol. 2021, 111, 103856. [Google Scholar] [CrossRef]
Disclaimer/Publisher’s Note: The statements, opinions and data contained in all publications are solely those of the individual author(s) and contributor(s) and not of MDPI and/or the editor(s). MDPI and/or the editor(s) disclaim responsibility for any injury to people or property resulting from any ideas, methods, instructions or products referred to in the content. |
© 2025 by the authors. Licensee MDPI, Basel, Switzerland. This article is an open access article distributed under the terms and conditions of the Creative Commons Attribution (CC BY) license (https://creativecommons.org/licenses/by/4.0/).