Abstract
Transmission lines may experience significant ice loads during service, which can cause damage or even destruction to transmission tower components and transmission lines. Under the traditional design concept, when the load exceeds the safety threshold, the transmission line is usually severely damaged or even destroyed, and there are no effective protective measures. In response to this situation, this article considers a protective approach and conducts research. Firstly, considering the nonlinear mechanical behavior of steel and the complex coupling effects between towers and lines, a refined finite element model of the transmission tower line system with additional insulator strings was established. Afterwards, a nonlinear hysteresis model of angle steel was introduced, considering three cases: intact insulator string, insulator string breaking after ice load application, and insulator string breaking before ice load application. The failure of the tower line system under ice load was simulated. The results indicate an approximately 10% enhancement in the load-bearing capacity of the transmission line, suggesting that breaking the insulator string at the appropriate time can improve the overall load-bearing capacity of the transmission tower, thereby reducing the failure probability of the tower line system under large ice loads. This verifies the feasibility of the additional insulator string fracture protection concept and provides ideas for the design of transmission lines.
1. Introduction
Transmission lines form the backbone network of the power system, undertaking the task of large-scale and long-distance transmission of electrical energy. They are the energy lifeline that modern society relies on for development, providing fundamental guarantees for the stable operation of key areas such as healthcare, information and communication. The construction of a cross regional power resource allocation system for ultra-high voltage transmission networks is accelerating [,]. Transmission lines are widely distributed with large spatial spans, and their installation paths are difficult to avoid crossing over many areas with relatively harsh climates. If they encounter heavy rain, snow, and freezing weather, transmission lines are prone to icing. Ice cover can cause wire sag and internal tension increase. Its cross-sectional shape will change and it is prone to gallop under wind excitation [,,,]. The wire will jump during de-icing. These phenomena may lead to short circuits between wires, damage to towers, and even collapse accidents [,,]. Machine learning can also be used to guide mechanism research [,]. Therefore, it is necessary to conduct icing research on transmission lines and explore how to reduce freezing damage under extreme rain and snow weather conditions.
Recently, many scholars have conducted extensive analyses on the response, failure, and collapse of transmission towers under icing disasters [,]. Ju et al. [] established a finite element model of transmission lines and conducted response analysis of transmission towers under ice loads, obtaining the mechanical behavior of transmission towers. Yang et al. [] established a three-dimensional finite element model of the wire-ground-insulator system in ANSYS and analyzed the response of transmission lines to de-icing during icing disasters. Yang et al. [] established a finite element model of ultra-high voltage transmission lines in areas with severe icing, considering multiple influencing factors and analyzing the dynamic response under de-icing conditions. Xie et al. [] established a practical model with a scale ratio of 1:20 based on an actual transmission tower, and conducted transient displacement analysis of the transmission line under different ice shedding conditions after icing and de-icing conditions. The response changes of the transmission line under the influence of various parameters were obtained. Guo et al. [] analyzed the failure mechanism of transmission towers under icing conditions and studied the failure modes of transmission towers through numerical simulations. Li et al. [] established an ANSYS finite element model of a 500 kV transmission tower and systematically studied the impact of ice shedding on tower collapse. Zhang et al. [] established a regression model for the thickness of ice cover on transmission lines based on microclimate conditions, which can be used for risk assessment of transmission line failure.
Under extreme rainy and snowy weather, icing on transmission lines may lead to serious consequences such as wire breakage and tower collapse, therefore corresponding protective measures are needed. A large number of scholars have conducted relevant research on anti-icing measures for transmission lines. For example, Solangi et al. [] discussed the impact of atmospheric icing on transmission lines around the world, summarized the current de-icing methods used, and revealed the advantages and disadvantages of the de-icing technology currently used in maintenance operations. Zhang et al. [] evaluated the impact of local line de-icing on the structural stability of transmission tower-line systems by integrating orthogonal experimental design with finite element mechanical analysis, thereby providing practical guidance for the formulation of transmission line de-icing strategies. Cheng et al. [] proposed a new de-icing method based on resonance theory, which can cause deformation and fragmentation of ice under the action of excitation load and ultimately detach the ice from the conductor without affecting the normal operation of the transmission line. Ji et al. [] summarized the characteristics and requirements of de-icing of low-voltage transmission lines, and proposed an overall design concept for a new type of electromagnetic impact mechanical de-icing equipment. Zhou et al. [] proposed a novel online anti-icing/de-icing method based on external excitation resonance. This method integrates detection, analysis, and de-icing functions, enabling effective anti-icing and de-icing during the initial ice accretion phase on transmission lines. Wang et al. [] designed a de-icing robot that can avoid various accessories on the line and can pass through the tension tower of the phase line for jumper, greatly improving its practicality. You et al. [] introduced an online transmission line de-icing device that integrates energy harvesting, monitoring, and de-icing technologies. The device has significant advantages in safety, efficiency, and environmental adaptability, and is expected to be widely used in the future. Feng et al. [] studied the topology structure of ice melting devices for 110 kV wind power transmission lines, designed anti freezing and thawing schemes for both conductors and ground wires, and successfully applied them in engineering. Zhou et al. [] summarized the principles, applications, and related research of existing anti icing and de-icing technologies for overhead transmission lines, and obtained relevant conclusions: the existing anti-icing and de-icing technologies for overhead transmission lines are not perfect. Although they have achieved the goal of de-icing, each technology cannot simultaneously meet the requirements of operability, economy, and durability. In summary, there are various ways to prevent icing, but in extreme rainy and snowy weather, existing icing prevention technologies may have insufficient efficiency in de-icing, resulting in ice thickness exceeding the safety threshold. At the same time, the installation and application of icing prevention devices are complex and not widely applicable. Therefore, more efficient preventive measures need to be proposed.
In response to this challenge, this paper proposes a protective strategy that involves the installation of additional insulator strings designed to fracture under predetermined icing conditions. First, a finite element model of the transmission line system is established, and the methodology for calculating the ice load on the conductors is presented. Subsequently, nonlinear dynamic analyses are conducted to investigate the system’s response to insulator string fracture under ice loading. Furthermore, the effectiveness of this approach in enhancing the safety performance of transmission lines in severe weather conditions is thoroughly evaluated.
2. Numerical Model and Calculation of Ice Load
2.1. Numerical Model
The selected transmission tower type is a tension tower with a height of 61 m and a root opening size of 15.78 m × 15.78 m. The specific planar dimension information is shown in Figure 1. There are three types of angle steel materials for transmission towers, namely Q235, Q345, and Q420. The main materials have cross-sectional sizes range of L125 × 10 to L280 × 26, and the diagonal material have cross-sectional sizes range of L40 × 4 to L140 × 10. Cross-arms are arranged at 46 m and 61 m of the transmission tower, with the upper cross-arm used to mount the ground wire and the lower cross-arm used to mount the conductor. The ground wire and the conductor are hung on the cross-arms through insulator strings. The transmission line span is 500 m. The conductor model is JL1/G3A-1250/70, six-bundled wire, and the ground wire model is JLB20A-150. Table 1 presents the main technical parameters of the ground wire and the conductor.
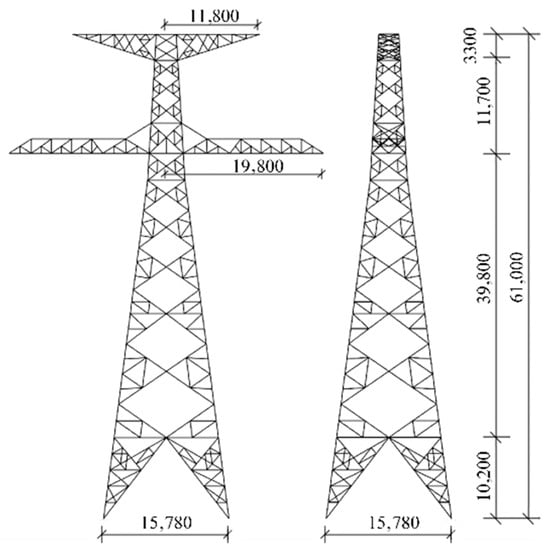
Figure 1.
Plan dimensions of transmission tower (Unit: mm).

Table 1.
Main technical parameters of transmission lines.
In order to ensure the safe operation of transmission lines under icing cases, this paper proposes a method of using additional insulator strings to prevent icing disasters in transmission lines. This method can rapidly enhance the load-bearing capacity of transmission lines without requiring service interruption. The working principle of the method lies in the disconnection of the additional insulator string, which releases conductor tension. Consequently, the force imposed by the conductor on the cross-arm is diminished, thereby increasing the global structural capacity of the transmission tower. One end of the additional insulator string is connected to the cross-arm, one end is connected to the wire, and the end connection method is hinged. The end of the additional insulator string is equipped with a sensor and a fracture device. When the sensor receives a fracture signal, the fracture device will disconnect the insulator string from the cross-arm connection. Its working principle is to break before the transmission line can withstand a predictable large load, reduce the tension of the wire, decrease the tension on the cross-arm, and improve the overall load bearing level of the transmission tower, thereby reducing the impact of icing on the safety performance of the transmission line.
This paper uses ABAQUS 2017 software to establish a finite element model of the transmission tower line system. Figure 2 shows the “two tower three line” model established in this paper, where each member of the transmission tower adopts beam elements, with a total of 2094 elements and 854 nodes. The conductors, ground wires, and insulator strings were modeled using truss elements, while the transmission tower members were modeled using beam elements. The additional insulator strings were connected using the “Join” type connector available in the interaction module. For boundary conditions, the base of the transmission tower legs was fully fixed (ENCASTRE), and the ends of the conductors were assigned pinned (PINNED) supports. The transmission line adopts truss element (T3D2). A simplified representation of the six-bundled conductor system was adopted, employing the equivalent area method to model it as a single conductor for mechanical behavior analysis []. Dividing each span of the transmission line into 100 units at equal intervals to ensure accuracy. When modeling the conductor and ground wire, the sag needs to be considered. In this paper, the engineering sag calculation formula is used, and its specific expressions are shown in Equations (1) and (2). The sag of the conductor and ground wire are calculated to be 16.699 m and 6.787 m respectively. An initial pre-tension force was applied to the conductor to ensure that its sag under the combined conditions of pre-tension and self-weight matched the calculated value. The additional insulator string (2 in Figure 2) is connected to the insulator string (1 in Figure 2) and the connecting component (3 in Figure 2) to form a whole, and the wire is hung on the cross-arm through this whole. The establishment of the additional insulator string uses the “Join” connector, and its failure cases are set to simulate fracture. The bottom support of the transmission tower ignores the soil structure interaction and is directly fixed on the ground. The connection between each unit of the transmission line is hinged. When modeling, the transmission tower model is first created, followed by the establishment of the conductors and the application of boundary conditions. For the convenience of subsequent description, the X, Y, and Z directions of the transmission tower line system are defined as horizontal, vertical, and longitudinal, respectively. Please refer to the specific annotations in Figure 2 for details. The damping ratios of the transmission tower and transmission line are taken as 2% and 1%, respectively []. The Lanczos algorithm is used for modal analysis, and the first two natural frequencies of the transmission tower line system dominated by transmission tower vibration are 2.5092 Hz and 2.6881 Hz, respectively, with damping values of = 0.3262 and = 0.0012.
In the formula, f is the sag of the wire. q is the equivalent weight per unit length of a wire transmission line. H is the horizontal tension of the wire, and is the breaking tension, measured in N. A is the calculated cross-sectional area of the transmission line, measured in mm2.
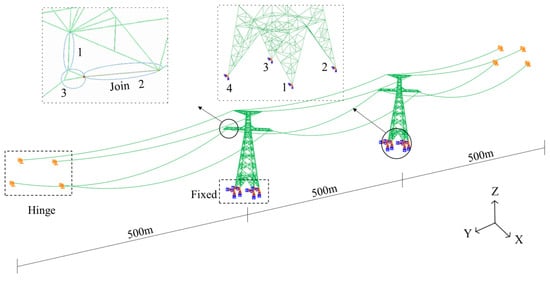
Figure 2.
Transmission tower-line system model.
The analysis of the model in this paper involves the fracture of additional insulator strings, which can generate significant instantaneous impact loads and long-term fluctuating loads. This process can gradually accumulate damage to transmission tower members [], and the currently commonly used ideal elastoplastic models cannot accurately reflect the accumulation of damage to members. Therefore, this paper introduces a nonlinear hysteresis model to simulate the complex behavior of members. The model can accurately predict the buckling and post-buckling responses of steel members under cyclic loading, along with their stiffness degradation behavior. Its predictive accuracy has been validated against extensive experimental data []. The constitutive model is then imported through a subroutine in ABAQUS to ensure the accuracy of subsequent failure analysis.
2.2. Ice Load
In this study, it is assumed that the ice cover shape of the transmission line is circular [,], with an ice cover density of 0.9 × 10³ kg/m3, and the ice cover shape is shown in Figure 3. The calculated ice load is applied in the form of equivalent gravitational acceleration, and the icing density is converted by taking the unit length of the grounding wire. The formula for the equivalent gravitational acceleration (g′) of the ice load can be calculated by Equation (3):
in the formula: is the equivalent gravitational acceleration of the ice-covered transmission line (unit: N/kg), is the weight of the transmission line per unit length (unit: kg/m). is the weight of ice cover per unit length of transmission line (unit: kg/m). A is the cross-sectional area of the transmission line (unit: m2). d is the outer diameter of the transmission line (unit: m), is the thickness of ice cover (unit: m), and is the density of ice, set at 0.9 × 10³ kg/m3. Table 2 presents the calculation results of equivalent gravity acceleration caused by icing on transmission lines.
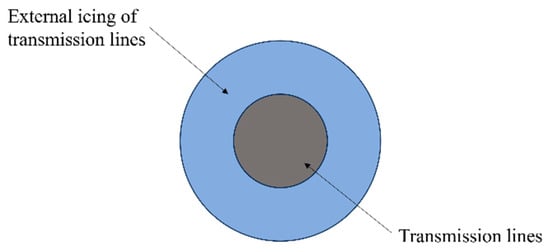
Figure 3.
Schematic diagram of ice cover shape on transmission lines.
Table 2.
Calculation of equivalent gravity acceleration of transmission lines.
The ice load on transmission towers is calculated using the increased density method, taking into account the following two assumptions: (1) The entire transmission line is covered with ice, and the thickness of the ice is evenly distributed along the length of the transmission line. (2) Only consider the impact of icing on the weight of transmission lines, without considering the impact of icing on the stiffness of transmission lines. The calculation results of equivalent density of transmission tower icing are shown in Table 3.
Table 3.
Equivalent density of icing on transmission towers.
3. Analysis of Structural Responses
In order to study the effect of additional insulator strings on the structural response of ice-covered transmission lines, this paper selected three cases: (1) intact insulator string; (2) insulator string fracture after the application of ice load; and (3) insulator string fracture before the application of ice load. For each case, eight different conductor ice thicknesses were considered, ranging from 5 mm to 40 mm in 5 mm increments. The ice thickness on the transmission tower and ground wire was set at 10 mm.
The ice load on the tower was simulated by modifying the material density in the ABAQUS material property definition, while the ice load on the conductors was applied as an equivalent gravity load in the ABAQUS load module. The ABAQUS/Explicit solver was used for the dynamic analysis. Taking the load corresponding to a 10 mm ice thickness on the conductor (hereinafter referred to as the ice load) as an example, the analysis procedure was as follows: (1) At the start of the analysis, the self-weight and ice load were applied to both the tower and the conductor, with the insulator string remaining intact. The analysis was run for 30 s, with the transmission line’s response data recorded every 0.1 s. (2) At the start of the analysis, the self-weight and ice load were applied to the tower and conductor, while the insulator string was modeled as fractured. The analysis duration was 30 s, with response data extracted every 0.1 s. (3) The analysis began by applying the self-weight and ice load to the tower and ground wire, along with the self-weight of the conductor. The insulator string was fractured simultaneously. This initial phase was calculated for 30 s. Subsequently, the ice load was applied to the conductor, and the analysis continued for another 30 s, resulting in a total analysis time of 60 s. Response data were extracted every 0.1 s throughout. The simulation results indicate that as the ice load increased, cross-arm failure occurred in Case 2 at a 30 mm ice load and in Case 1 at a 40 mm ice load.
3.1. Displacement Response
Extracting the displacement response of the wire, the results show that the displacement response curves of the wire under different ice loads are similar under the same case (except for the ice load case corresponding to the cross-arm failure). Figure 4 shows the displacement-time response curves of the conductor under three cases, taking the 10 mm and the 20 mm ice load as examples. It can be seen that after the load is applied, the displacement time curve of the wire exhibits a damping vibration, with the initial vibration amplitude being the largest, gradually decreasing over time, and stabilizing at a constant value. The pattern of Case 1 is most obvious, and its displacement curve is similar to a sine curve with decreasing amplitude. Case 2 has a larger fluctuation amplitude of wire displacement, which is most obvious when the insulator string is just broken. With the passage of time, the wire gradually tends to stabilize. The characteristic of the conductor displacement curve in Case 3 is the combination of Case 1 and Case 2. In order to further analyze the characteristics of the displacement curve of the conductor, the maximum displacement (MD) of the conductor, the conductor jump height of the conductor (CJH), and the stable displacement (SD) are extracted for analysis.
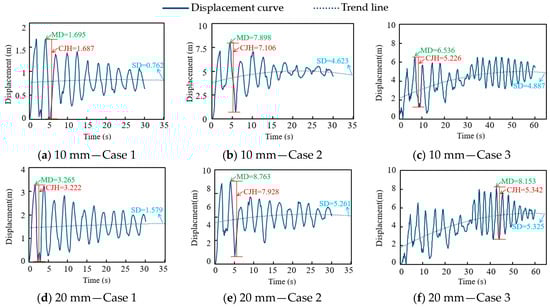
Figure 4.
Displacement response curves of conductors under different ice loads.
Figure 5 shows the maximum displacement of the conductor and the difference between the maximum adjacent displacement of the conductor under different ice loads for three different cases. It can be seen that with the increase in ice load, the maximum displacement of the conductor and the difference between the maximum displacement of the conductor in the three cases all show an upward trend. Under the same ice load, the maximum displacement and conductor jump height of the conductor in Case 2 are greater than those in Case 3 and Case 1. The difference between Case 2 and Case 3 and Case 1 gradually decreases with the increase in ice load. For example, under a 5 mm ice load, the maximum displacement of the conductor in the three cases is 1.07 m, 7.42 m, and 6.54 m, respectively. The difference between Case 2 and Case 3 and Case 1 is 6.35 m and 5.38 m, respectively. Under a 25 mm ice load, the maximum displacement of the conductor in the three cases is 4.2 m, 9.35 m, and 9.12 m, respectively. The difference between Case 2, Case 3, and Case 1 is 5.15 m and 4.92 m, respectively.
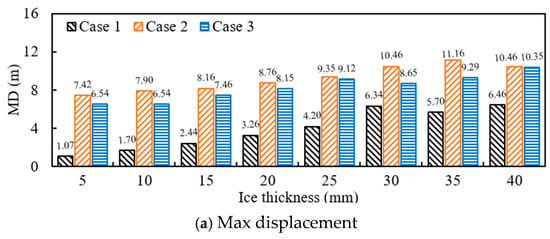
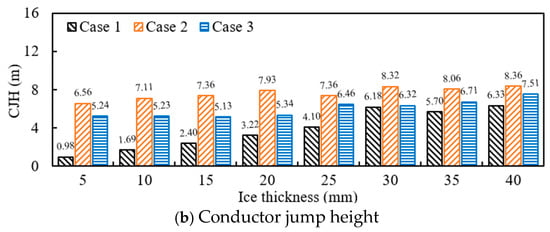
Figure 5.
Conductor jump height and maximum displacement under different ice loads.
Figure 6 shows the stable displacement curves of the conductor under different ice loads, where the displacement of the conductor is unstable under cross-arm failure and will not be statistically analyzed here. It can be seen that with the increase in ice load, the stable displacement of the conductor gradually increases under the three cases. Among them, the stable displacement of the conductor in Cases 2 and 3 is greater than that in Case 1, and the difference in stable displacement between Cases 2 and 3 is not significant, indicating that the moment of insulator string breaking will not affect the final displacement of the conductor.
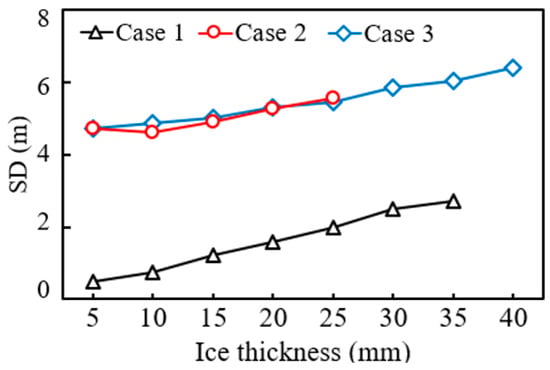
Figure 6.
Stable displacement of conductors under different ice loads.
The displacement responses of the tower top and the cross-arm end under different ice loads are similar to those of the conductor, exhibiting an overall damped oscillation. The initial amplitude of vibration is larger in the case with a fractured insulator string, then decreases and gradually stabilizes. Table 4 and Table 5 present the steady-state values of the tower top and cross-arm end displacements, respectively, under different ice loads. It can be observed that these steady-state displacements gradually increase with the ice load. The responses in Cases 2 and 3 are essentially identical and greater than that in Case 1.
Table 4.
Tower top displacement response under different ice loads.
Table 5.
Cross-arm displacement response under different ice loads.
3.2. Stress Response
Based on the previous analysis, the overall displacement responses of the conductors in Cases 2 and 3 are greater than in Case 1. The substantial swing of the conductors generates significant dynamic loads. To investigate the impact of this large-amplitude conductor swing following insulator string fracture on the transmission tower stress, the stress distribution within the tower was extracted and analyzed.
Table 6 presents the maximum leg moment at the bottom of the transmission tower under ice loads ranging from 5 mm to 25 mm. The locations of the tower bottom measurement members (Numbers 1–4) are identified in Figure 2. The results indicate that the maximum base bending moment in Case 1 exhibits an overall increasing trend with the rise in ice load. In contrast, the value for Case 2 fluctuates within a certain range. For Case 3, when the ice load is relatively small, the resulting maximum base bending moment is less than that induced by the insulator string breakage, manifesting as a constant value. However, under larger ice loads, the maximum base bending moment also increases accordingly. For a given case, the maximum leg moment at members 2 and 3 are greater than those at members 1 and 4.
Table 6.
Maximum leg moment of transmission tower.
The difference in the maximum leg moment between Cases 2/3 and Case 1 was calculated. This difference was then divided by the value from Case 1 to determine the percentage increase. The summarized results are shown in Figure 7. It can be observed that the difference between Case 2 and Case 1 is larger than that between Case 3 and Case 1. As the ice load increases, this difference tends to decrease. The overall percentage increase shows a declining trend, with significant variations among the different measurement members. For example, under a 10 mm ice load, the value at member 1 in Case 2 increased by 122% compared to Case 1, while at member 3, the increase was 67%. The percentage increases at members 1 and 4 are generally higher than those at members 2 and 3.
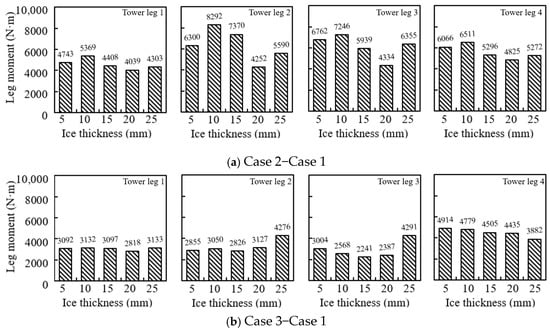
Figure 7.
Summary of tower leg differences for different Cases.
Two members located in the middle of one side of the transmission tower’s cross-arm were selected for stress analysis, with their positions illustrated in Figure 8. The stress response patterns of these two members under different ice loads were found to be similar, except in cases where cross-arm failure occurred. Using the 10 mm and the 20 mm ice load as examples, Figure 9 shows the stress-time curves for both members. It can be observed that the stress curves for both members in Case 1 and Case 2 exhibit a damped vibration, characterized by a gradual decrease in amplitude over time, with the stress eventually approaching a stable value. In Case 3, the stress curve demonstrates a two-stage damped response. A distinct transition occurs at the 30-s mark when an additional load is applied, after which the stress gradually decreases again and stabilizes. The steady-state stress values of the members were extracted across all load cases, with the results summarized in Table 7. The data shows that as the ice load increases, the steady-state stress values for both member 1 and member 2 exhibit an upward trend across all three cases. Furthermore, the steady-state stress of member 1 in Case 3 is lower than in Case 1, whereas for member 2, it is higher than in Case 1.
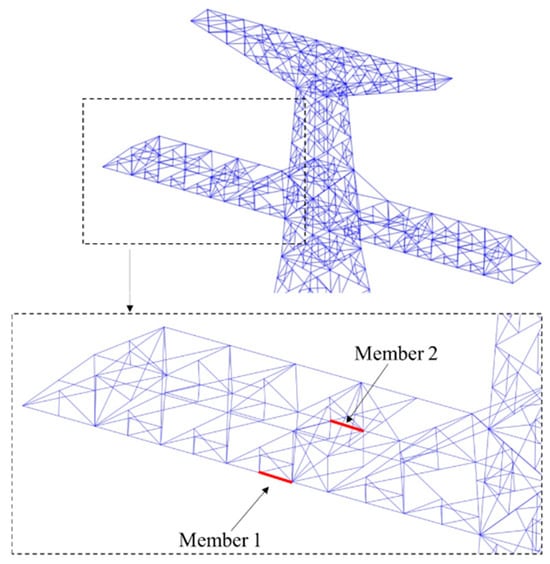
Figure 8.
The selected position of the member.
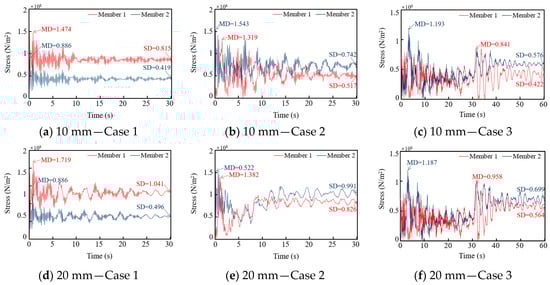
Figure 9.
Member stress curves under tow ice loading conditions.
Table 7.
Stress stability values of members under different ice loads.
4. Impact of Additional Insulator String Fracture
To evaluate the impact of additional insulator string fracture on the safety performance of transmission lines, SDV3 (a user-defined state variable in ABAQUS, which here represents the degree of material damage) contour plots were extracted to assess the severity of tower damage. Based on the previous analysis, structural failure first occurred in Case 2 under a 30 mm ice load. Consequently, this section presents the SDV3 contour plots for all three cases under ice loads of 30 mm, 35 mm, and 40 mm.
Figure 10 displays the SDV3 contour plots at the termination of the analysis for the three cases under different ice loads (where the analysis was interrupted due to cross-arm failure). The results indicate that under the same ice load, the overall damage level of the transmission tower in Case 2 is significantly higher than in Case 1. This occurs because when an insulator string breaks, the conductor will sag. As it descends to the lowest point, a significant impact load is generated. Subsequent swinging of the conductor produces oscillatory loads with progressively diminishing amplitude. If ice load is simultaneously applied, the combination of these two loads will inflict greater damage on the transmission line. This demonstrates that the combined effect of the dynamic impact from the insulator string fracture and the static ice load severely compromises the structural safety of the tower and substantially reduces its load-bearing capacity. Notably, under the 40 mm ice load, cross-arm failure occurred in Case 1 but not in Case 3. This suggests that the fracture of the insulator string reduces the conductor tension, which in turn decreases the force exerted on the cross-arm. This load redistribution enhances the overall load-bearing capacity of the transmission tower, thereby validating the potential feasibility of a controlled insulator string fracture strategy. To obtain a more precise failure load value for Case 1, an incremental analysis was conducted starting from 35 mm with 1 mm increments. By varying the ice load, it was found that failure first occurred in Case 1 at an ice load of 37 mm. By comparing the converted ice loads of 37 mm and 40 mm, it can be concluded that the load-bearing capacity of Case 3 is improved by at least approximately 10% compared to Case 1.
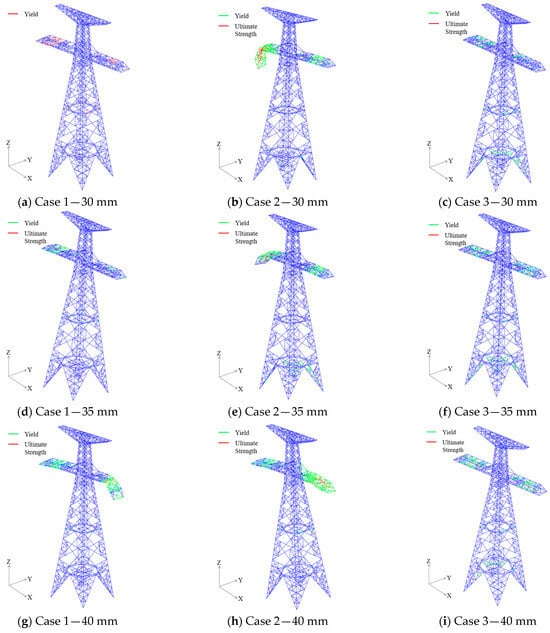
Figure 10.
Contour Plots of Final SDV3 Response under Different Icing Conditions.
Furthermore, the analysis indicates that under ice loads of 30 mm and 35 mm, structural damage to the transmission tower in Case 3 is moderately higher than in Case 1. For example, at 30 mm ice load, more members in Case 3 reached the material yield strength compared to Case 1. At 35 mm ice load, certain cross-arm members in Case 3 attained the ultimate strength, which was not observed in Case 1. To better understand the damage progression in the transmission tower members under 30 mm and 35 mm ice loads, SDV3 contour plots for Case 3 were extracted at four time intervals: 10 s, 30 s, 40 s, and 60 s.
Figure 11 shows the SDV3 contour plots of Case 3 at these four time points under 30 mm and 35 mm ice loads. The results reveal that most of the damage development occurs within the first 10 s. Between 10 s and 30 s, damage progression is minimal. Although an additional ice load is applied at 30 s, only limited damage evolution is observed between 30 s and 40 s, with only a few additional members yielding or reaching ultimate strength. From 40 s to 60 s, the damage development essentially ceases, and the structure gradually stabilizes. For instance, under the 35 mm ice load, several cross-arm members had already yielded within the first 10 s. By 30 s, some of these members reached the ultimate strength, though the number of yielded members increased only slightly compared to that at 10 s. By 40 s, damage had progressed further, with additional members reaching yield and ultimate strength. However, by 60 s, the set of members that had yielded or reached ultimate strength remained unchanged from that at 40 s, indicating that damage progression had effectively stopped.
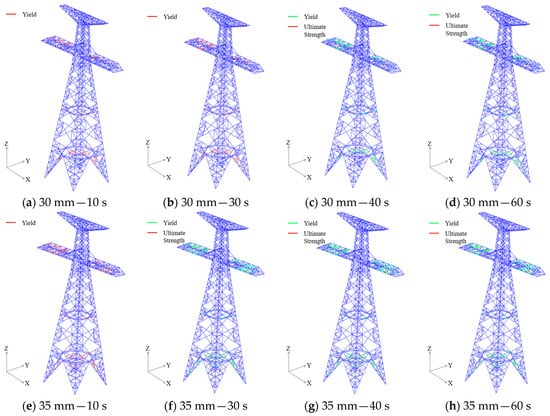
Figure 11.
Contour plots of SDV3 response for the transmission tower at different time steps.
5. Conclusions
Based on the project specifications, this study establishes a finite element model of a two-tower three-line transmission line system with a designed-to-fracture additional insulator string using ABAQUS. A nonlinear hysteresis model for angle steel members was introduced to investigate the impact of insulator string fracture on the safety performance of ice-covered transmission lines, revealing its effect on the structural response of the transmission system. The following conclusions can be drawn from the research:
- (1)
- Under different ice loads, the displacement responses of the conductor, tower top, and cross-arm end all exhibit damped vibration characteristics. As the ice load increases, the displacement responses (including the maximum displacement, conductor jump height, and stable displacement) all increase. The stable displacements of the conductor in Cases 2 and 3 are similar and greater than that in Case 1, indicating that the timing of the insulator string fracture has limited influence on the final steady state of the conductor. The tower top displacements of Case 2 and Case 3 are comparable and approximately 60% larger than that of Case 1. Similarly, the cross-arm displacements of Case 2 and Case 3 show close agreement. The difference in cross-arm displacement between these cases and Case 1 gradually decreases with increasing ice load, declining from 25% at 5 mm to 11% at 25 mm.
- (2)
- As the ice load increases, the leg moment and the steady-state stress of the cross-arm members also increase. The leg moments at the tower base in Cases 2 and 3 are greater than in Case 1, with the difference between Case 2 and Case 1 being more pronounced than that between Case 3 and Case 1. These differences gradually diminish as the ice load increases. The stress curves of the members exhibit damped vibration characteristics. Furthermore, differences in steady-state stress are observed between Case 3 and Case 1: specifically, the stress in Member 1 is lower than in Case 1, while that in Member 2 is higher.
- (3)
- By analyzing the SDV3 contour plots of the transmission tower under different cases, the study demonstrates that the combined effect of additional insulator string fracture and ice load can adversely affect the structural safety of the tower. Case 1 experienced failure under a 37 mm ice load, while Case 3 remained intact even at 40 mm, indicating a load-bearing capacity improvement of up to 10%. This indicates that fracturing the insulator string at a properly selected timing can reduce conductor tension and enhance the load-bearing capacity of the tower. In Case 3, damage development in the transmission tower primarily occurs shortly after the insulator string fractures. Once the conductor stabilizes, the overall structural capacity improves, and further damage progression after the application of the ice load is not significant.
In summary, the method proposed in this study can enhance the load-bearing capacity of the tower-line system within a short timeframe without interrupting power transmission, demonstrating considerable application potential. In future research, the influence of other critical parameters will be investigated to further improve the applicability of the method.
Author Contributions
S.Z. and W.J.: investigation, supervision, writing—original draft. Z.G.: software, data curation, writing—review and editing. F.Y. software, visualization, writing—review and editing. J.L. and L.T.: conceptualization, resources, supervision, writing—review and editing. All authors have read and agreed to the published version of the manuscript.
Funding
This research received no external funding.
Data Availability Statement
The original contributions presented in this study are included in the article. Further inquiries can be directed to the corresponding author.
Acknowledgments
The authors have not disclosed any funding.
Conflicts of Interest
Author Sixiang Zhang, Weiguo Jiang, and Zhen Guo were employed by the company Shandong Electric Power Engineering Consulting Institute Co., Ltd. (SDEPCI). The remaining authors declare that the research was conducted in the absence of any commercial or financial relationships that could be construed as a potential conflict of interest.
References
- Rao, N.P.; Rokade, R.P.; Balagopal, R.; Palani, G.S. Segmental instability failures in transmission line towers. J. Constr. Steel Res. 2023, 211, 108195. [Google Scholar] [CrossRef]
- Li, J.; Gao, F.; Wang, L.; Ren, Y.; Liu, C.; Yang, A.; Yan, Z.; Jiang, T.; Li, C. Collapse mechanism of transmission tower subjected to strong wind load and dynamic response of tower-line system. Energies 2022, 15, 3925. [Google Scholar] [CrossRef]
- Meng, X.; Tian, L.; Liu, J.; Jin, Q. Failure prediction of overhead transmission lines incorporating time series prediction model for wind-ice loads. Reliab. Eng. Syst. Saf. 2025, 259, 110927. [Google Scholar] [CrossRef]
- Meng, X.; Tian, L.; Li, C.; Liu, J. Copula-based wind-induced failure prediction of overhead transmission line considering multiple temperature factors. Reliab. Eng. Syst. Saf. 2024, 247, 110138. [Google Scholar] [CrossRef]
- Kliem, M.; Johansen, D.; Høgsberg, J. Mitigation of conductor line galloping by a direct cable-connection to non-conductive composite power pylons. J. Vibroeng. 2018, 20, 2268–2288. [Google Scholar] [CrossRef]
- Xu, H.; Zhu, K.J.; Liu, B.; Liu, C.L.; Yang, J.L. A study of influencing parameters on conductor galloping for transmission lines. J. Vibroeng. 2014, 16, 312–323. [Google Scholar]
- Zhang, Z.; Zhang, H.; Yue, S.; Zeng, W. A review of icing and anti-icing technology for transmission lines. Energies 2023, 16, 601. [Google Scholar] [CrossRef]
- Wei, J.; Li, B.; Tian, N.; Liang, W.; Zhang, J. Scalable robust superamphiphobic coatings enabled by self-similar structure, protective micro-skeleton, and adhesive for practical anti-icing of high-voltage transmission tower. Adv. Funct. Mater. 2022, 32, 2206014. [Google Scholar] [CrossRef]
- Song, H.; Li, Y. Dynamic response modeling of mountain transmission tower-line coupling system under wind–ice load. Buildings 2023, 13, 828. [Google Scholar] [CrossRef]
- Chen, B.; Qian, X. Explainable data-driven analysis of uncertainty propagation in 3D concrete printing via adaptive polynomial chaos expansion. Autom. Constr. 2025, 178, 106414. [Google Scholar] [CrossRef]
- Liu, J.; Ma, Z.; Tian, L.; Li, Q.; Bi, W. BPNN-assisted control algorithm application to a super large cable-net structure of active FAST reflector system. Structures 2025, 73, 108467. [Google Scholar] [CrossRef]
- Meng, X.; Tian, L.; Liu, J.; Jin, Q. Framework for assessing the performance of overhead transmission lines under wind-temperature effects. J. Constr. Steel Res. 2024, 220, 108838. [Google Scholar] [CrossRef]
- Meng, X.; Tian, L.; Liu, J.; Jin, Q.; Yang, F. Wind-ice-induced damage risk analysis for overhead transmission lines considering regional climate characteristics. Eng. Struct. 2025, 329, 119844. [Google Scholar] [CrossRef]
- Ju, Y.Z.; Xue, Q.; Li, H. Failure analysis of transmission tower under the effect of ice-covered power transmission line. In Proceedings of the 2009 First International Conference on Information Science and Engineering, Nanjing, China, 26–28 December 2009; pp. 4301–4304. [Google Scholar]
- Yang, F.; Yang, J.; Han, J.; Fu, D. Dynamic responses of transmission tower-line system under ice shedding. Int. J. Struct. Stab. Dyn. 2010, 10, 461–481. [Google Scholar] [CrossRef]
- Yang, F.; Yang, J.; Zhang, H. Analyzing loads from ice shedding conductors for UHV transmission towers in heavy icing areas. J. Cold Reg. Eng. 2014, 28, 04014004. [Google Scholar] [CrossRef]
- Xie, X.; Wu, Y.; Liang, K.; Liu, S.; Peng, J. Experiment study on dynamic effects of Tower-Line systems induced by ice shedding. Adv. Civ. Eng. 2020, 2020, 6241789. [Google Scholar] [CrossRef]
- Guo, H.; Maohua, L.; Zhigang, S. Study on Failure Mode of Transmission Tower under Ice Coating. IOP Conf. Ser. Earth Environ. Sci. 2021, 760, 012004. [Google Scholar] [CrossRef]
- Li, J.; Wang, B.; Sun, J.; Wang, S.; Zhang, X.; Fu, X. Collapse analysis of a transmission tower-line system induced by ice shedding. Front. Phys. 2021, 9, 712161. [Google Scholar] [CrossRef]
- Zhang, Z.; Liu, Y.; Xu, J.; Chen, M. Probability Analysis of Transmission Lines Broken and Tower Collapse Caused by Conductor Icing. In Proceedings of the 2012 Asia-Pacific Power and Energy Engineering Conference, Shanghai, China, 27–29 March 2012. [Google Scholar]
- Solangi, A.R. Icing Effects on Power Lines and Anti-Icing and De-Icing Methods. Ph.D. Thesis, UiT The Arctic University of Norway, Tromsø, Norway, 2018. [Google Scholar]
- Zhang, L.; Zhou, X.; Ruan, J.; Feng, Z.; Shen, Y.; Yao, Y. Failure Analysis and Safety De-Icing Strategy of Local Transmission Tower-Line Structure System Based on Orthogonal Method in Power System. Processes 2025, 13, 1782. [Google Scholar] [CrossRef]
- Qu, C.-Z.; Liu, Y.-J. De-icing method for coupled transmission tower-line system. Energy Procedia 2012, 17, 1383–1389. [Google Scholar]
- Ji, K.; Zhang, L.; Zhan, X.; Liu, B.; Yang, J. Analysis of mechanical deicing method for low voltage overhead transmission lines. In Proceedings of the 2020 IEEE 5th Information Technology and Mechatronics Engineering Conference (ITOEC), Chongqing, China, 12–14 June 2020. [Google Scholar]
- Zhou, F.; Zhu, J.; An, N.; Wang, C.; Liu, J.; Long, L. The anti-icing and deicing robot system for electricity transmission line based on external excitation resonant. IEEJ Trans. Electr. Electron. Eng. 2020, 15, 593–600. [Google Scholar] [CrossRef]
- Wang, Z.; Cai, M.; Wang, T.; Zhang, B. Research on de-icing robot and its motion characteristics overhead transmission line. MATEC Web Conf. 2017, 100, 03015. [Google Scholar] [CrossRef]
- You, Y.; He, C.; Wang, Y.; Ji, K.; Yang, J. Vibrational De-icing Technology for Power Transmission Lines: An Innovative Approach. In Proceedings of the 2024 International Conference on Electrical Drives, Power Electronics & Engineering (EDPEE), Kyiv, Ukraine, 19–21 April 2024. [Google Scholar]
- Feng, J.; Wang, S.; Cai, X.; Mao, X.; Wu, Y.; Huang, Q.; Zhu, S.; Zhu, Y. Study on De-Icing Technology of High Altitude Wind Power Transmission Line. In Proceedings of the 2023 International Conference on Power System Technology (PowerCon), Jinan, China, 21–23 September 2023. [Google Scholar]
- Zhou, X.; Zhu, Y.; Zhang, Y.; Li, H. A review of anti-icing and de-icing technology of overhead ground wire. In Proceedings of the 2022 International Symposium on Electrical, Electronics and Information Engineering (ISEEIE), Seoul, Republic of Korea, 25–27 February 2022. [Google Scholar]
- Liu, Y.; Liu, Y.; Cui, Y.; Yuan, H.; Lv, J. Analysis of the relationship between DC component and spectral components of corona current on HVDC transmission lines. IET Gener. Transm. Distrib. 2019, 13, 1952–1959. [Google Scholar] [CrossRef]
- Zhong, Y.; Li, S.; Jin, W.; Yan, Z.; Liu, X.; Li, Y. Frequency domain analysis of along wind response and study of wind loads for transmission tower subjected to downbursts. Buildings 2022, 12, 148. [Google Scholar]
- Pan, H.; Li, C.; Li, H.N.; Hu, J.; Ma, R. Underwater shaking table test and seismic fragility assessment of free-spanning submarine pipelines under offshore spatial motions. Thin-Walled Struct. 2025, 213, 113276. [Google Scholar] [CrossRef]
- Liu, J.; Tian, L.; Zhang, R.; Ma, Z.; Yang, M. Performance-based failure risk evaluation of transmission tower-line systems subjected to sequential earthquakes. J. Constr. Steel Res. 2025, 234, 109730. [Google Scholar]
- Zhu, Y.; Huang, X.; Jia, J.; Tian, Y.; Zhang, L.; Cui, Y.; Li, X. Experimental study on the thermal conductivity for transmission line icing. Cold Reg. Sci. Technol. 2016, 129, 96–103. [Google Scholar] [CrossRef]
- Xiao, M.Y.; Zhou, W.X.; Bitsuamlak, G.; Hong, H.P. Fragility of transmission tower-line system subjected to concurrent wind and ice accretion. J. Constr. Steel Res. 2024, 222, 108925. [Google Scholar] [CrossRef]
Disclaimer/Publisher’s Note: The statements, opinions and data contained in all publications are solely those of the individual author(s) and contributor(s) and not of MDPI and/or the editor(s). MDPI and/or the editor(s) disclaim responsibility for any injury to people or property resulting from any ideas, methods, instructions or products referred to in the content. |
© 2025 by the authors. Licensee MDPI, Basel, Switzerland. This article is an open access article distributed under the terms and conditions of the Creative Commons Attribution (CC BY) license (https://creativecommons.org/licenses/by/4.0/).