1. Introduction
In performance-based architectural design, optimizing façade systems involves balancing multiple, often conflicting, objectives such as thermal performance, material efficiency, and constructability. Opaque ventilated façades (OVFs), particularly in hot arid climates, have demonstrated significant potential in reducing heat gain [
1,
2,
3,
4]. However, identifying optimal design configurations remains a complex task due to the intricate interplay of geometric and thermal parameters. While computational fluid dynamics (CFD) simulations provide detailed insights into the thermal behavior of such systems, their use as standalone tools is computationally intensive, especially when large numbers of design alternatives need to be evaluated.
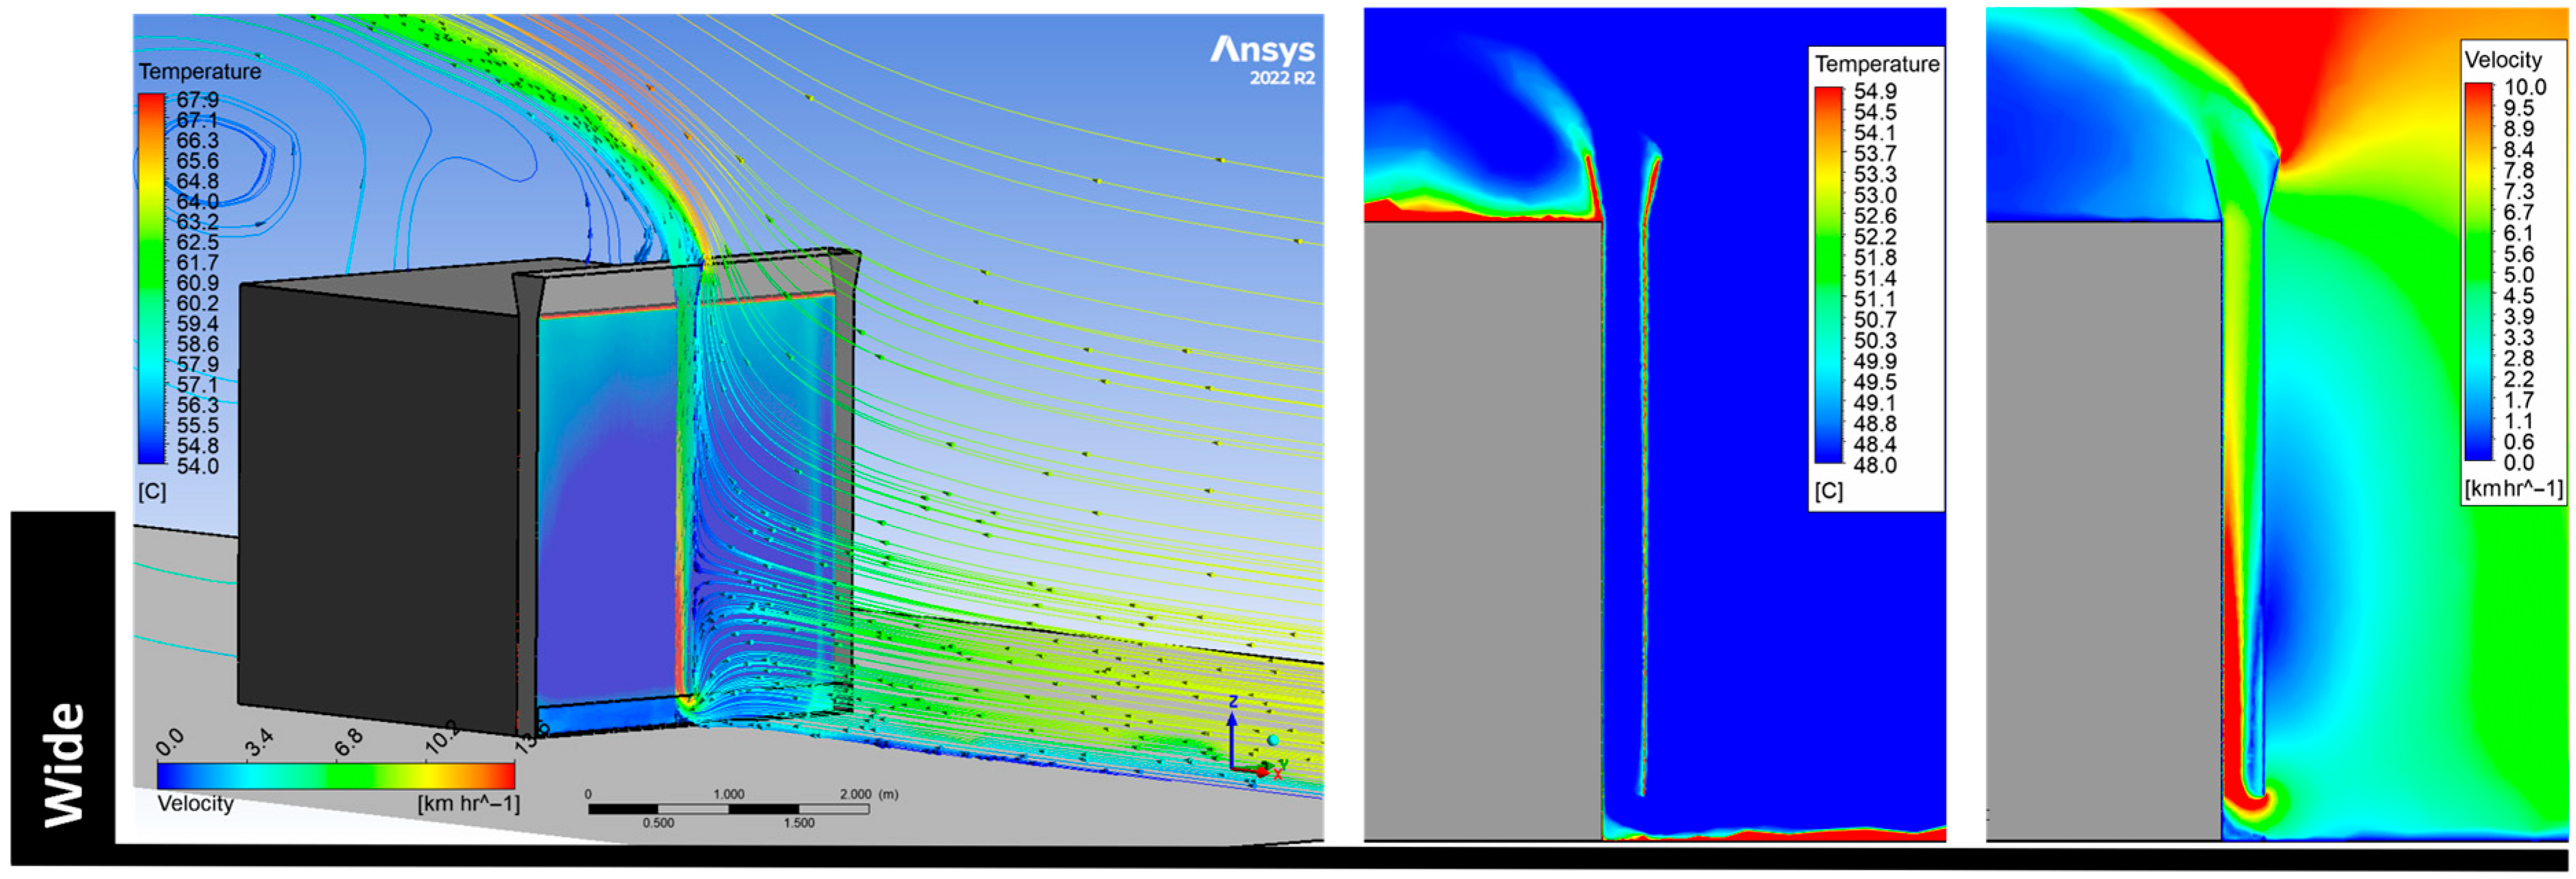
To address this challenge, this study presents a computational framework that combines CFD simulations with parametric modeling and machine learning-based surrogate modeling to facilitate efficient multi-objective optimization of biomimetic OVF systems. Following an earlier concept and sensitivity analysis phase that identified a promising biomimetic geometry in the form of a wide mound design, as seen in
Figure 1 [
4], this phase focuses on optimizing its thermal performance using a multi-objective optimization workflow.
Parametric modeling allows for the creation of digital models in which the geometric elements are defined by user-specified parameters. By modifying these parameters, a broad range of design options can be explored [
5]. In this study, parametric modeling was used as a primary framework to represent the relationships between the given input parameters and the CFD outcomes. Among the available parametric modeling tools, the Grasshopper plugin for Rhinoceros [
6] is the most widely adopted visual programming language in architectural research. The graphical algorithm editor in Grasshopper applies systematic logic to embed the design intent from the beginning and facilitates interaction with performance simulation tools and multi-objective evolutionary algorithm solvers for optimization.
However, since Ansys Fluent CFD software, 2022 [
7] was selected for this study based on a comparison of widely accepted CFD tools in the preceding research on which this study is based [
3], the parametric modeling had to be carried out within the Ansys Workbench platform. Ansys DesignXplorer [
8] is a comprehensive system that uses a deterministic approach, incorporating Design of Experiments (DOE) and various optimization methods, with parameters playing a central role. These parameters can be defined within any compatible modeling tool, such as Ansys DesignModeler or Spaceclaim. The process involves solving the optimization problem using set objectives and parameters and identifying the best outcome by finding a suitable balance between those objectives [
8]. As a result, the proposed biomimetic OVF solutions were redesigned and parameterized using the Spaceclaim block record feature to take full advantage of the DesignXplorer system.
Ansys DesignXplorer has been widely adopted in engineering disciplines for simulation-based optimization due to its ability to efficiently couple design of experiments (DOE), surrogate modeling, and sensitivity analysis with CFD tools. In recent research, the significance of Ansys DesignXplorer has been underscored for optimizing flow characteristics in curved conduits. This tool facilitates efficient parametric studies, significantly reducing the number of required CFD simulations [
9]. By employing response surface methodology, DesignXplorer enables rapid exploration of various vane configurations, which significantly cuts down computational time [
9]. Furthermore, its capability to manage multi-objective optimization allows users to effectively balance the trade-offs between minimizing pressure drop and maximizing velocity uniformity, guiding the design process toward optimal solutions [
9]. The integration of DesignXplorer with Ansys Fluent ensures that the optimization results are grounded in reliable CFD simulations, enhancing the overall accuracy of the outcomes [
9]. In another study, Ayancik et al. (2016) [
10] highlight the necessity of using sophisticated optimization techniques to ensure the creation of cavitation-free runner blades with high efficiency. The study highlights the significance of balancing conflicting goals, such as enhancing efficiency and reducing the risk of cavitation [
10]. By adopting this strategy, the design process becomes more efficient, and turbine performance is improved, underscoring the essential role of advanced optimization techniques in hydraulic engineering [
10]. These examples highlight the versatility of DesignXplorer for high-fidelity CFD-based optimization, enabling significant performance improvements while reducing computational cost.
In building performance research, optimization methods have emerged as vital tools for enhancing architectural design variables. Kaseb and Montazeri (2022) [
11] investigated the aerodynamic optimization of building-integrated ducted openings using metamodeling techniques. Their study revealed that such optimization significantly increased predicted annual available power and energy production for urban wind energy systems [
11]. Fallahpour et al. (2025) [
12] proposed a multi-objective optimization framework designed to enhance mass flow rate and average air velocity while simultaneously minimizing the temperature differential between indoor and outdoor environments in buildings situated in hot-arid climates. They employed iterative optimization alongside CFD simulations, demonstrating advancements in the design process [
12]. In another study, Abdeen et al. (2019) [
13] conducted an in-depth investigation into the optimization of solar chimney configurations as a means to enhance natural ventilation within buildings. By employing a systematic evaluation process and utilizing Ansys DesignXplorer, the researchers were able to identify design modifications that significantly improved thermal comfort and airflow performance [
13]. These studies collectively demonstrate the growing relevance of DesignXplorer in architectural contexts, where it supports efficient, performance-driven decision-making in complex environmental systems.
Ansys DesignXplorer offers two approaches to optimization: direct optimization and indirect optimization. These approaches produce similar results, although they follow different procedures. Direct optimization proceeds without intermediate steps and can quickly determine the most effective solution. However, it does not provide detailed intermediate results or graphical representations of how individual or multiple parameters influence the objectives. In contrast, indirect optimization uses data generated from a response surface cell, and its accuracy depends on the precision and quality of this surface in predicting system behavior. The response surface method utilizes machine learning algorithms to create a mathematical model that can reliably estimate system performance based on changes in input parameters. Therefore, the indirect optimization method allows for immediate approximations of CFD results without the need to run full simulations, unlike the direct optimization approach [
8] (ANSYS 2023). In this research, Ansys DesignXplorer with the indirect optimization method was employed to improve the thermal performance of the proposed biomimetic opaque ventilated façade solutions.
The optimization process integrates four interdependent components. First, the biomimetic OVF was parametrically reconstructed in Ansys SpaceClaim to enable design variable manipulation. Second, a DOE methodology was applied to strategically sample the parameter space and generate training data. Third, machine learning algorithms embedded within Ansys DesignXplorer were used to construct response surface surrogate models that predict key CFD outputs, namely inner skin surface temperature and surface area. Fourth, multi-objective optimization algorithms were applied to these surrogate models to identify optimal configurations that balance thermal efficiency with material economy.
In the present study, the surrogate models generated through DesignXplorer effectively approximate CFD outputs across thousands of design configurations, enabling comprehensive optimization without resorting to computationally expensive full CFD simulations for every iteration. This approach demonstrates a scalable, simulation-integrated method for optimizing façade systems in extreme climate conditions, combining parametric control, thermal simulation, and machine learning within a unified environment. By leveraging the synergy between bio-inspired design strategies and data-driven optimization, the study contributes a replicable and efficient methodology for advancing performance-driven façade design in architectural practice.
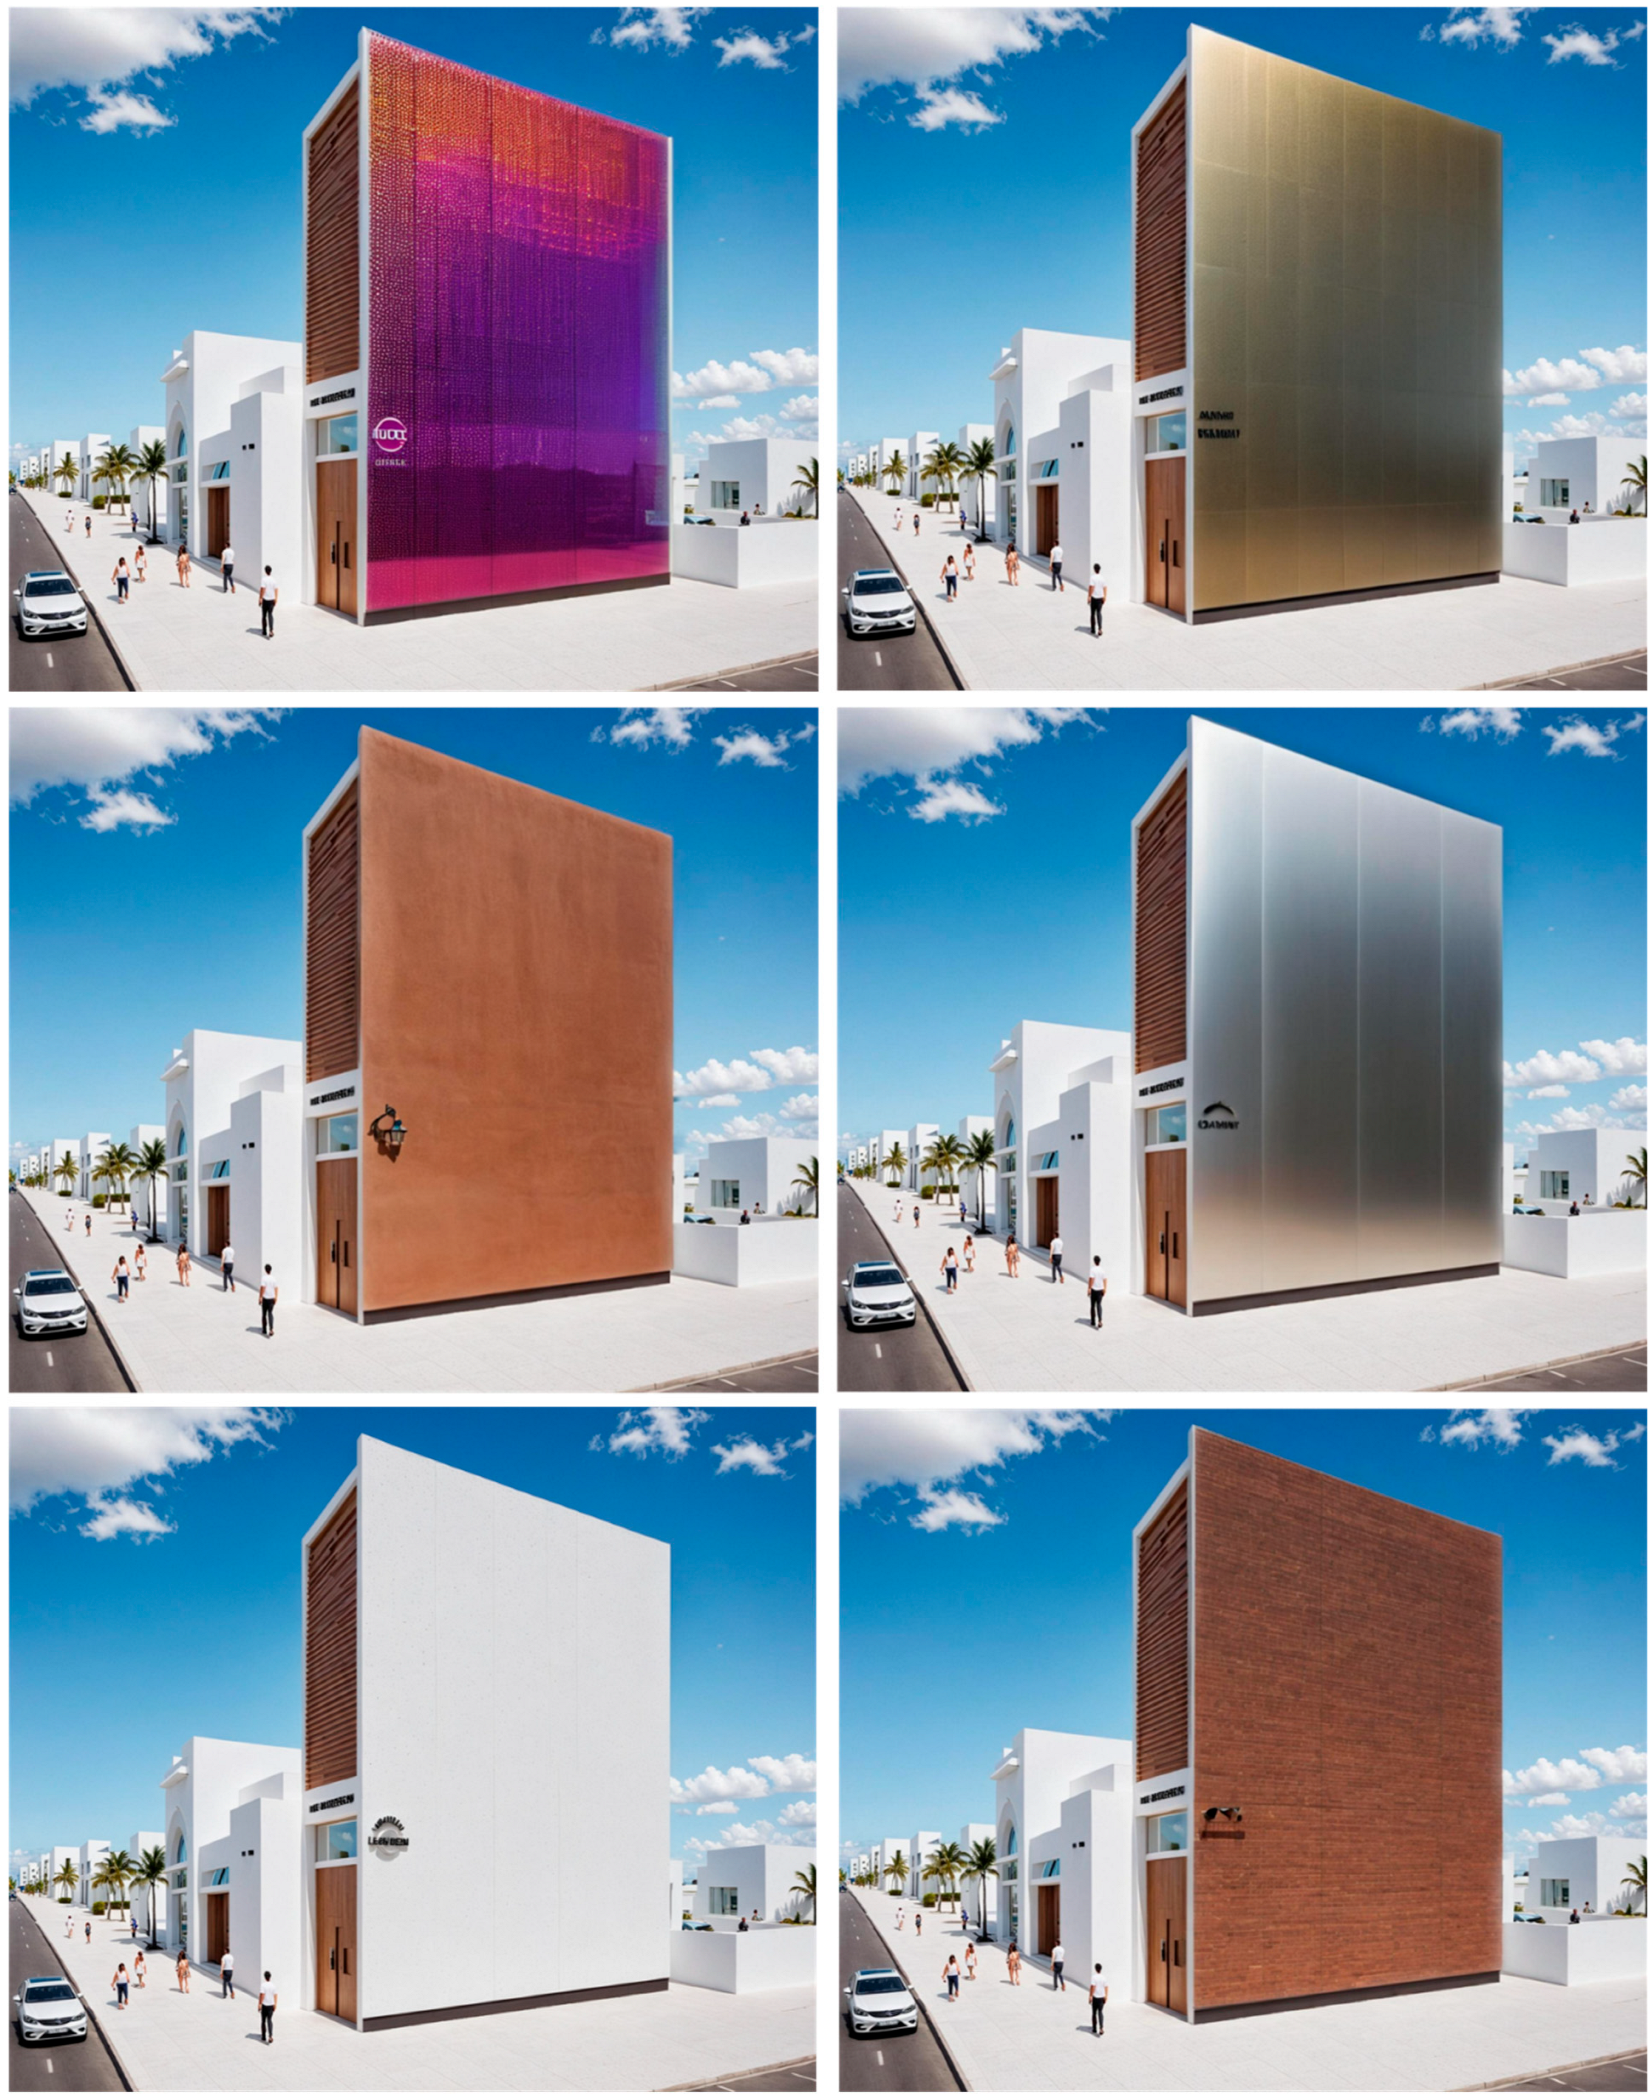
To explore the practical implications of the optimized design, the study also extends beyond simulation by examining its application in real-world building scenarios. The most promising façade configuration was further evaluated under varying environmental conditions and applied to low-rise commercial buildings in a hot arid climate. This application demonstrated the design’s potential for real-world implementation, confirming its effectiveness in enhancing thermal performance and its adaptability to conventional construction practices.
2. Biomimetic Opaque Ventilated Façade Optimization
2.1. Parametrization Process
Any design optimization problem involves defining variables, objectives, and constraints. Variables are subsets of design parameters, while objectives define the design’s goodness. Constraints are functions of design variables that define a feasible variable space. Optimization is the iterative process of altering the design space for a design that maximizes or minimizes the objectives. In this study, four input parameters were selected to minimize the two identified objectives, or output parameters, as called in the Ansys workbench system, which are reducing both the average inner skin surface temperature and the total surface area.
In the previous study conducted by Alyahya et al. (2025) [
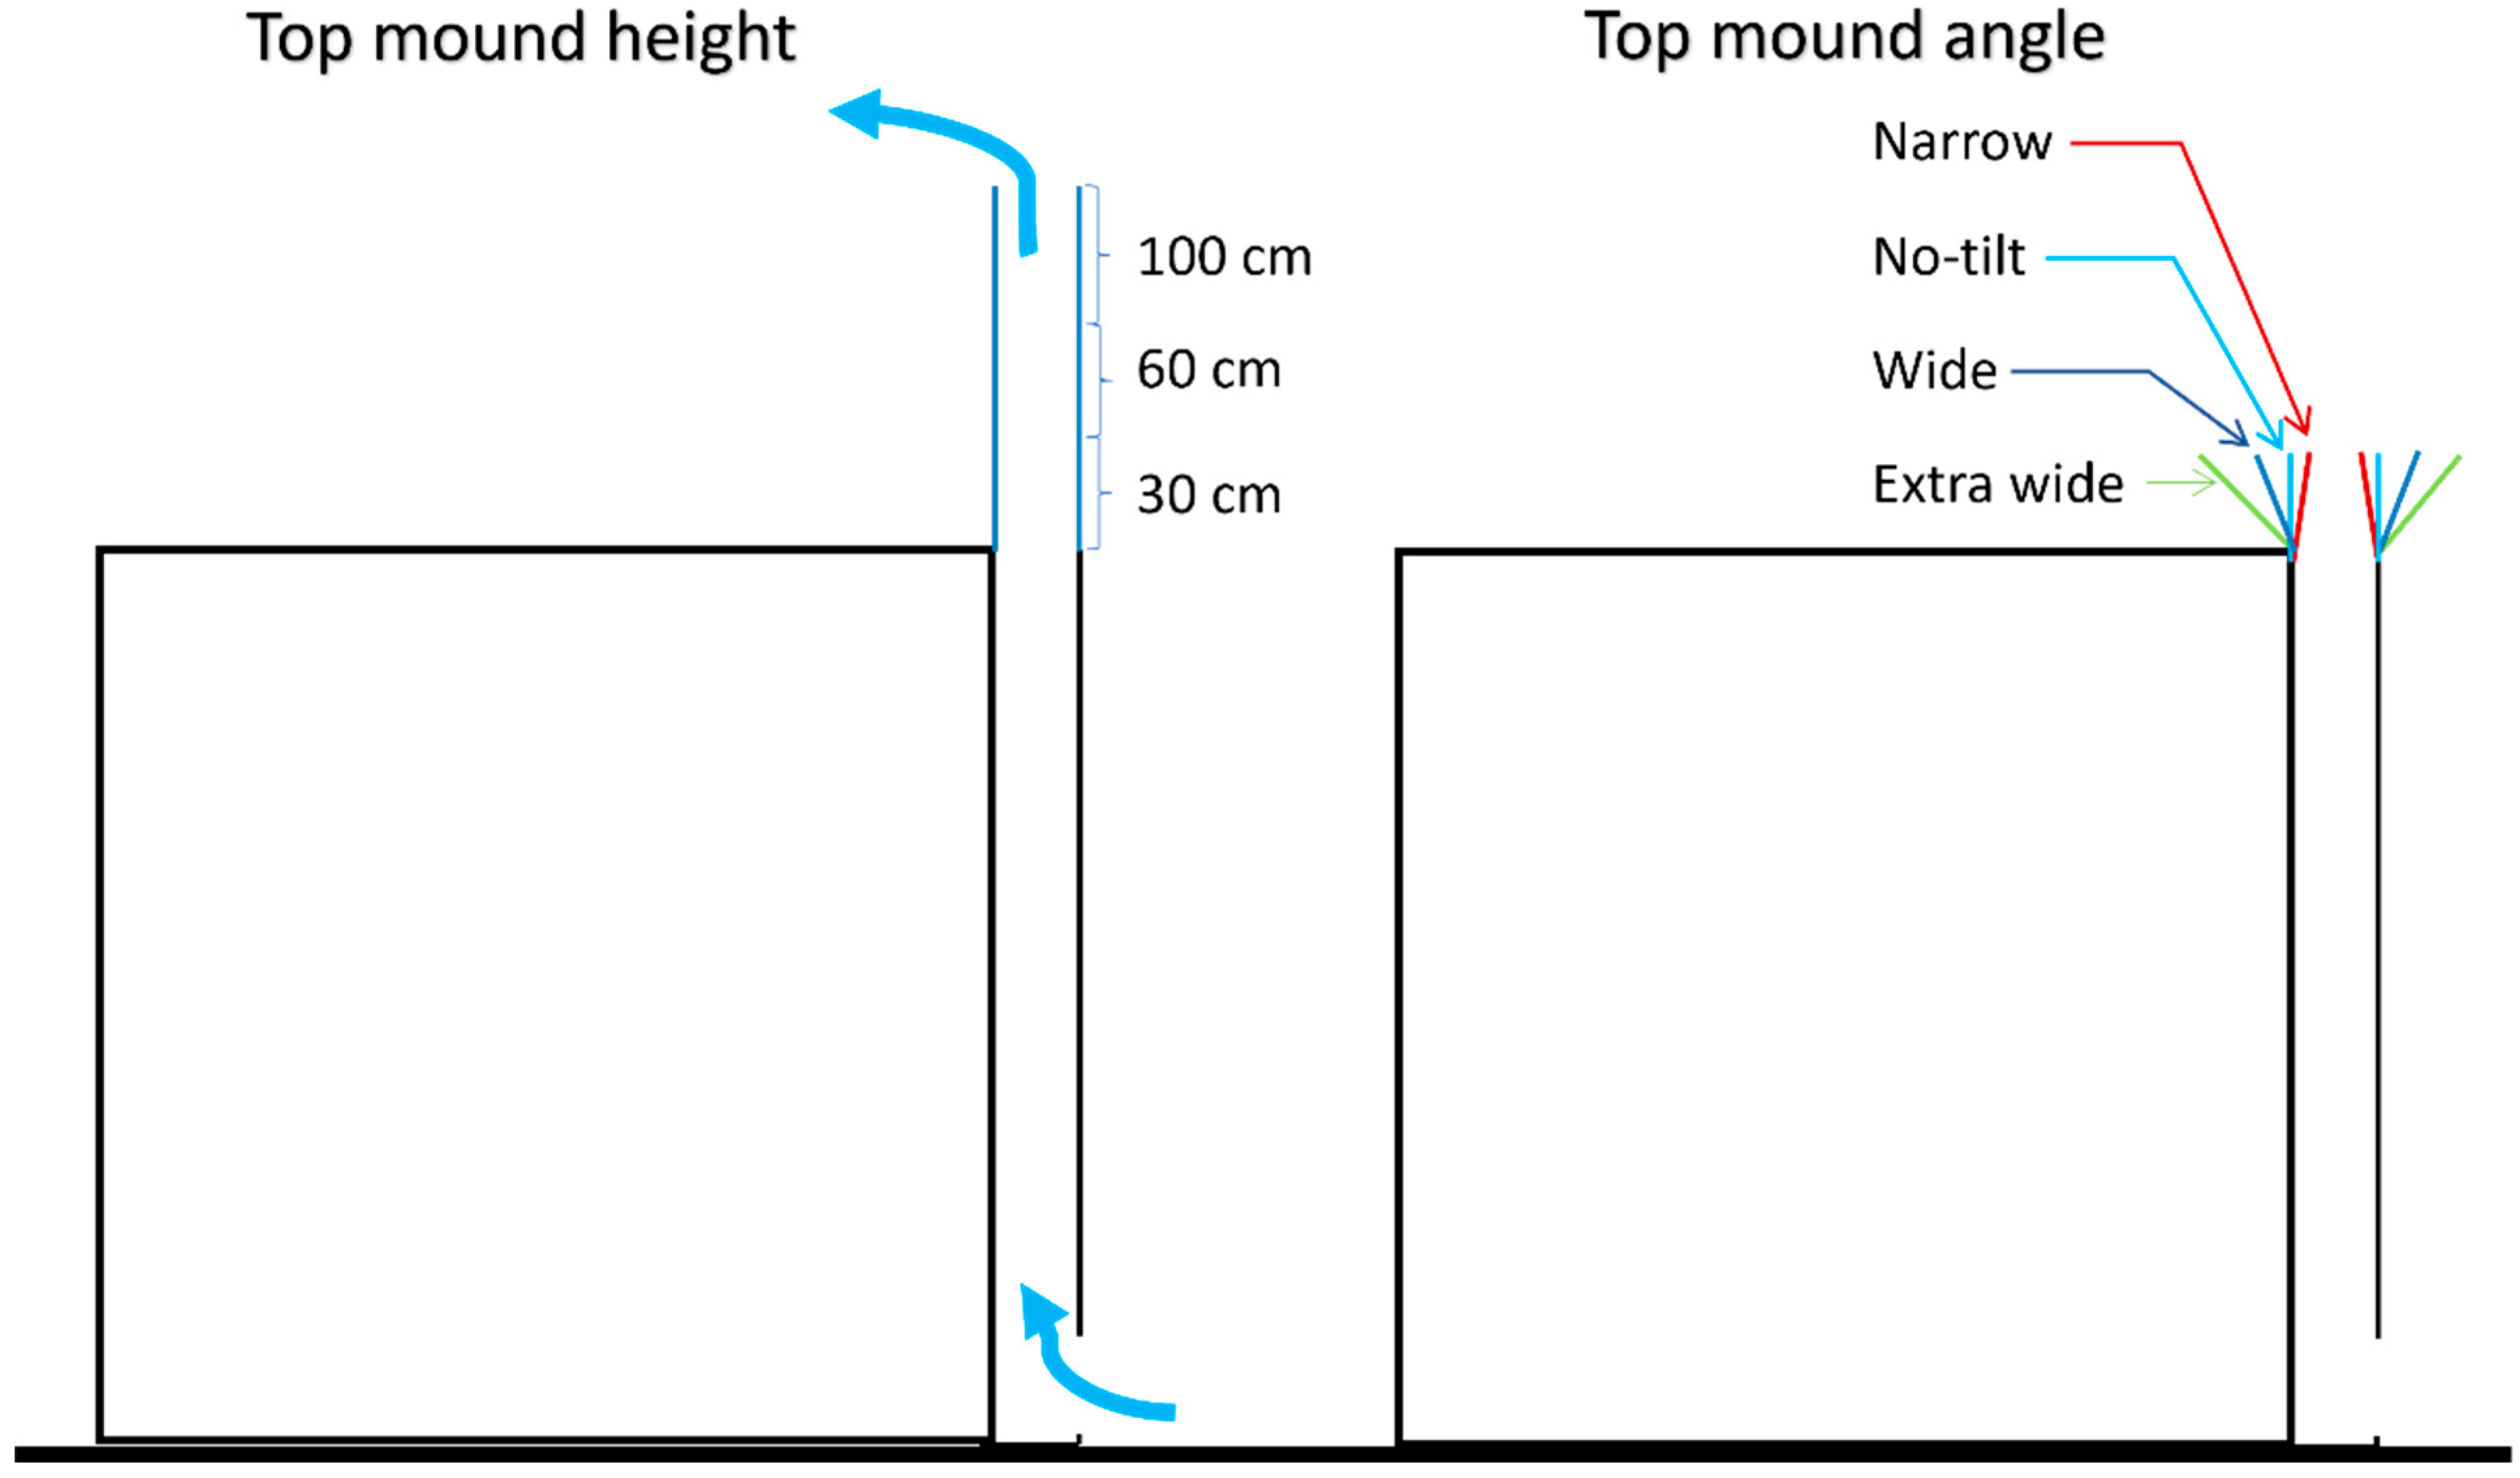
4], it was found that changes to the height and angle of the top mound had a notable effect on the average temperature of the inner skin surface. To investigate this, three CFD simulations were carried out for each selected mound height to analyze airflow behavior and performance differences. For the analysis of top mound angle configurations, four additional CFD simulations were performed using mounds with a fixed height of 30 cm. These configurations are illustrated in
Figure 2 [
4]. The results related to mound height showed that increasing the height from 0.3 m to 1 m led to a corresponding decrease in the average inner skin temperature. However, this temperature reduction came with an increase in the total surface area [
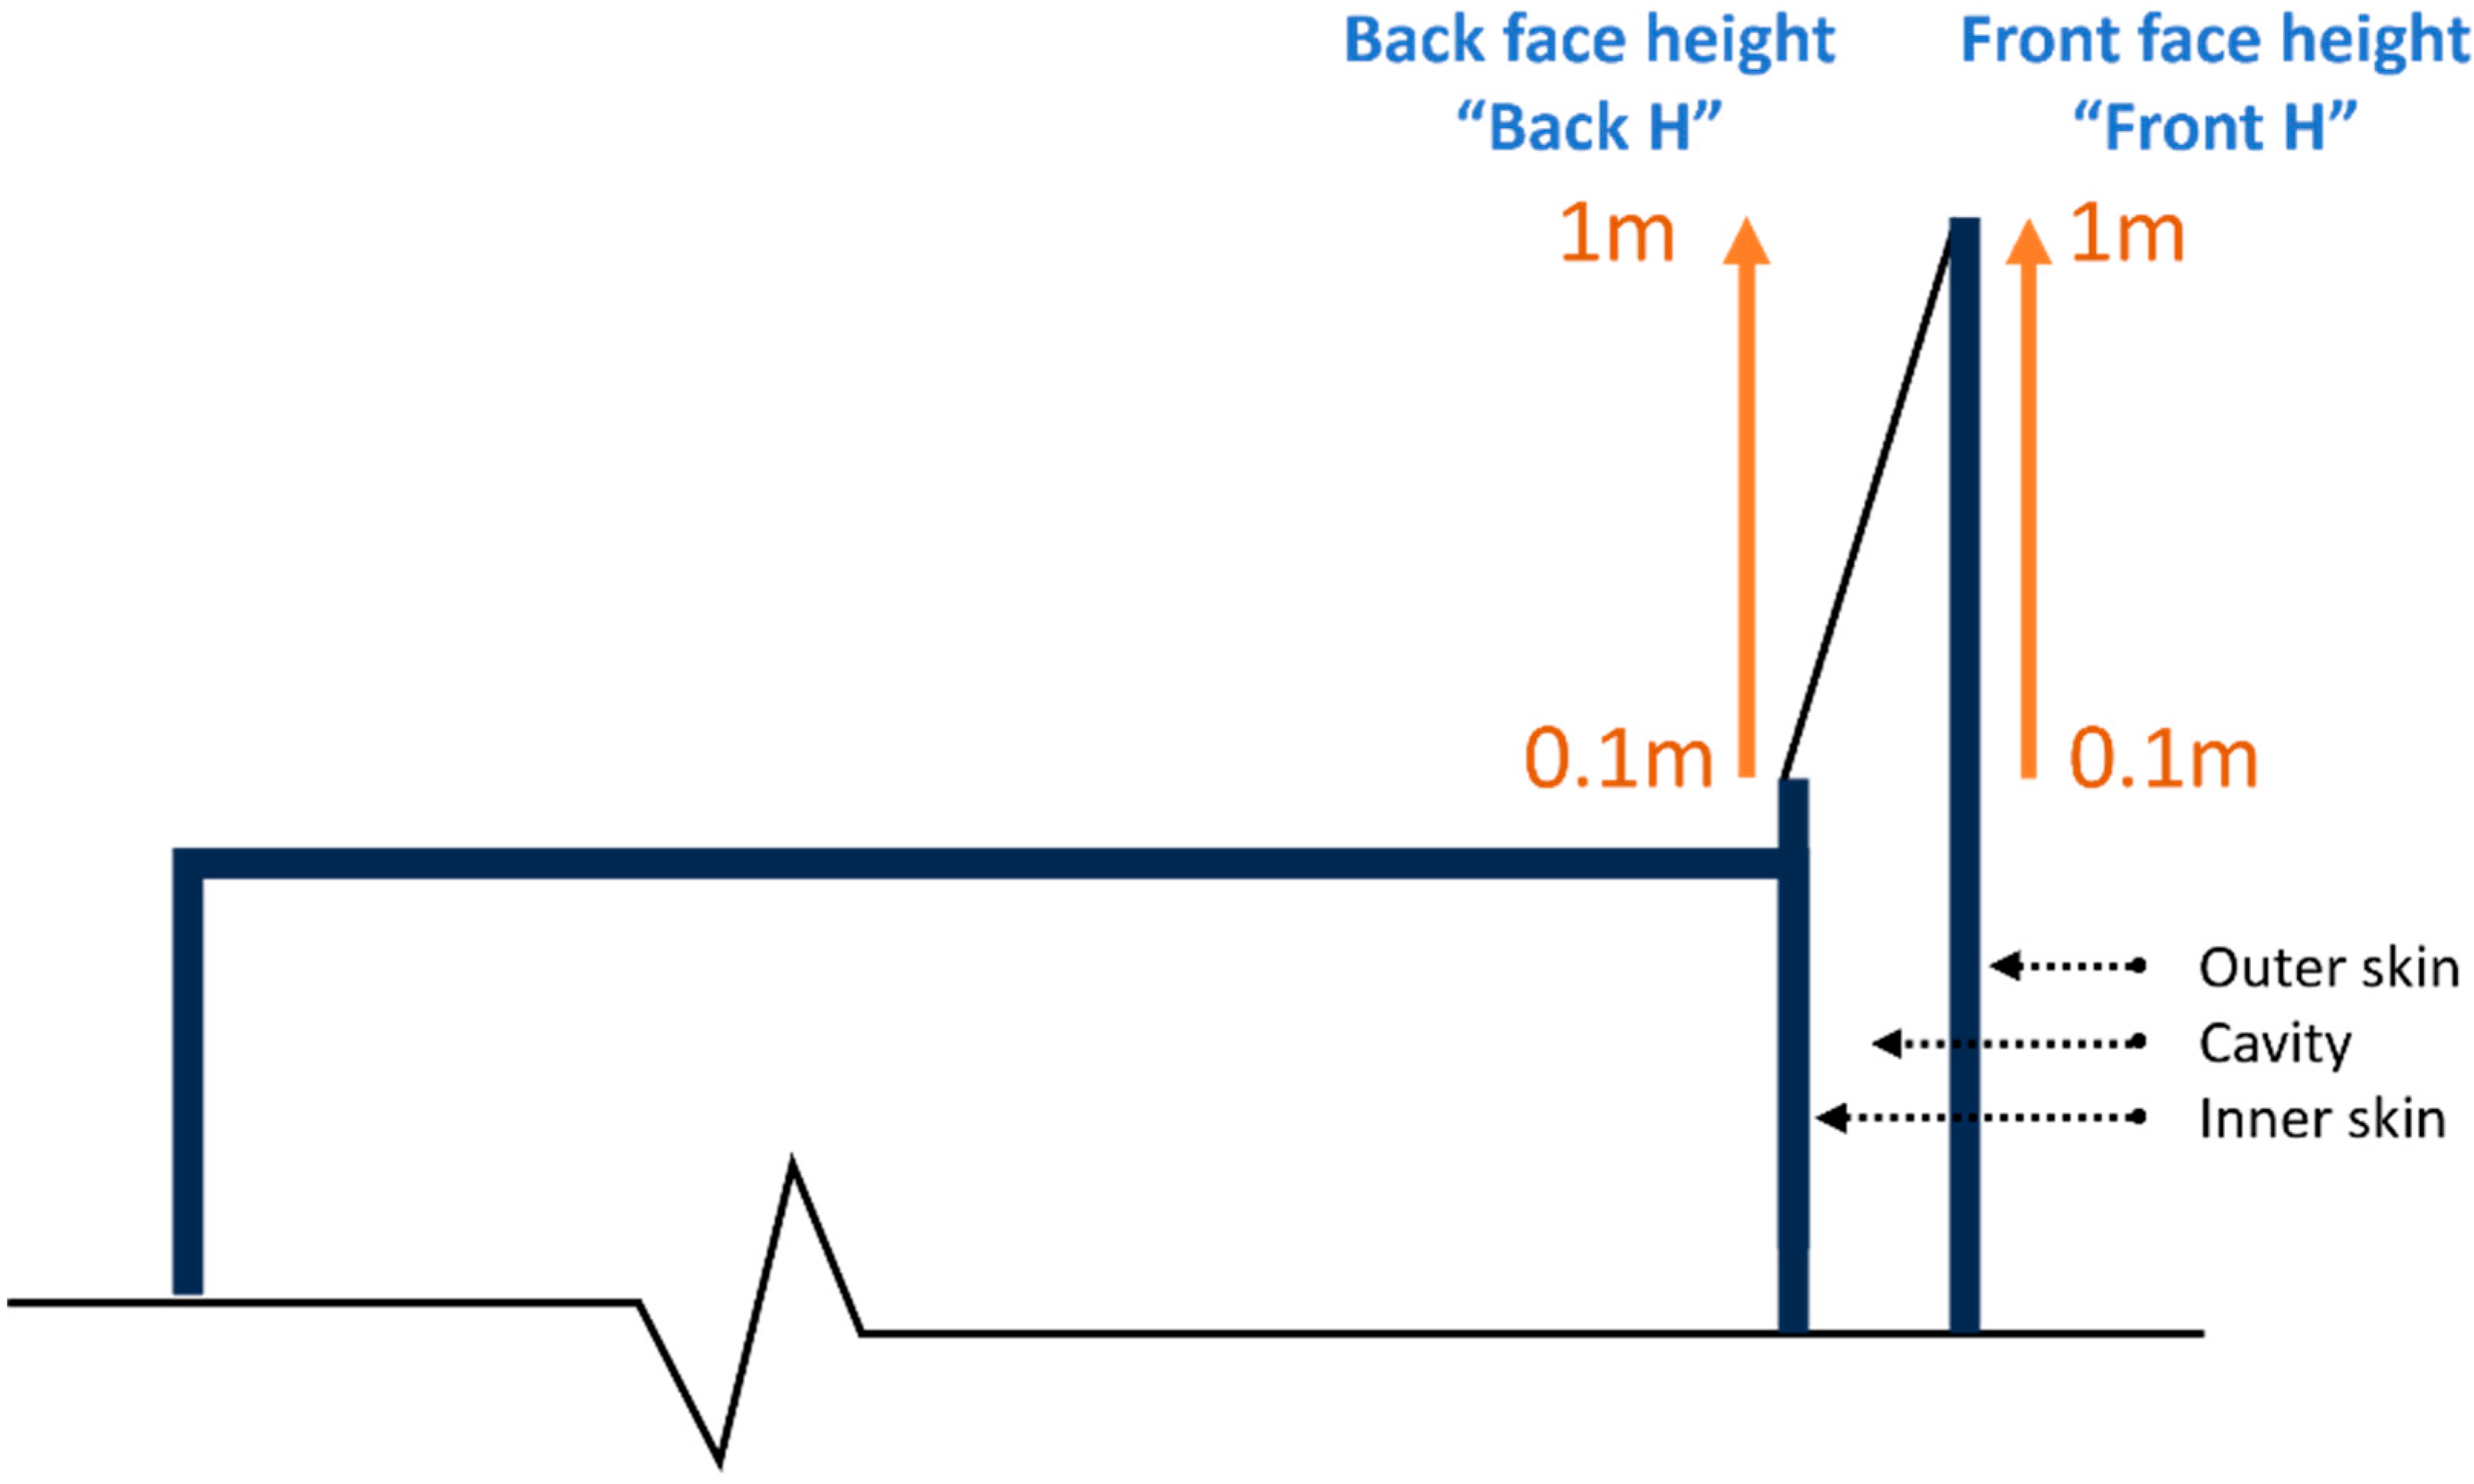
4]. In this study, to explore the potential for reducing both the inner skin temperature and the surface area, the front and back face heights of the top mound were parameterized independently. This approach aimed to determine whether adjusting one side more than the other could help balance the two performance goals. The height values for both faces were constrained between 0.1 m and 1 m. In this context, the height of the front face is referred to as “Front H,” while the height of the back face is referred to as “Back H,” as shown in
Figure 3.
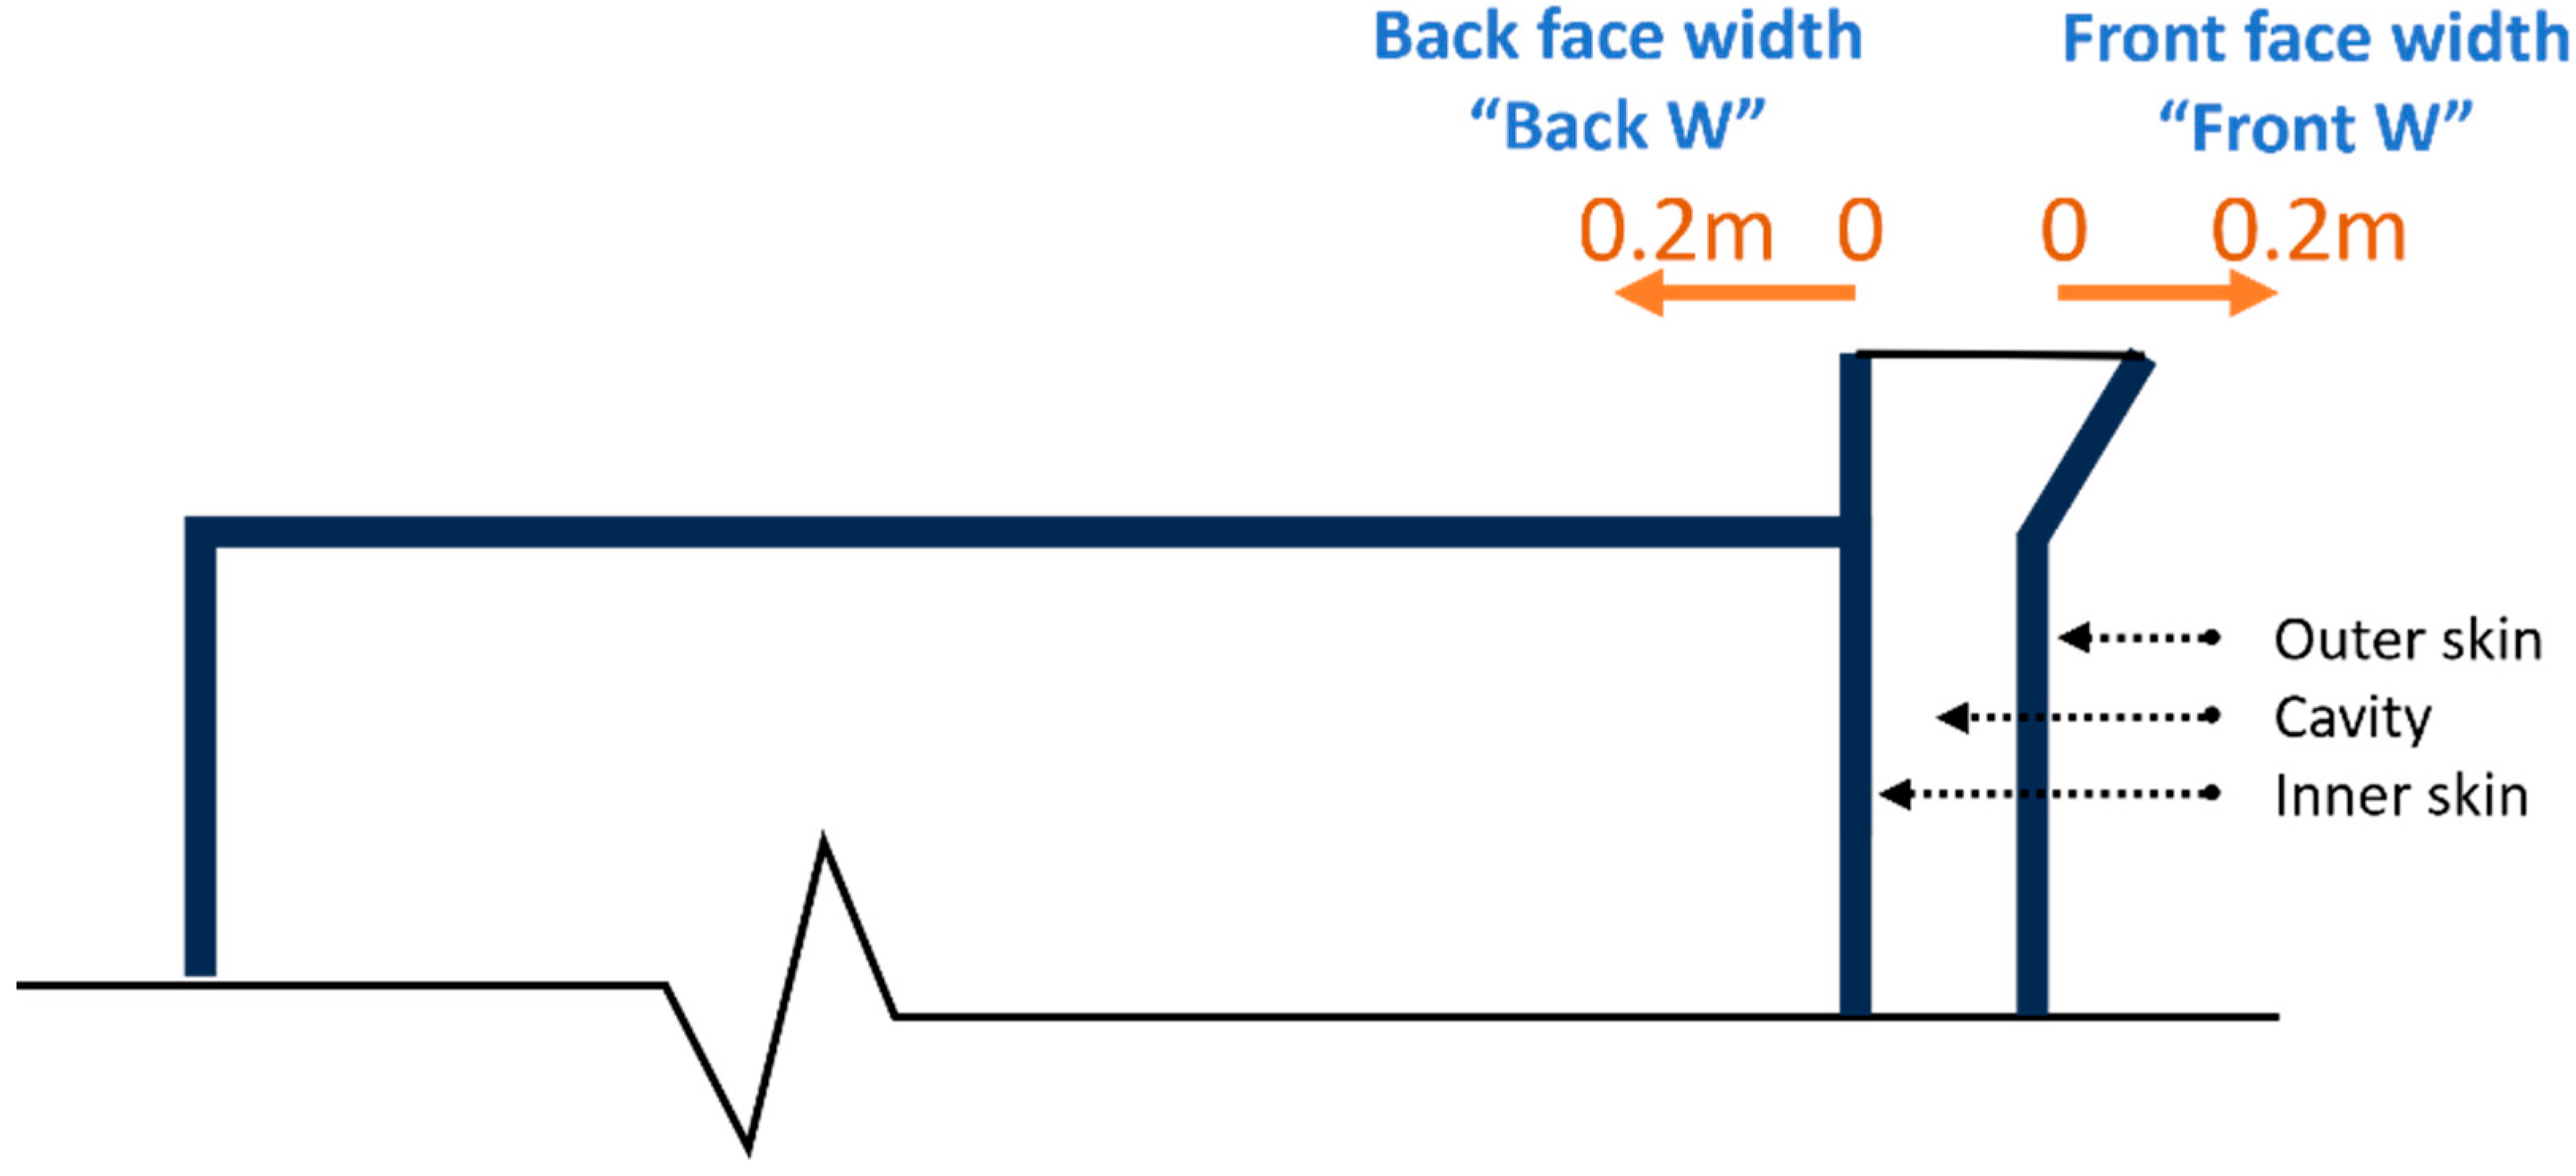
With respect to the mound angle, it was previously demonstrated that the wide mound proved to be the most effective solution. However, the ideal angle that optimizes thermal performance remains uncertain, as there was a point at which the thermal performance began to deteriorate with the extra-wide mound. In addition, it should be noted that the front and back sides of the mound were symmetrically expanded. So, the performance of the mound in situations where the front and back faces have varying angles has not yet been assessed. In order to parameterize the expansion of the top mound angle, the distance from zero, which represents a no-tilt mound, was increased to a distance of 0.2 m from the cavity. For instance, in the case where the parameter “Front W”, which represents the measurement of the front face expansion, is set at 0.2 m, and the parameter “Back W” is set to zero, the resulting mound will exhibit no tilt in the back face and only a tilt in the front face, as displayed in
Figure 4.
2.2. Design of Experiments
After parametrizing the wide mound solution, the Design of Experiments (DOE) technique is employed to systematically find the placement of sampling points. In the field of engineering, there is a vast selection of different DOE algorithms and methods that can be used. They serve the aim of dividing the range of changes in variables or input parameters into different values ranging from the minimum to the maximum based on a specific pattern; these values are known as design points. Following that, a collection of these defined values, or design points, are allocated into separate rows within a table, with each row representing an individual solution. The results obtained from each solution illustrate the impact of the input parameters on the output parameters.
The default design of experiments type in Ansys is the Central Composite Design (CCD). The CCD is a robust and effective method that yields significant information regarding experimental variables and errors while requiring a limited number of experimental runs [
14]. This approach incorporates a center point, points along the axis of the input parameters, and additional points selected using a fractional factorial design. The Auto-Defined design type of CCD was used as the process of design exploration involves the automatic selection of the appropriate design type, which is determined by the number of input variables. It is advisable to utilize this option in the majority of situations due to its automated switching between G-Optimality when the number of input variables is five and VIF-Optimality otherwise [
8].
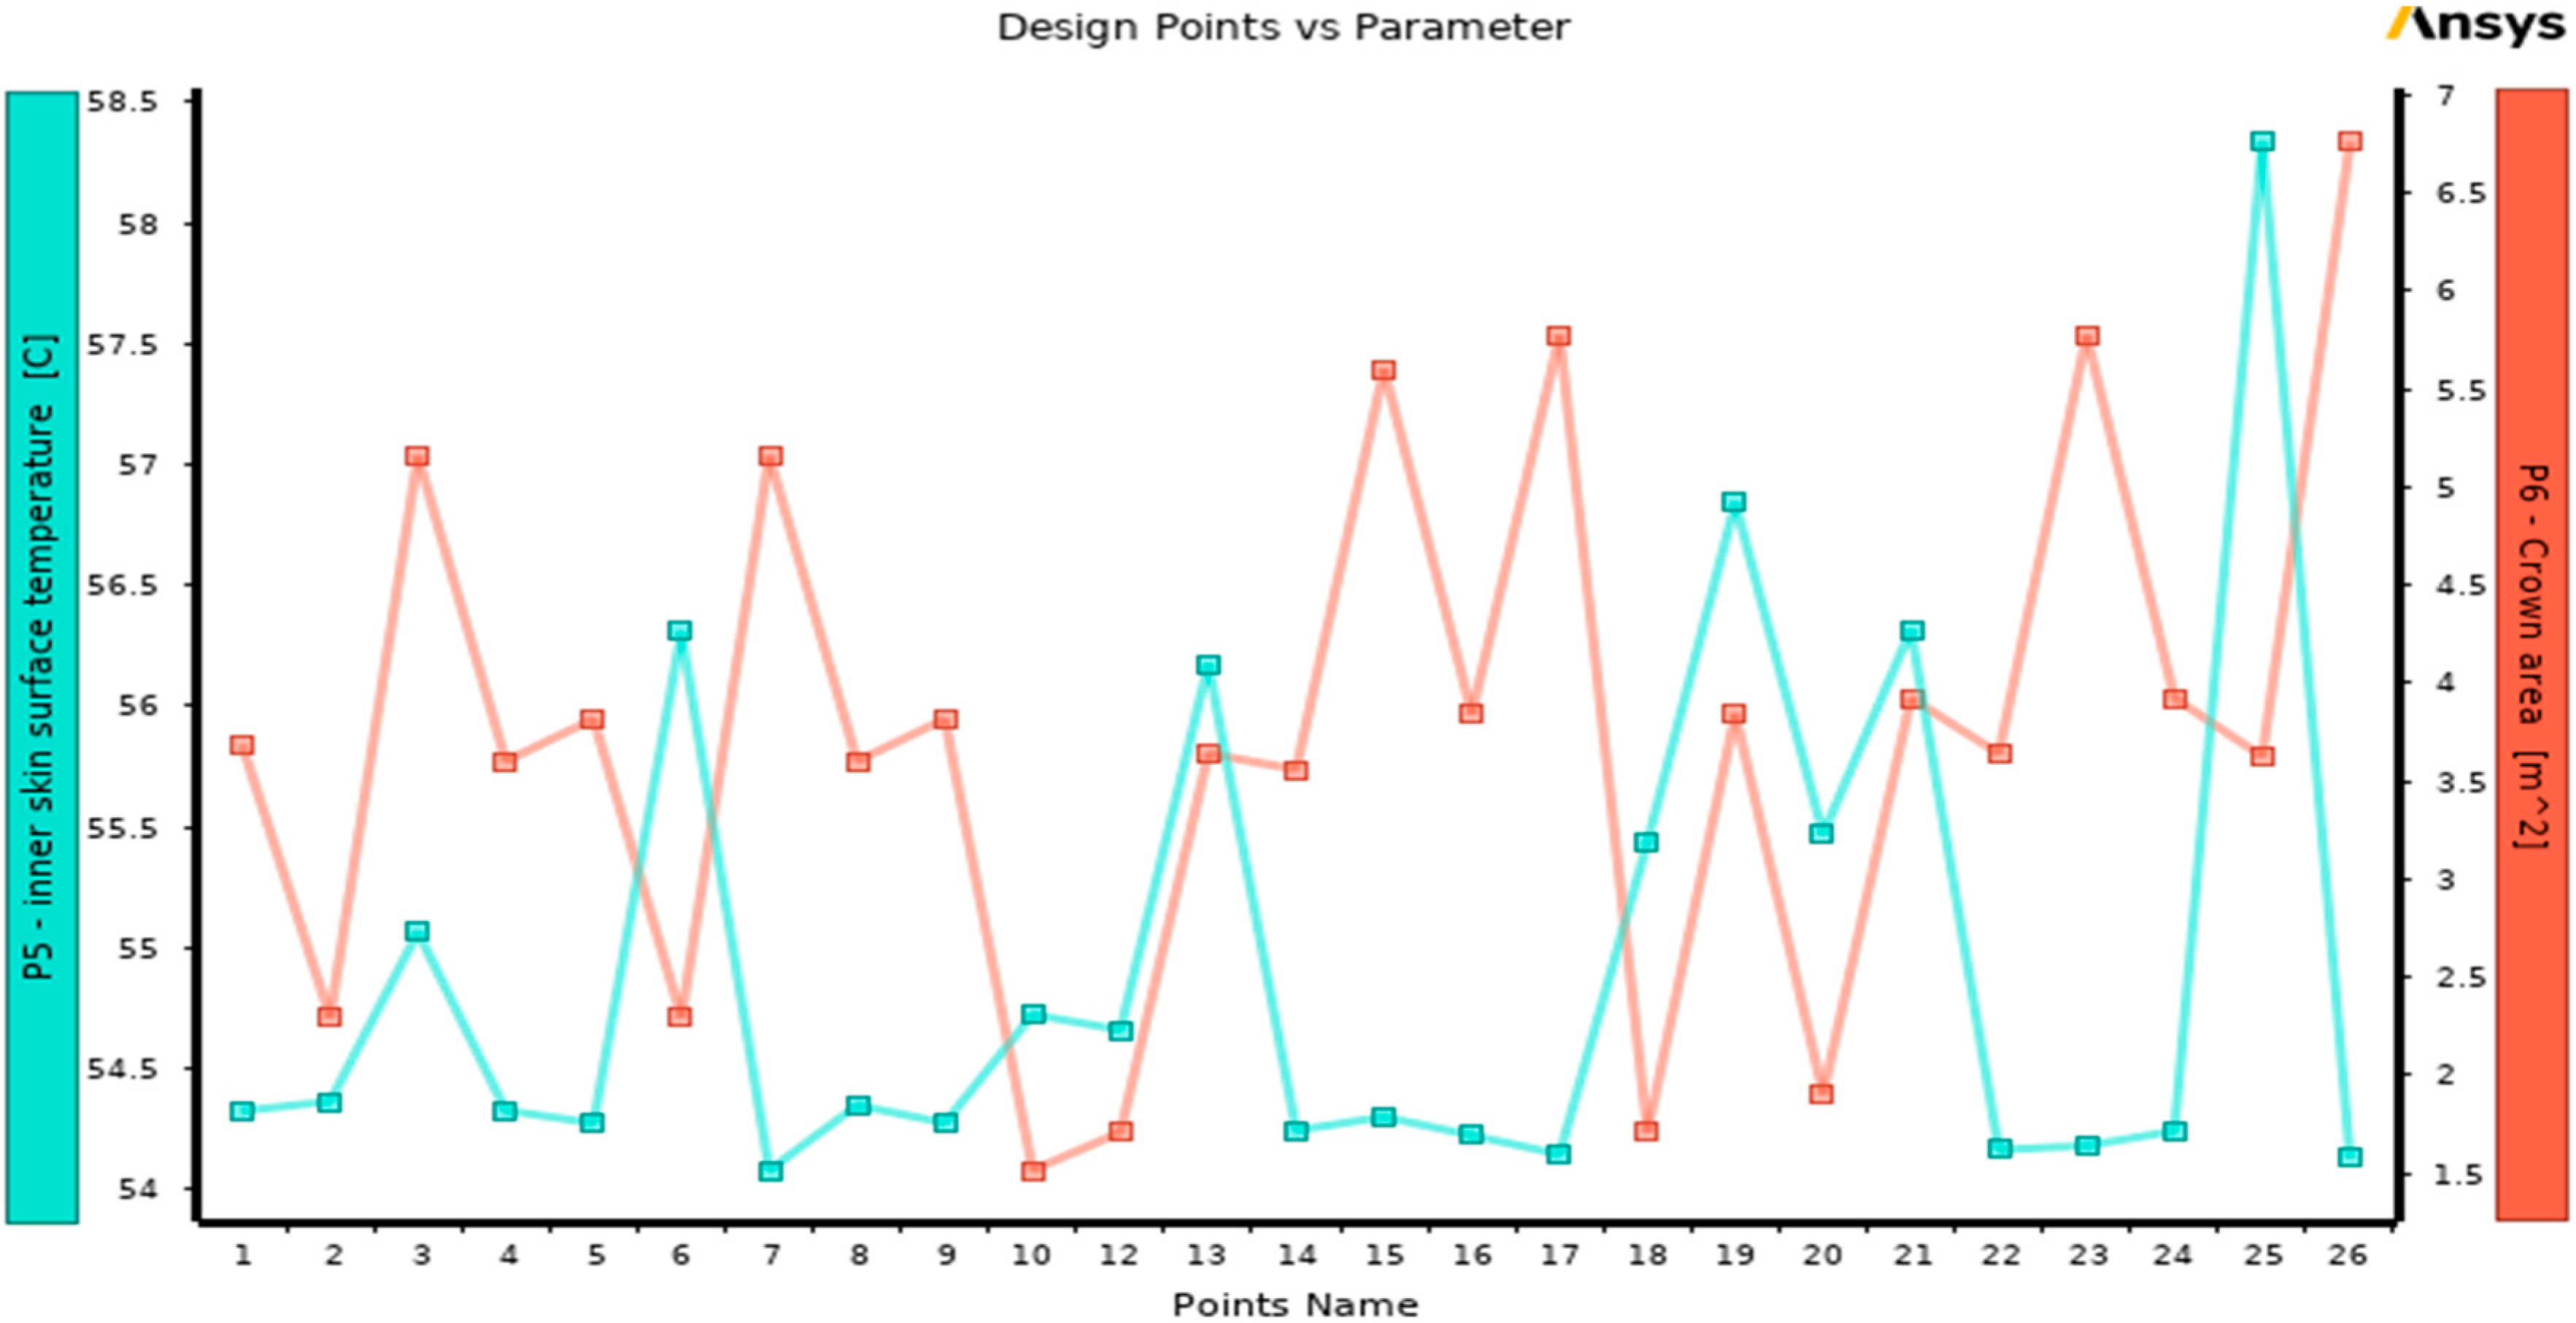
The DOE generated a table with 26 design points; subsequent experiments, or, in this case, CFD simulations, were conducted to obtain results for the defined targets, as seen in
Table 1. The process required an extremely long time because each of the 26 defined design points had to be solved individually in order to calculate the output parameters result. The phrase “crown area” in the table represents the total surface area of the raised top mound from all four sides, without the entire surface of the opaque ventilated façade.
Figure 5 is a graph demonstrating the relationship between design points and output parameters. Each design point on the lower horizontal
x-axis is accompanied by a range of values on the right and left y-axes, which reflect the inner skin surface temperature and crown area.
2.3. Response Surfaces
The next step to perform the optimization process after the DOE is to use the response surface method. The response surface method uses machine learning algorithms for obtaining a mathematical function that is capable of accurately predicting the behavior of a system as a result of variations in its input parameters. Without performing a full solution, it instantly provides approximations of the output parameters throughout the design space based on the results of the 26 design points that were generated during the DOE step. The accuracy of a response surface is dependent upon several factors, including the complexity of the variables in the solution, the number of points in the initial DOE table, and the type of response surface employed. When it comes to the response surface type, the genetic aggregation algorithm is the one that is used by default. In this research, the genetic aggregation algorithm was employed because it is an automated method that selects, customizes, and generates the best suitable response surface for each output parameter. It is important to note that the machine learning capabilities used in this study are based on the built-in surrogate modeling tools provided by Ansys DesignXplorer. These tools employ automated algorithms, such as the genetic aggregation method, to generate response surface models from the DOE data. However, Ansys does not provide detailed access to the internal structure of the machine learning models or training metrics. As a result, information such as root mean square error (RMSE), training versus testing performance, number of epochs, or hyperparameter tuning processes is not available to the user. In this context, the machine learning functionality serves as a streamlined and efficient means of accelerating CFD-driven design exploration, rather than a fully customizable or transparent machine learning framework.
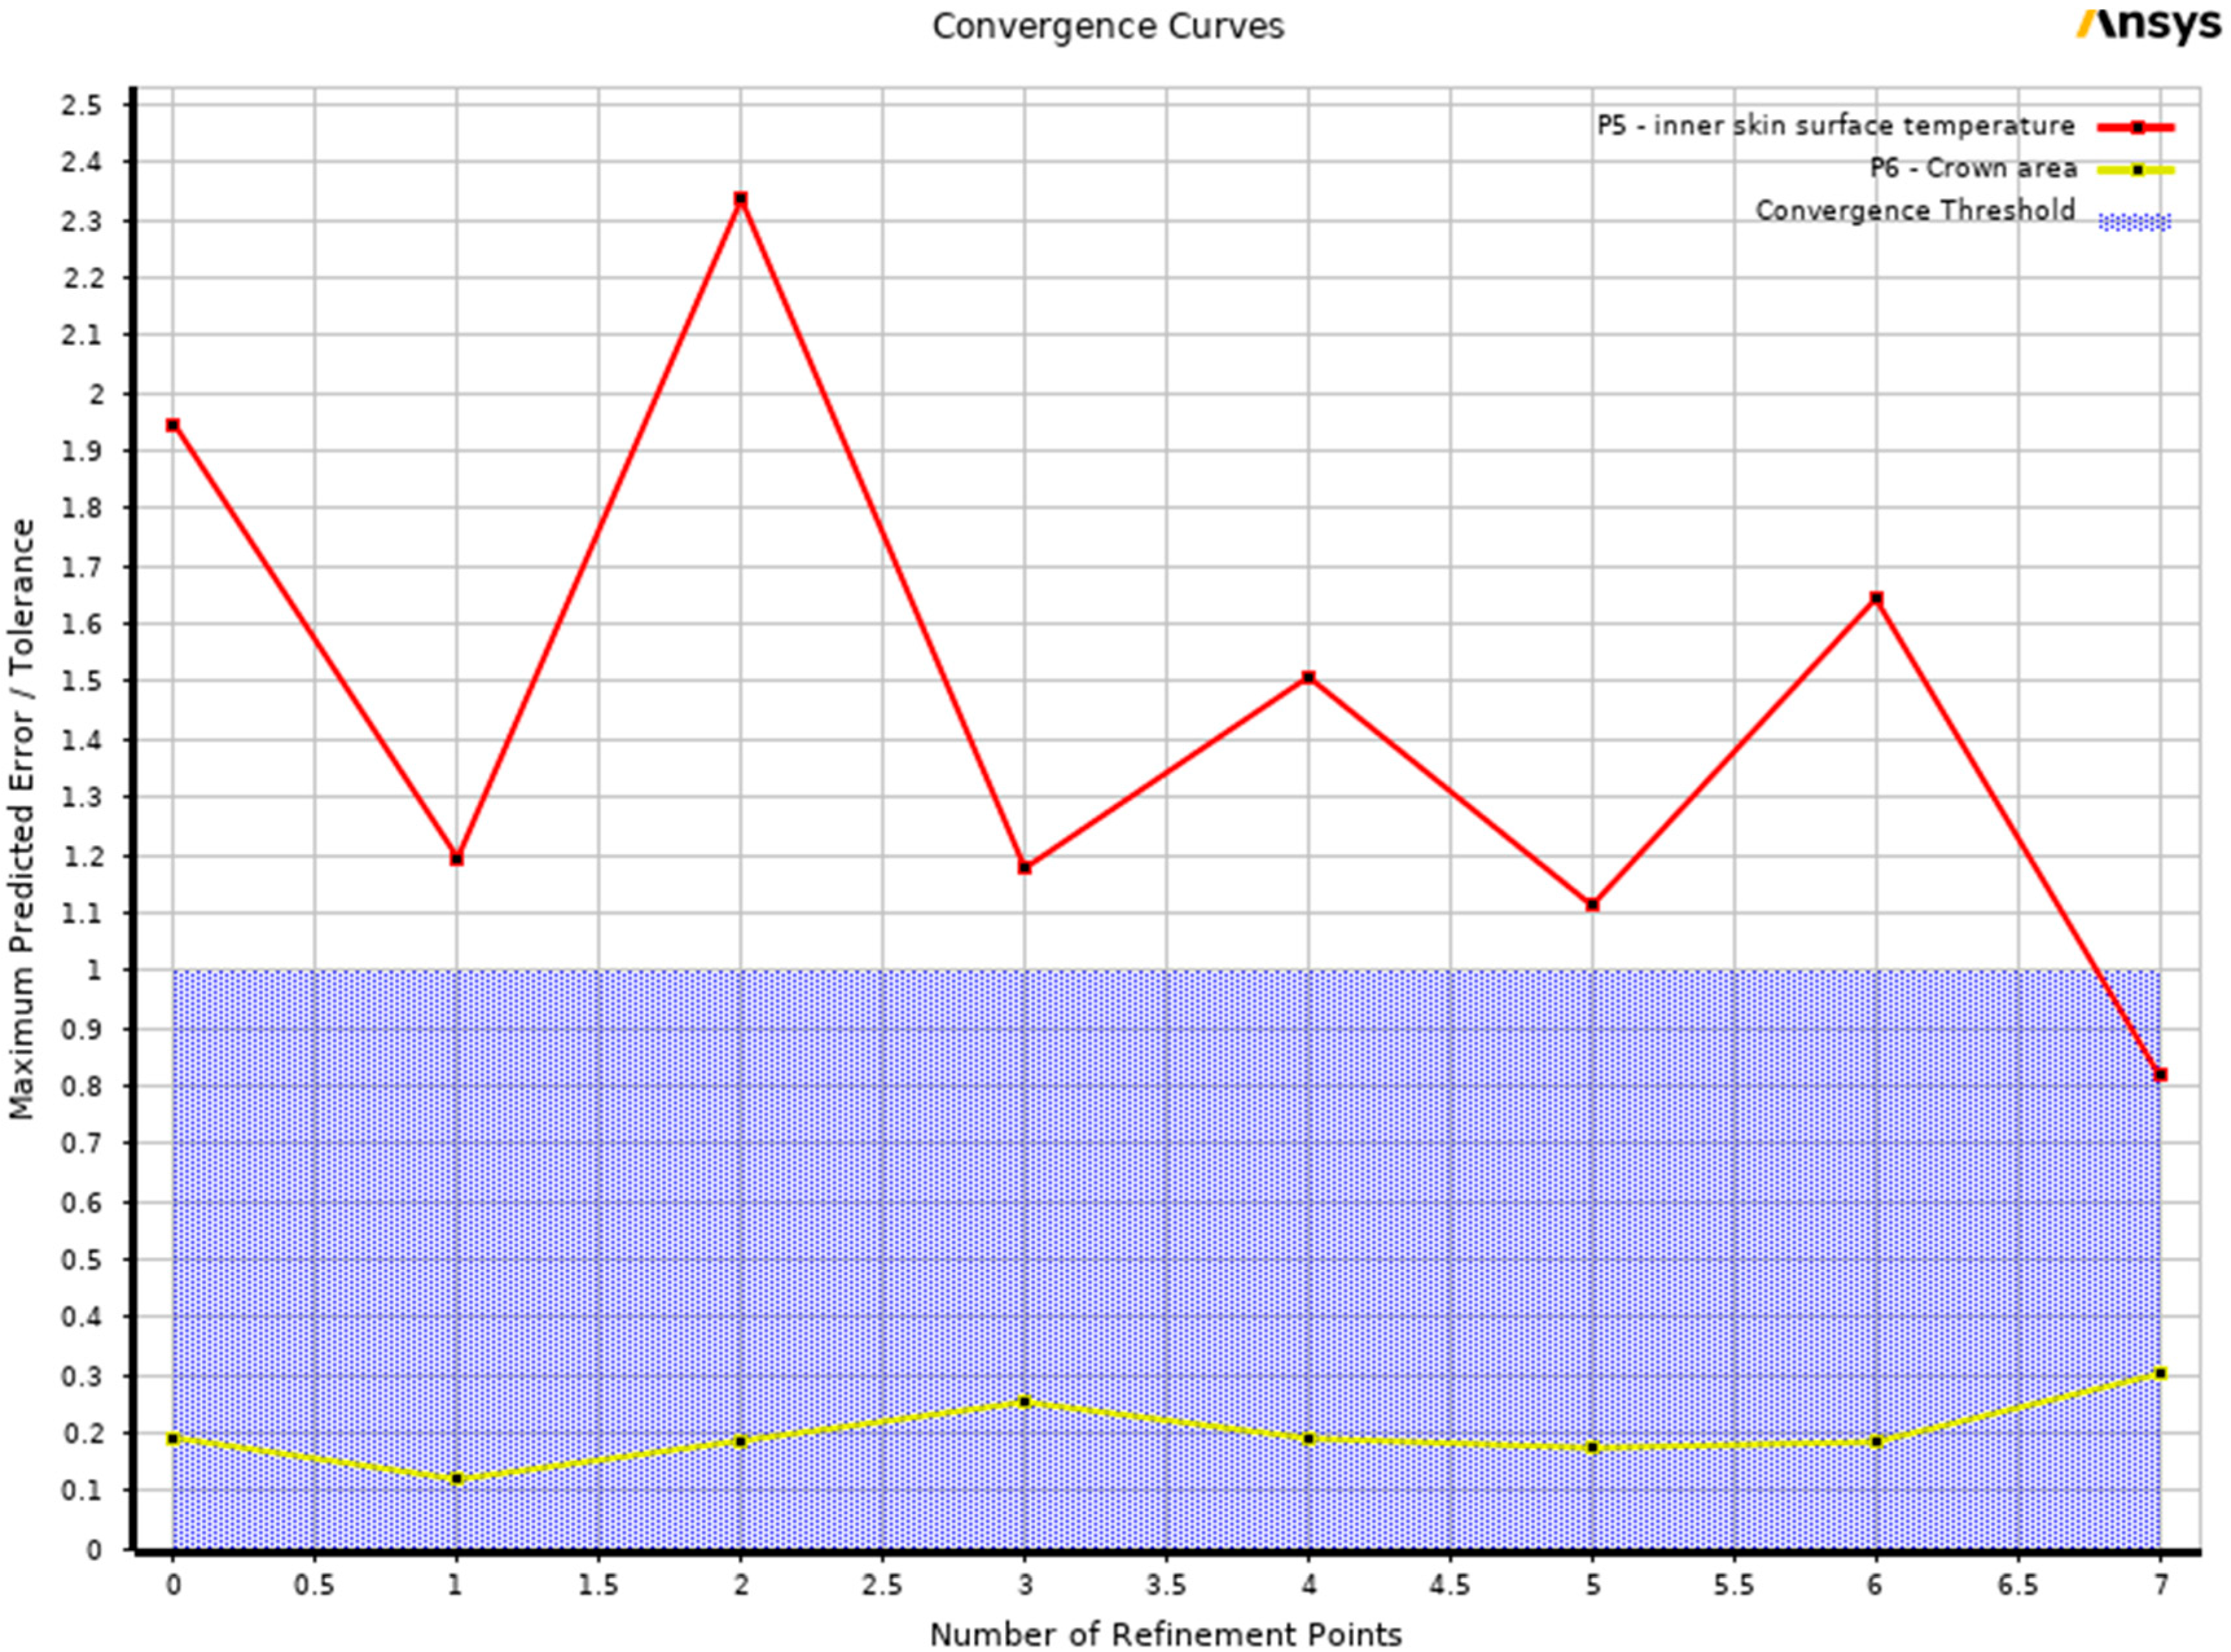
After generating the response surface, the goodness of fit for each output parameter was evaluated to determine whether the answer was satisfactory. The results demonstrated a reasonable correlation between the predicted values and the simulated design points; however, the maximum predicted error value of the average inner skin surface temperature was 0.5 °C, which is greater than what was expected. As a result, additional simulations were carried out by making refinement points, which are design points added to enrich and improve the predicted values of the response surface.
Automatically, refinement points are added, and when each point is completely solved, the maximum predicted error value is updated until each output parameter’s tolerance value is met. For the average inner skin surface temperature and the crown surface area, the identified tolerance value target was set at 0.3 °C and 0.1 m
2, respectively. As shown in
Figure 6 and
Table 2, the refinement process created seven design points until the target was reached with maximum predicted error values of the average inner skin surface temperature and the crown area of 0.24 °C and 0.03 m
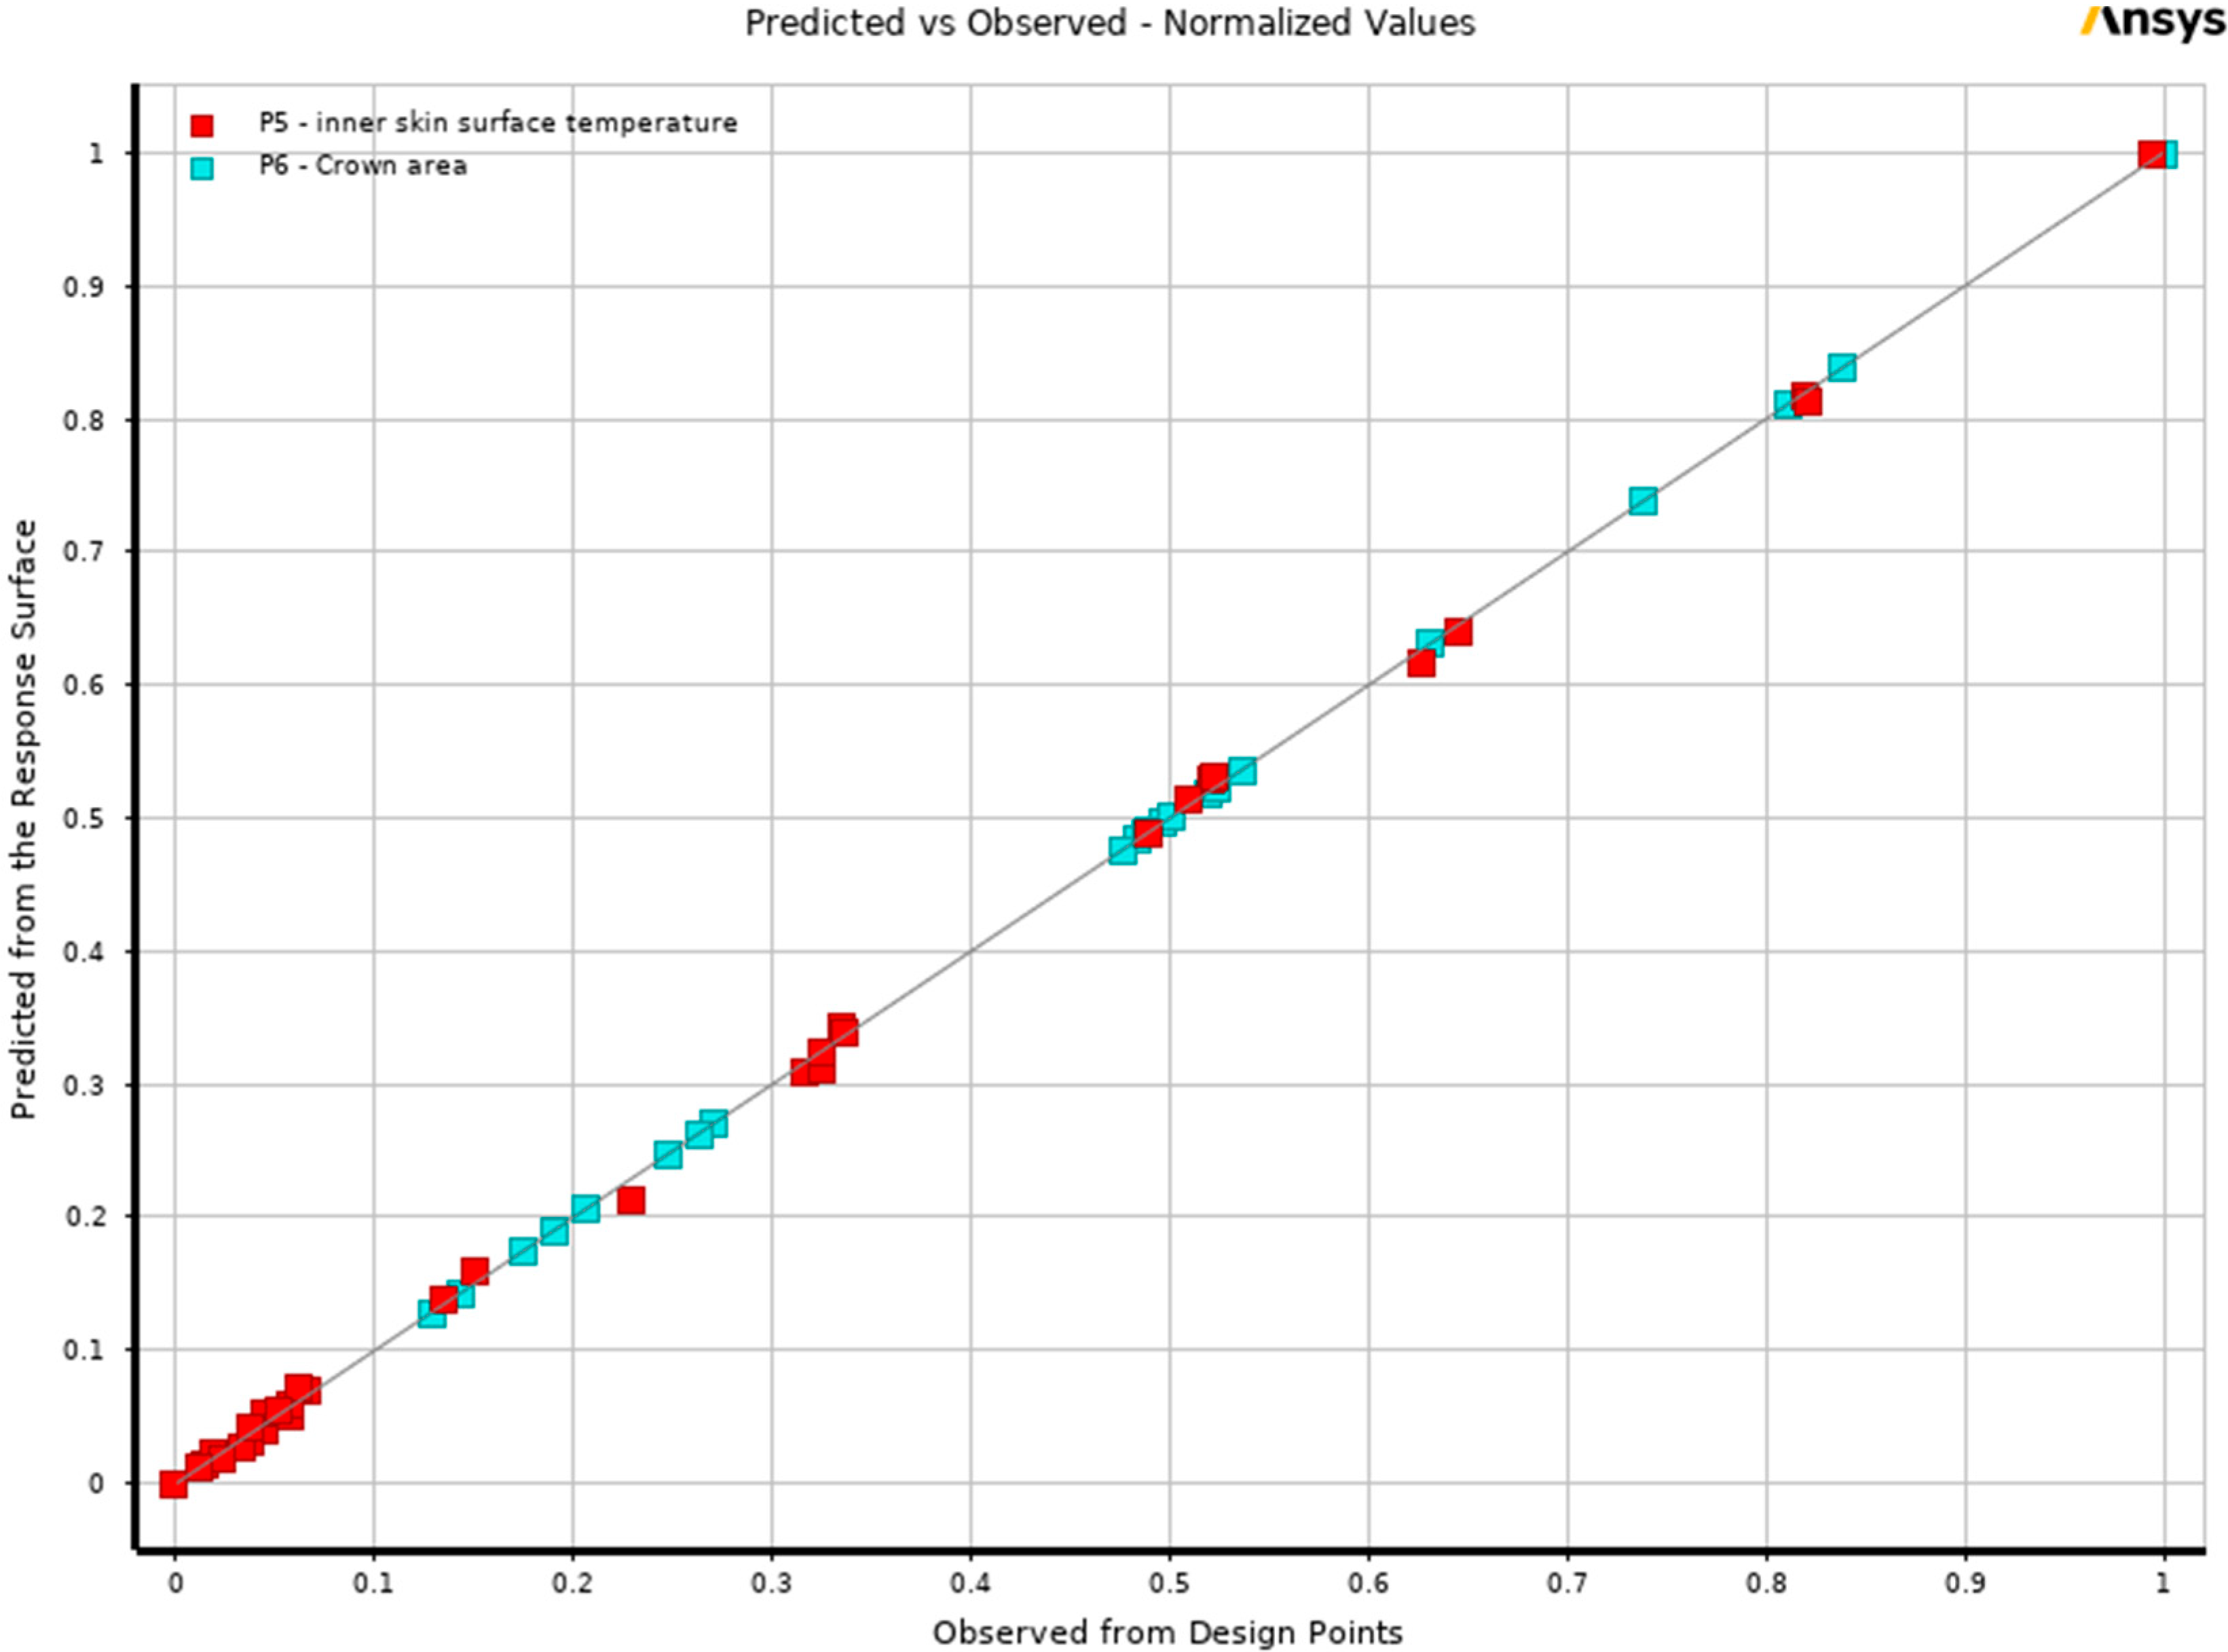
2, respectively. As a result,
Figure 7 demonstrates how the predicted and observed points are in excellent agreement, indicating that it is possible to assume that the data obtained would provide the best values possible for each output parameter based on the inputs.
Selecting Min-Max search in the Outline pane after the response surface has been updated displays the sample points, which represent the minimum and maximum values determined for each output parameter in the response surface database. The Min-Max search algorithm analyzes the complete range of output parameters inside the response surface in order to estimate the minimum and maximum values associated with each parameter. Within the design space, there is a variation of 5.08 °C between the lowest possible average inner skin surface temperature and the highest possible temperature. Regarding the crown area, the difference is 6.27 m
2 between the smallest and largest possible designs, as displayed in
Table 3. Both output parameters have large ranges, but the crown area is exceptionally extreme, with a range of more than 10 times the area of the minimum design point. Thus, finding the trade-off between the output parameters to achieve the correct balance is very important in this study.
The design space can be explored more easily with response surface charts, which show visually how different parameters affect each other. There are four charts available: the Spider chart, the Response chart, the Local Sensitivity chart, and the Local Sensitivity Curves chart. When a response surface is modified, one response point and one of each chart type are automatically generated. There is no limit to the number of response points and charts that can be explored. To begin understanding and exploring the effect of parameters on one another, the response point was set to the same dimensions as the original wide mound solution, which is 0.3 m for front and back height and 0.07 m for front and back width.
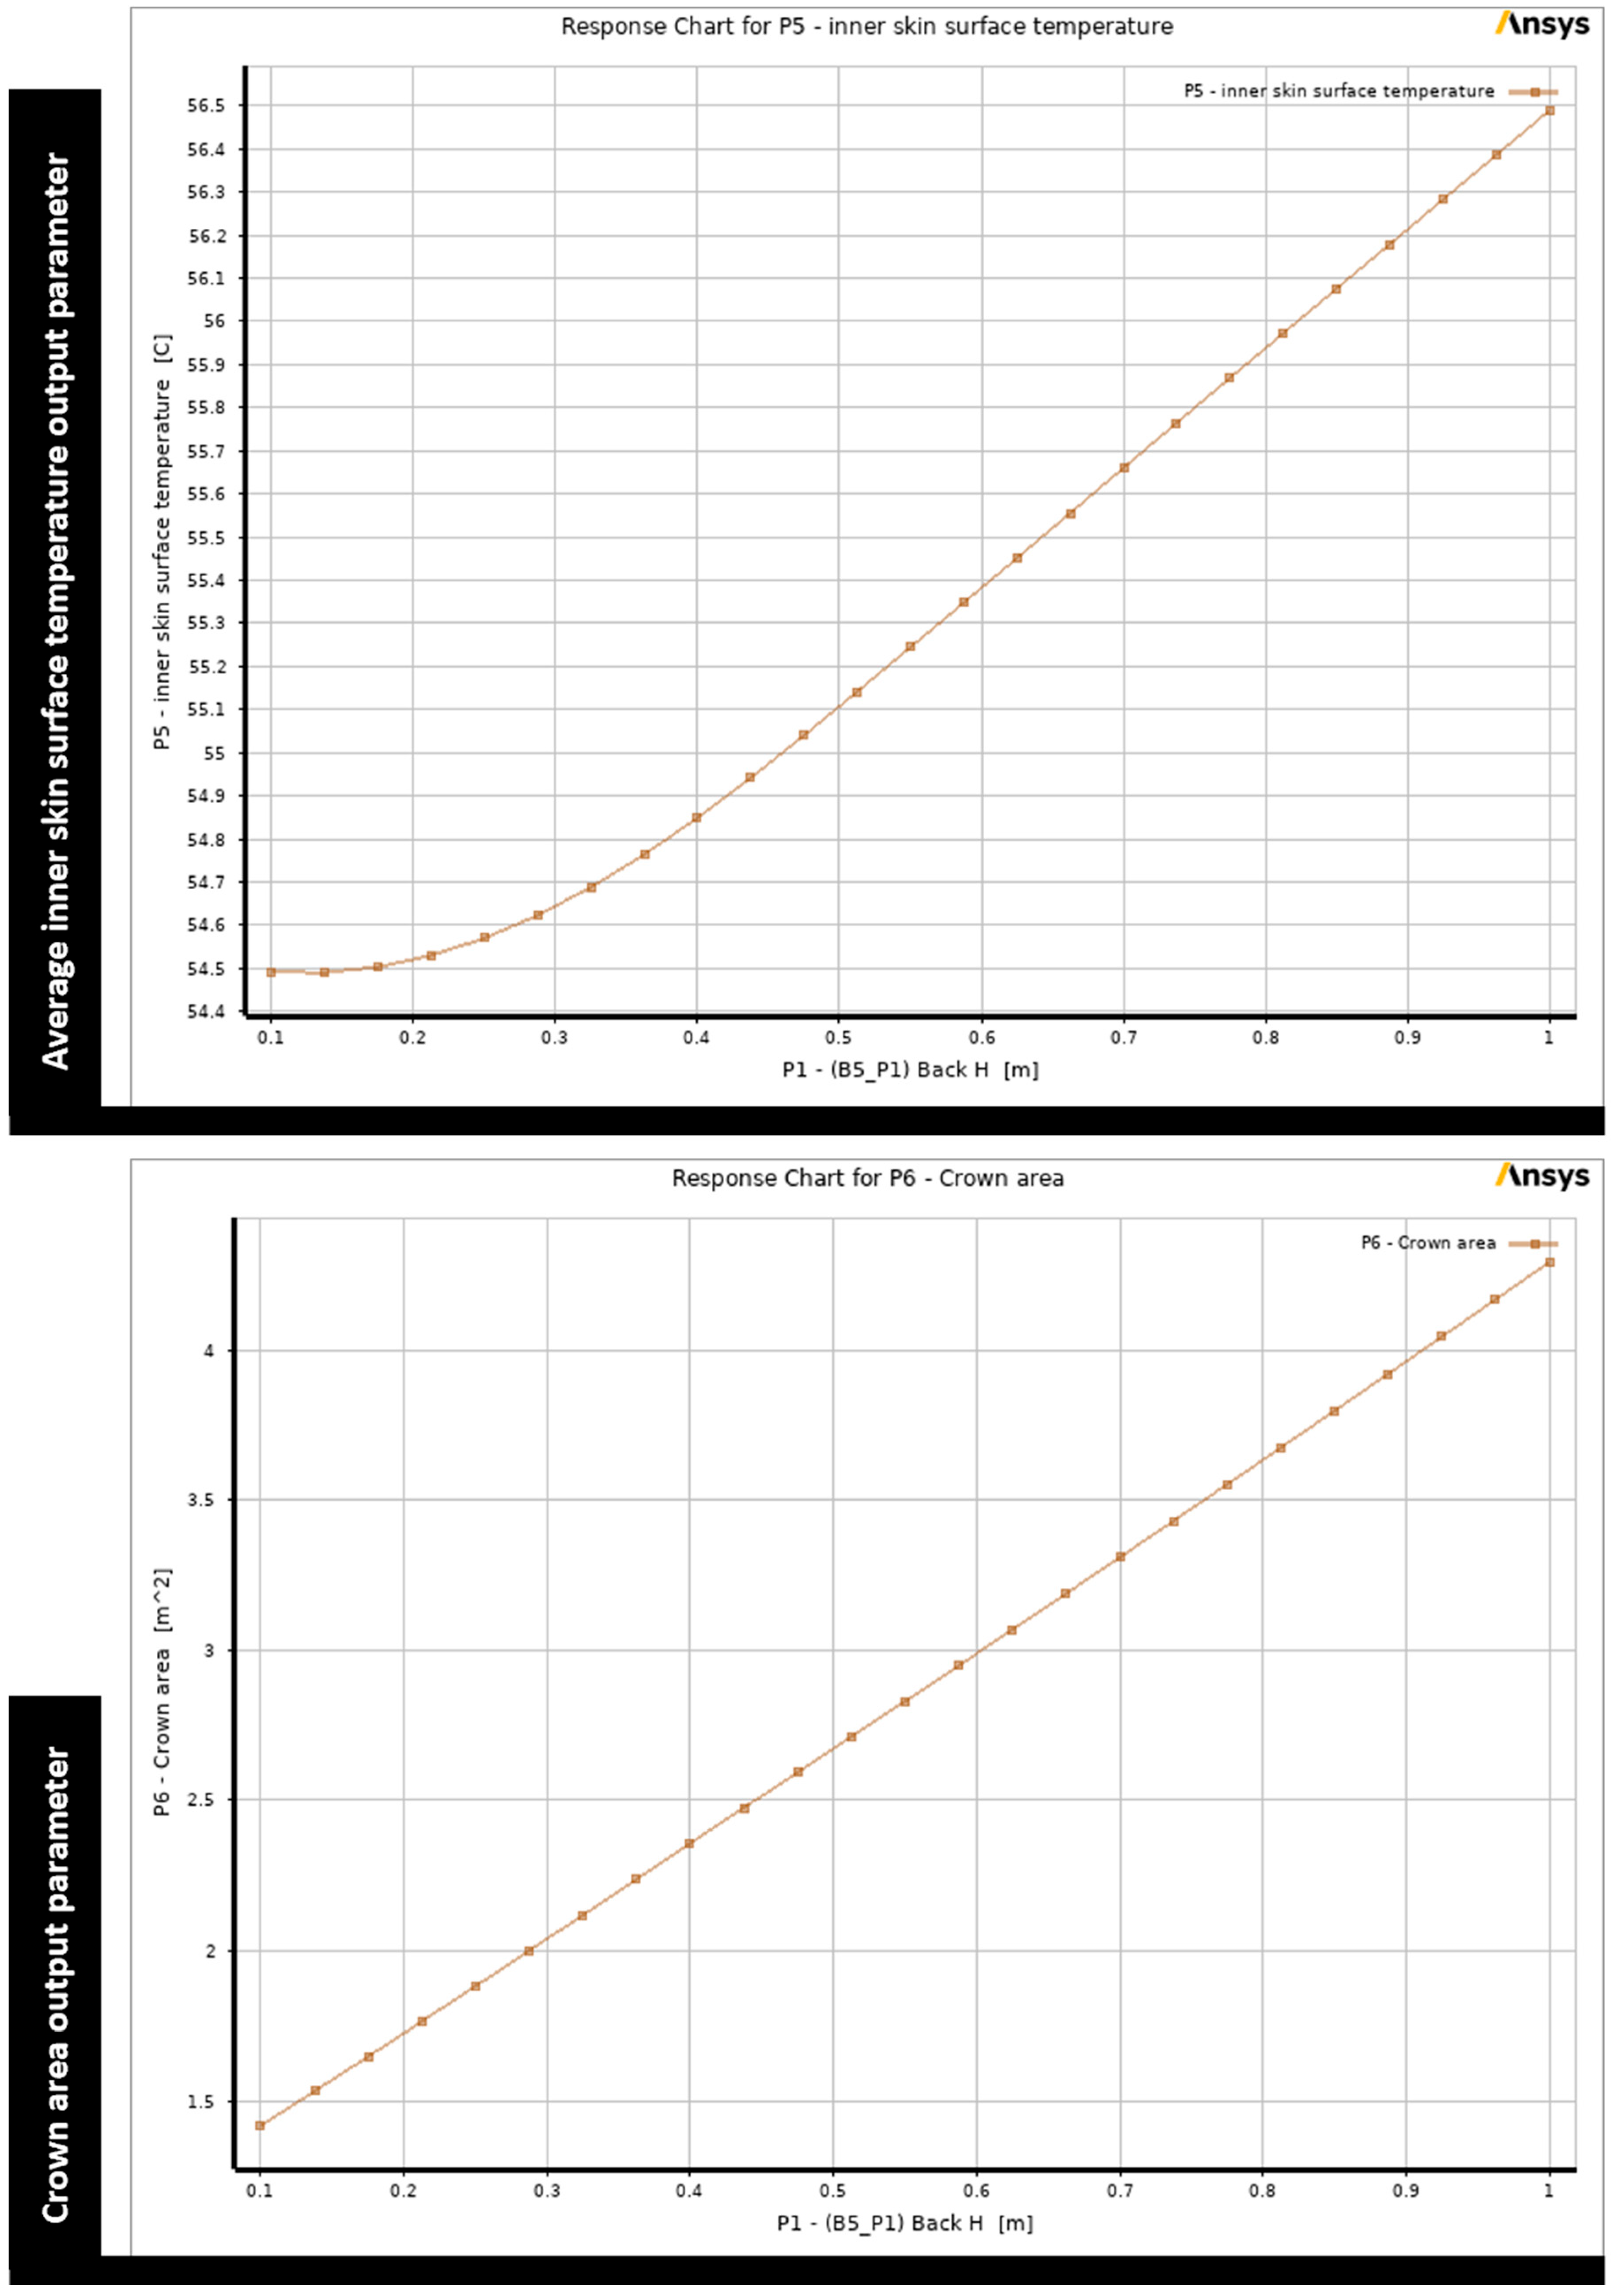
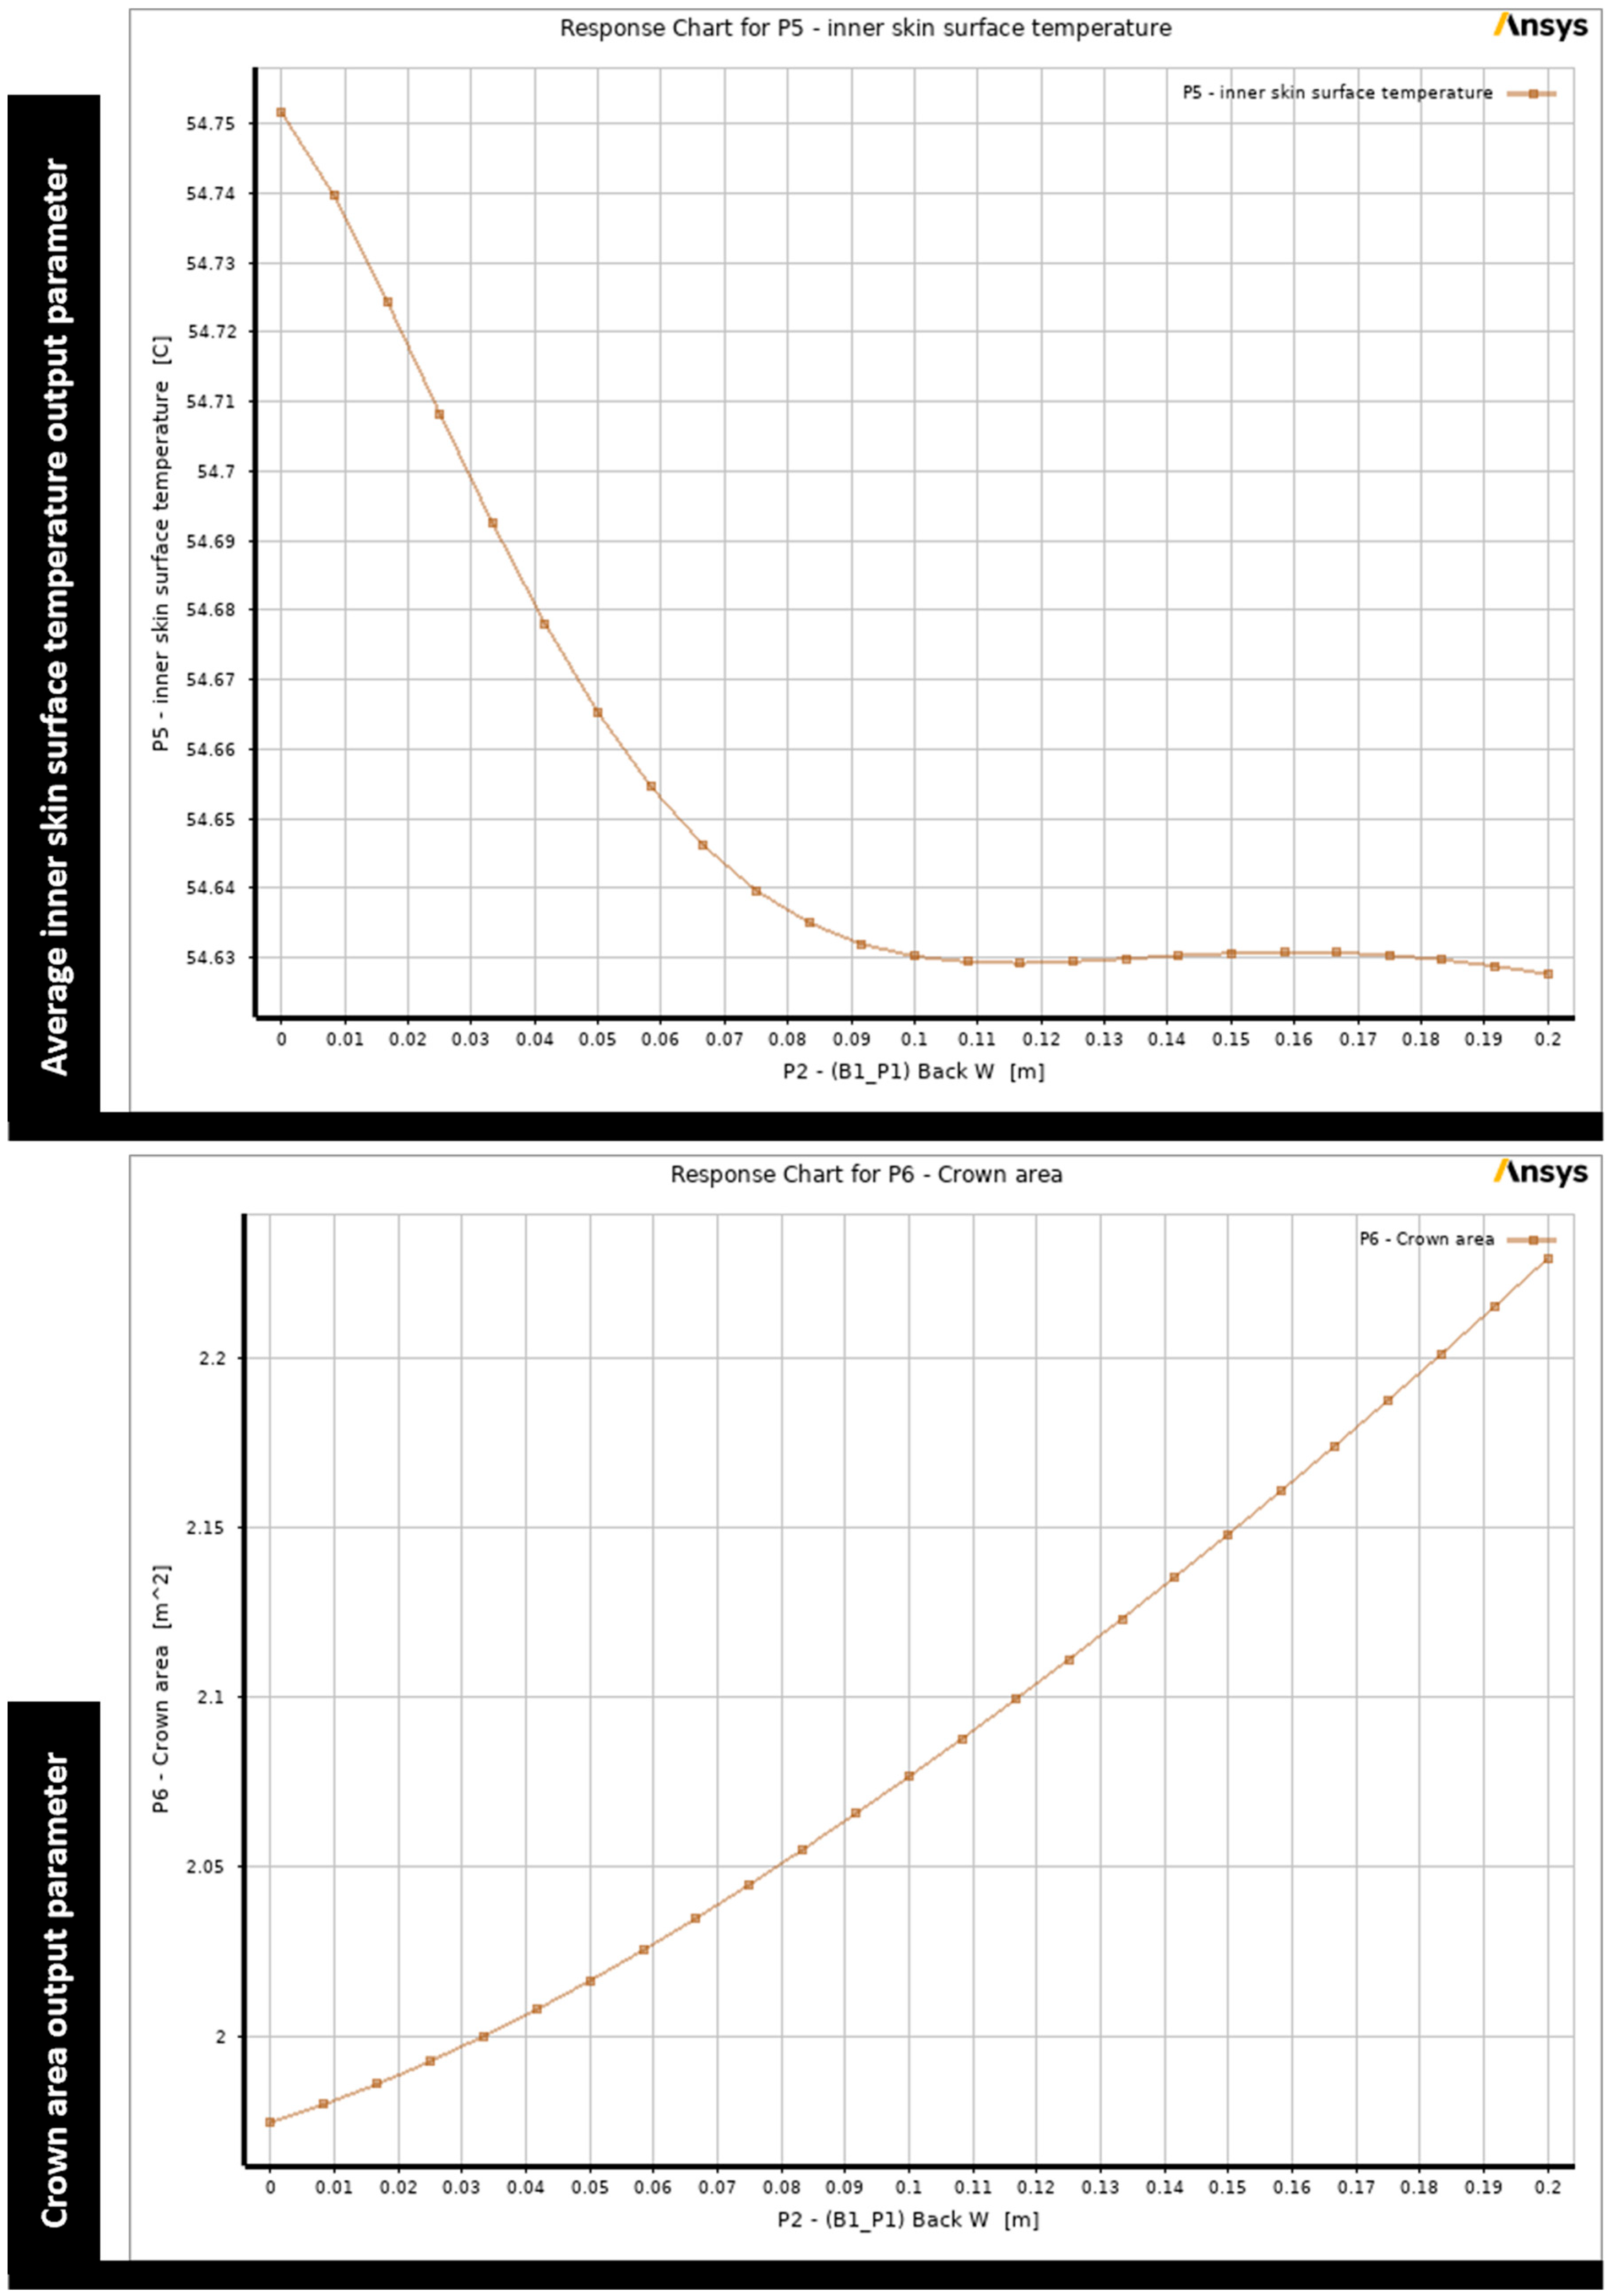
The response surface charts generated in response to the original wide mound design point reveal some interesting findings. Regarding the back height, both the inner skin surface temperature and the crown area indicate that in order to minimize them, the height of the back face should not exceed 0.2 m, as can be seen in
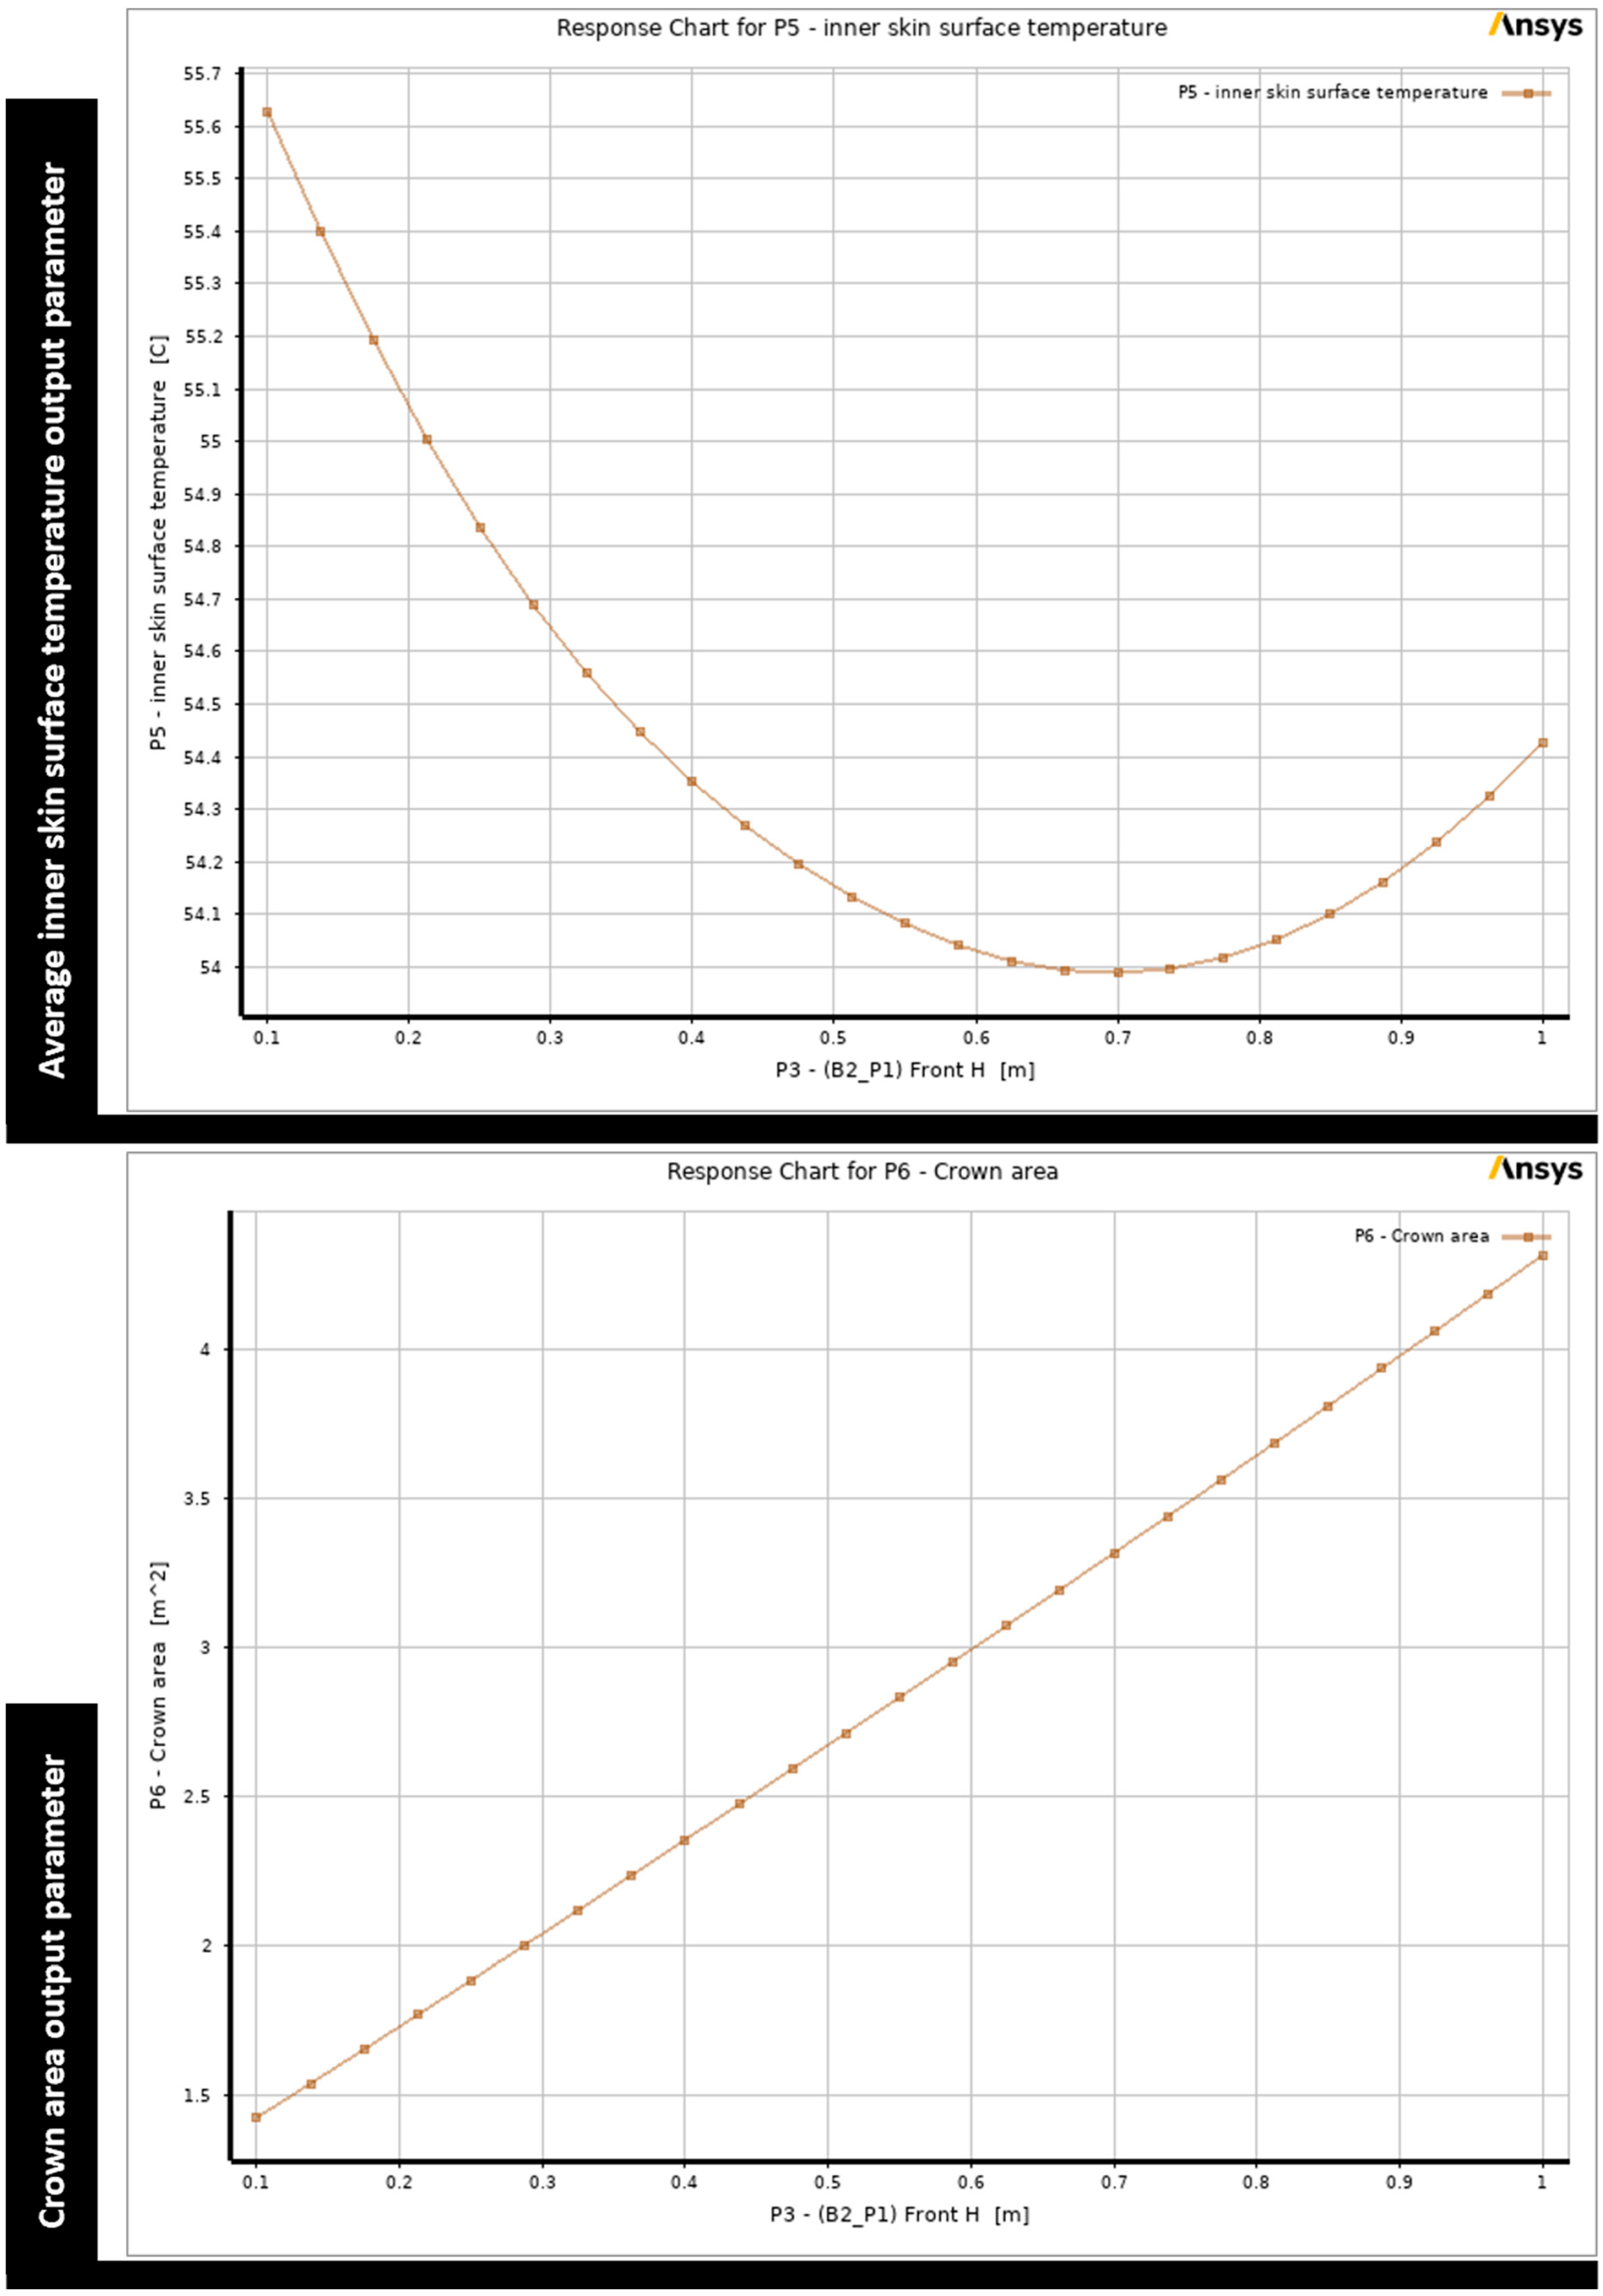
Figure 8, which displays two-dimensional contour graphs that provide a visual representation of the impact of changes in the back height parameter on each output parameter. Consequently, in the next optimization step, the allowable range of values for the back face height parameter is limited to 0.1 m to 0.2 m, rather than 1 m. The design space range is kept the same for the optimization step for the back width and front height parameters since these parameters demonstrate an opposite influence between the output parameters, which means minimizing one output parameter leads to maximizing the other, as illustrated in
Figure 9 and
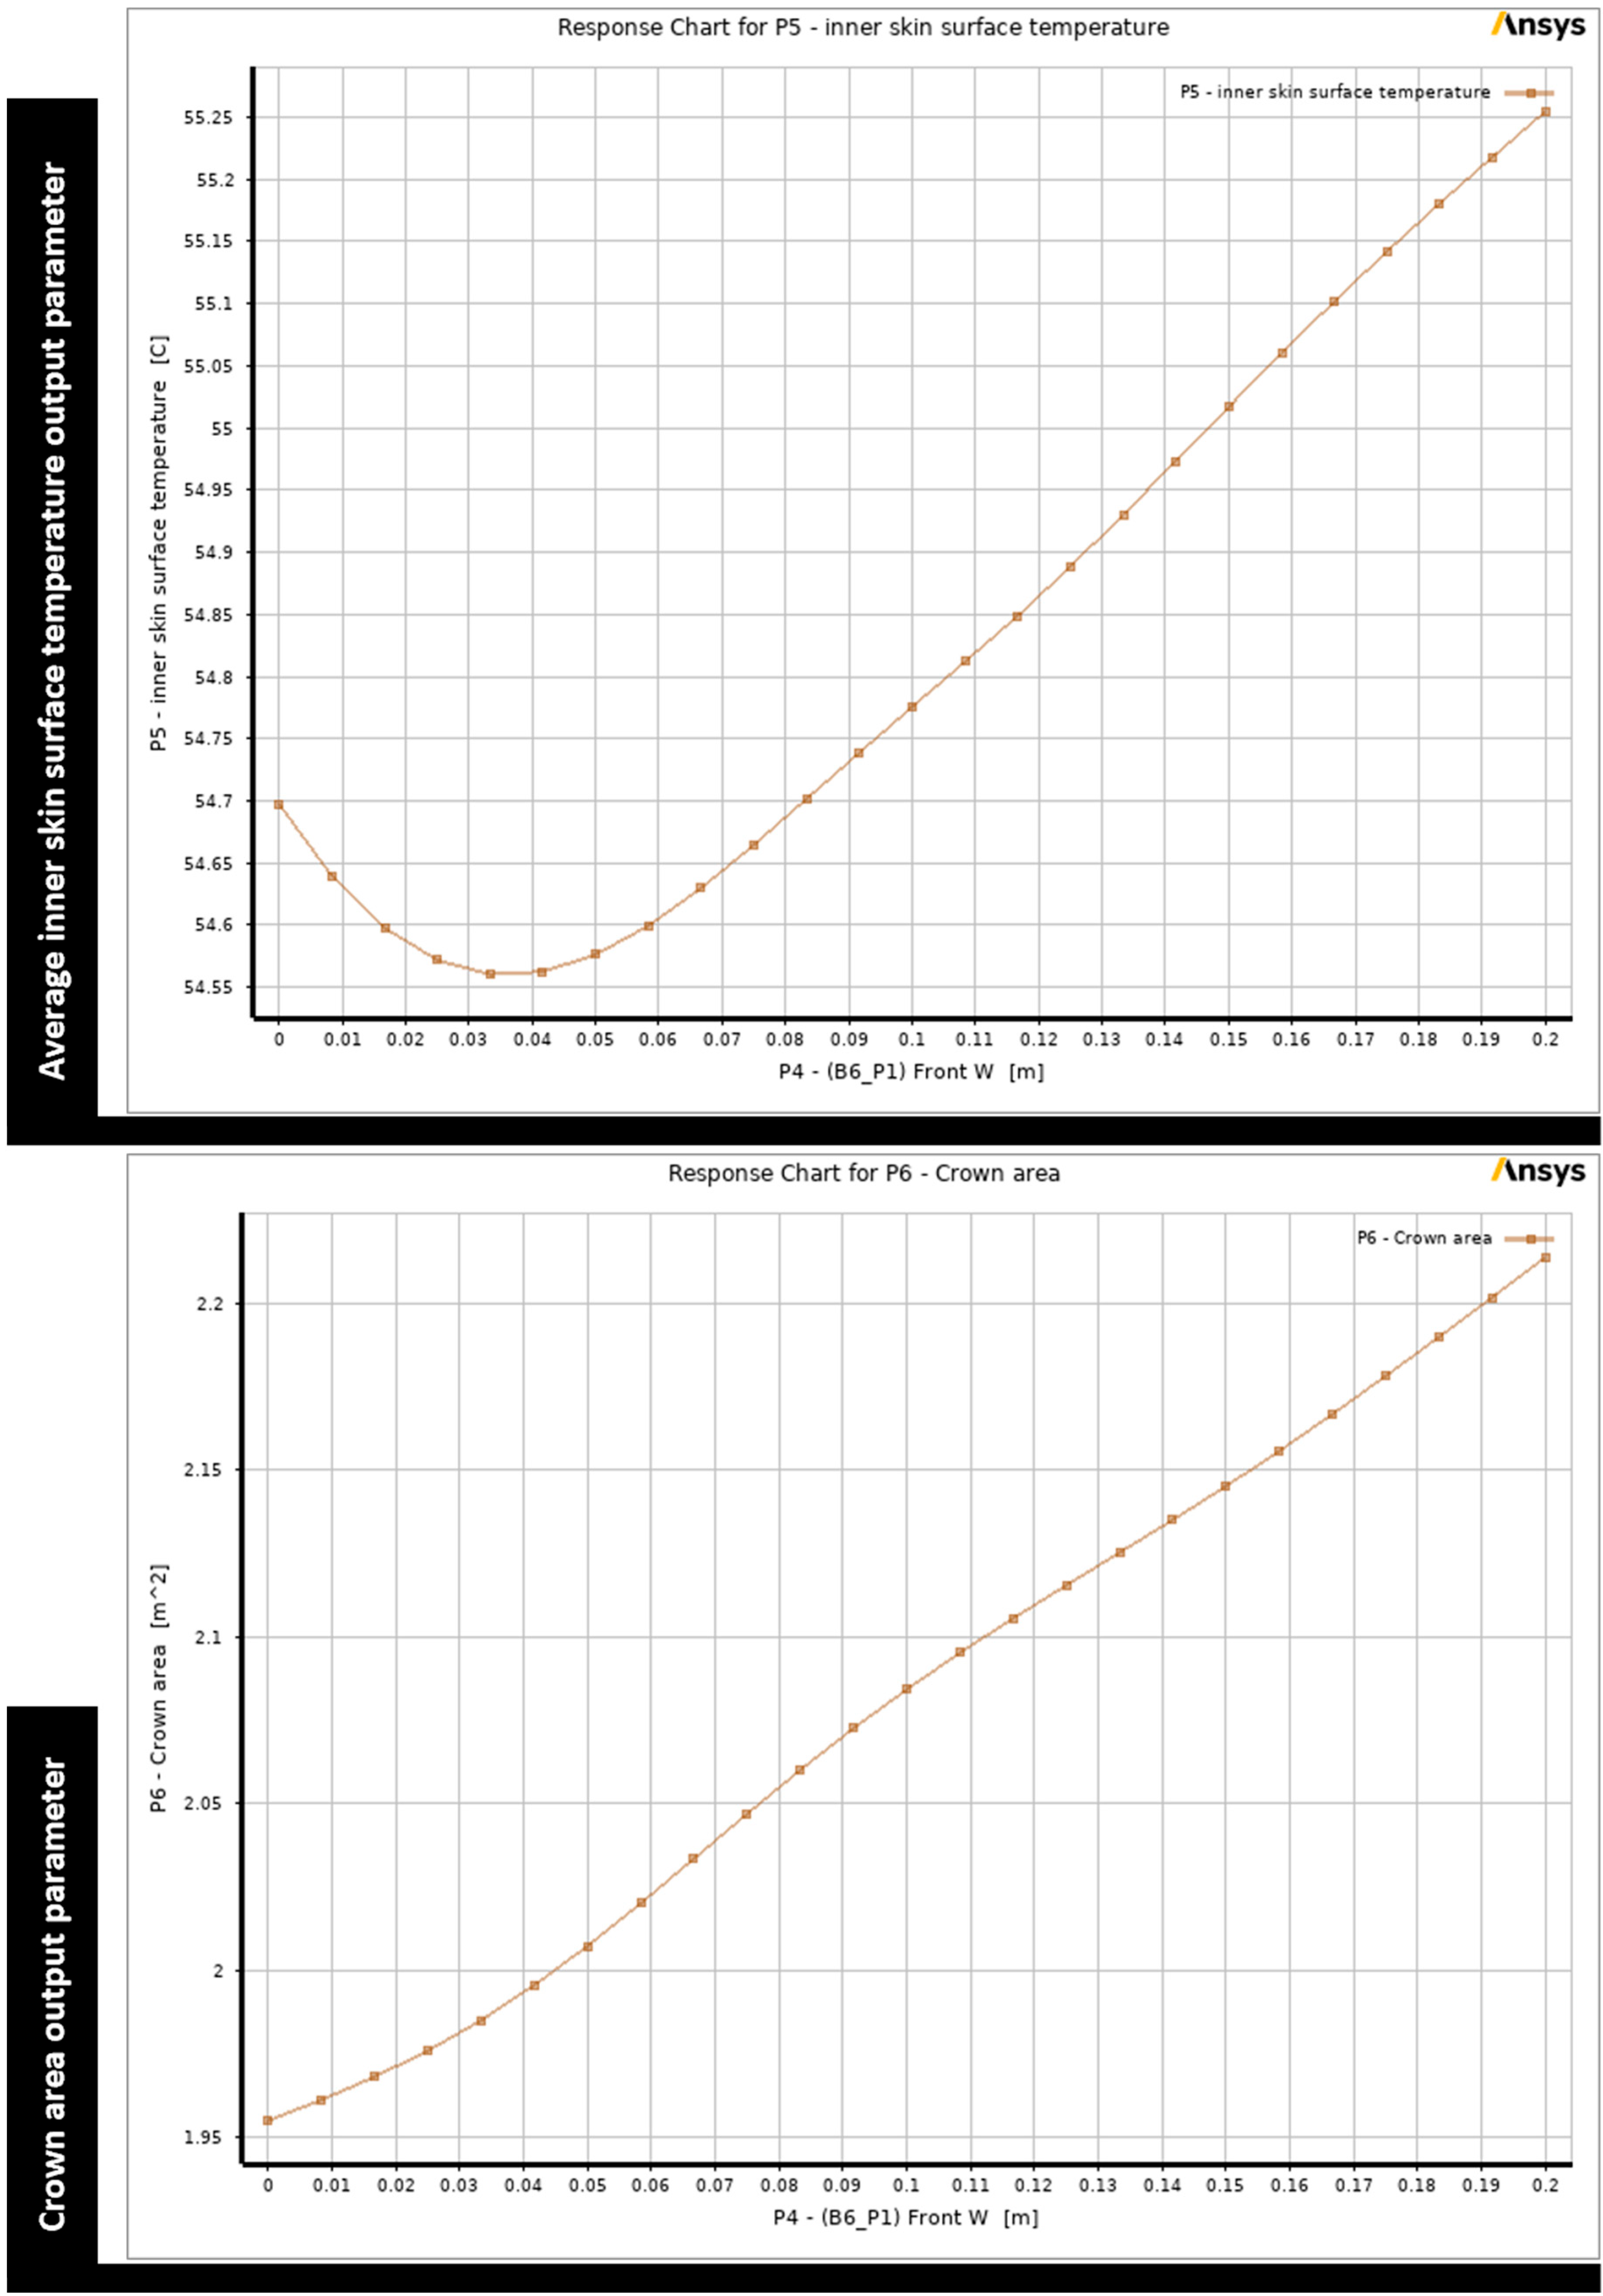
Figure 10. Regarding the front width parameter, the range is constrained to be between 0 and 0.04 m, as the minimal values for both output parameters fell within this range, as displayed in
Figure 11.
2.4. Goal-Driven Optimization
Goal-driven optimization refers to a combination of strategies used to optimize several objectives while considering constraints. These techniques aim to identify the most optimal designs from a given sample set, based on predefined goals established for the parameters. Response surface optimization and direct optimization are two different types of goal-driven optimization methods that DesignXplorer provides. A response surface optimization system relies on the data from its own response surface cell, and hence its performance is dependent upon the accuracy and quality of the response surface. Screening, Multi-Objective Genetic Algorithm (MOGA), Nonlinear Programming by Quadratic Lagrangian (NLPQL), and Mixed-Integer Sequential Quadratic Programming (MISQP) are the optimization methods that can be used in Ansys [
8]. These optimization techniques all make use of response surface assessments rather than real solves, as is the case in the direct optimization system.
Due to the presence of two objectives or output parameters in this study, only screening and multi-objective genetic algorithm methods are applicable. Screening is commonly employed to identify an initial set of candidate points for a preliminary design; however, a multi-objective genetic algorithm offers a more sophisticated approach compared to the screening method [
8]. Hence, the optimization is carried out using the multi-objective genetic algorithm approach. The multi-objective genetic algorithm employed in goal-driven optimization is a hybrid adaptation of the well-known NSGA-II (Non-dominated Sorted Genetic Algorithm-II) that incorporates controlled elitism principles.
The process of the multi-objective genetic algorithm begins by using the initial population. The second step comes after the first iteration. Each population is run and generates a new population through cross-over and mutation until it meets the number of samples set by the property for the number of samples per iteration. The third step involves updating the design points in the new population. In the fourth step, the optimization is validated to make sure it has converged, and this can be performed by either achieving the allowable Pareto percentage or the convergence stability percentage. If the previous conditions are not met, the procedure proceeds to the fifth step, in which the optimization is assessed to determine if it satisfies the specified stopping criterion. If the task for the maximum number of iterations is met, the procedure is halted before achieving convergence. If not, the procedure iterates steps 2 through 5 and produces a new population until convergence or the specified stopping criteria are achieved. In this study, the number of initial samples, the number of samples per iteration, the maximum allowable Pareto percentage, the convergence stability percentage, and the maximum number of iterations are set to the default value to avoid the process converging prematurely.
To find optimal designs, the optimization cell of a goal-driven optimization system requires the specification of design goals in the form of objectives and constraints. The objective type of both output parameters has been specified to be minimized with a target that is lower than the initial wide mound solution. The target average temperature for the inner skin surface was set at 54.0 °C, while the area of the crown was set at 1.2 m
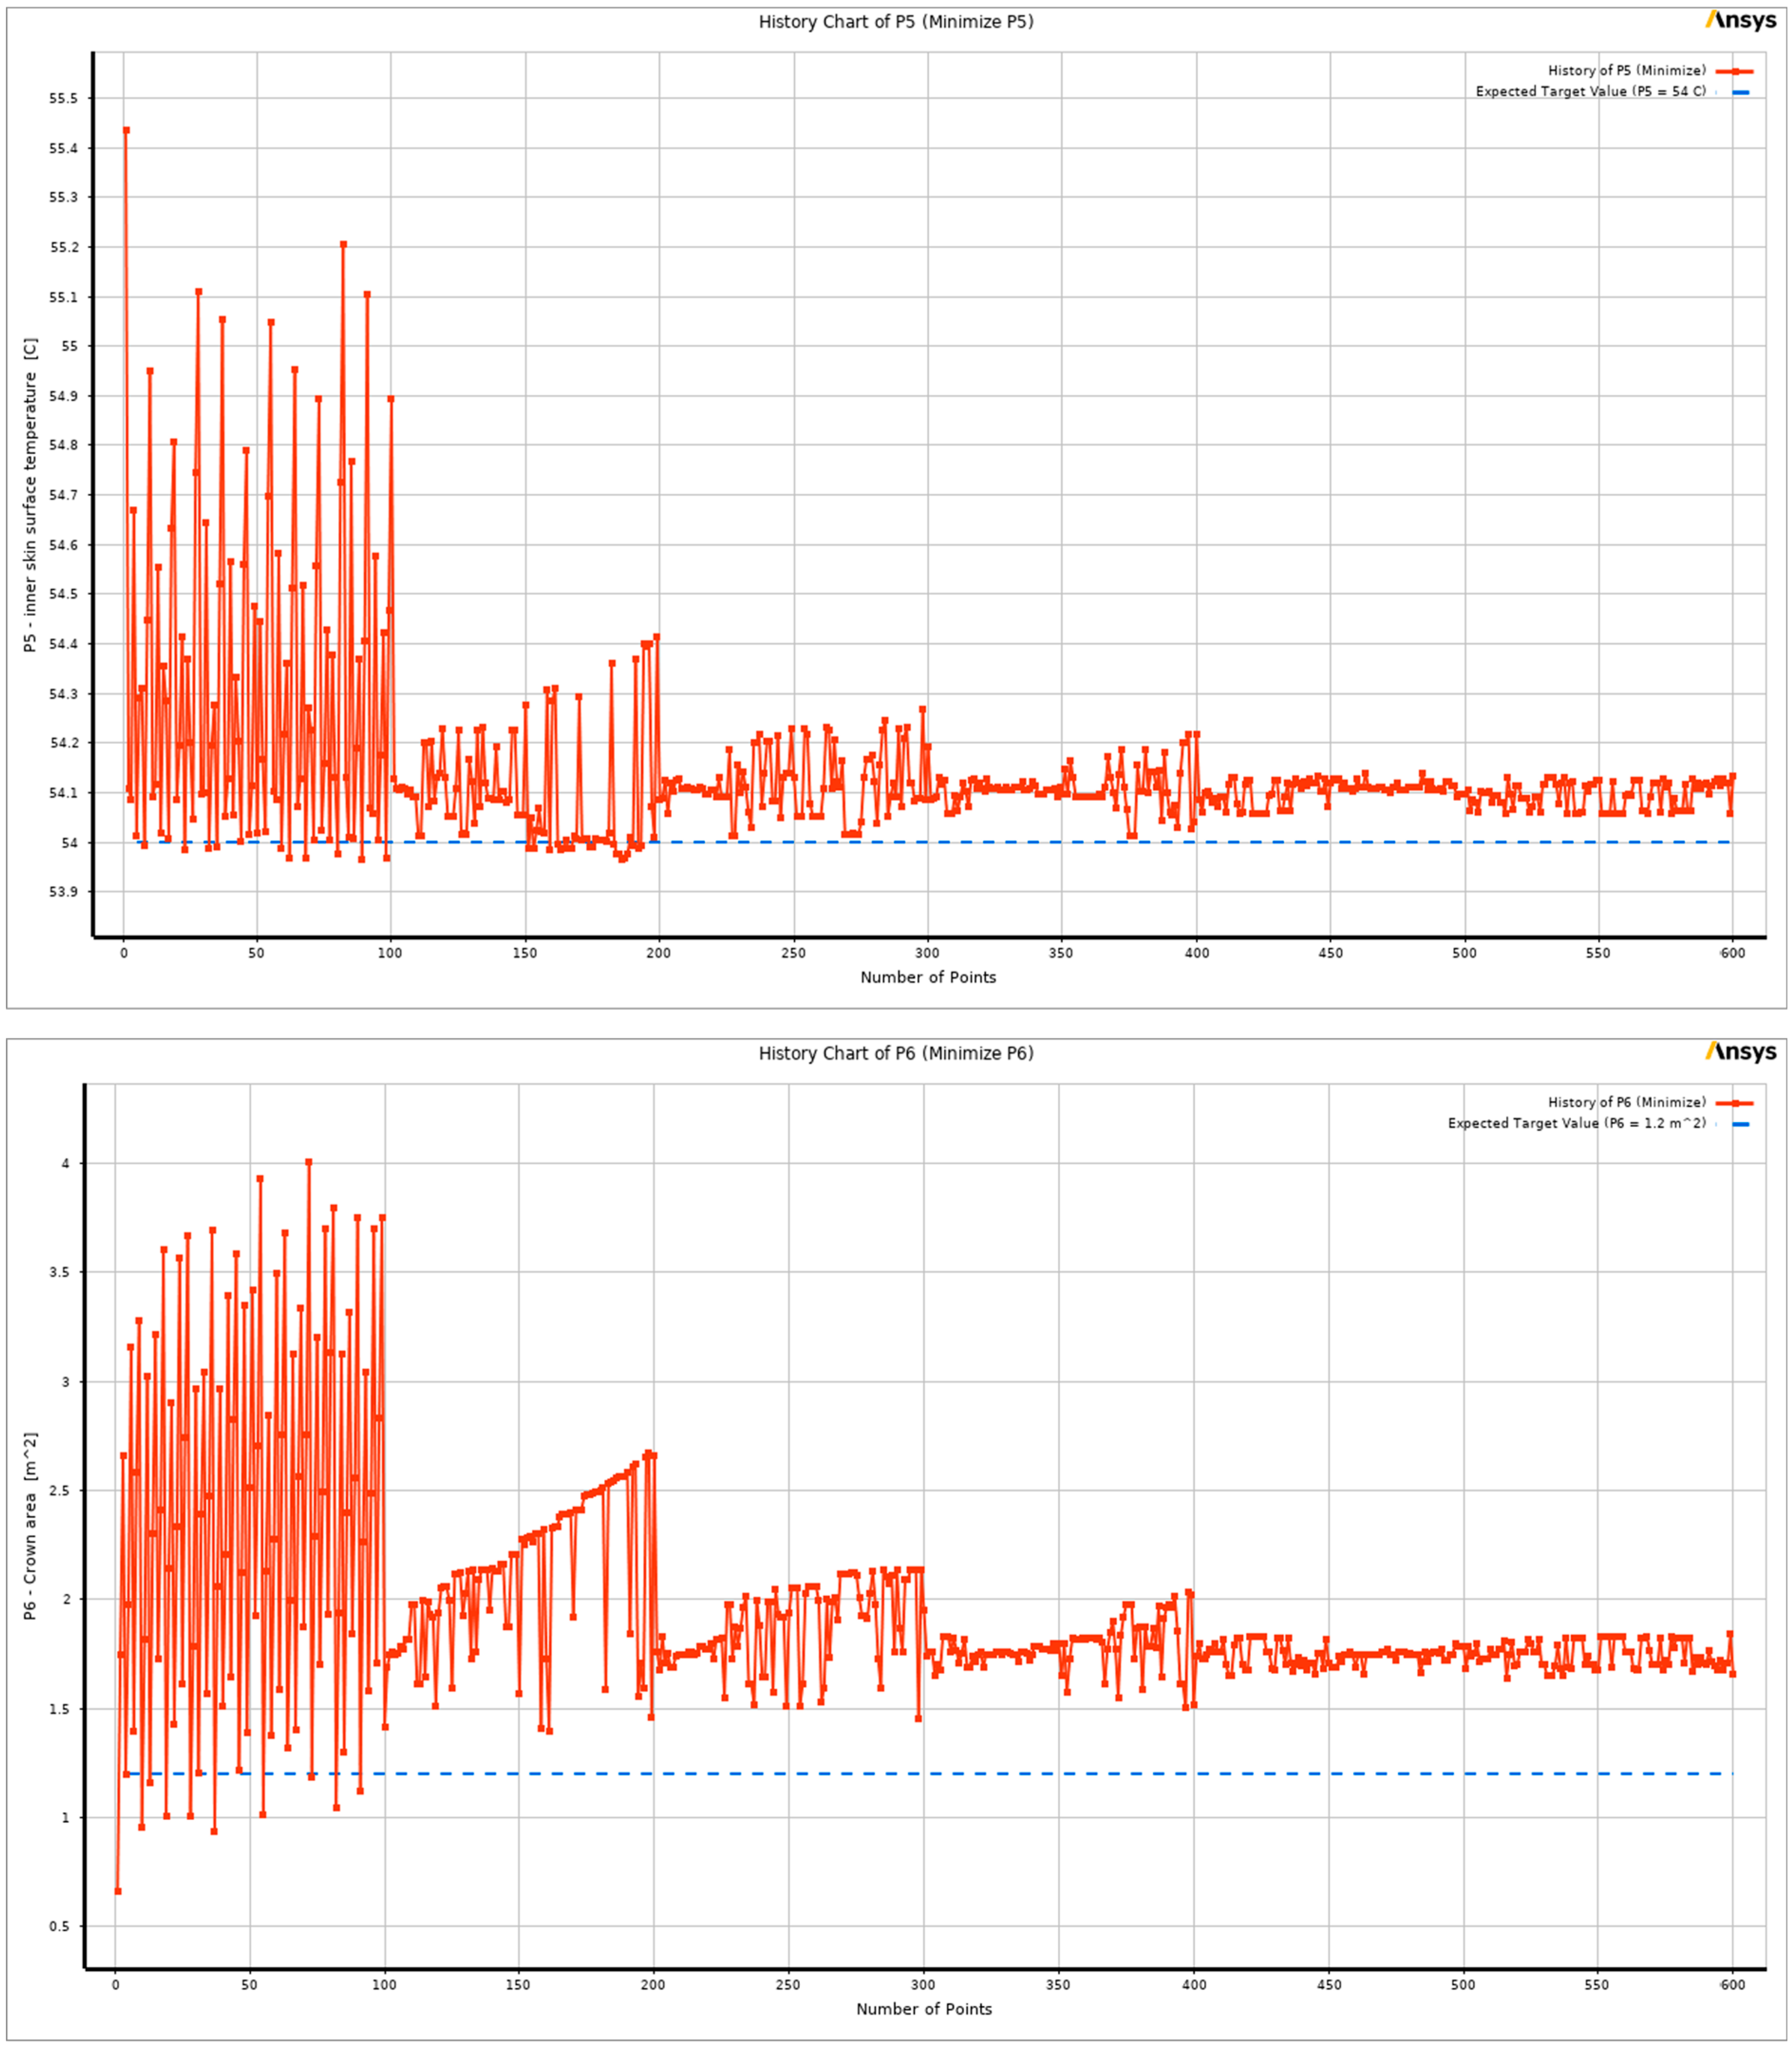
2 with no constraints. Due to the use of response surface evaluations rather than actual solutions, the optimization procedure took only a few seconds to reveal the results. The optimization process converged after 543 evaluations.
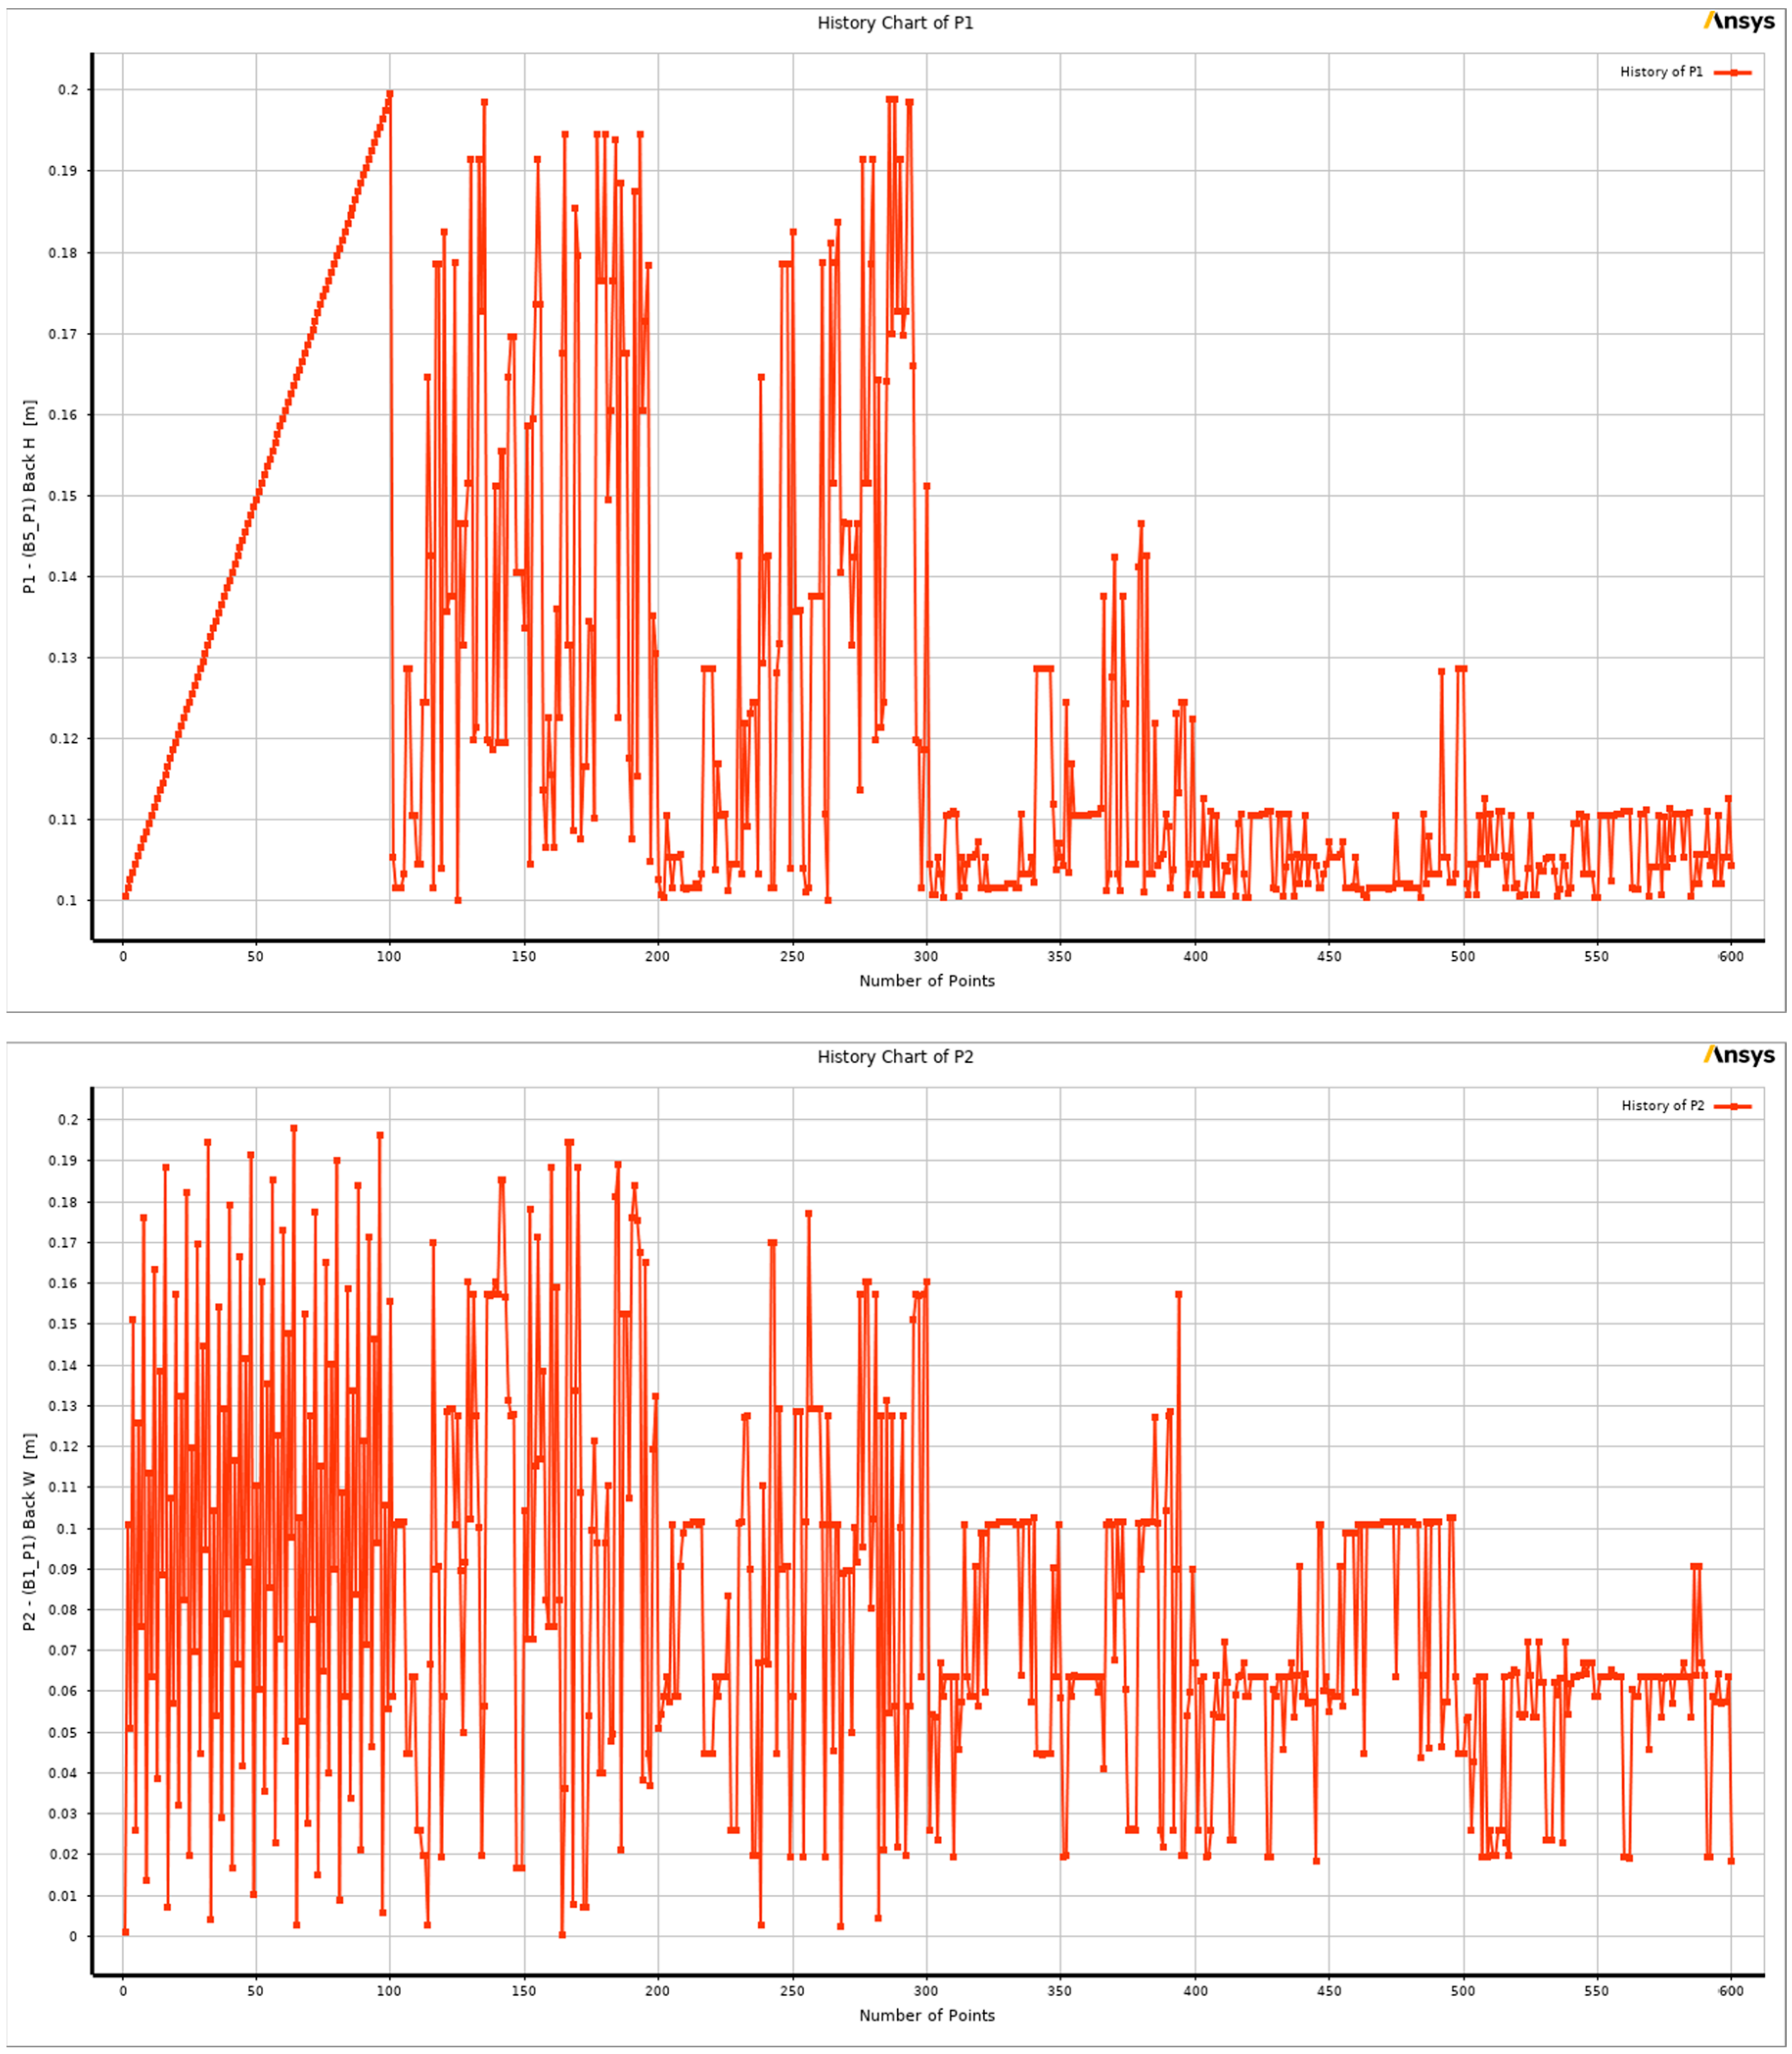
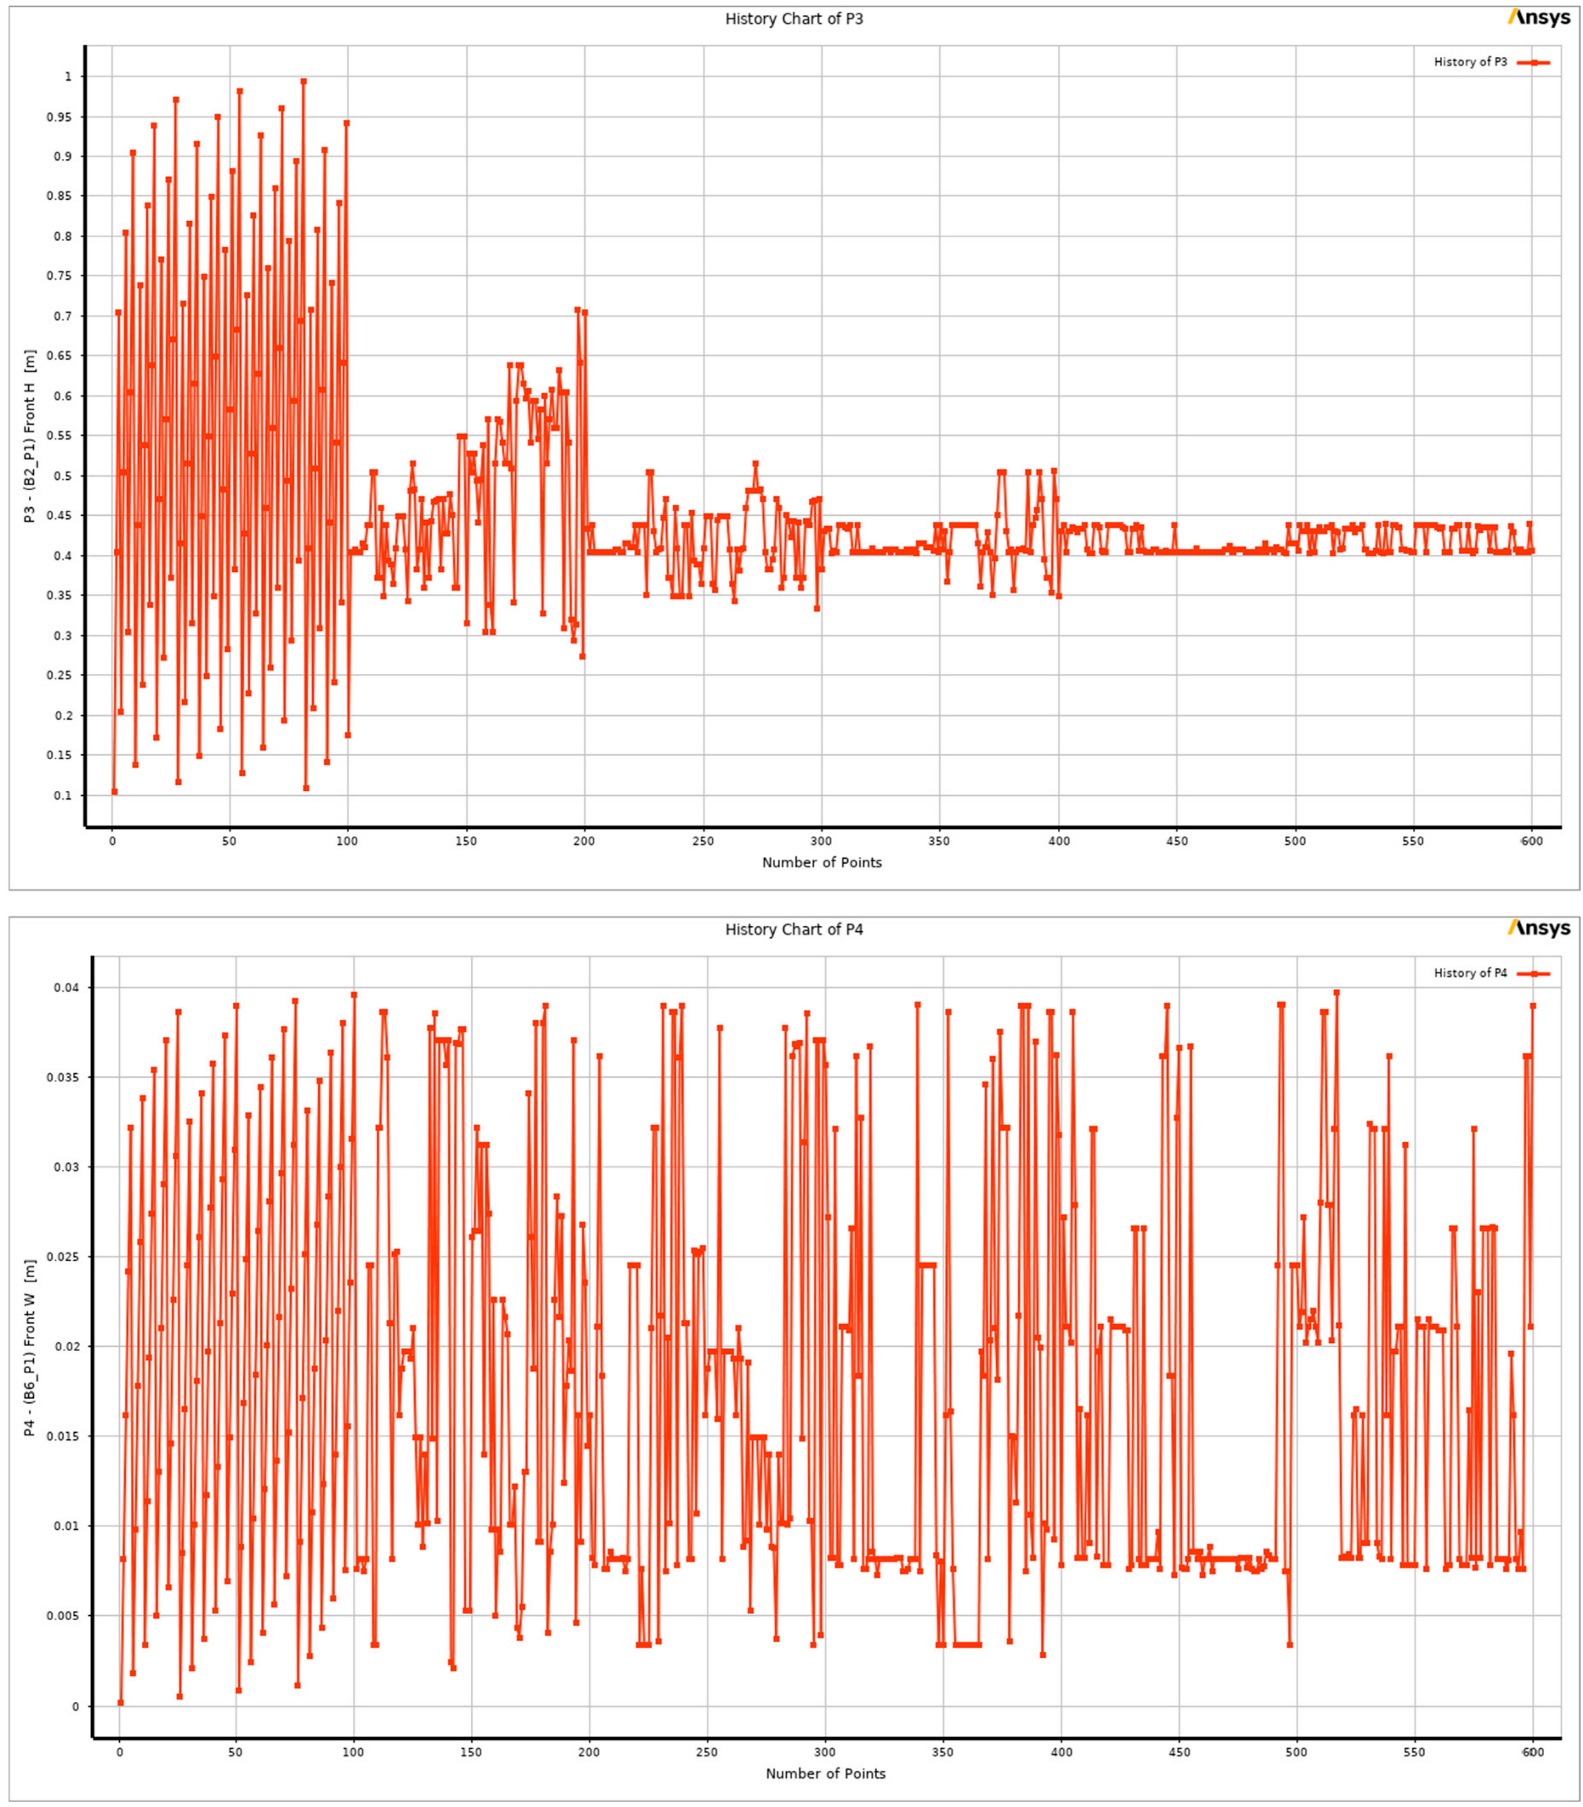
Figure 12 represents the evolution of the population of these 543 evaluation points during the iterations of the optimization for each output parameter until it converged, whereas
Figure 13 and
Figure 14 exhibit the evolution of the population for each input parameter.
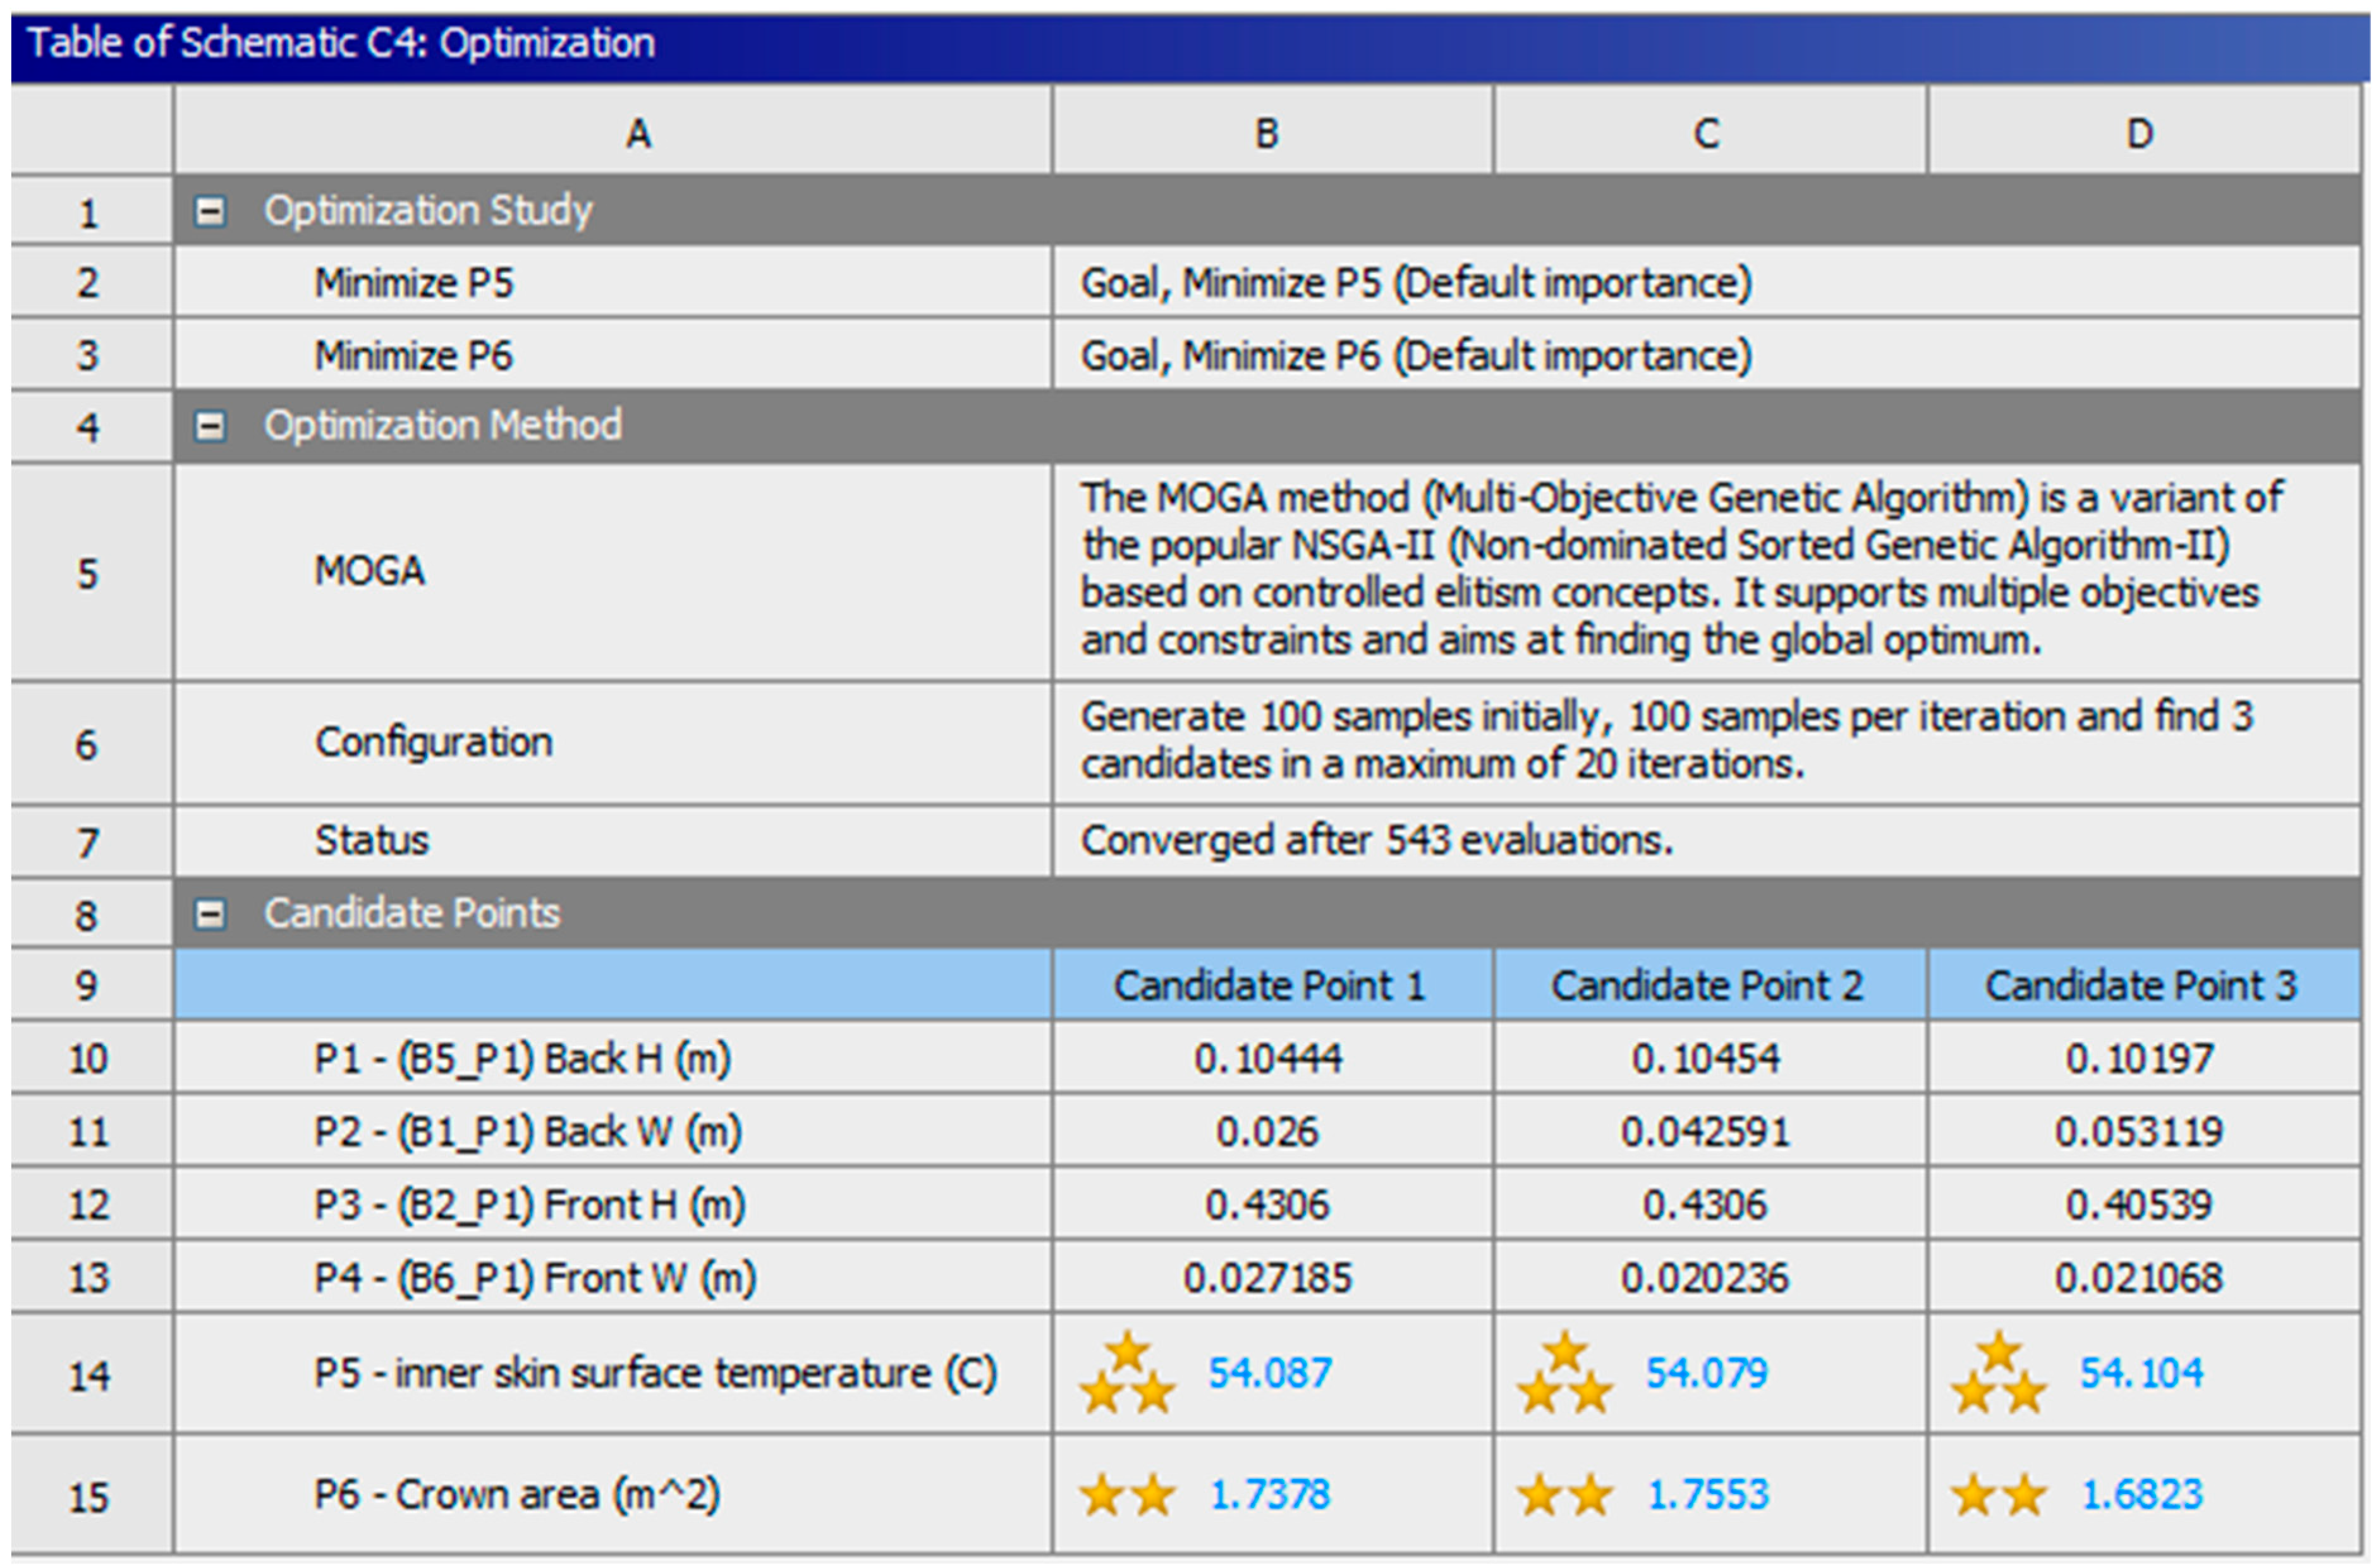
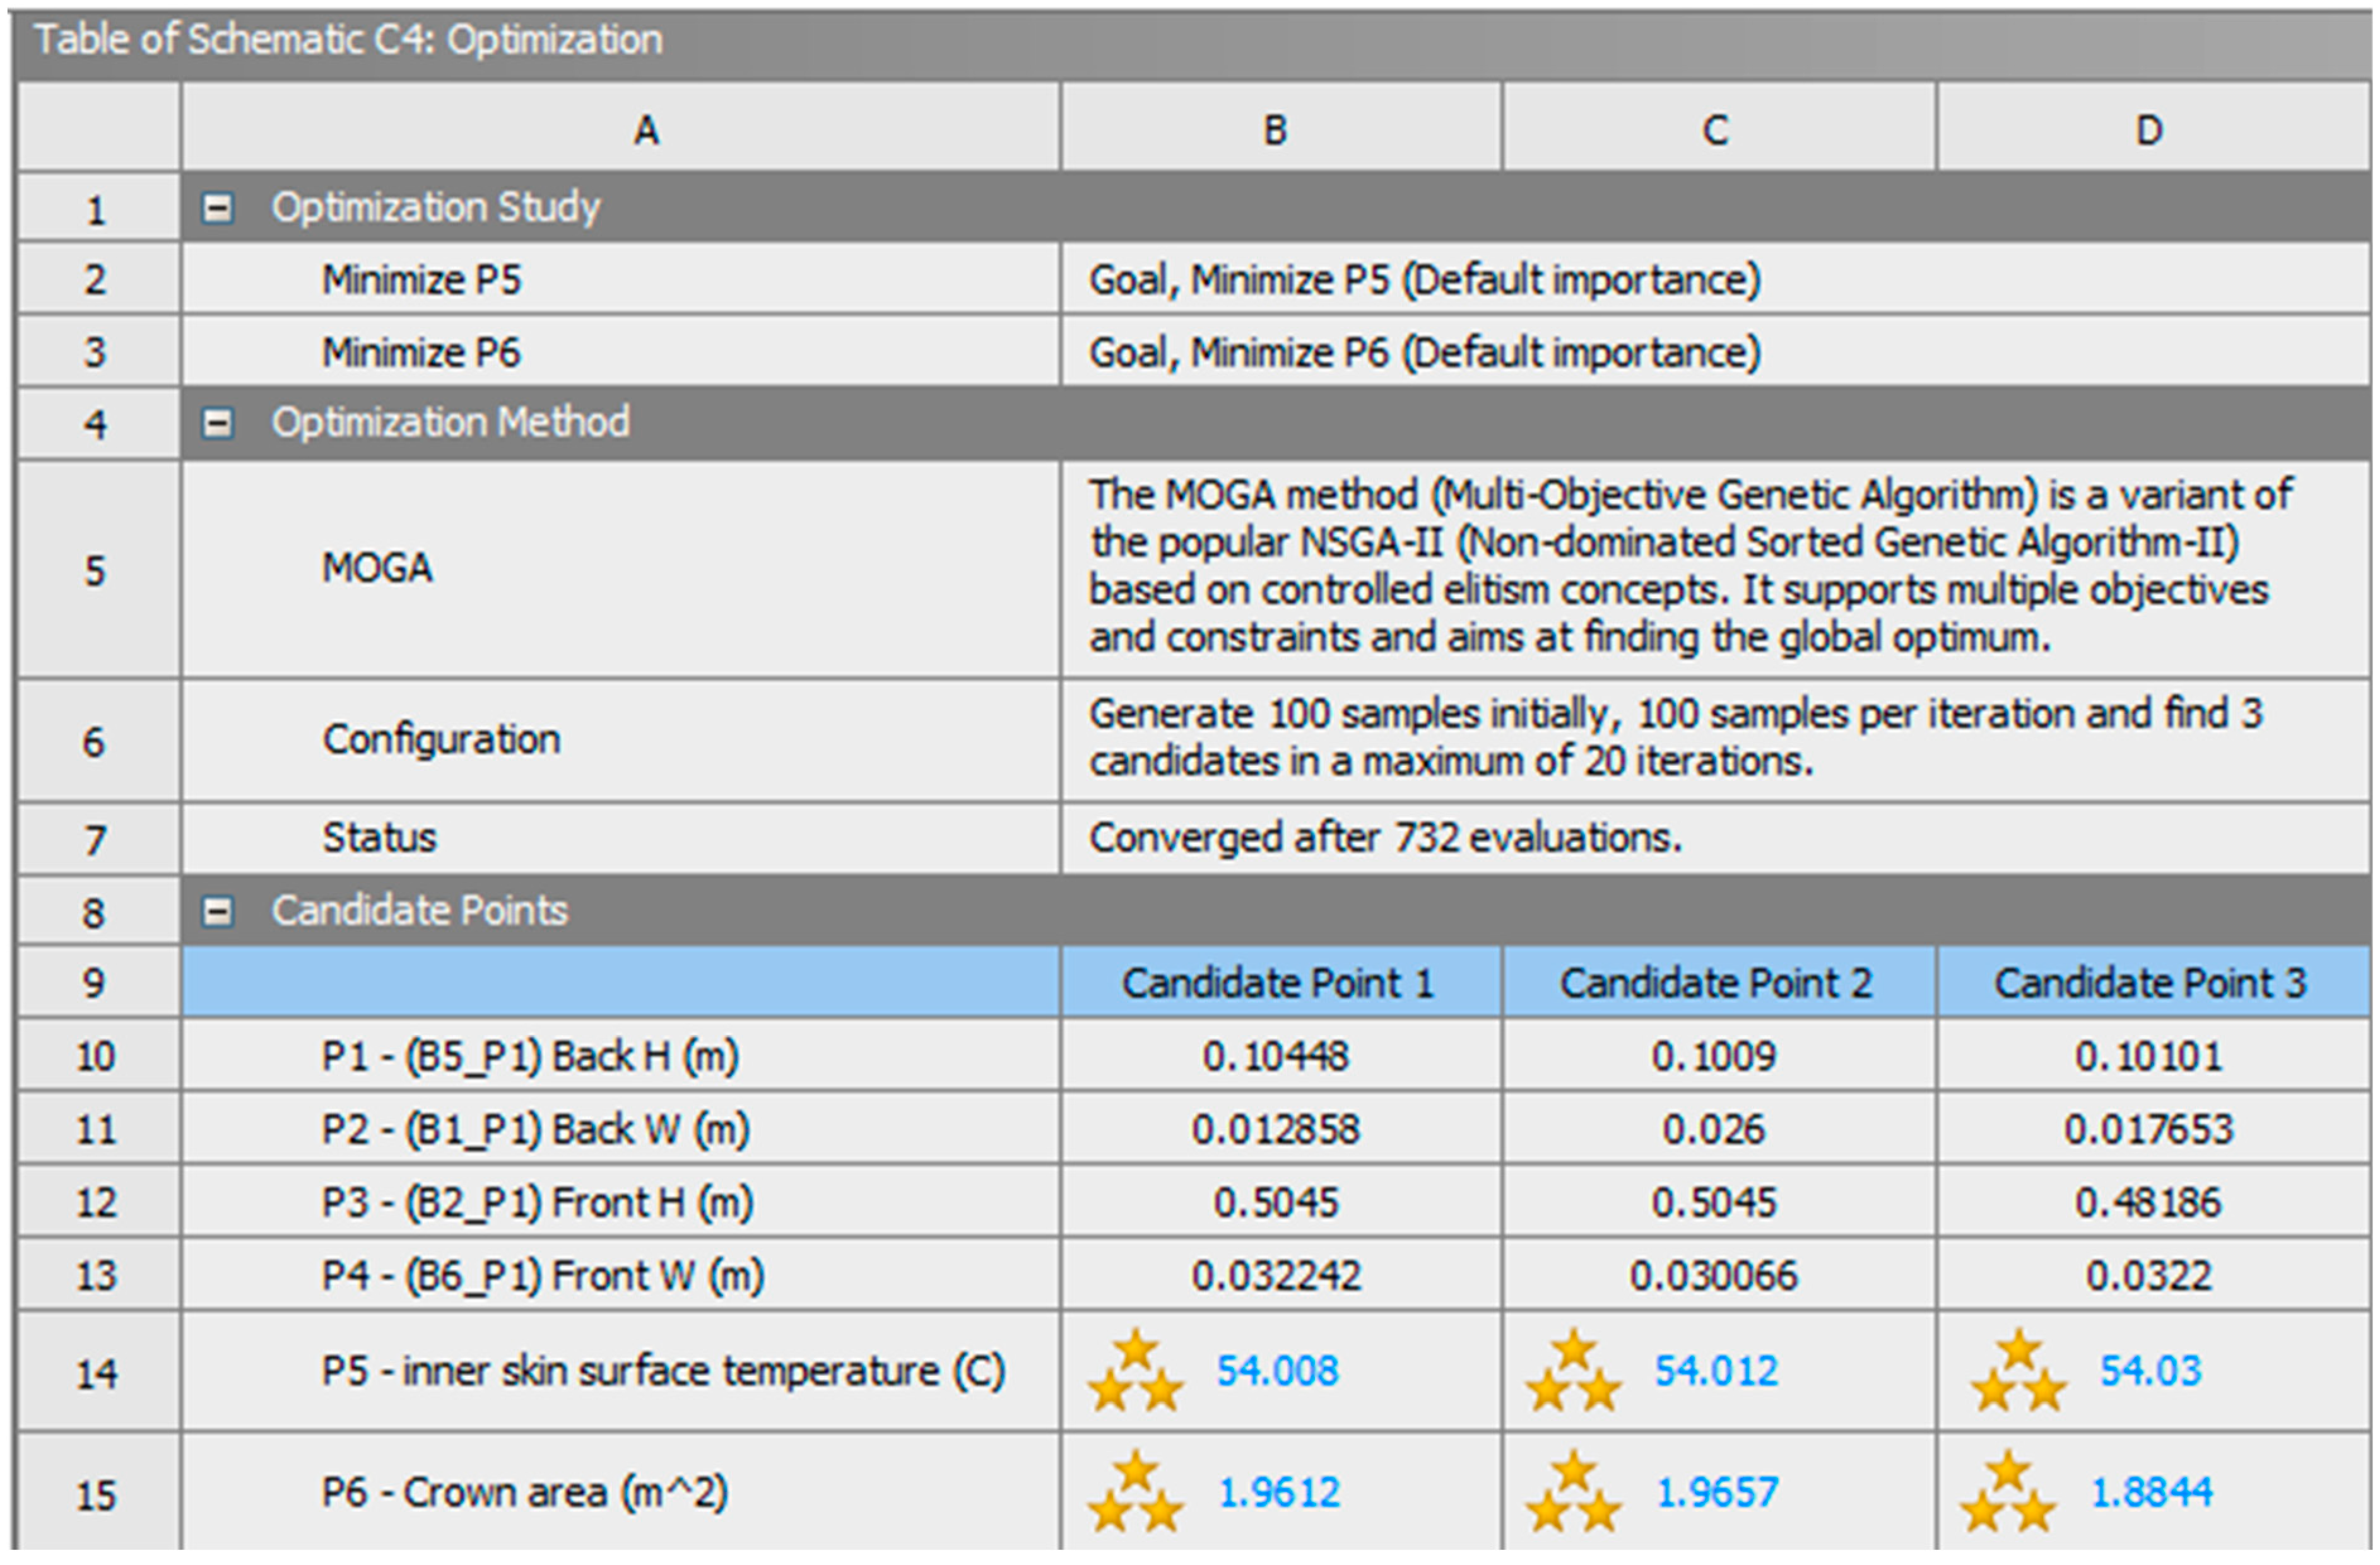
The optimization process revealed the three most optimal candidate points, as illustrated in
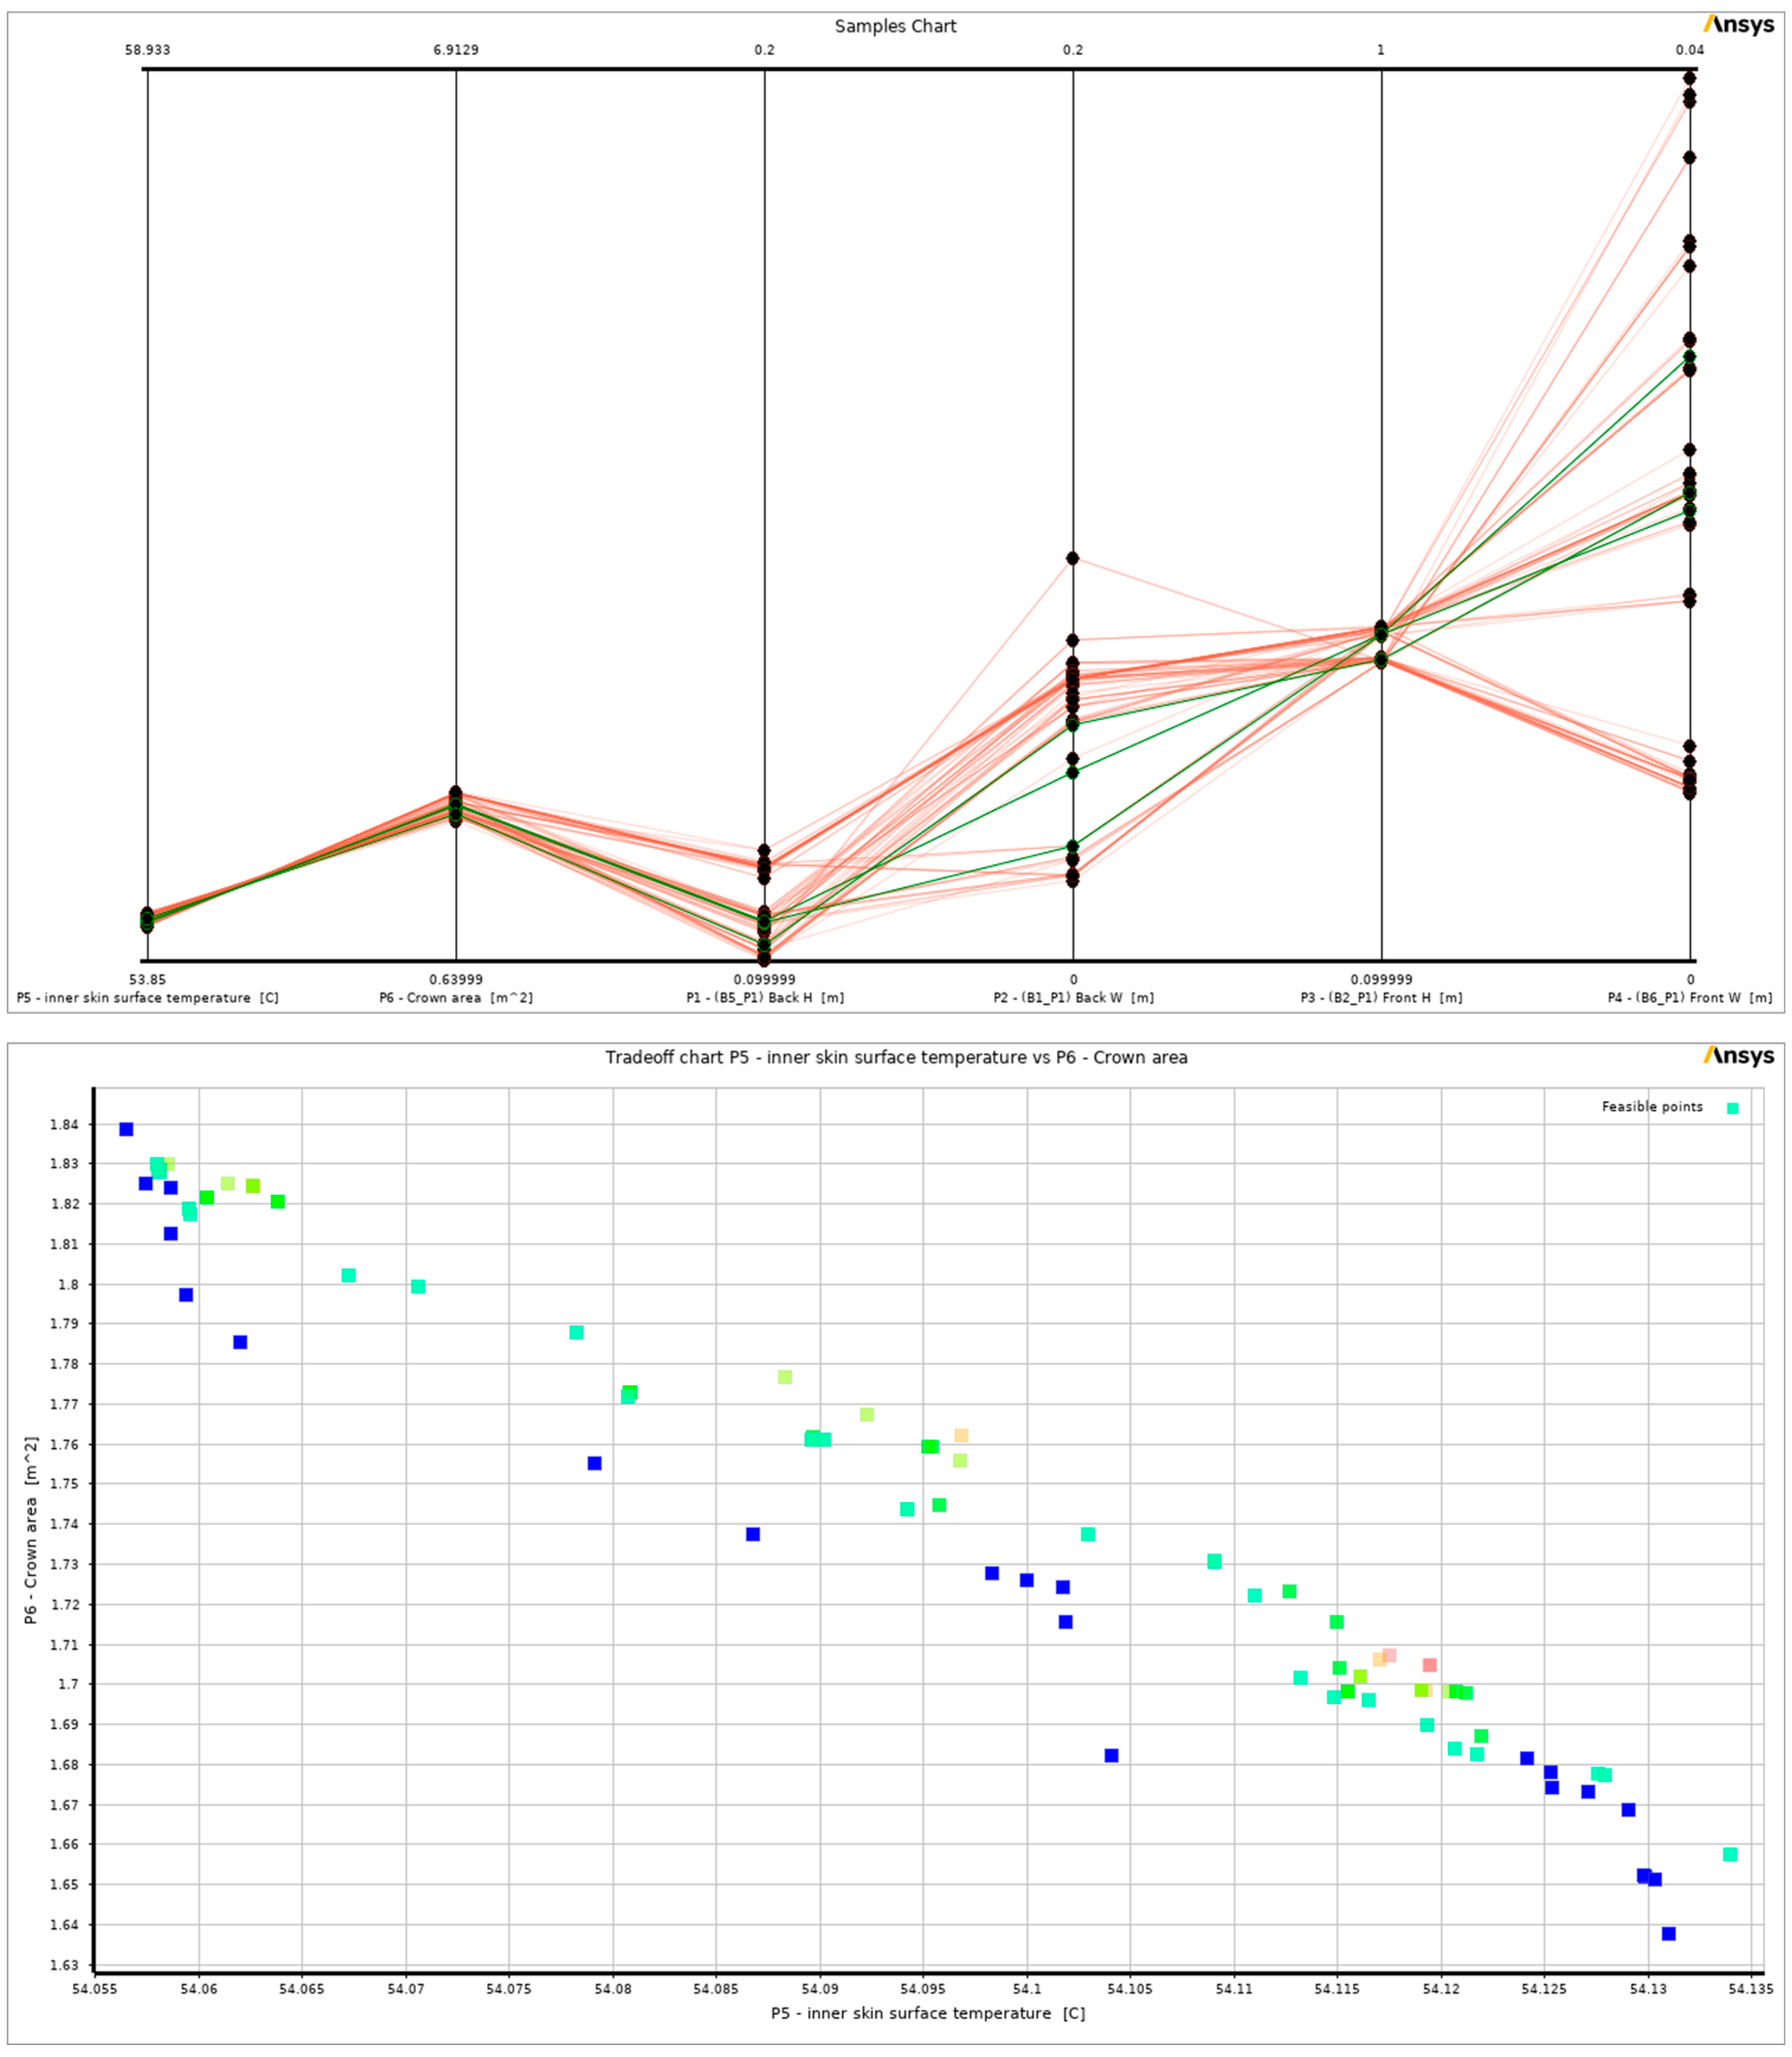
Figure 15. The candidate points share common values with many design points, as demonstrated in the trade-off chart and the samples chart of the last iteration in
Figure 16. However, the forms of all these points are nearly identical. When compared to the initial solution of a wide mound, all of the candidate points that were found show outcomes that are better in both objectives. The average temperature differential on the inner skin surface was approximately 0.4 °C, whereas the crown area had a difference of about 0.3 m
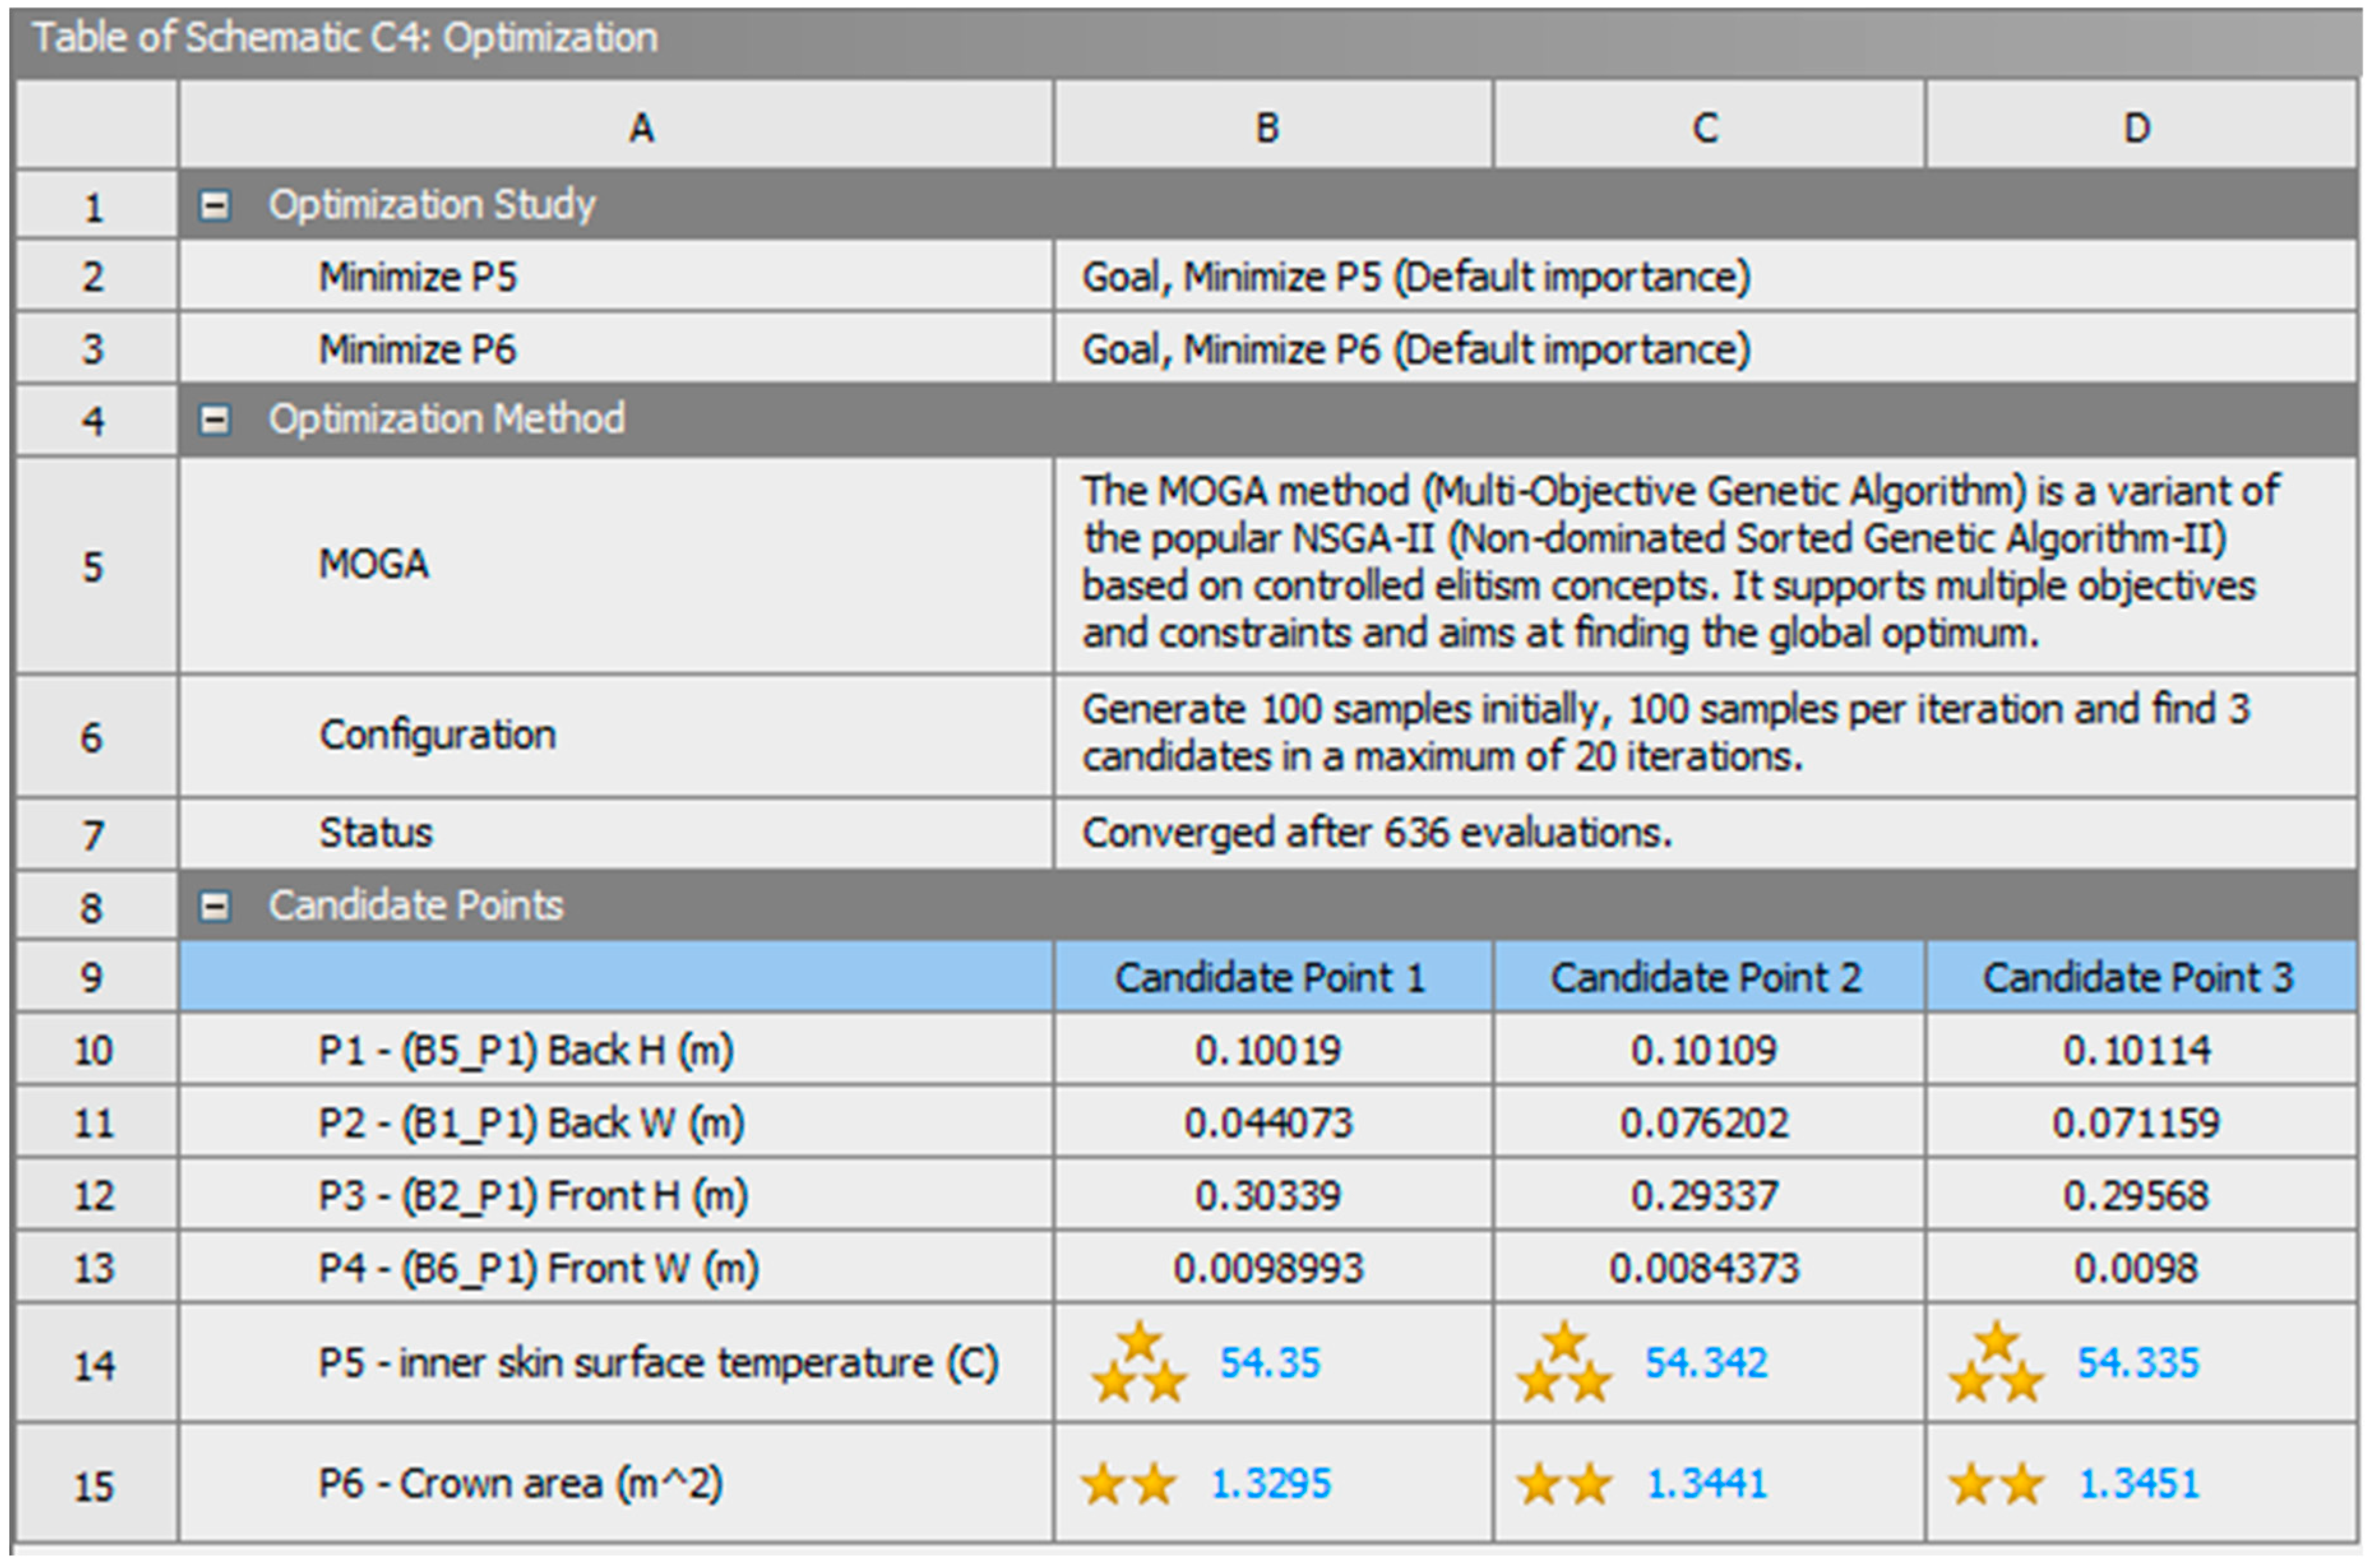
2. The outcome is satisfactory; however, it would be ideal to investigate other possibilities that, at one point in time, cause the optimization process to give more significance to the target of the average inner skin surface temperature and, at another point in time, to the objective of the crown area.
In the Min-Max search of the response surfaces, the minimum average inner skin surface temperature achievable is 53.85 °C, and the minimum crown area is 0.64 m
2. Consequently, the first optimization target was set to reach 53.85 °C, and the crown area target was set to 2 m
2, which is the same as the original wide mound solution. The second time, the target was the opposite, with the average inner skin surface temperature set to 54.4 °C and the crown area target set to 0.64 m
2.
Figure 17 displays the candidate points of this optimization that prioritize the objective of the average inner skin surface temperature. The results indicate that the temperature difference on the average inner skin surface is less than 0.1 °C compared to the initial optimization, which is quite insignificant. Furthermore, the crown area has risen by around 0.2 m
2. As a result, these candidate points were not considered as optimal solutions.
Figure 18 illustrates the candidate points of the optimization that prioritize the crown area, revealing a noteworthy finding. This round of optimization resulted in a crown area that is 1.3 m
2 rather than 1.7 m
2 in the earlier optimization, and it is 0.7 m
2 less than the wide mound solution in the initial phase. Simultaneously, the inner skin surface temperature drops by 0.1 °C as compared to the initial wide mound solution.
All of these optimizations demonstrate a significant decrease in the average inner skin surface temperature, particularly in the first optimization, where it achieved a level that was only around 0.15 °C higher than the minimum achievable average temperature for the inner skin surface. On the other hand, the crown area in the best scenario for optimizing it still has a difference of around 0.7 m
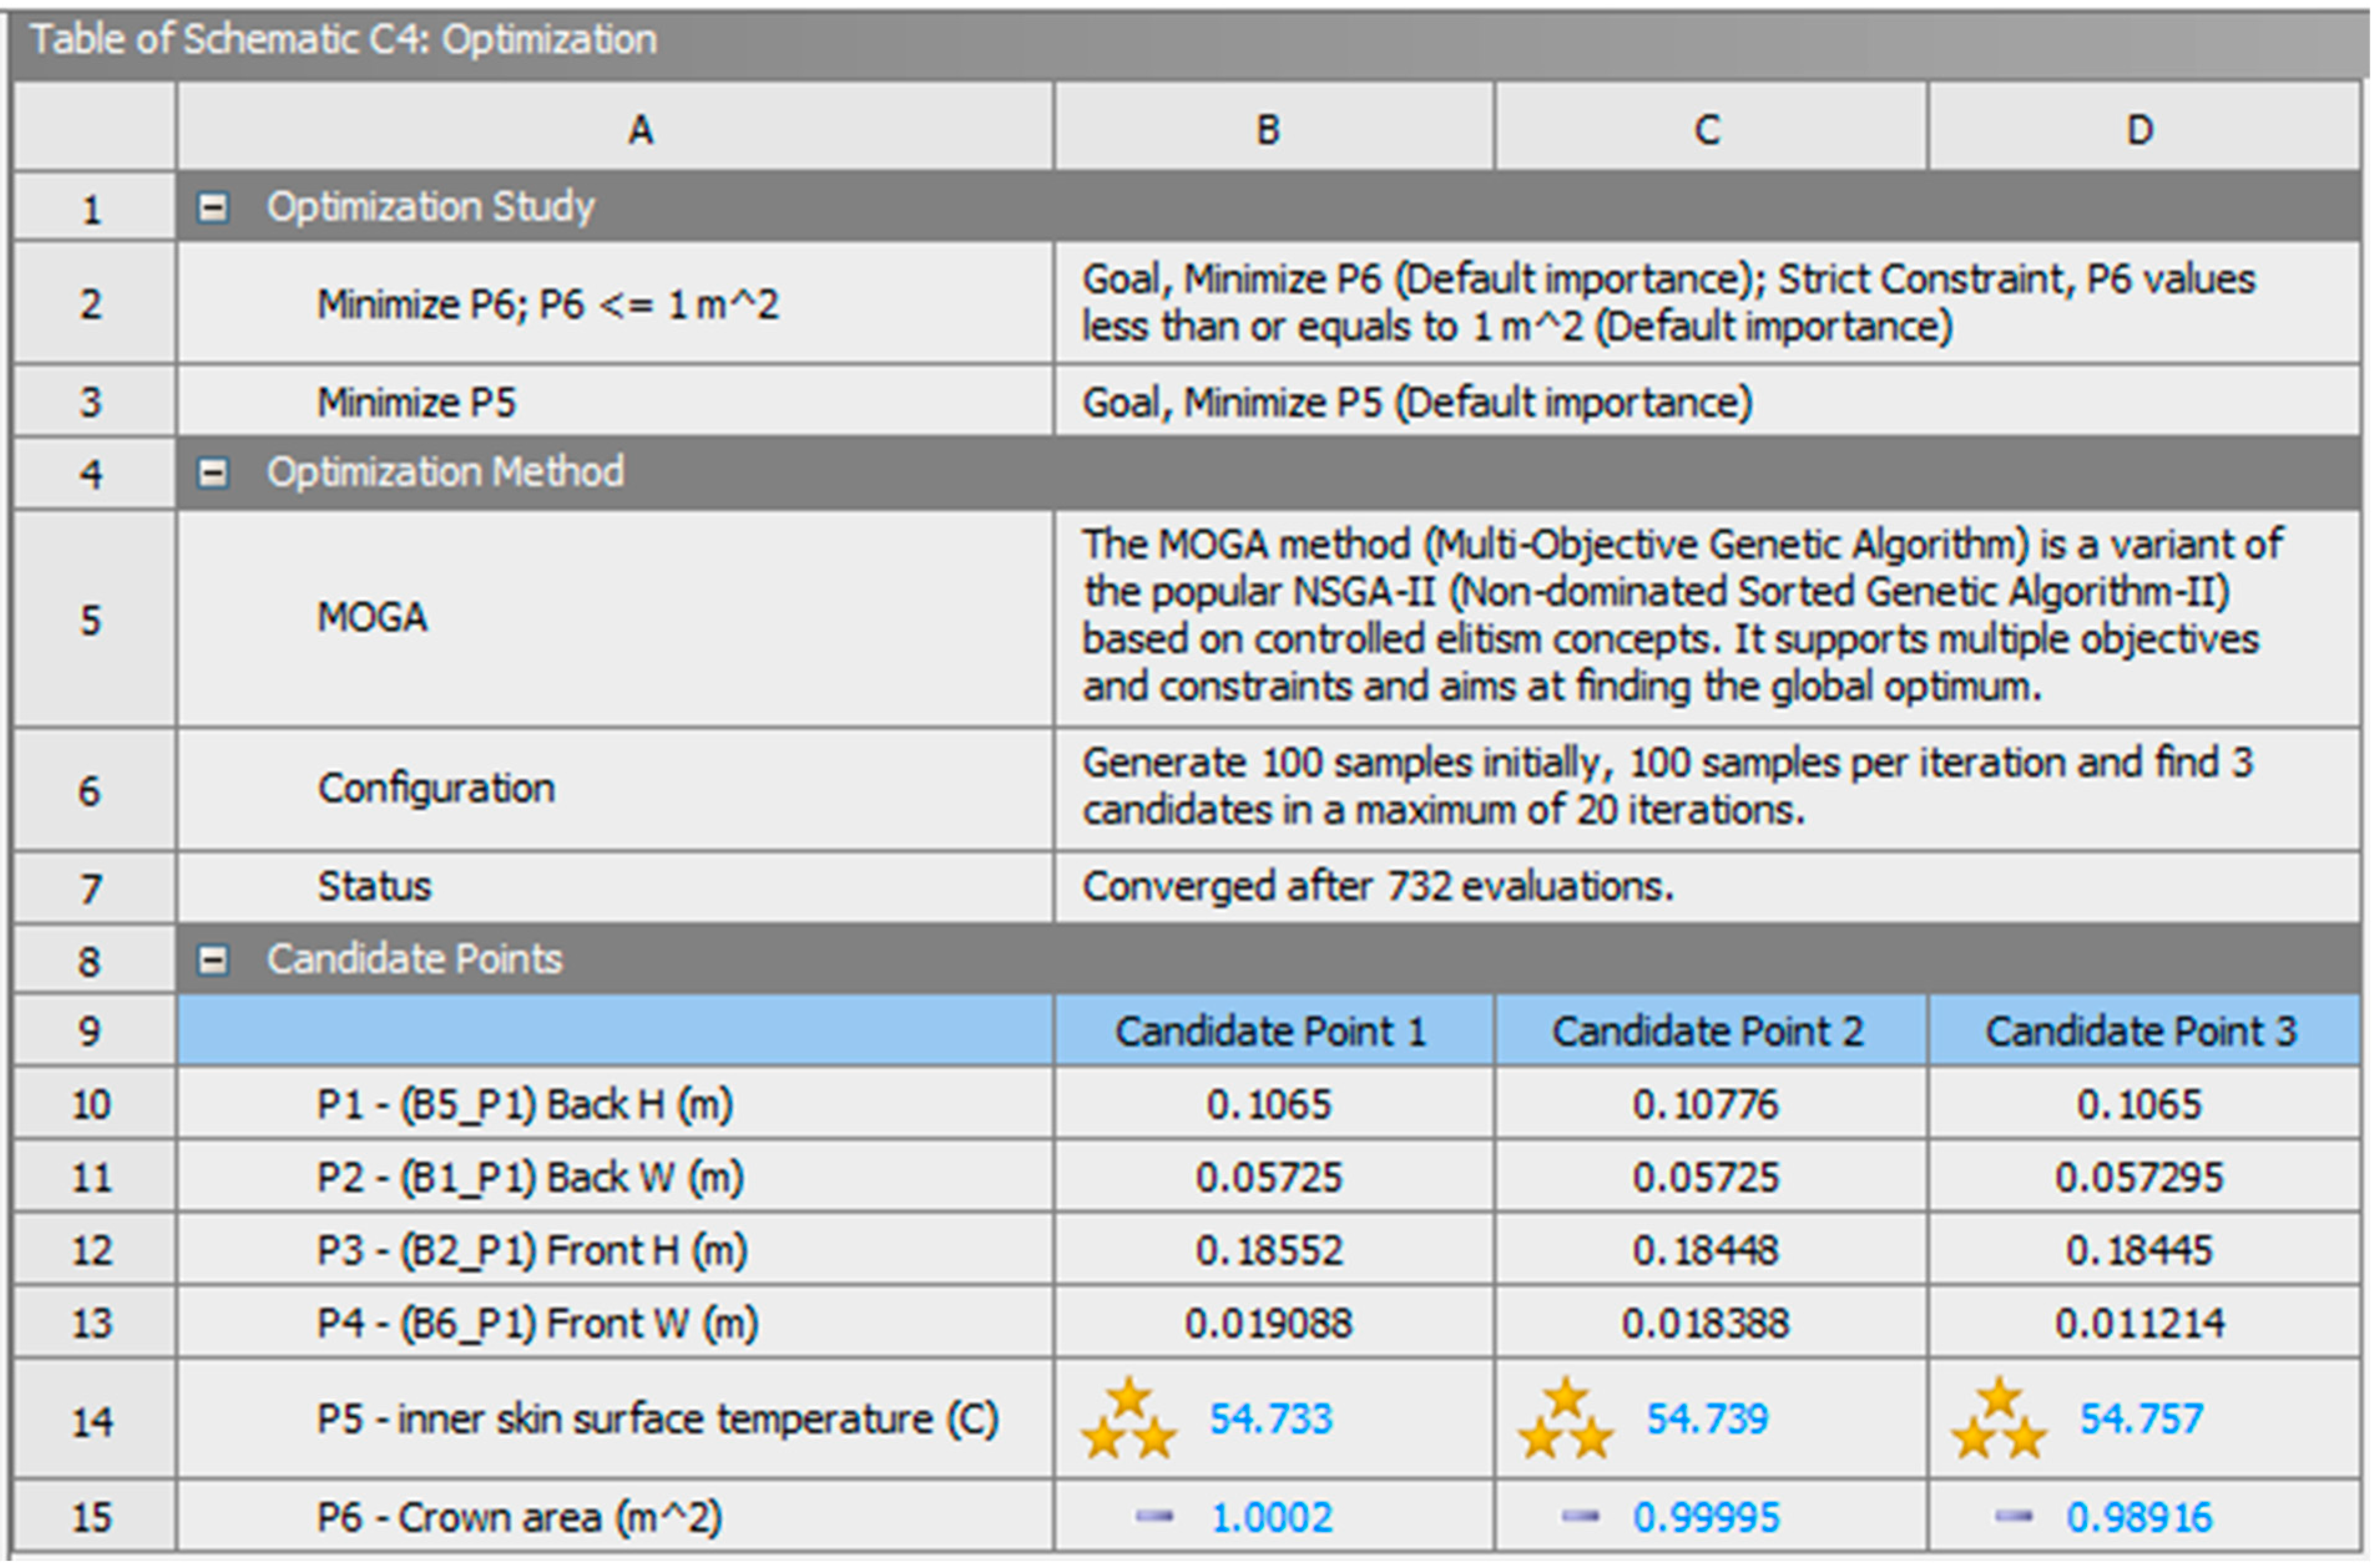
2 when compared to the minimal value that is reachable. Therefore, a constraint was placed on the target of the crown area, requiring the optimization to identify design points that are less than the specified upper bound of 1 m
2. Afterwards, the optimization process was updated. This optimization approach resulted in the identification of certain potential points that have half of the total area of the original crown and lead to an only 0.3 °C rise in the average temperature of the inner skin surface, as illustrated in
Figure 19.
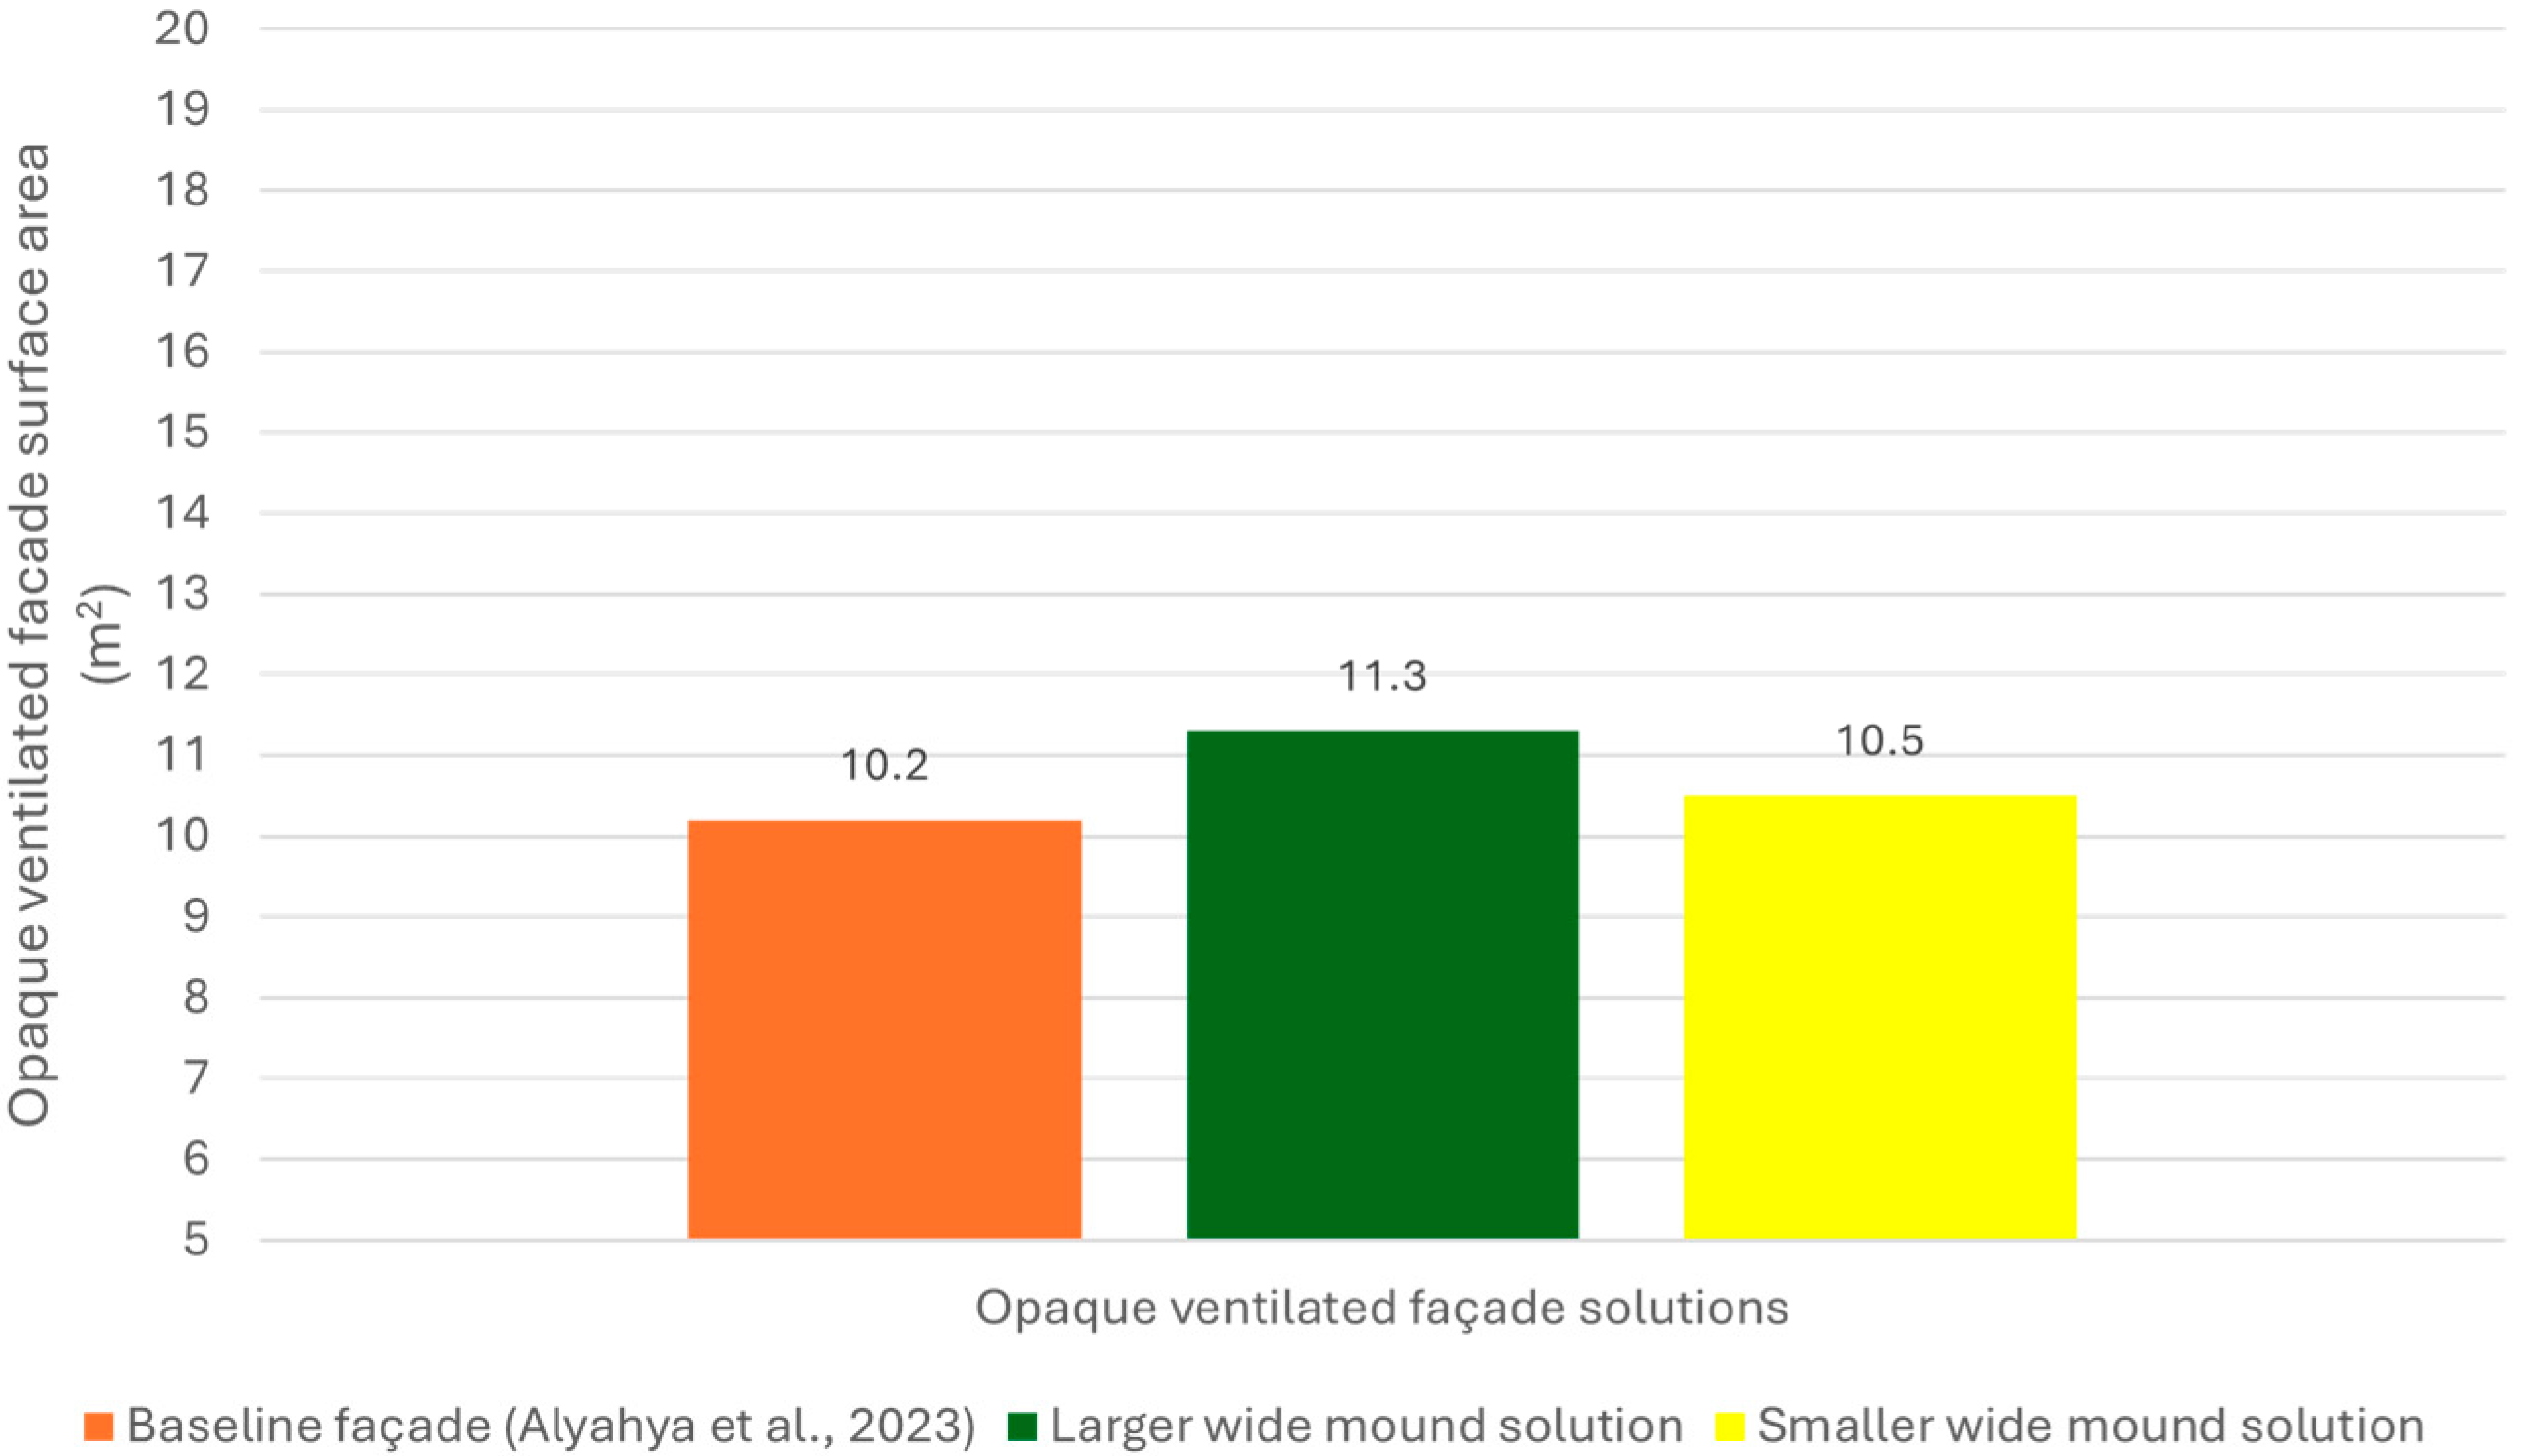
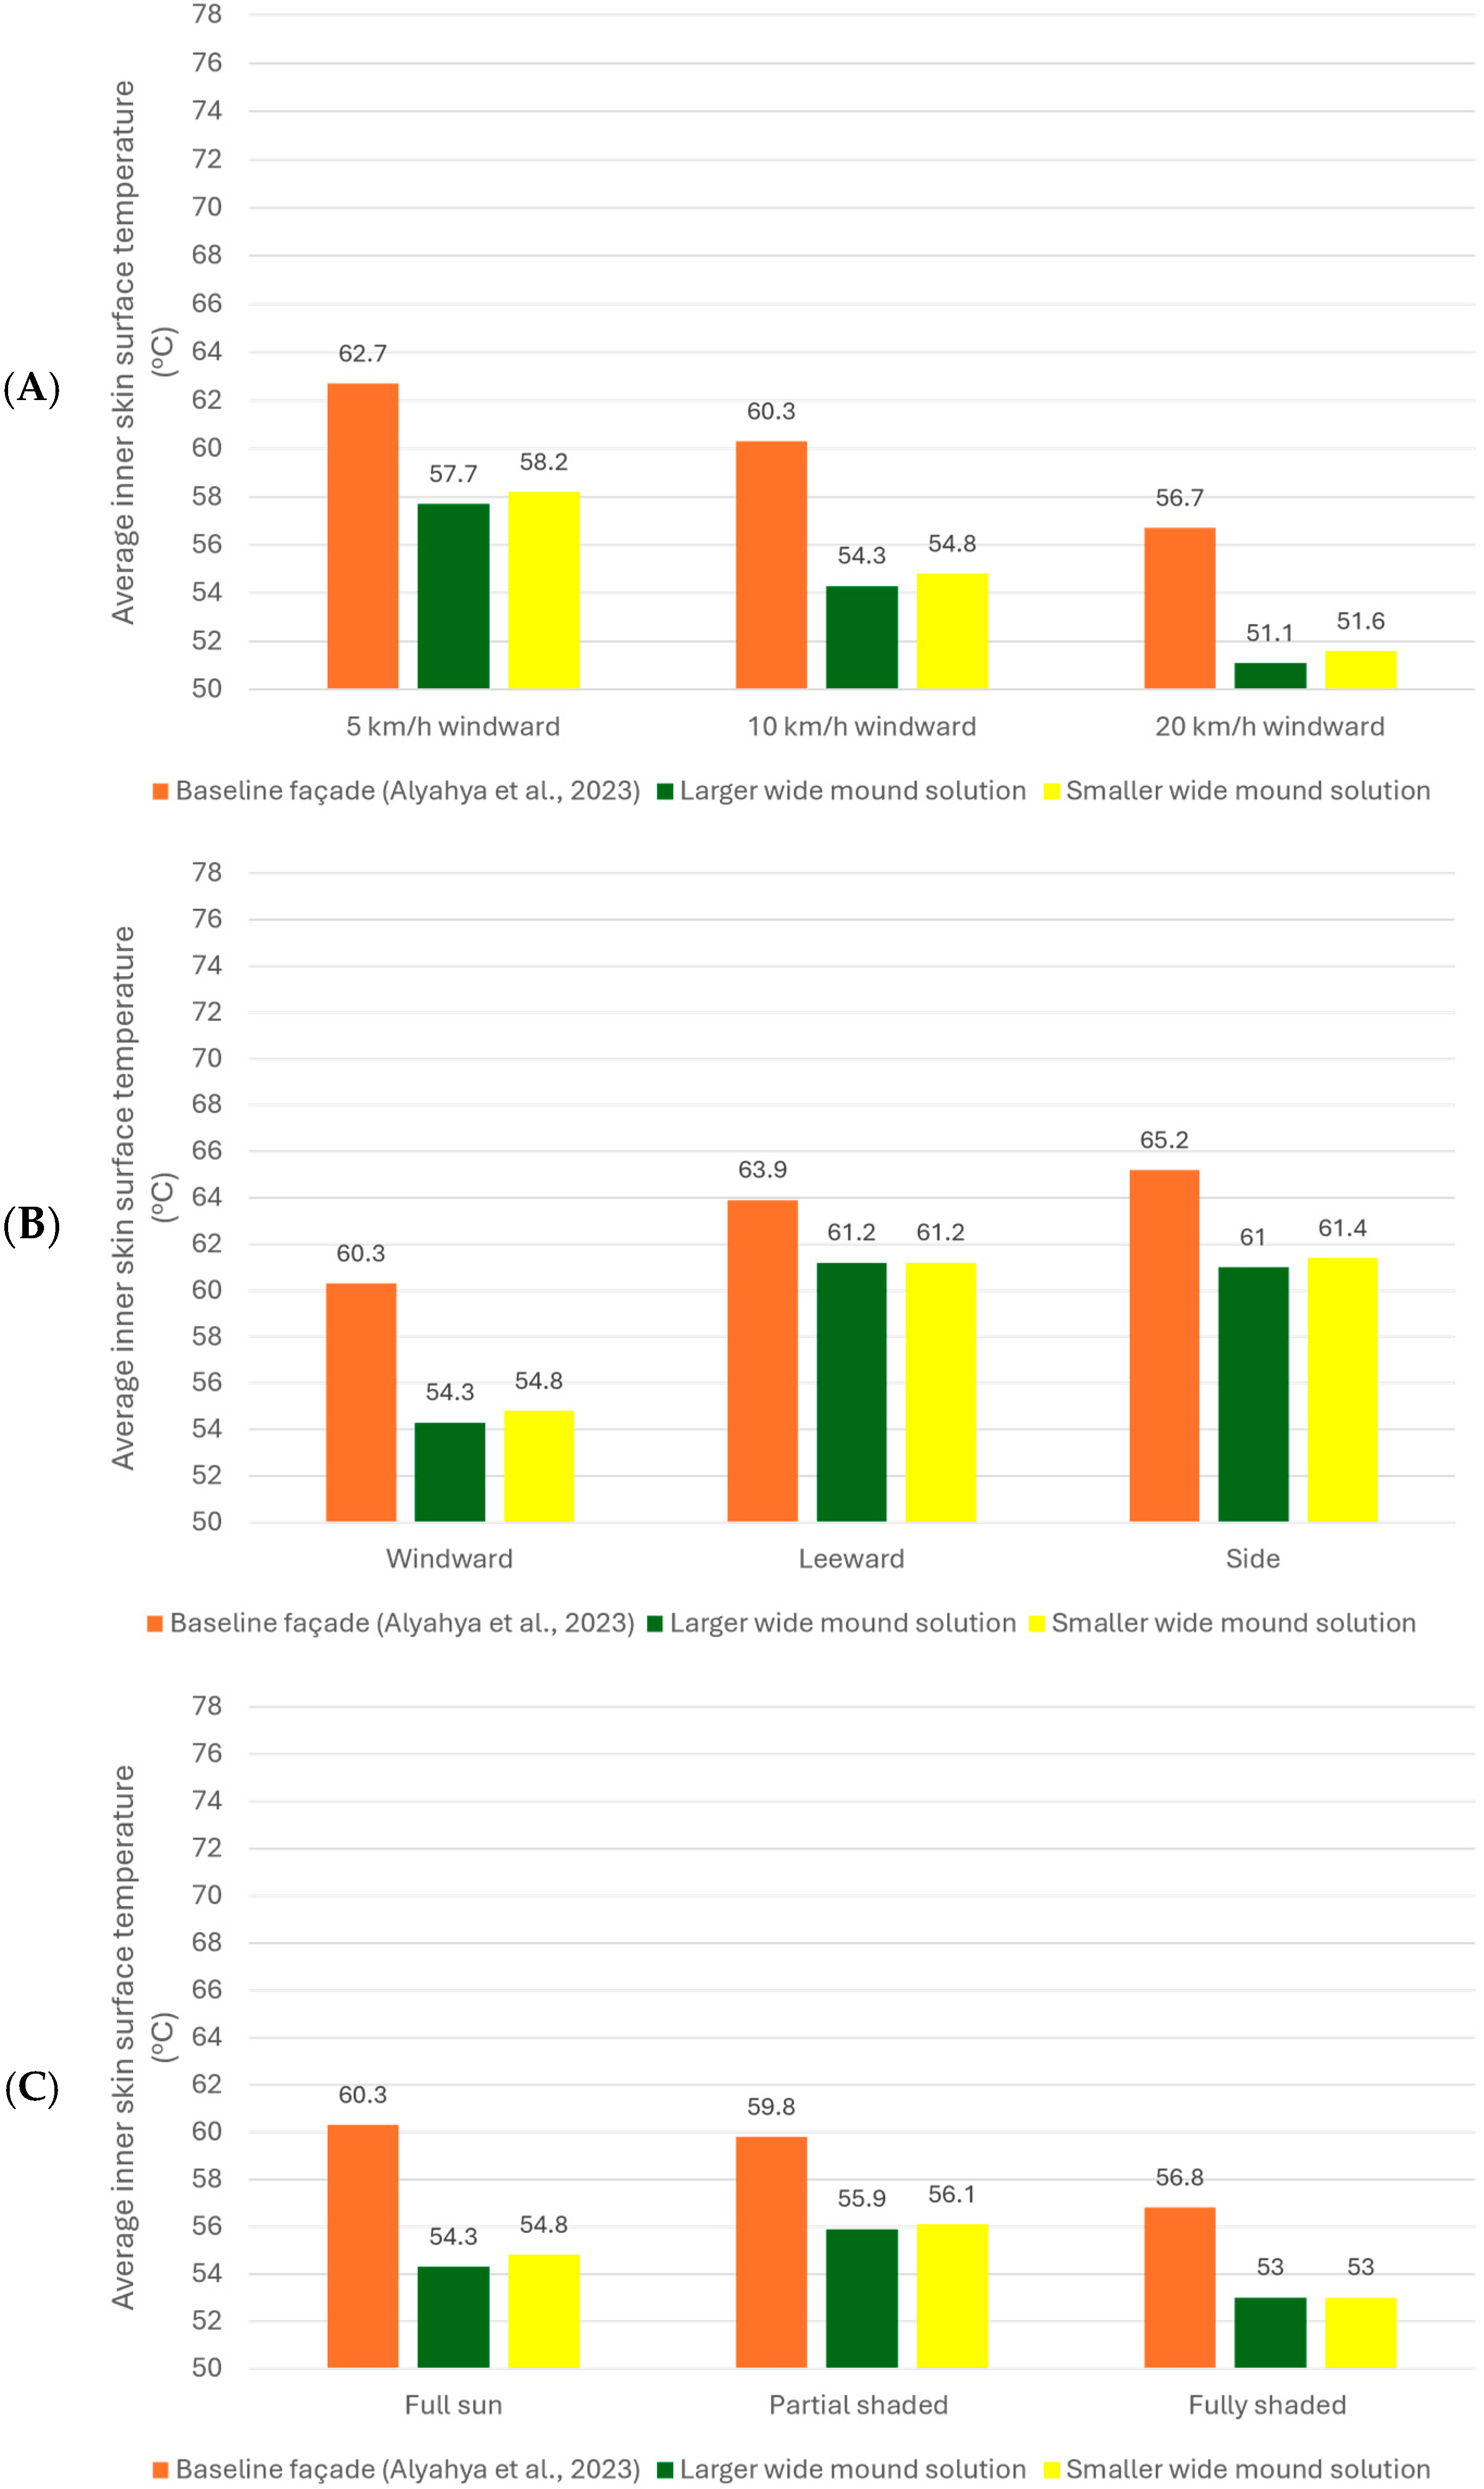
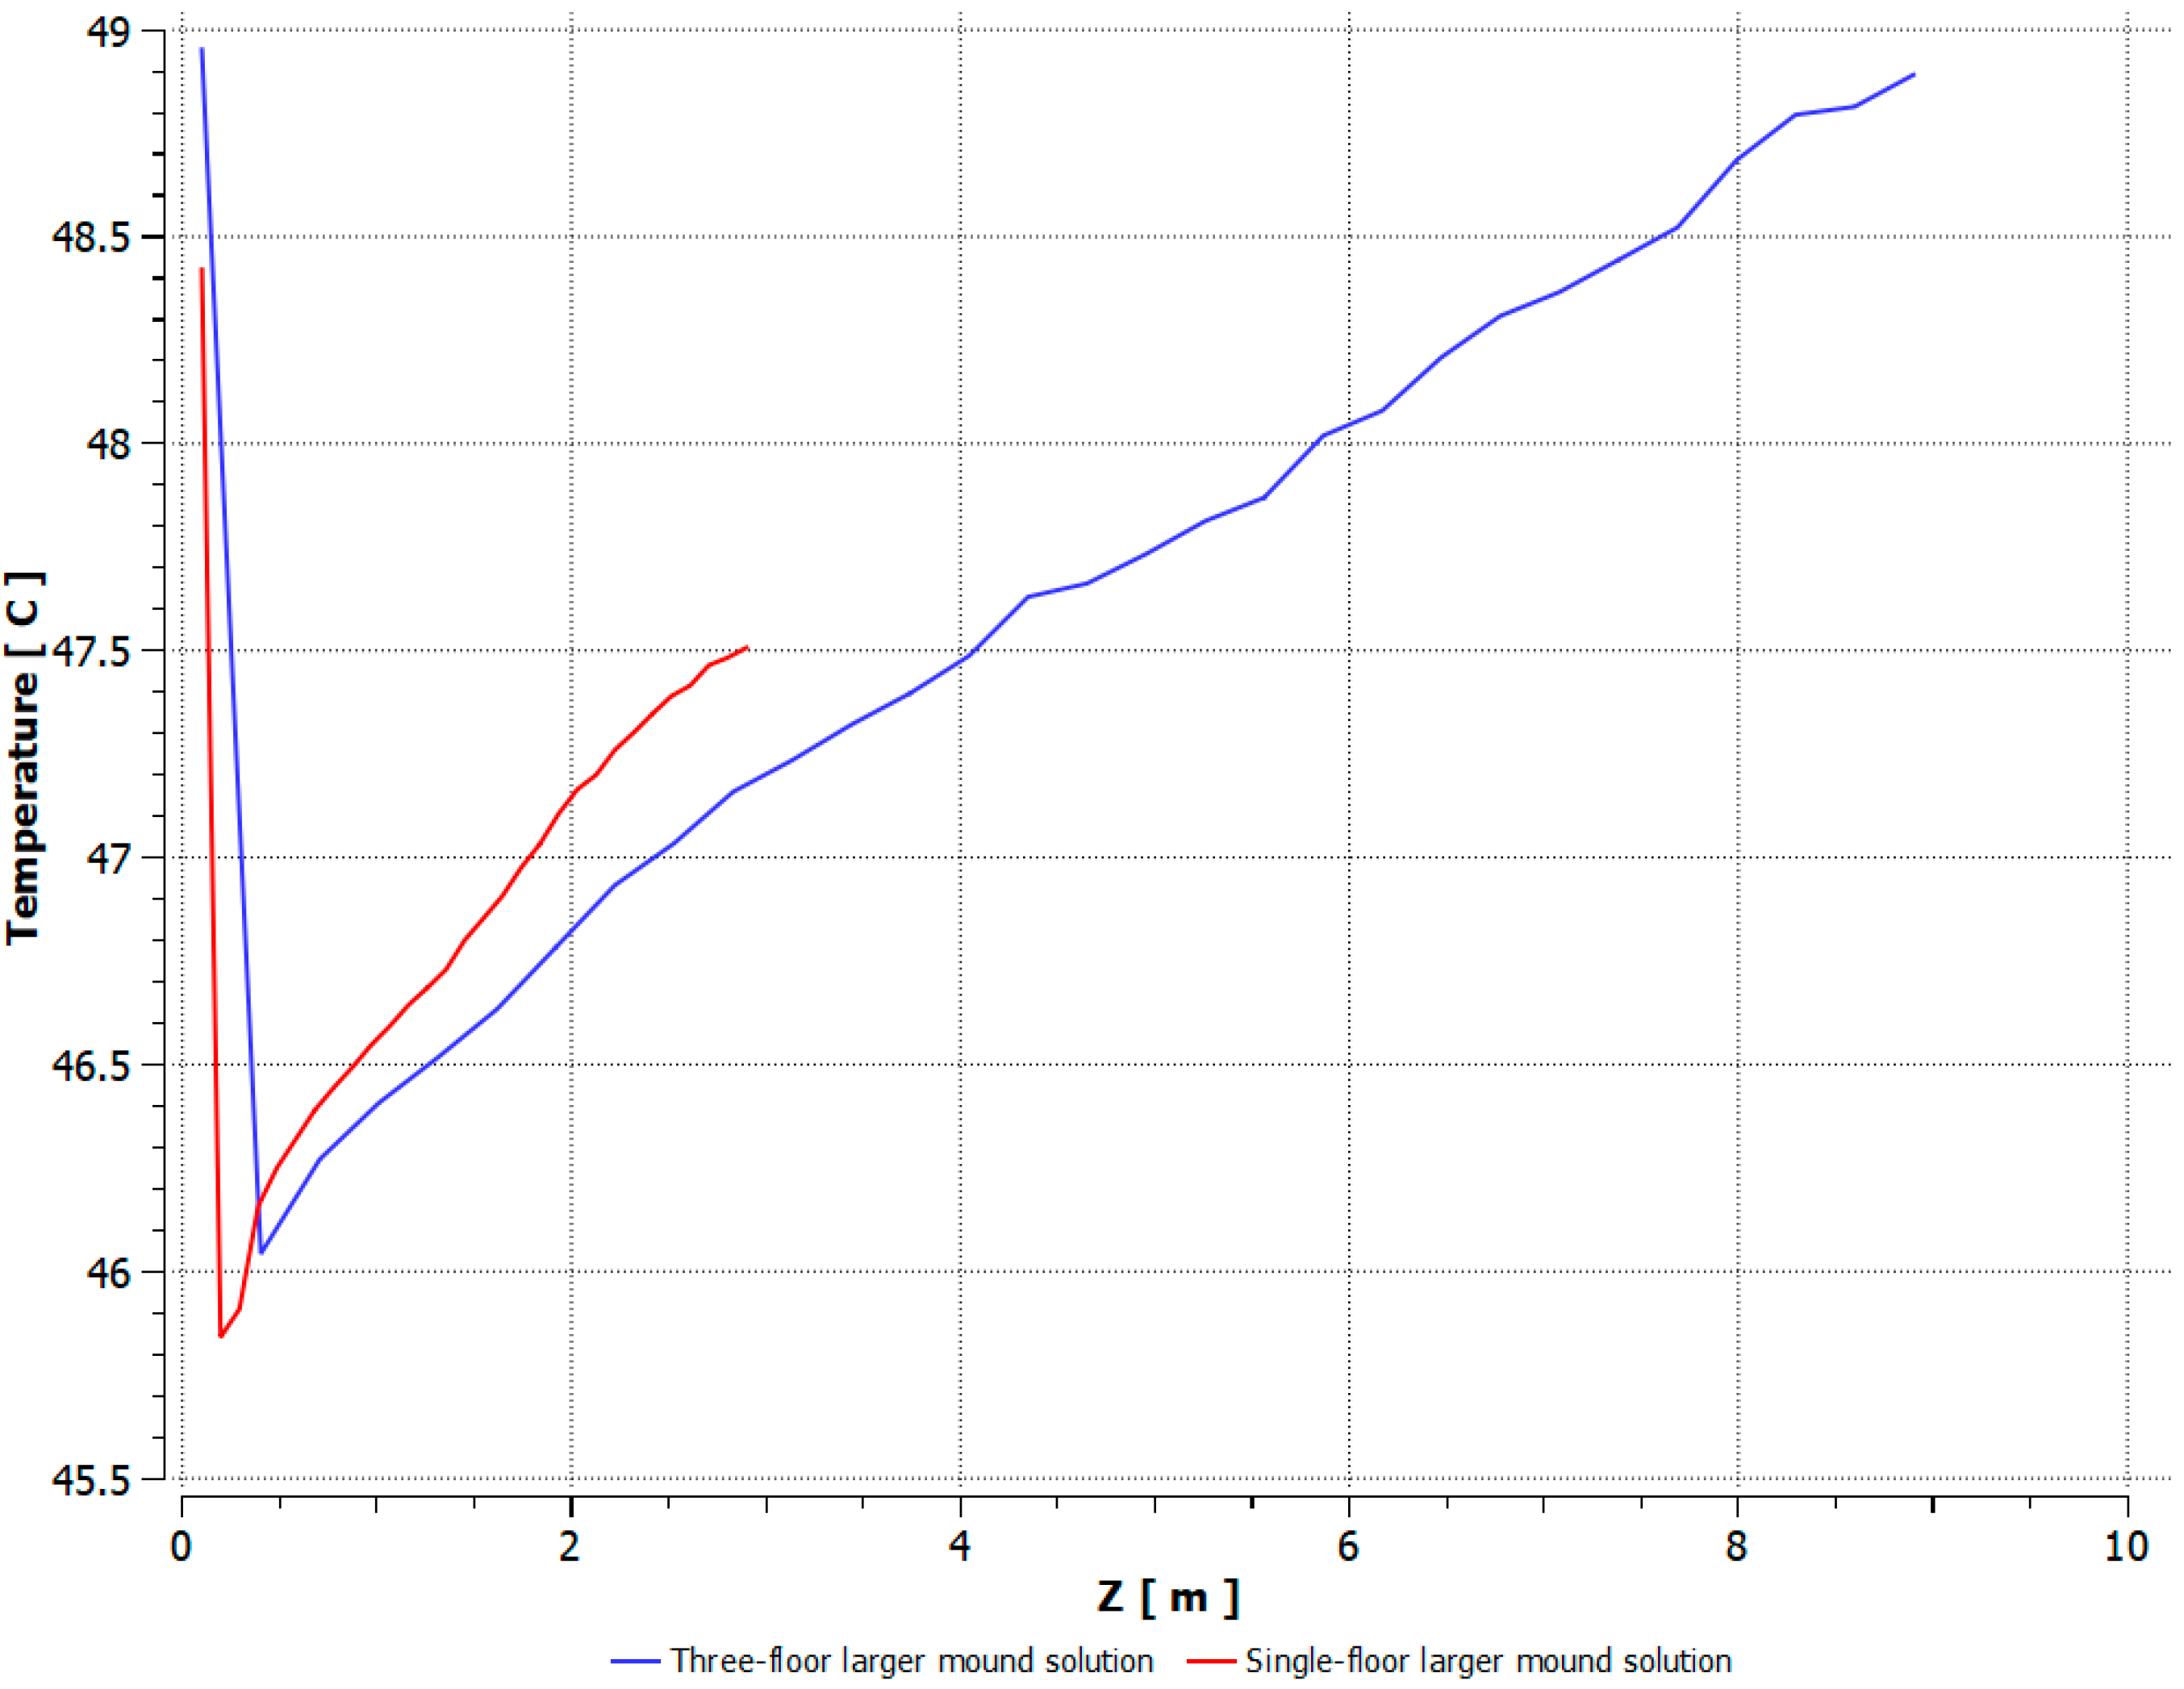
The following candidate points were chosen as the best options as a result of all these optimizations for the wide mound solution. The first design point achieved an inner skin surface temperature of 54° C and a crown area of 1.7 m2, which prioritizes the average inner skin surface temperature objective. The second optimal solution prioritizes minimizing the crown area and achieves a 54.7° C average inner skin surface temperature and a 0.9 m2 crown area. Both optimal solutions were verified by conducting real CFD solutions with geometric dimensions that were approximated to two decimal places. These are the measurements of the first optimal solution, which is called the larger: 0.1 m for the back height, 0.05 m for the back width, 0.42 m for the front height, and 0.02 m for the front width. The second optimal solution, which is called the smaller, has dimensions of 0.1 m for the back height, 0.05 m for the back width, 0.18 m for the front height, and 0.01 m for the front width.
The larger optimal wide mound solution, when calculated with real CFD simulation, shows a little higher average inner skin surface temperature than predicted in the final results. The average inner skin surface temperature was 54.3 °C, whereas the crown area remained the same at 1.7 m
2. On the other hand, the outcome of the actual CFD simulation of the smaller optimal wide mound solution is almost the same as the one that was expected, which was 54.8° C for the average temperature of the inner skin surface and 0.9 m
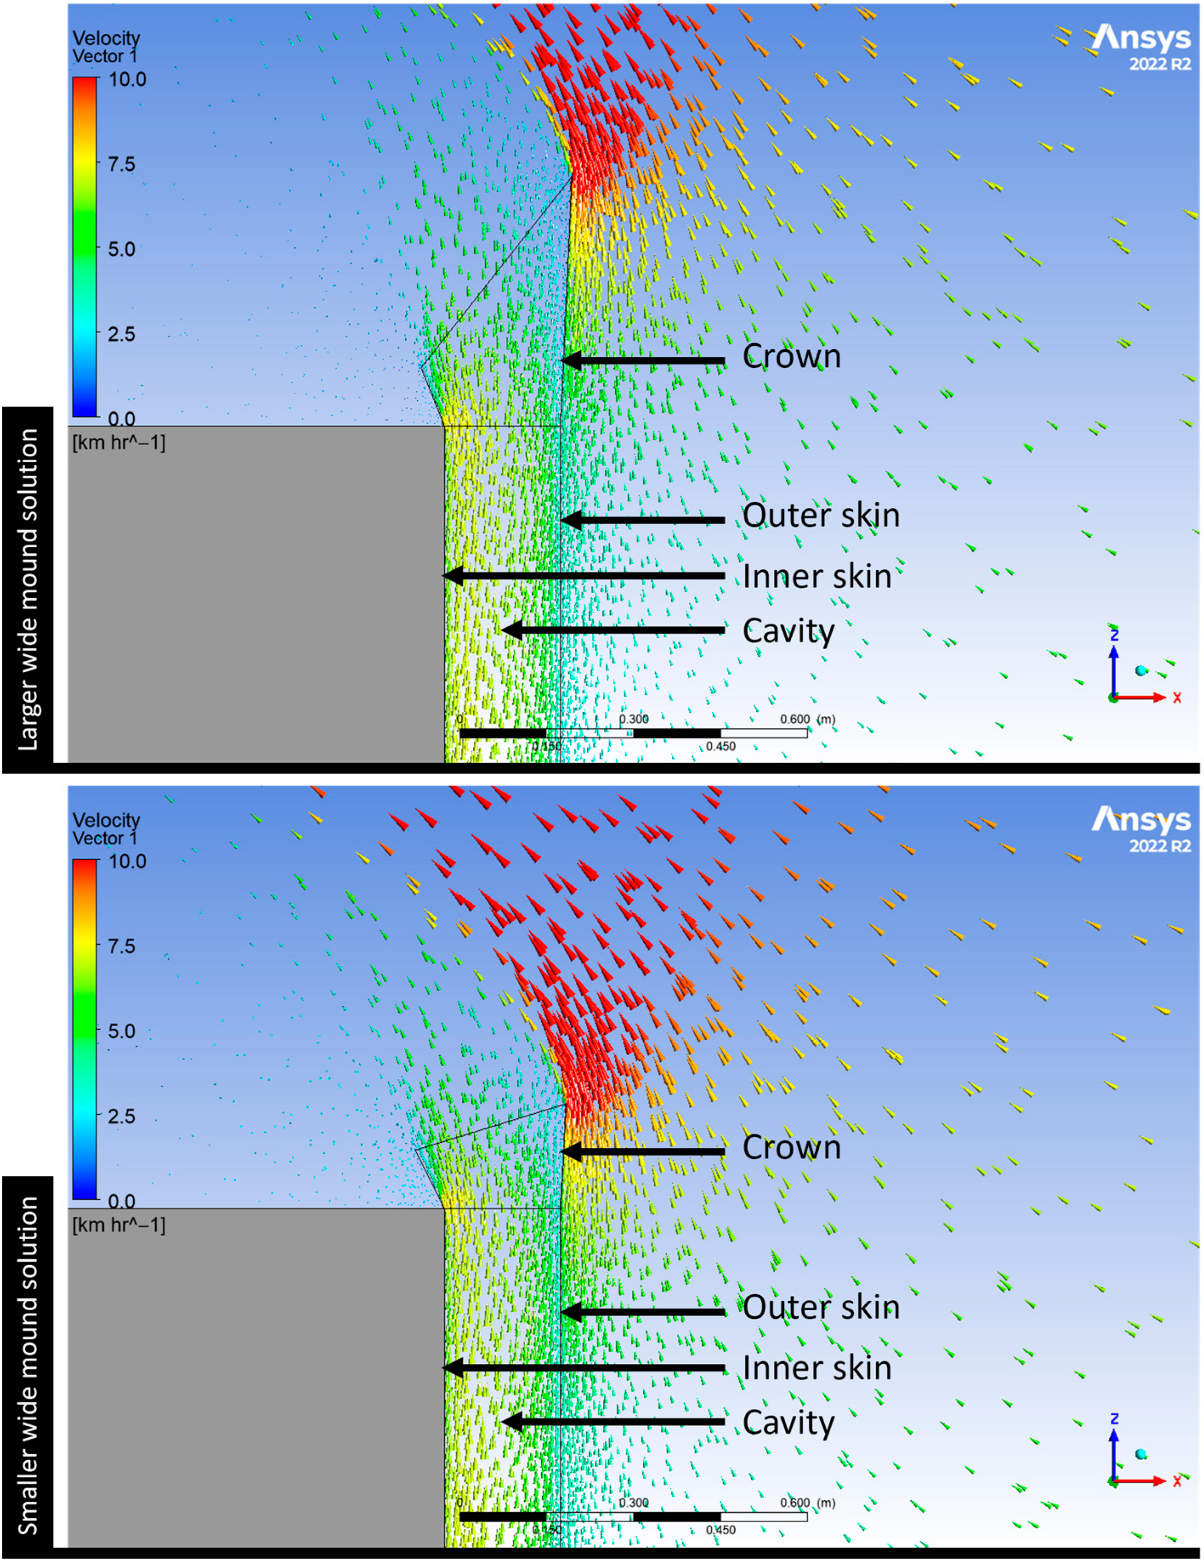
2 for the area of the crown.
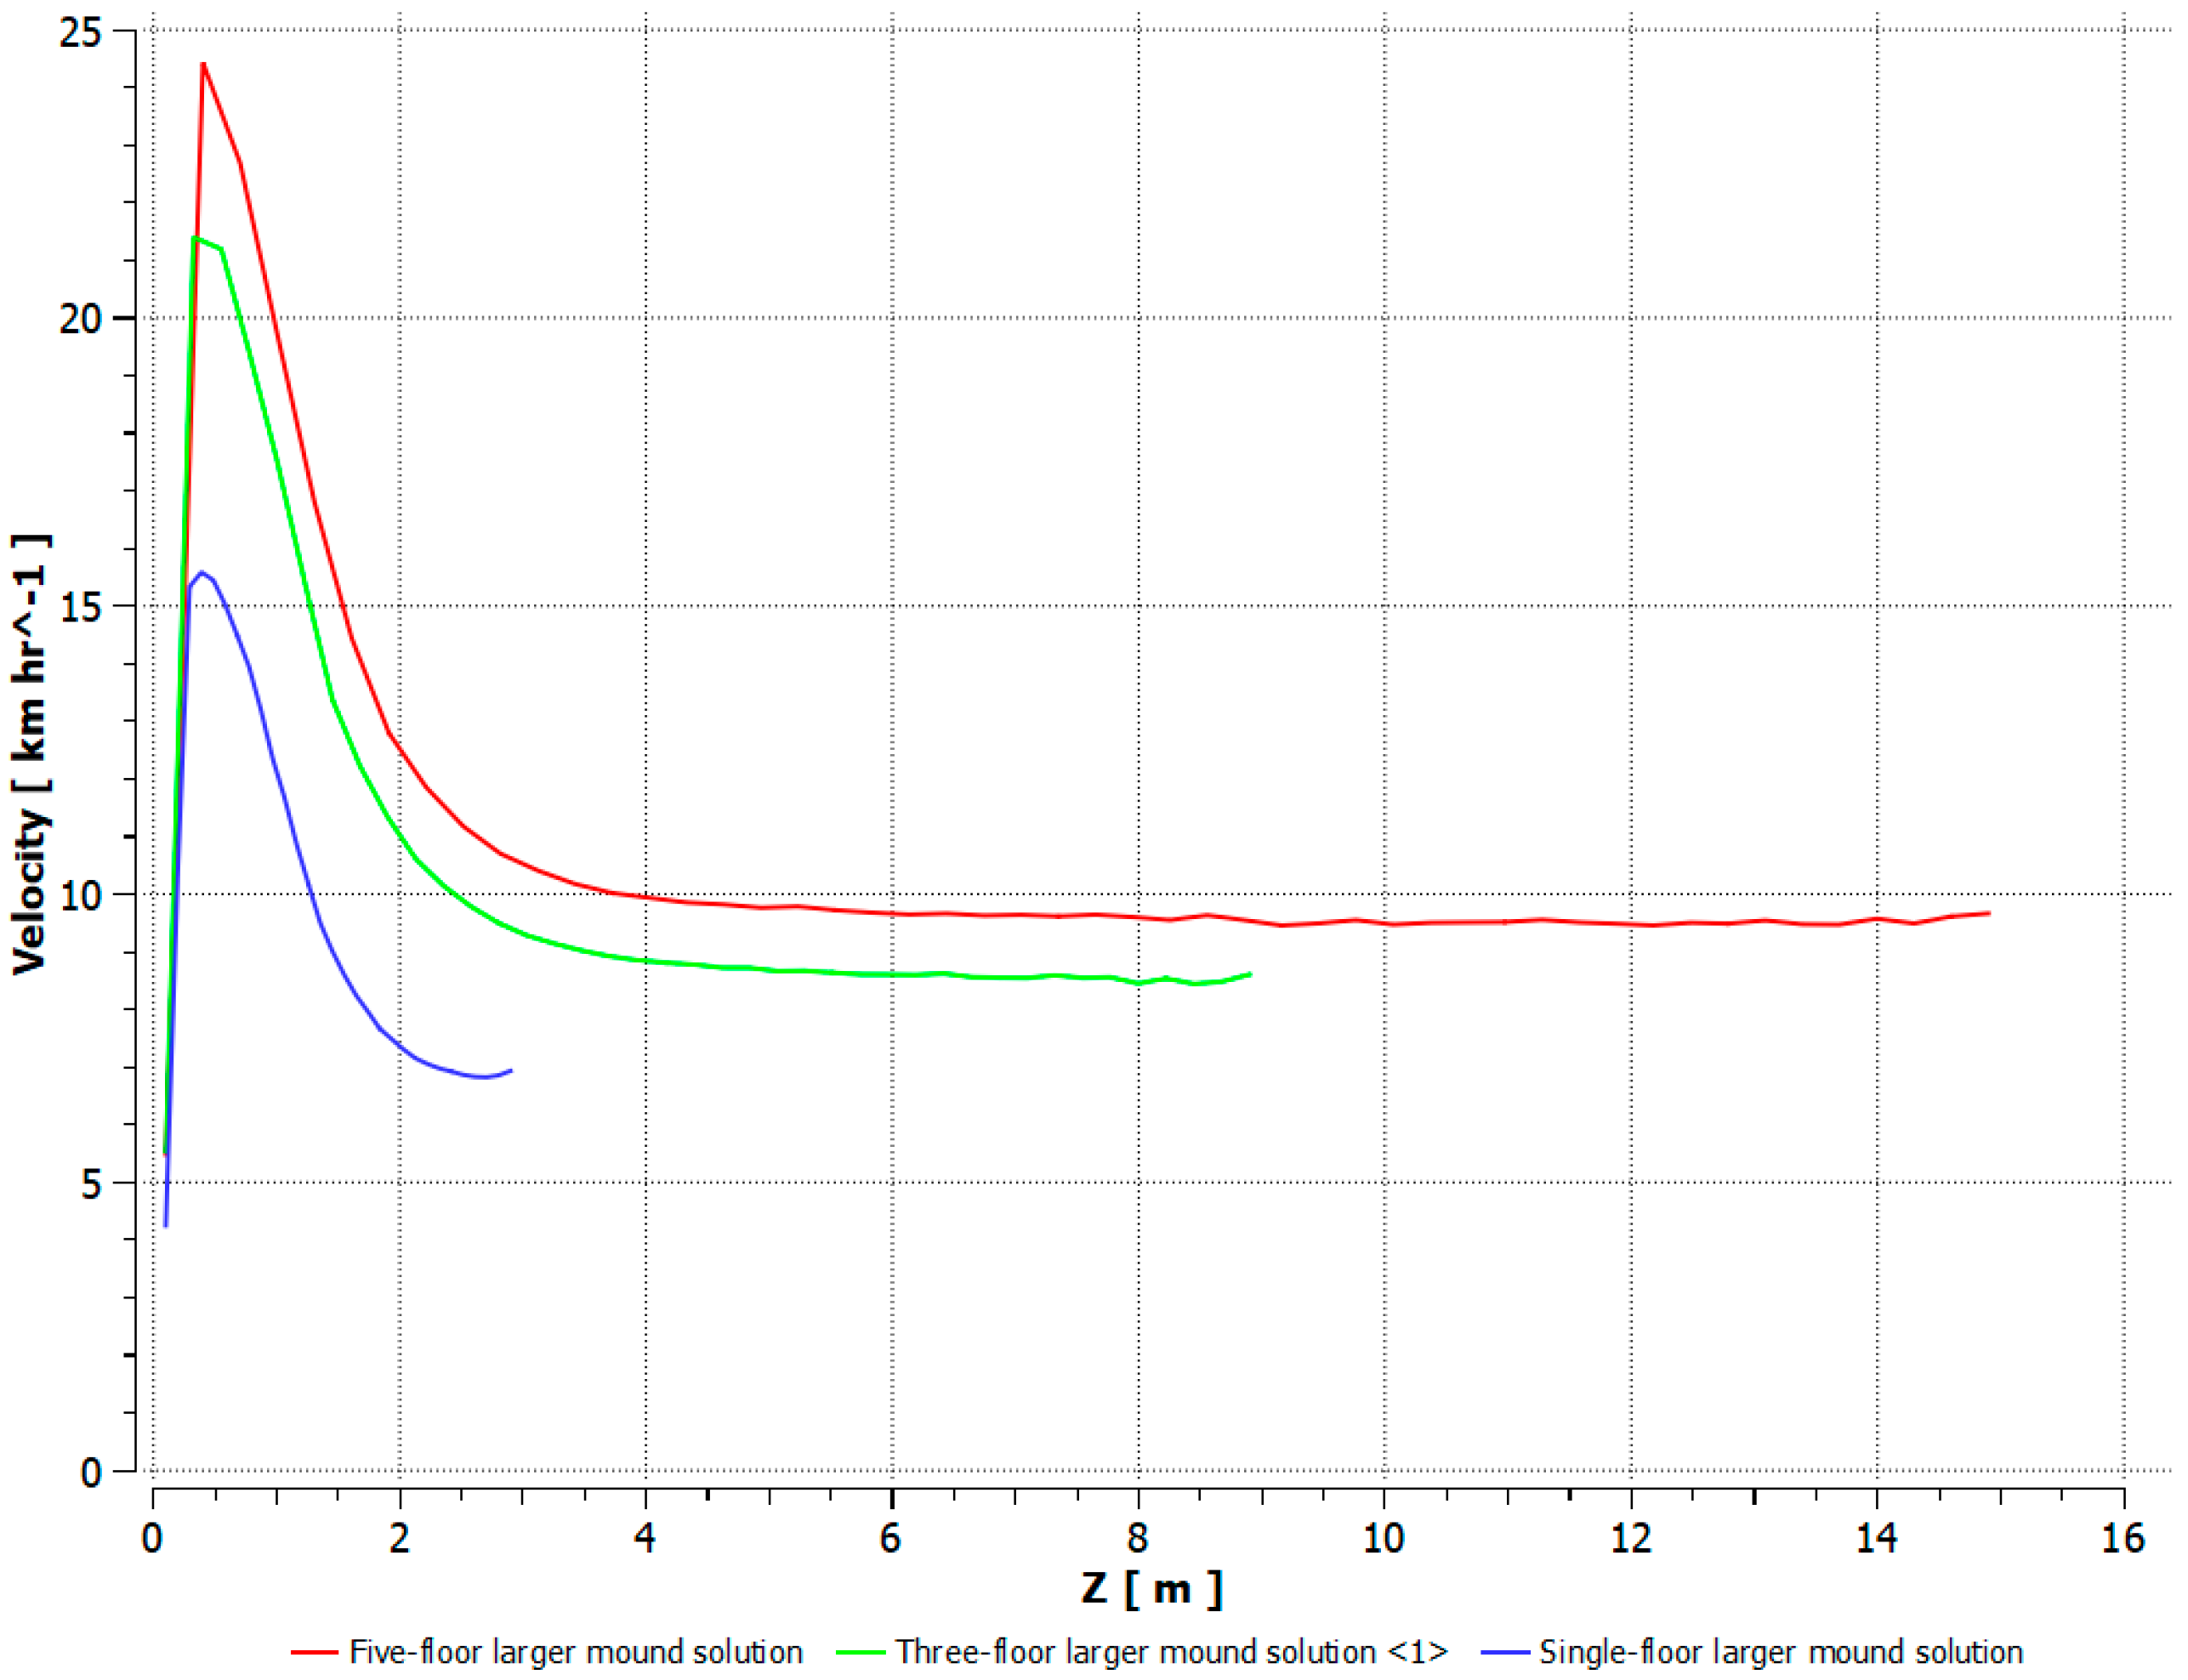
Figure 20 displays a visual comparison between the final two optimal wide mound solutions.
4. Conclusions
This study presented an integrated computational framework for the multi-objective optimization of biomimetic opaque ventilated façades (OVFs) tailored to hot arid climates. By combining parametric modeling, CFD simulations, and machine learning-based surrogate models within the Ansys DesignXplorer environment, the research demonstrated an efficient and scalable approach for optimizing complex façade systems. A key contribution of this research is the novel application of machine learning algorithms to accurately predict CFD simulation outcomes for opaque ventilated façades. This predictive capability allowed for the generation and evaluation of a vast number of design alternatives without the need for time-intensive real-time simulations. Additionally, the study established a direct link between parametric modeling tools and CFD simulations, enabling the development of a fully computationally optimized façade design grounded in performance-based criteria.
This framework offers several advantages, including reduced computational time, the ability to evaluate a large number of design configurations, and strong predictive capability. However, some limitations remain, particularly the restricted access to internal machine learning parameters and reliance on automated algorithms within the software environment. Recognizing these aspects helps guide future improvements in the transparency and adaptability of similar optimization workflows.
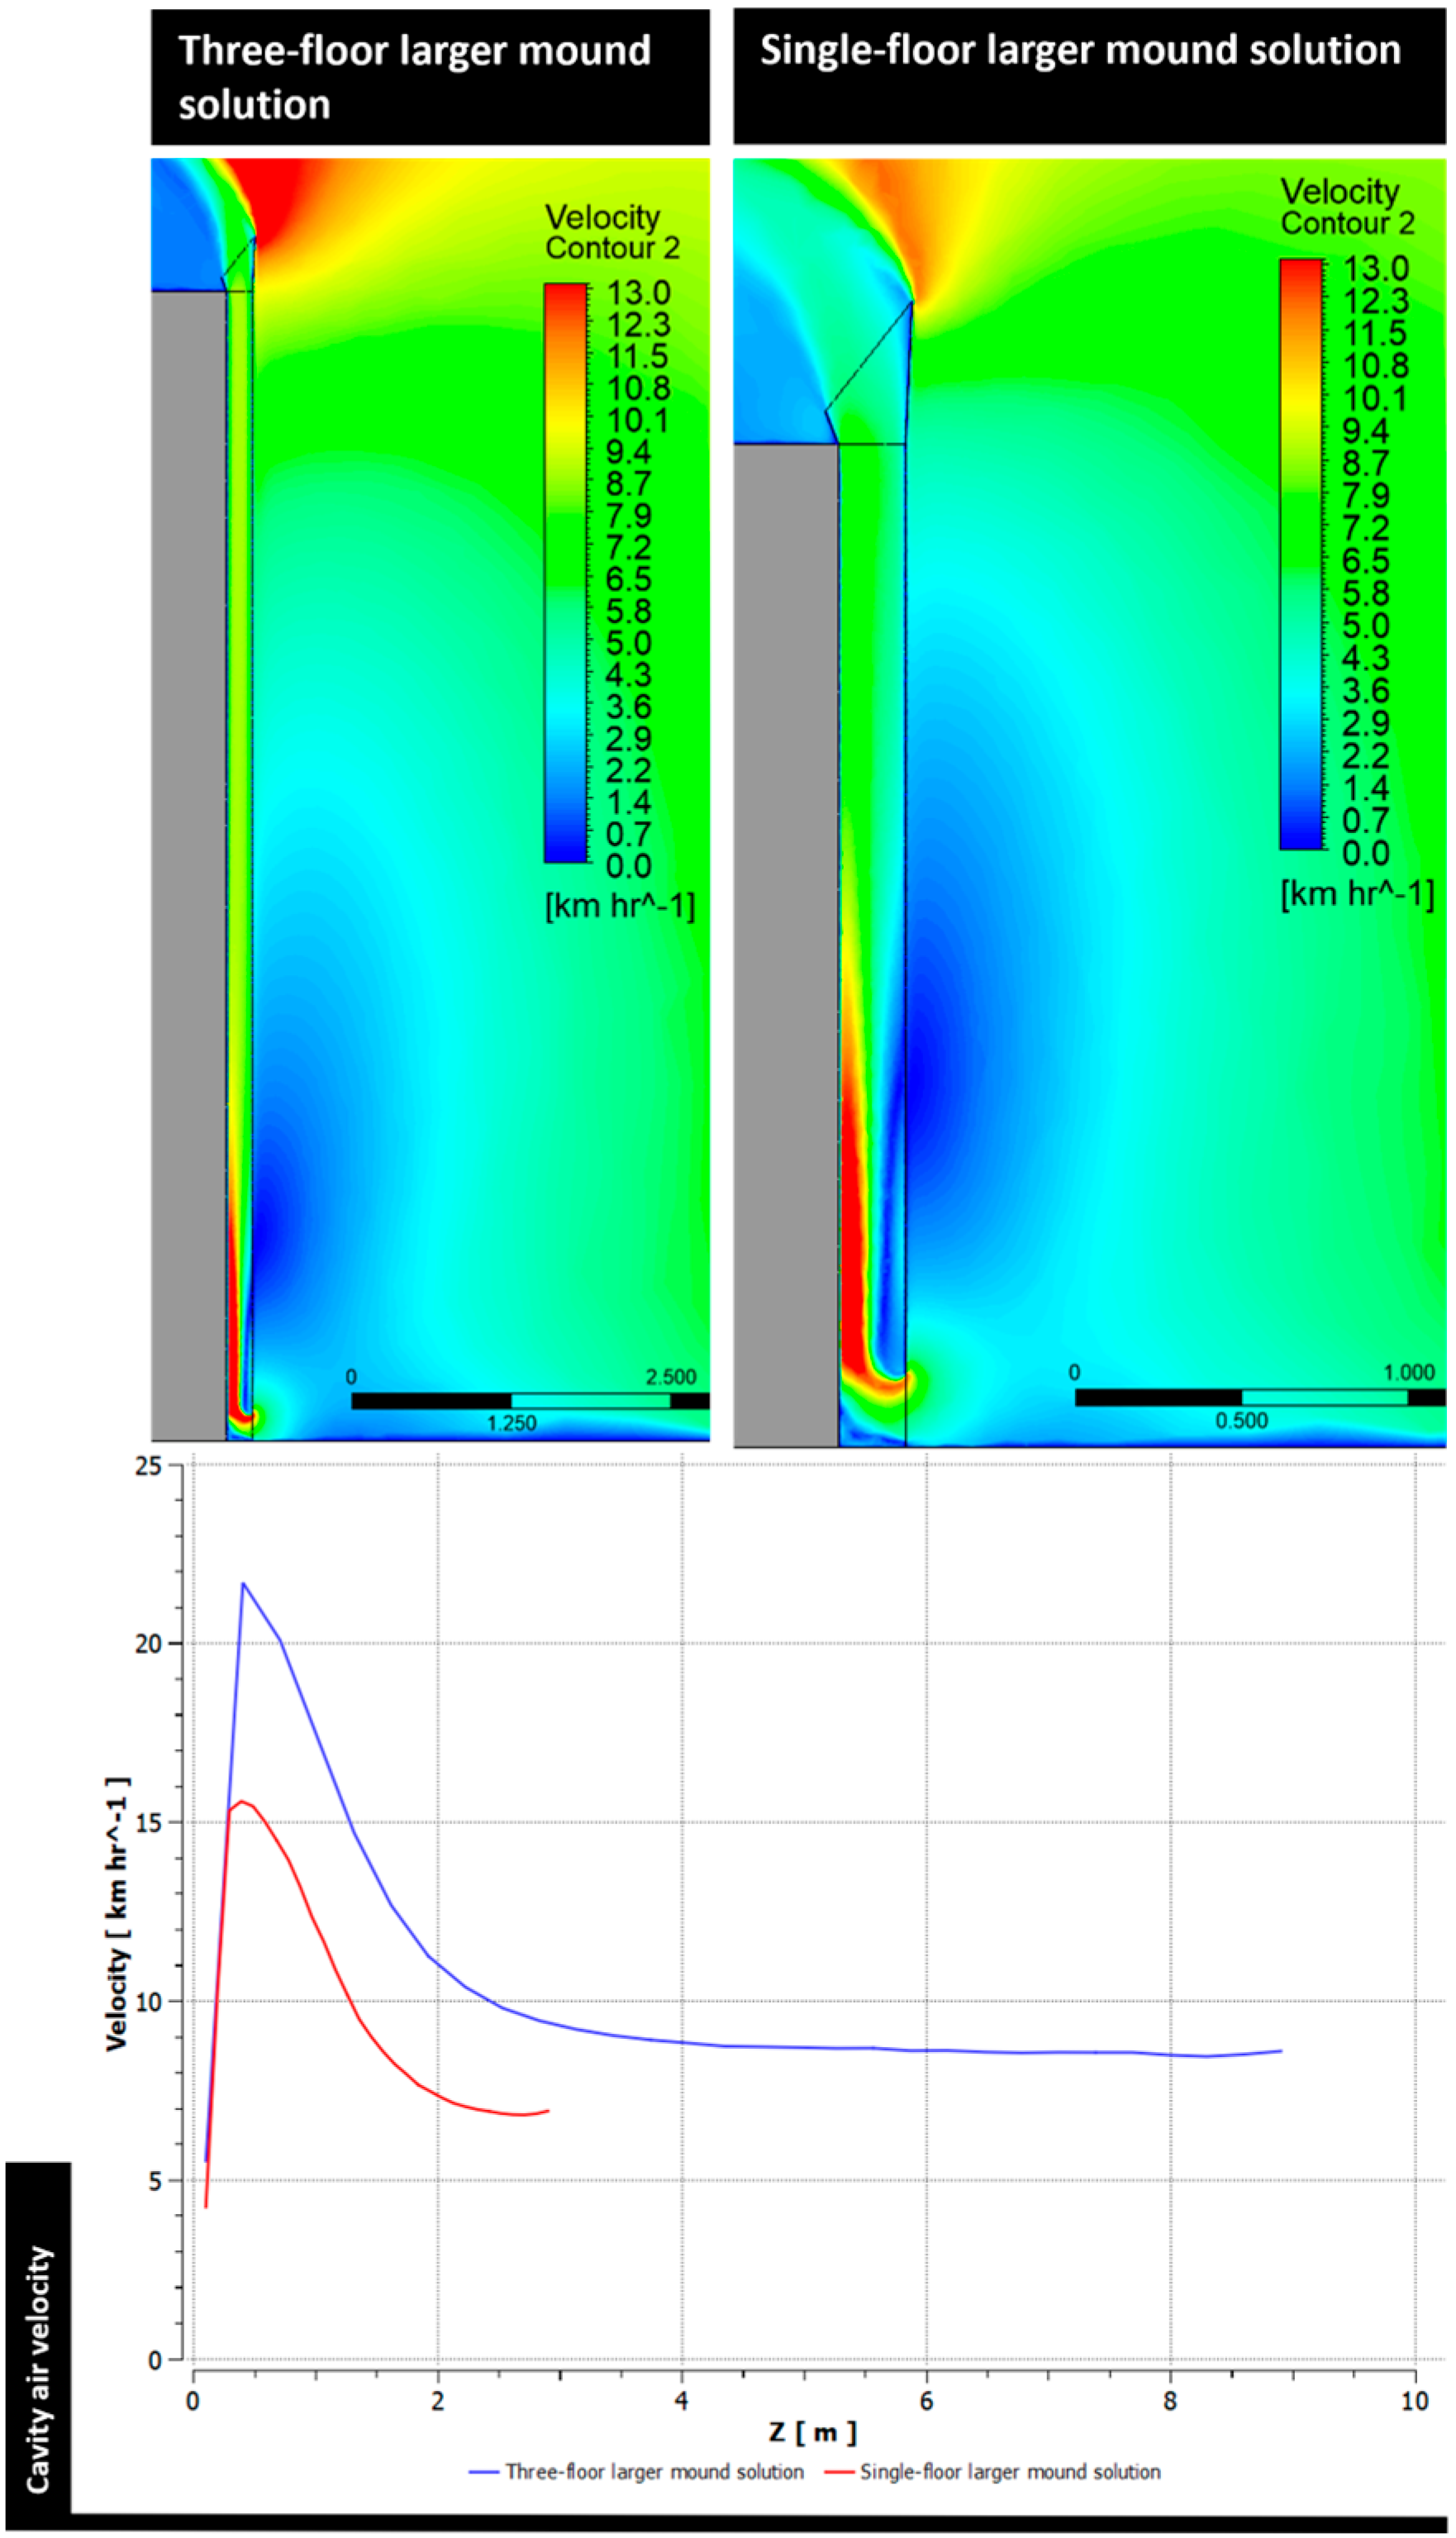
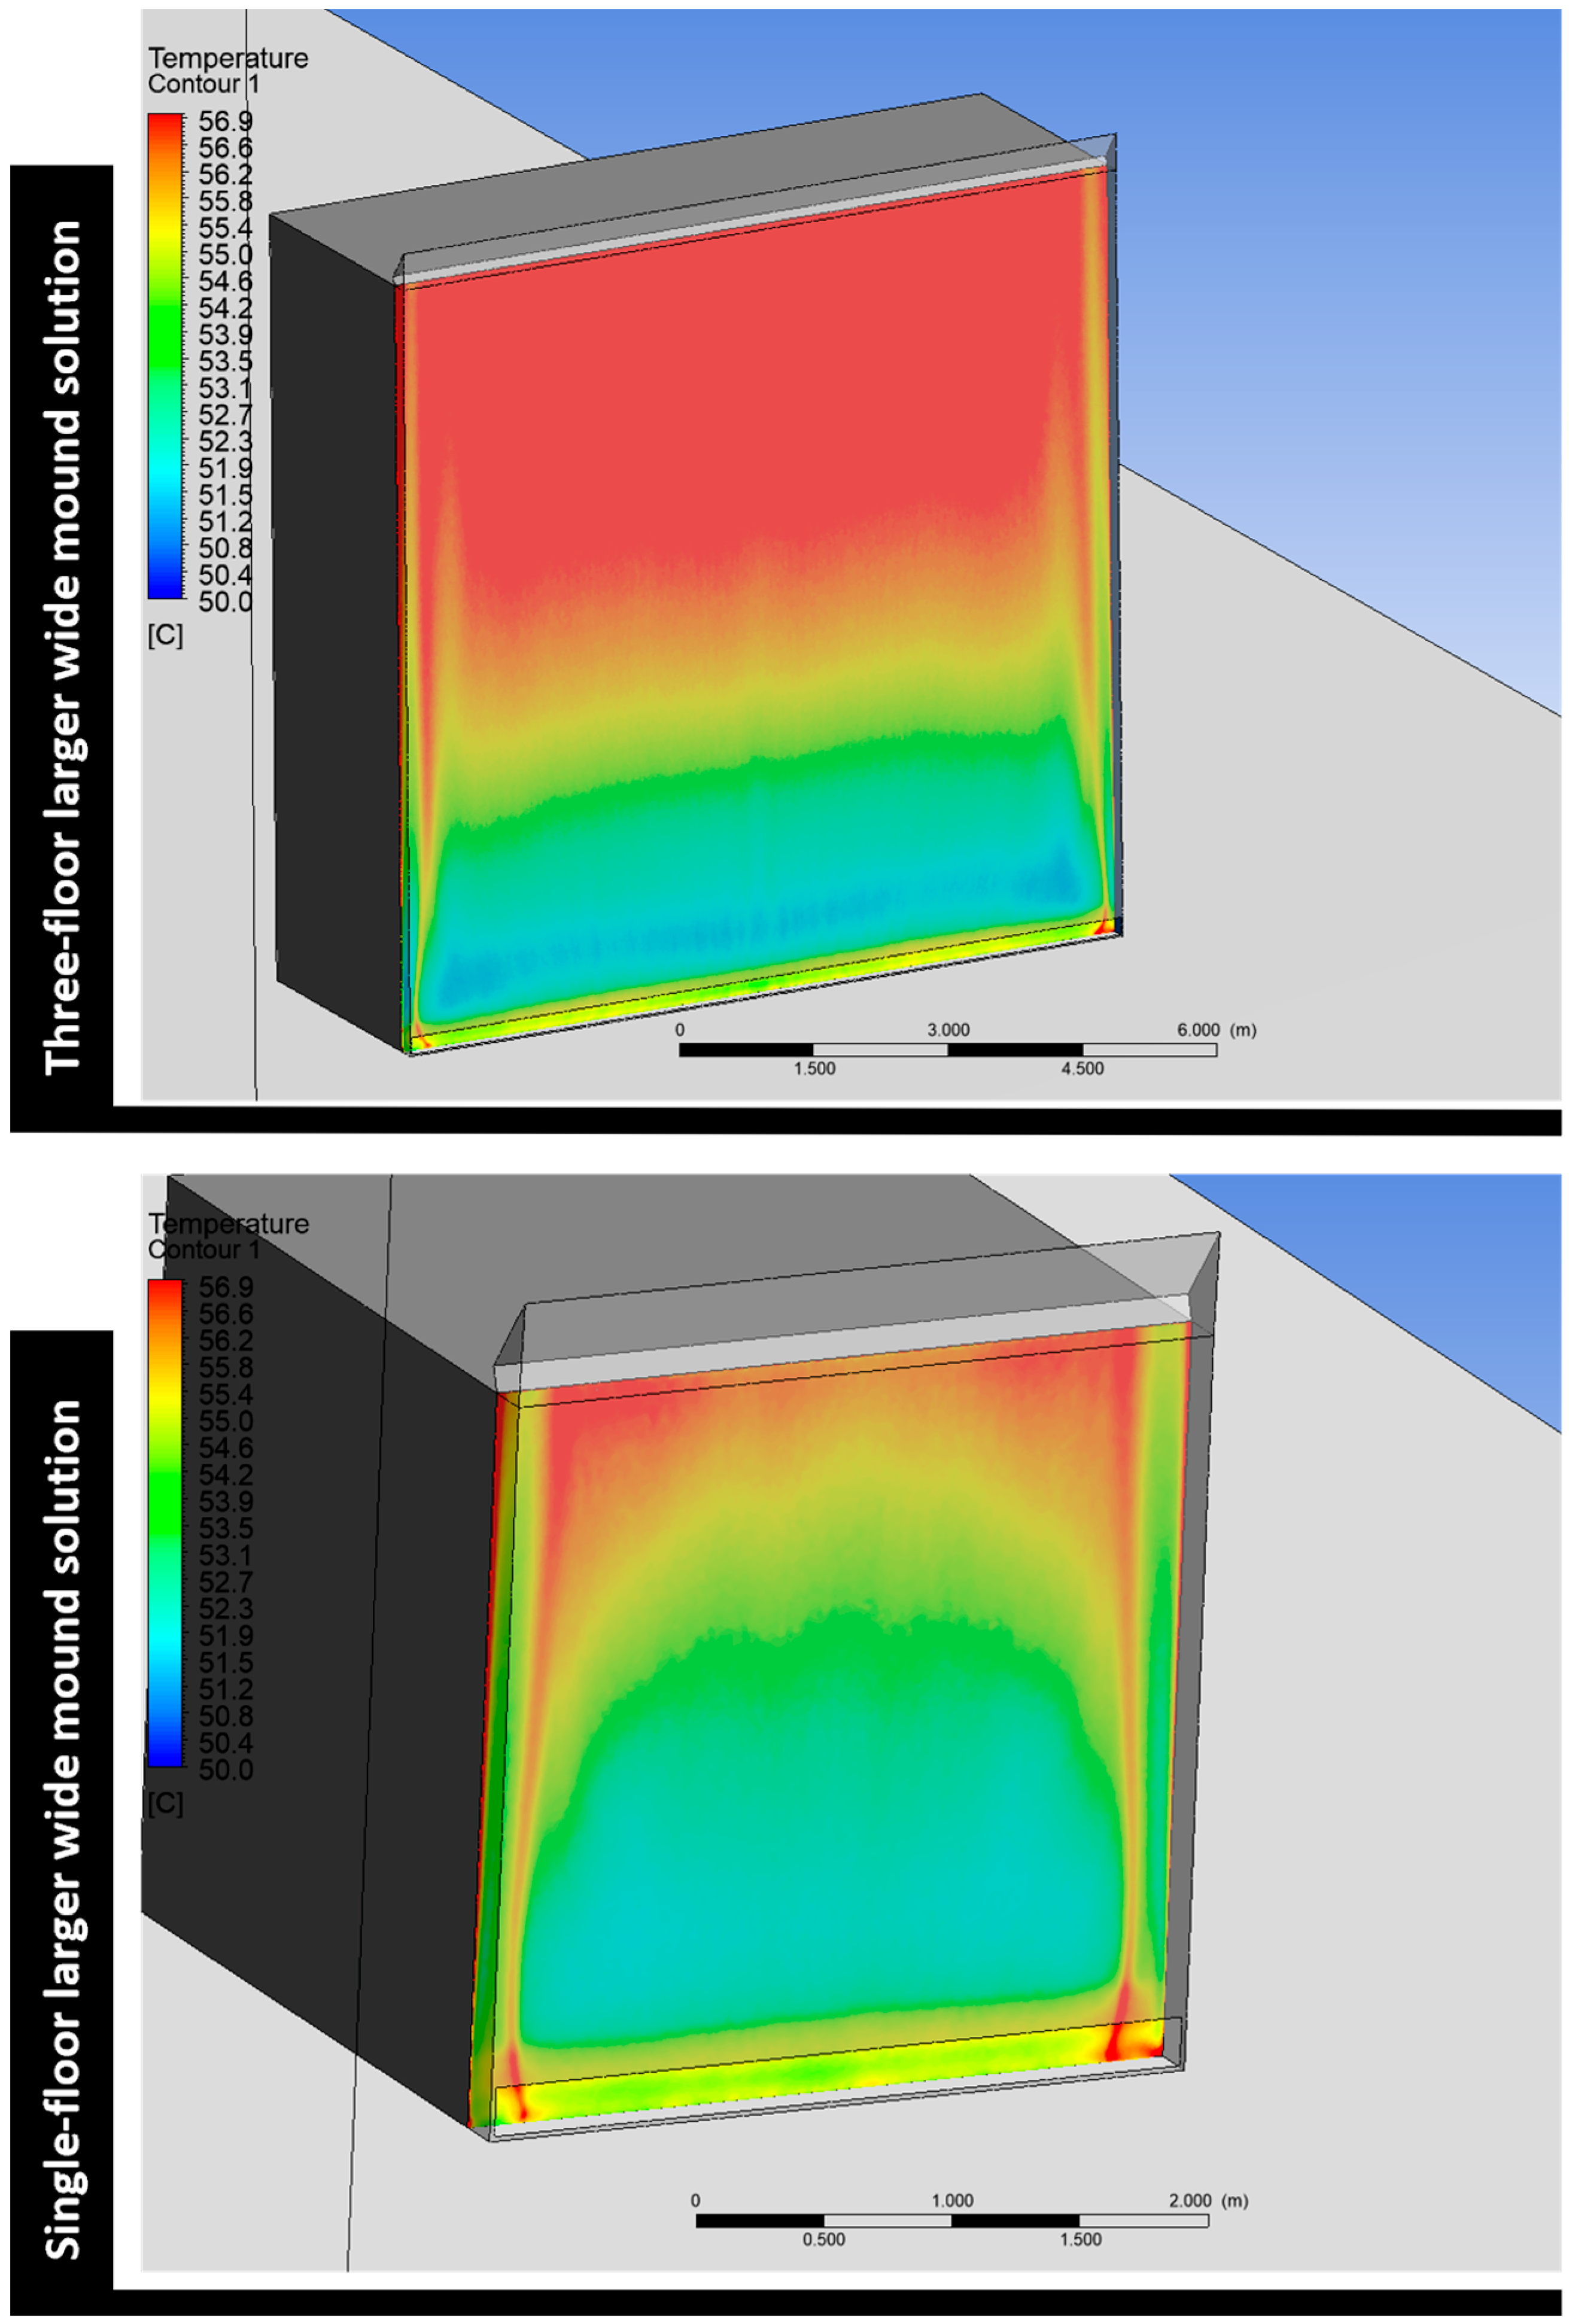
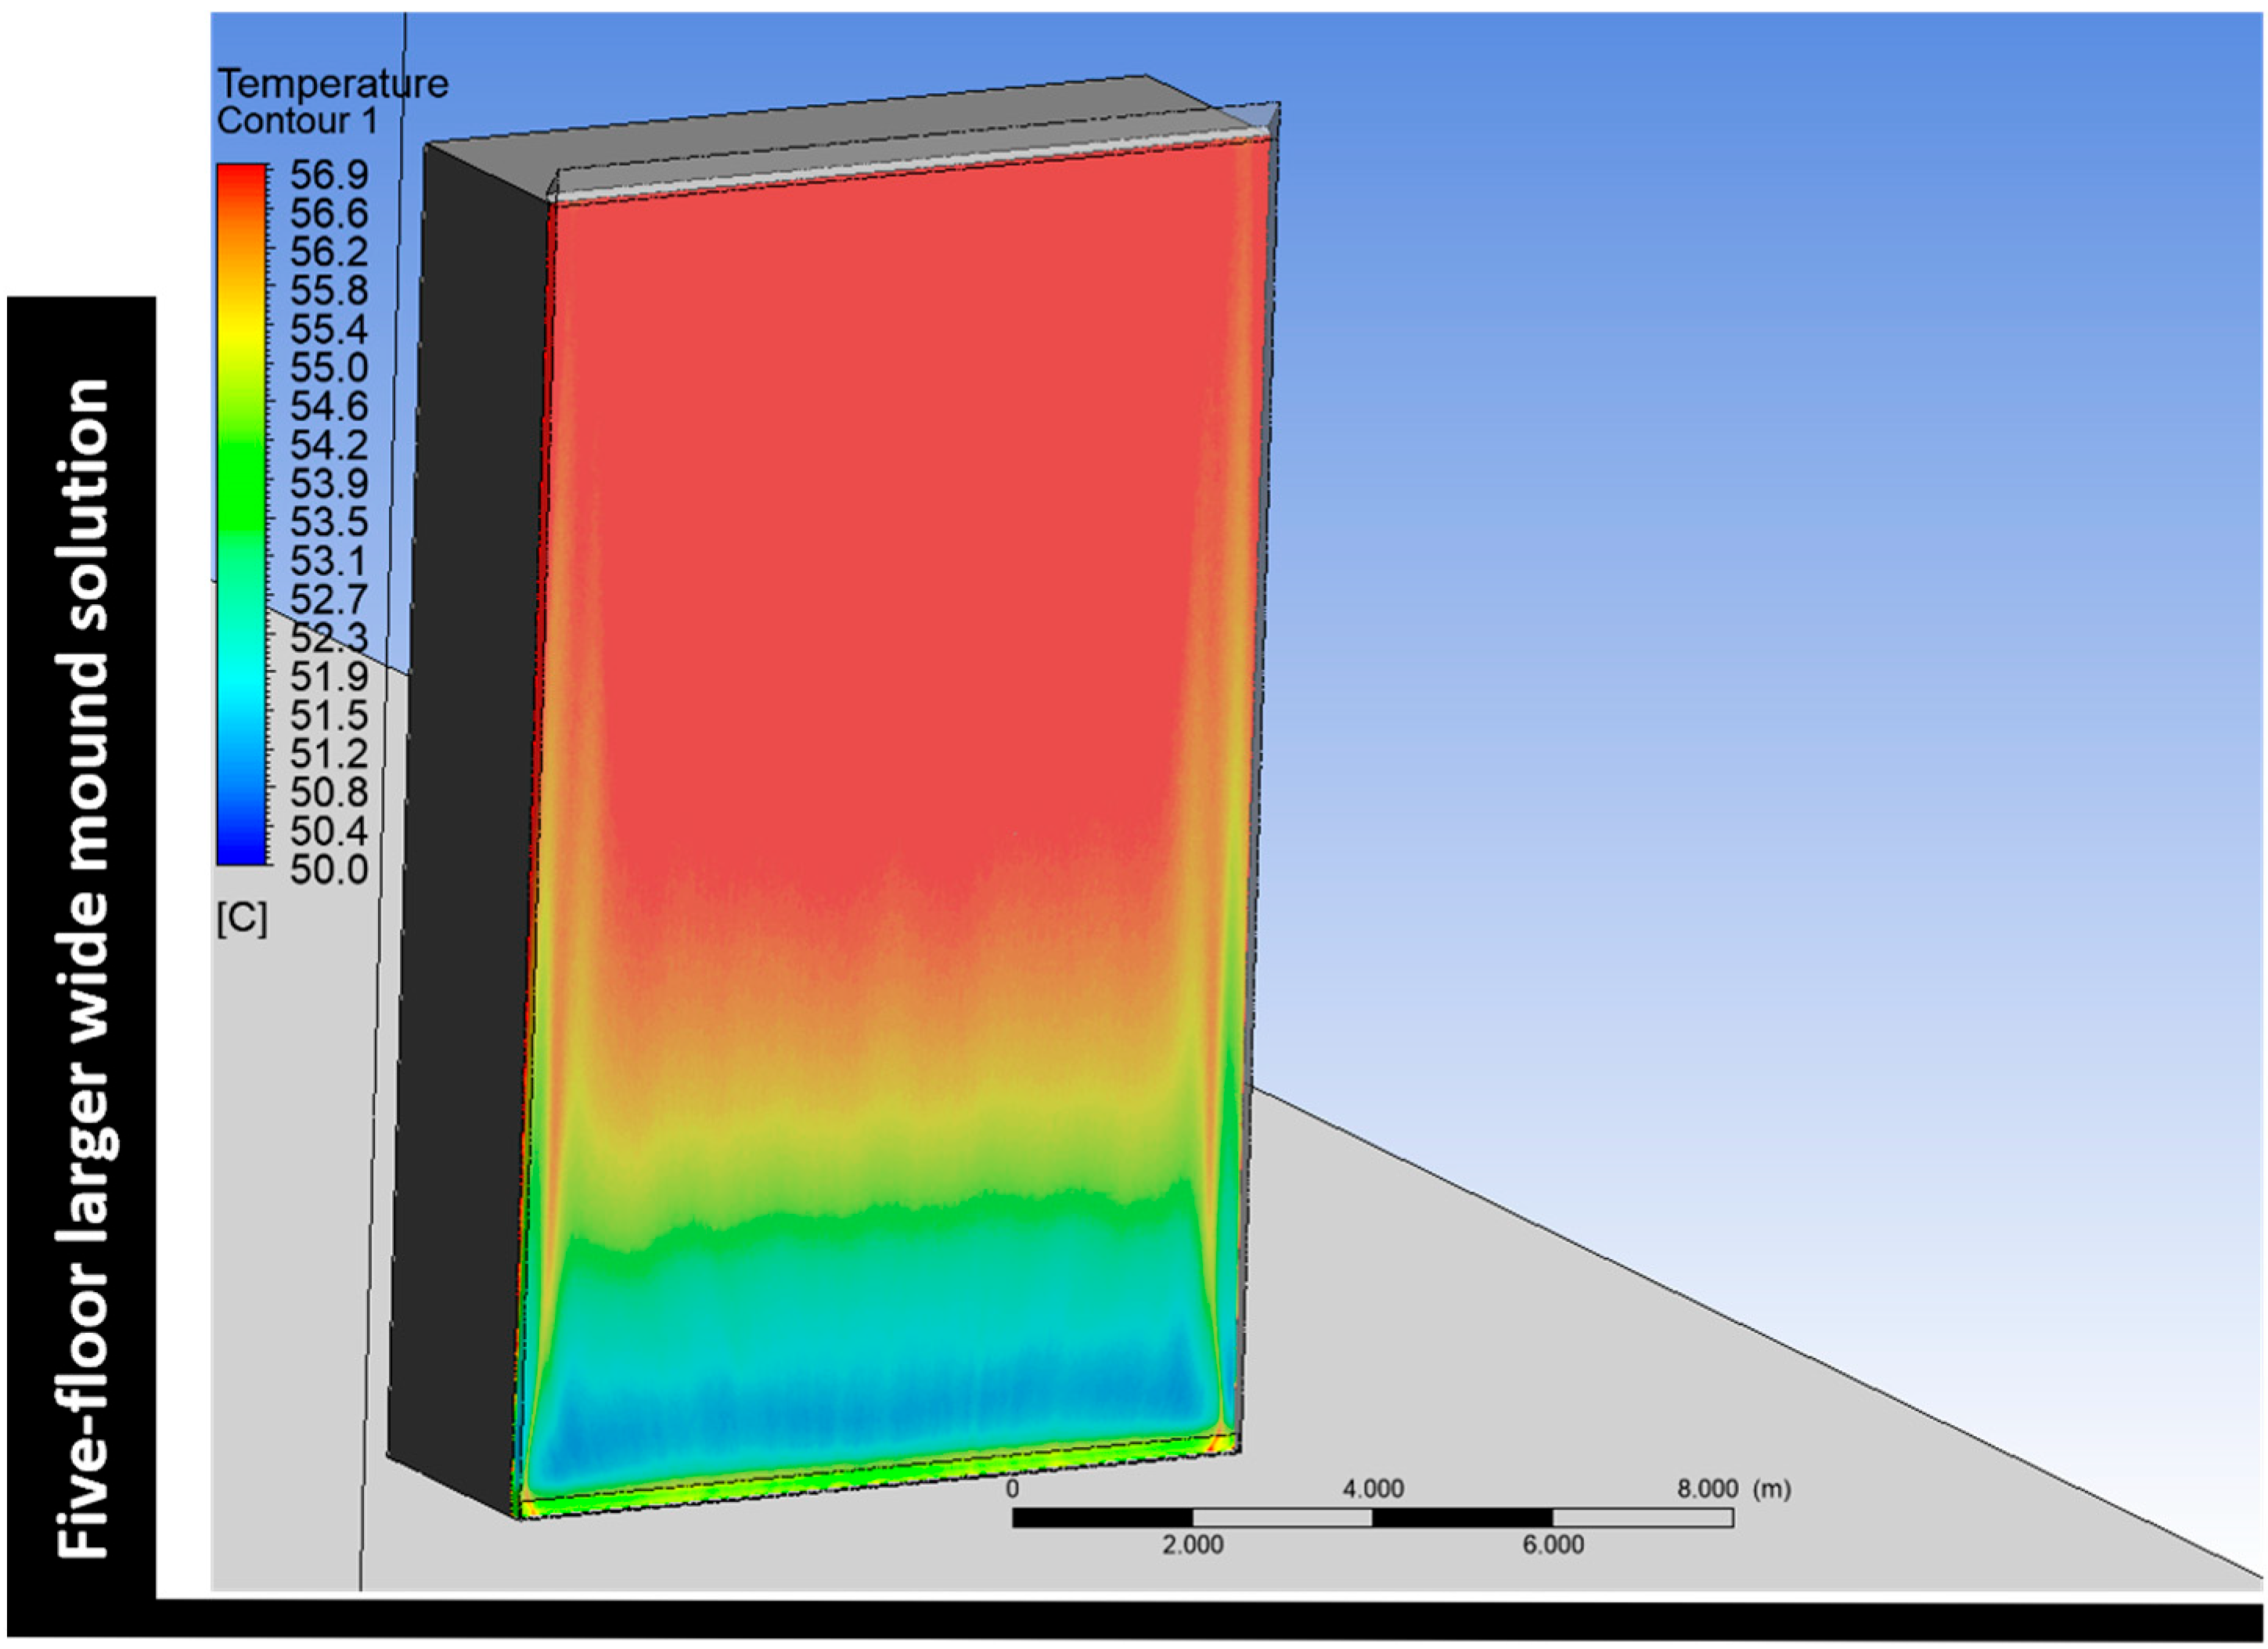
The optimization process identified the larger wide mound configuration as the most effective solution, demonstrating superior thermal performance compared to the original bio-inspired geometry. Subsequent simulation scenarios and building-scale applications confirmed the practical viability of this biomimetic OVF design. When implemented in low-rise commercial buildings in hot desert regions, the design significantly reduced the inner skin surface temperature and enhanced overall thermal performance. Moreover, it proved to be constructible using conventional façade techniques and adaptable to various architectural styles without requiring alterations to the external appearance.
Future research should focus on refining airflow control strategies, such as adjusting vent sizes and introducing intermediate or adjustable vents. Further investigation into long-term energy performance, real-world prototyping, and integration with smart building systems will also help advance the applicability of biomimetic OVFs in diverse climatic contexts.
Overall, this research advances the field by introducing a replicable, performance-driven workflow that integrates bio-inspired design, simulation-based optimization, and machine learning. The findings support the development of high-performance building envelopes in extreme climate conditions and open avenues for further exploration into lifecycle performance, real-world prototyping, and broader architectural integration.
