Abstract
Curtain grouting is widely used to reduce the permeability of dam foundations, yet forecasting cement intake remains challenging because flow pathways are governed by the three-dimensional connectivity of rock fractures. We develop a hybrid framework that explicitly embeds 3D fracture connectivity into data-driven prediction. A discrete fracture network (DFN) is constructed and traversed using depth-first search (DFS) from each grouting hole segment to capture both direct and multistep connections. Six connectivity descriptors are computed—the number of reachable fractures (N), average inclination (I), average dip angle (D), cumulative connected volume (V), average radius (r), and average width (w)—and combined with construction parameters as model inputs. Cement intake is predicted using an integrated model that combines a Restricted Boltzmann Machine (RBM)-pretrained multilayer perceptron with channel-wise squeeze-and-excitation (SE) attention, where key hyperparameters are optimized via a genetic algorithm (GA). Applied to a curtain-grouting project (448 segments), the connectivity-aware model improves agreement with observations over a no-connectivity baseline: the correlation coefficient (R) increases from 0.938 to 0.972, while mean absolute error (MAE), mean absolute percentage error (MAPE), and root mean square error (RMSE) decrease by 27.1%, 12.2%, and 32.8%, respectively. Ablation studies validate the contributions of each component, confirming that RBM pretraining enhances generalization, SE attention improves feature selection, and ensemble aggregation stabilizes predictions. Compared to four optimized baseline models (SVR, RF, ELM, and LSTM), the proposed integrated method achieves improvements of 3–34% in R and reductions of 22–55% in MAE, 31–66% in RMSE, and 2–48% in MAPE on the held-out test set. This model provides engineers with a simple, cost-effective tool for accurate predictions to support better decision-making in grouting.
1. Introduction
To support China’s dual-carbon targets, the construction of hydropower and pumped-storage power plants is accelerating []. These facilities are frequently located in regions with complex geology. If the dam foundation rests on untreated bedrock, seepage may occur and compromise structural stability. Cement grouting is an effective technique for sealing rock fractures and improving the mechanical integrity of such foundations []. Cement intake refers to the amount of cement injected under pressure to fill fractures []. It is a pivotal parameter for grouting design and control, directly affecting efficiency and cost. However, because the grouting process is opaque in situ, accurate determination of cement intake is challenging. As a result, substantial research has focused on estimating cement intake to ensure project success at individual sites [].
Researchers have approached cement-intake prediction through empirical analyses [], numerical simulations [,], and theoretical models []. Ajalloeian et al. [] assessed permeability at the Kavar and Sheshpir Dam foundations using a secondary permeability index and rock-mass parameters. Zhu et al. [] devised a numerical simulation technique specifically tailored for the fluid–structure interaction during the grouting process. Because cement intake depends on numerous factors, including construction processes, operational parameters, and geological conditions, its prediction constitutes a high-order nonlinear regression problem []. The evolution of artificial intelligence has provided nonintrusive and cost-effective tools for this task. To solve the difficult problem of nonlinear mapping between construction parameters and cement intake, Yang [] adopted the mean method, the linear regression method, and the back-propagation neural network method to estimate the cement intake of the Li-Yu-Tan Dam. Based on geological parameters and grouting construction parameters, Öge [] and Li et al. [] used an adaptive neuro-fuzzy inference system to predict cement intake and grouting efficiency. Based on the rock fracture properties and foundation grouting data of the Bakhtiari and Karun-4 Dam sites, Rahimi et al. [] verified the effectiveness of statistical analysis and artificial neural networks in the prediction of cement intake and encouraged scholars to adopt neural networks to establishing the relationship between cement intake and its influencing variables. To overcome the limitations of small sample data sets in practical engineering, Niu et al. [,] predicted the unit grouting quantity and grouting volume of karst curtain grouting. Deng et al. [] used cement intake as a crucial parameter to characterize the groutability of a rock fracture and predicted the groutability based on the hybrid grey wolf optimization (HGWO) and support vector machine (SVM) techniques. Based on fractal theory and the mixed kernel function SVM, Liu et al. [] formulated a control criterion and a control method for cement intake.
The quality of grouting construction largely depends on rock fractures, particularly whether fractures capable of forming leakage pathways can be adequately filled and sealed by cement grout [,]. The aforementioned research used fracture or geological parameters as important input parameters for the prediction of cement intake, which provides the references for this study. Seepage through rock foundations typically occurs through networks of conductive fractures []. Nevertheless, many analyses emphasize only those fractures that intersect the grouting hole directly, while neglecting fractures that connect indirectly through intermediate branches. This overlooks the broader implications of fracture connectivity for hydraulic behavior. In routine design, only fractures that directly cut a hole are considered; at our site, this would reduce Figure 1 to “Fracture No. 1”. Specifically, Fracture No. 2 intersects with Fracture No. 1 and acts as a critical “bridge,” linking fractures No. 3 through 17 via direct or intermediate connections that control storage and leakage. We therefore frame cement intake prediction as a problem of reachable connectivity, not simply of local intersections.
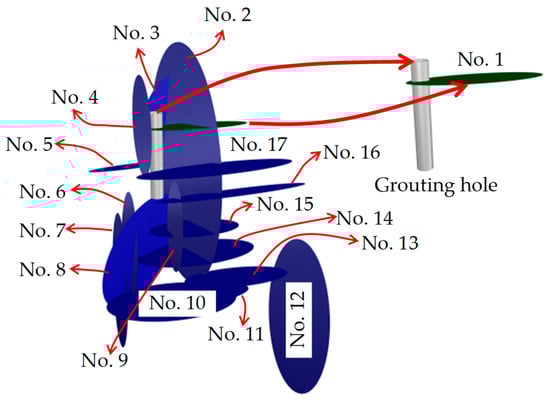
Figure 1.
Relationship between fractures and the grouting hole.
The discrete fracture network (DFN) methodology is widely used to analyze connectivity in fractured rock []. Xu et al. [] leveraged the DFN approach to develop a technique for calculating the connectivity index and explored its correlation with the percolation potential of fractured rocks. Gothäll [] examined the effects of dilation in parallel fractures under high-pressure grouting conditions. Alghalandis et al. [,] introduced a connectivity field to characterize the spatial variation in connectivity. Deng et al. [] proposed a computational fluid dynamics (CFD) simulation approach for dam foundation grouting. Zhu et al. [] investigated the influence of key geometrical attributes of stochastic fracture networks on the macro-scale flow behavior of shale formations. Cao [] explored the impact of various parameters on well connectivity through fractures, aiming to identify an optimal well pattern that enhances the fracture network’s ability to facilitate heat extraction from naturally fractured geothermal reservoirs. Sun et al. [] studied the influence of pore–fracture connectivity on the occurrence and transportation of gas in shale plays. Collectively, these studies underscore the significance of fracture connectivity as a pivotal metric for characterizing rock fracture properties, with profound implications for industrial applications encompassing groundwater and seepage analysis, cement grouting, and oil extraction.
In grouting engineering, existing research often overlooks fracture connectivity when predicting cement intake. This represents a significant oversight because this connectivity affects how we seal connected fractures or faults, and its omission leads to less accurate predictions. It is imperative to address the urgent issue of accurately predicting cement intake by incorporating fracture connectivity into the predictive models. This study incorporates three-dimensional fracture connectivity with explicit consideration of network topology to improve the prediction of cement intake. A discrete fracture network (DFN) is constructed for the study area, and a depth-first search (DFS) traversal is applied from each grouting hole segment to identify both direct and multistep (indirect) connections within the network. Based on the traversal results, six connectivity parameters—the number of reachable fractures (N), the average inclination (I), the average dip angle (D), the cumulative connected volume (V), the average radius (r), and the average width (w)—are computed for each segment. These DFS-derived metrics collectively characterize the spatial extent, scale, topological configuration, and reachability of the connected subnetwork surrounding each grouting segment. More precisely: N quantifies reachable pathways for grout propagation; I and D capture the average fracture orientation, which governs flow directionality, an approach that is preferred over using dominant fracture sets, as it better accommodates the variability inherent in heterogeneous fracture networks; V reflects the total storage capacity of the connected void space; and r and w describe fracture scale and aperture, key factors influencing hydraulic conductivity. By accounting for both direct and indirect connections, the DFN + DFS approach captures additional conductive pathways that are not represented by direct intersections alone, providing more comprehensive descriptors for cement intake prediction.
Figure 2 illustrates the three-tier framework. The research framework is structured into three distinct tiers: a primary data layer, a methodological layer, and an application layer. The key contributions of this study are outlined as follows:
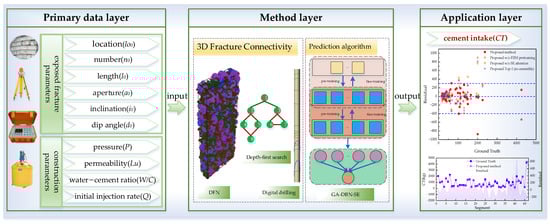
Figure 2.
Research framework.
- (1)
- Establishing the primary data layer. Initially, the location (lo0), number (n0), length (l0), aperture (a0), inclination (i0), and dip angle (d0) of the fractures in the study area were obtained based on examination of the exposed surface. Subsequently, grouting construction parameters such as the grouting pressure (P), permeability (Lu), water–cement ratio (W/C, by mass), and initial injection rate (Q) were documented using a recorder.
- (2)
- Establishing the methodological layer. This component primarily encompasses deriving 3D fracture connectivity metrics and formulating cement intake forecasting techniques. Drawing from the successful application of three-dimensional fracture network models by scholars in the field, this study employs the discrete fracture network (DFN) methodology to construct a 3D fracture model. Utilizing digital drilling and depth-first search (DFS) algorithms, the fractures connected to each grouting hole segment were sequentially identified. Their connectivity was characterized by calculating the number and cumulative volume of the fractures linked to each segment. A hybrid deep learning framework for cement intake was then proposed, integrating a Deep Belief Network (DBN), squeeze-and-excitation (SE) attention, and genetic algorithm (GA)-driven hyperparameter optimization.
- (3)
- Establishing the application layer. The efficacy of the developed methodology was demonstrated through its application to a curtain grouting project at a hydropower station in southwestern China. This application serves to validate the superiority of the proposed approach in real-world scenarios.
This study’s structured approach and innovative methodologies offer a significant contribution to the field of grouting engineering, providing a robust framework for predicting cement intake with enhanced precision and reliability.
2. Methodology
2.1. Modeling of 3D Fracture Connectivity
2.1.1. Three-Dimensional Fracture Model
The Baecher disk model was introduced by Baecher et al. in 1977 []. This model simplifies each fracture as a thin disk, characterized by a set of geometric parameters: the center point, diameter, spatial orientation defined by angles, and aperture. Recognized for its simplicity and versatility, the Baecher disk model has garnered widespread adoption within geotechnical engineering. In keeping with this established practice, the present study employs the Baecher disk model to simulate fracture geometries, leveraging its established efficacy for our analytical purposes.
Building a 3D fracture model has four main steps: fracture parameter acquisition, fracture set categorization, determination of fracture parameter distribution models, and verification of 3D fracture network modeling. Initially, fracture parameters are meticulously analyzed through geological borehole coring, borehole television surveys, and the examination of fracture sketches derived from manually exposed surfaces on-site. This analysis yields key geometric characteristic parameters, including lo0, n0, l0, a0, i0, and d0. Subsequently, to enhance the fidelity of the simulation, fractures exhibiting analogous attributes are systematically grouped according to their orientation and dip angle. This stratification facilitates a more nuanced analysis of the distribution of geometric characteristic parameters across various fracture groups. An optimal probability distribution model is then discerned, aligning with the empirical probability distribution of the fracture parameters. In the final stage, the geometric parameters are sampled using a stochastic approach and randomly combined using Rhinoceros 3D (version 6) to construct the 3D fracture model. Concurrently, a representative section of the 3D model is selected at random and juxtaposed with actual fracture parameters to ascertain the model’s veracity. Given the maturity and extensive application of the 3D fracture modeling methodology, a comprehensive elucidation of the fracture parameter distribution model construction process can be found in the referenced literature []. This study adheres to these established protocols, ensuring a robust and scientifically rigorous approach to 3D fracture modeling.
2.1.2. Depth-First Search Algorithm (DFS)
In identifying the set of fractures linked to the grouting hole, we encountered a quintessential path search problem. To articulate the methodology proposed herein, it is imperative to lay a solid groundwork by revisiting the fundamental principles of graph theory. As elucidated by Villas et al. [], graph theory is a mathematical discipline dedicated to the study of relationships among entities as underscored by their inherent properties. Boaventura Netto and Jurkiewicz [] delineated a graph as a mathematical structure comprising two distinct components: vertices and edges. Graphs are categorized as either directed or undirected. Directed graphs are marked by edges that imply a directional flow, signifying a one-way interaction between vertices. In contrast, undirected graphs are defined by edges that denote a reciprocal connection, indicative of a two-way relationship. Search algorithms are crafted to navigate a graph by systematically evaluating each vertex and edge, adhering to a path that culminates in the revelation of novel nodes. These algorithms are specifically designed to traverse edges emanating from the most recently identified vertex that harbors unexplored edges. DFS is a specialized search algorithm employed for the traversal or retrieval of elements within data structures, graphs, or trees []. Its hallmark is the exhaustive investigation of child nodes prior to initiating a backtrack to pursue alternative routes. DFS can be operationalized in multiple configurations, all of which entail a relentless progression through a graph or tree by persistently advancing towards unvisited children. This methodology guarantees an exhaustive examination of the graph or tree architecture. In light of the search and traversal merits inherent to DFS, this paper advocates for its application in constructing a network of fractures interconnected with grouting holes.
2.1.3. 3D Fracture Connectivity
In this study, the development of a 3D model that encapsulates the interplay between fractures and grouting holes was undertaken to ascertain fracture parameters conducive to connectivity with a grouting hole, thereby facilitating a quantitative delineation of fracture connectivity. As depicted in Figure 3, the methodology for ascertaining 3D fracture connectivity is structured into three sequential steps: the construction of a coupled 3D model, the identification of fractures with the potential to interface with a grouting hole, and the computation of connectivity parameters.
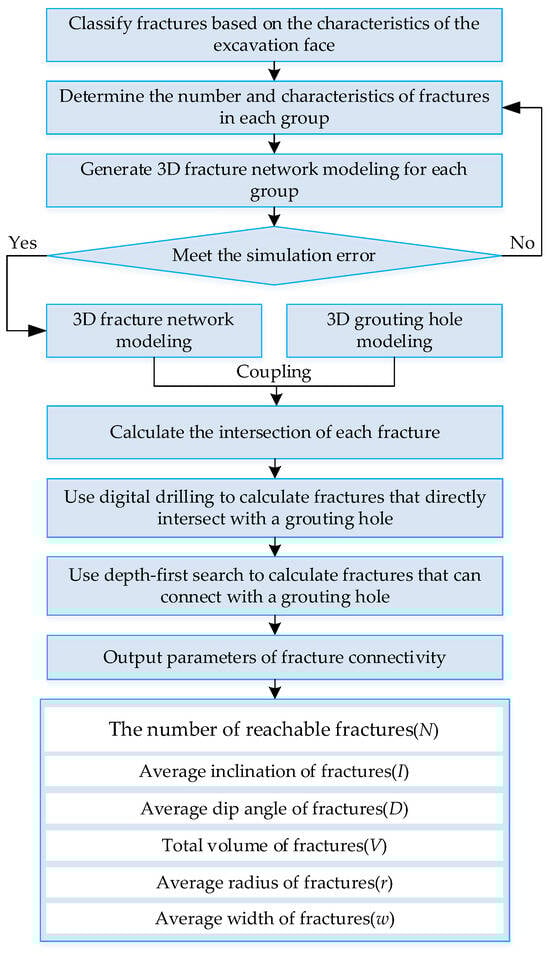
Figure 3.
Procedures for determining 3D fracture connectivity.
- (1)
- Establishing a coupled 3D model.
Leveraging the design parameters, the spatial coordinates and dimensions of the grouting holes were ascertained, culminating in the formulation of a 3D model of the grouting holes. Concurrently, as per the methodology outlined in Section 2.1.1, a 3D fracture network model was instantiated. Two models—the grouting hole model and the fracture model—were integrated within a common spatial framework, culminating in a cohesive coupled model.
- (2)
- Obtaining fractures that can connect with a grouting hole.
- It is assumed that a 3D fracture network model can be expressed in set form by Equation (1):
- It is assumed that a 3D model of grouting holes can be expressed as a set according to Equation (3):
First, based on Boolean operation rules, the intersection of each fracture is calculated, and the fracture intersection set is defined according to Equation (5):
where defines the fracture intersection set, and denotes the intersection of fractures 1 and 3.
Second, digital drilling technology is used to calculate the direct intersection between a grouting hole and a fracture, and the set of direct intersections is defined according to Equation (6):
where defines the set of direct intersections between the grouting hole and fractures, and denotes the intersection of the segment and the fracture .
Finally, this study employs a DFS algorithm as the principal graph traversal technique, which is adept at identifying all potential pathways from an origin to a terminus. The task of identifying a fracture set that is connectable to a grouting hole parallels the challenge of discovering all possible connecting routes within a network. The DFS algorithm offers considerable benefits in pathfinding efficiency, which motivated its adoption in this research for calculating fracture connectivity pathways. Drawing upon Equations (1)–(6), the set of fractures deemed connectable to a grouting hole is formally defined in Equation (7). This rigorous mathematical foundation is essential for the precise characterization of fracture connectivity, ensuring that the model’s outputs are both scientifically valid and practically applicable in the context of geotechnical engineering and grouting operations. The utilization of the DFS algorithm, coupled with a well-defined mathematical framework, underscores the methodological rigor of this study and its contribution to advancing the field of fracture network analysis.
where defines the fracture set that can be connected with the segment .
- (3)
- Calculating the connectivity parameters.
Within the scope of this research, a suite of fracture parameters that are intimately linked to cement uptake was identified as pivotal for characterizing fracture connectivity. These parameters encompass N, I, D, V, r, and w. The selection of these parameters is grounded in their direct correlation with the cementation process within fractures, thereby providing a comprehensive measure of connectivity. The methodology for determining these parameters is streamlined, allowing for their direct computation through numerical methods. This approach circumvents redundant data acquisition procedures, thereby enhancing the efficiency and precision of the connectivity analysis. By leveraging this streamlined process, the study ensures that the fracture connectivity parameters are derived in a manner that is both methodologically sound and operationally expedient.
- (4)
- Connectivity-Aware Feature Extraction Framework.
To systematically quantify the three-dimensional connectivity between grouting holes and fracture networks, we propose a graph-based traversal framework. The method first integrates discrete representations of the 3D fracture network F and grouting hole model H into a unified spatial domain. Fractures are modeled as nodes in a connectivity graph, with edges established via pairwise geometric intersections. For each grouting segment, DFS is initiated from directly intersecting fractures to identify all reachable fractures through multistep pathways. Finally, six interpretable connectivity descriptors are computed from the resulting connectable fracture sets. This procedure enables efficient, physics-informed feature extraction directly from geometric data.
2.2. GA-DBN with Squeeze-and-Excitation Attention (GA-DBN-SE)
2.2.1. Deep Belief Network
DBN is a well-known algorithm introduced by Hinton et al. []. It is a feedforward neural network architecture that features multiple hidden layers, constructed by stacking multiple Restricted Boltzmann Machines (RBMs). Originally introduced for unsupervised feature learning, DBNs excel at capturing hierarchical representations from raw input data without requiring labeled supervision during pre-training. This property is especially valuable in domains where labeled data are scarce or expensive to obtain, yet the underlying physical system exhibits rich latent structure. As depicted in Figure 4, this study has developed a two-hidden-layer DBN as the backbone of our model due to its proven ability to learn expressive feature hierarchies while remaining computationally tractable. Pre-training with RBMs provides a principled initialization that mitigates the vanishing gradient problem common in deep networks, facilitating more stable and effective end-to-end fine-tuning. This is critical in regression tasks involving non-Gaussian, heteroscedastic targets, where poor initialization can lead to suboptimal convergence.
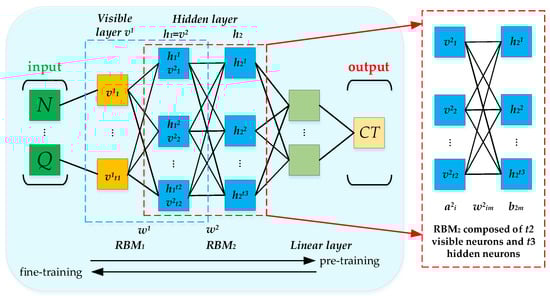
Figure 4.
The structure of a DBN with two RBMs.
Each RBM is composed of a visible layer v and a hidden layer h, with neurons interconnected across layers through weighted connections, while neurons within the same layer remain unconnected. The DBN training process is bifurcated into two distinct phases: pre-training and fine-tuning. During the pre-training phase, input data are channeled through the visible layer v1 of the first layer RBM, which maps the data onto the hidden layer h1. Subsequently, the hidden layer h1 is used as the visible layer v2 of the second layer RBM, and the data are transmitted in a layer-by-layer manner to form features that can represent the sample data in higher layers. The fine-tuning phase is conducted by integrating a linear layer as the terminal layer of the DBN, which serves to meticulously adjust the network parameters and achieve optimal model convergence. The DBN is known for its data analysis and feature extraction capabilities, with the capacity to approximate any continuous function, thereby making it ideal for multivariate non-linear system regression.
The precision of DBN regression is predominantly contingent upon its hyperparameters, which include the learning rate of fine-training, the epoch of fine-training, batch size, and the number of hidden layers. Given the multitude of parameters involved, the efficient optimization of these hyperparameters is a critical challenge.
2.2.2. Channel-Wise Squeeze-and-Excitation Attention
The squeeze-and-excitation (SE) mechanism is a lightweight and efficient attention module introduced by Hu et al. []. It is designed to adaptively recalibrate feature maps by modeling interdependencies between channels in a convolutional neural network. The SE block consists of two key operations: squeeze and excitation. During the squeeze phase, global average pooling is applied to capture the channel-wise global context, producing a channel descriptor. In the excitation phase, these descriptors are passed through two fully connected layers with a ReLU activation and a sigmoid activation function at the end to produce channel-wise scaling factors. These scaling factors are then used to adjust the importance of each channel in the feature map. Originally developed for convolutional networks, SE attention has been shown to improve representational capacity with minimal computational overhead. We integrated a compact SE block after the second hidden layer to enable the network to dynamically emphasize informative channels and suppress less relevant ones. This is particularly beneficial in regression settings where feature importance varies across samples and contexts. The SE module enhances model expressivity without increasing depth or width, making it a lightweight yet effective augmentation to the DBN backbone.
2.2.3. GA for Hyperparameter Optimization
A GA is an intelligent optimization technique that emulates the principles of natural selection and genetic inheritance as posited by Darwin’s theory of biological evolution. It is adept at navigating the search for global optima by mimicking the evolutionary processes found in nature []. Within a GA, the gene represents the fundamental unit, with a collection of genes constituting a chromosome. Each chromosome is associated with an objective function, which enables the ranking of chromosomes based on their performance metrics. Through processes of crossover and mutation, followed by iterative optimization, the algorithm converges towards the optimal parameter values. Since its inception, the GA has been widely applied across a spectrum of multi-objective optimization challenges, owing to its minimal parameter requirements and robust global search capabilities []. In light of these attributes, this study integrates a GA with a DBN, devising a novel GA-DBN approach to predicting cement intake. In a GA-DBN, the GA is employed to optimize the hyperparameters of the DBN, ensuring that the network converges to an optimal solution. The optimization process begins by initializing a population of candidate solutions (chromosomes), each representing a set of DBN hyperparameters, such as the number of hidden layers, the number of neurons in each layer, the learning rates, and the momentum values. The fitness of each solution is evaluated based on a fitness function; the individuals with higher fitness are selected for reproduction, undergoing crossover and mutation operations to create new individuals. This process is repeated for several generations, with the population converging towards an optimal set of hyperparameters. The GA-DBN method encapsulates a synergistic fusion of evolutionary computation and deep learning, offering a robust framework for addressing complex predictive modeling tasks in the domain of geotechnical engineering and beyond.
2.3. Prediction Workflow for Cement Intake
As delineated in Figure 5, the workflow comprises four components: data preparation and partitioning, definition of preset parameters and the GA search space, GA-based optimization of an SE attention-augmented DBN, and prediction and aggregation using the top-ranked models.
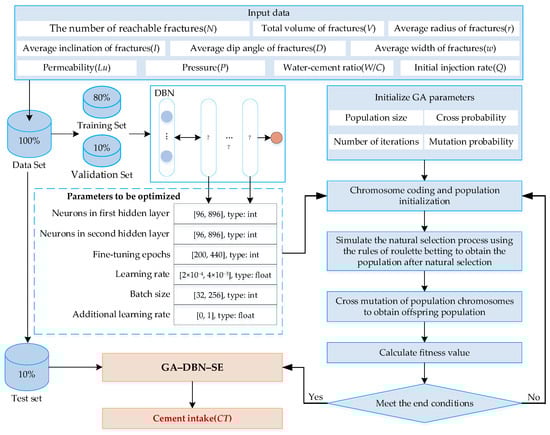
Figure 5.
Procedures for prediction of cement intake.
- (1)
- Data preparation and partitioning. The dataset comprises grouting construction parameters and fracture connectivity descriptors. The grouting parameters were acquired as follows: permeability was determined from pre-grouting water pressure tests conducted at each grouting stage under untreated conditions and reported in Lugeon units, in accordance with project specifications. P was continuously monitored at the collar of the return line using a calibrated pressure gauge and recorded in real time by the automated grouting recording system. W/C was obtained from the batching module as the stage-specific mix design logged by the grouting control system. Q was calculated based on the discharge volume data recorded during the first sampling interval following packer emplacement and the initiation of grout injection. Fracture connectivity descriptors were derived through a systematic analysis of exposed fracture traces. Statistical analysis of these traces informed the construction of a three-dimensional DFN model. Fracture connectivity metrics were then extracted using digital borehole logs and a DFS-based connectivity algorithm. The dataset was randomly split into training/validation/test sets in an 80/10/10 ratio; feature standardization (z-scoring) was performed using statistics from the training set and consistently applied to the validation and test partitions.
- (2)
- Definition of preset parameters and the GA search space. The experimental framework defines a total of eleven control parameters that govern the training and scheduling configuration of the SE attention-based DBN. Among these, six hyperparameters are optimized using a GA, while the remaining five are preset. The GA search space is defined as follows: number of neurons in hidden layers (n1, n2) [96, 896] to allow sufficient capacity for 10-input features without overfitting small datasets; epochs [200, 440] based on the convergence observed in preliminary trials; learning rate [0.0002, 0.004] to ensure stable training on noisy grouting data while avoiding local minima; batch size [32, 256] for gradient stability in training; and a binary flag indicating whether an additional learning rate scheduling step is applied (∈{0, 1}). All specified ranges and encoding constraints are strictly enforced during GA initialization and mutation operations. The five preset constants comprise the following: the Huber loss parameter is 0.6; dropout rates for both hidden layers are set to 0.10; the gradient clipping threshold is 1.0; and the warm-up period is 8 epochs.
- (3)
- GA-based optimization of an SE attention-augmented DBN. The predictor is a two-layer DBN-style MLP with tanh activations; the second hidden layer is equipped with SE attention and layer normalization, followed by a residual gating and a linear readout. A multi-subpopulation GA is used (five subpopulations with 20 individuals each and 30 generations under the strong-preset regime), with binary tournament selection, one-point crossover (rate 0.6), and adaptive mutation (initialized at 0.06). Fitness is the validation mean absolute percentage error (MAPE, Equation (8)) in the target’s original scale after inverse RankGauss. To stabilize evaluation, 5-fold CV is used inside the GA’s inner loop; early stopping guards the inner trainer.
- (4)
- Prediction and aggregation using the top-ranked models. After GA completes, the top-K candidates are re-evaluated and retained. Their test-set predictions are aggregated by an error-aware weighted average with weights proportional to the inverse validation error.
2.4. Performance Metrics
The predictive performance of the algorithm is evaluated using four metrics: MAPE, Pearson correlation coefficient (R), mean absolute error (MAE), and root mean squared error (RMSE). These metrics assess the agreement between predicted values and measured cement intake values across m samples. The equations are as follows:
where and denote the sample means of the observed values and predicted values , respectively; the coefficient measures the strength of the linear association between predictions and observations, with a higher indicating stronger correlation; MAE and RMSE are expressed in the same units as cement intake, providing a measure of average prediction error; MAPE, reported as a percentage, is a dimensionless indicator of relative error.
3. Case Study
3.1. Project Overview
This study focuses on the curtain grouting project of a hydropower station situated in Sichuan Province, China. The station’s hub structure encompasses a core rockfill dam, a water diversion and power generation mechanism, and a flood discharge and emptying system. The core rockfill dam stands at a maximum height of 295 m, ranking it as the third-highest earth-rock dam globally, thereby underscoring the significance of its construction quality. The seepage stability of the dam’s foundation is inherently linked to the overall safety of the dam, with reliable construction quality emerging as a vital safeguard against potential threats. Given these considerations, stringent demands have been placed on the seepage prevention measures for the dam’s foundation. The project’s anti-seepage curtain is constituted by components including the riverbed foundation’s anti-seepage barrier, as well as the left and right bank dam abutment foundations and the underground powerhouse.
The dam’s bedrock layer is steeply inclined towards the downstream side, predominantly consisting of interbedded metamorphic sandstone slate and sandstone slate. The rock layer’s occurrence is nearly perpendicular to the river’s flow. The rock mass of the dam foundation surface is mainly class III2 and class IV, the unloading degree of the rock mass is relatively high, and the medium and low dip joints inclined to the outside of the slope are relatively developed. The dam foundation contains four groups of dominant fractures, which cut each other and have poor rock integrity.
In light of these geological conditions, the establishment of a predictive model for cement intake that accounts for fracture connectivity is deemed essential for the precise control of grouting quality. To this end, the 36th unit of the dam foundation’s curtain grouting was selected as a case study. The study area measures 34 m in length, 10 m in width, and 70 m in depth. The grouting holes are strategically arranged in a quincunx pattern with a spacing of 1.5 m and a row spacing of 1 m, resulting in the division of the 32 grouting holes into 448 discrete sections.
In this project, the grout curtain was constructed using circulation grouting. In this method, grout is injected at the bottom of the isolated stage through the injection line; a portion of the slurry infiltrates rock fractures, while the remainder returns to the collar via a dedicated return line, establishing a continuous circulation of slurry within the stage. This circulation facilitates (1) stable control of injection pressure and flow, (2) continuous monitoring and adjustment of grout properties (e.g., density, water/cement ratio), and (3) timely observation and accounting of returns, which provides indirect information on fracture connectivity and grout take.
3.2. Data Set
3.2.1. Construction Parameters
The key grouting parameters—P, Lu, W/C, and Q—were recorded with a dedicated grouting data logger integrated with a real-time monitoring system. As summarized in Table 1, the untreated natural dam foundation exhibited a mean permeability of 22.28 Lu, with a maximum of 81.04 Lu, far exceeding the design criterion of <1 Lu. Accordingly, rigorous grouting control was required to reduce foundation permeability to levels consistent with the project’s safety and reliability requirements.

Table 1.
Descriptive statistics of grouting parameters.
3.2.2. Three-Dimensional Fracture Connectivity Parameters
Based on the observed fracture occurrences, the identified fractures were categorized into four predominant fracture groups. Statistical analysis revealed that the radius and aperture of these fracture groups conform to a negative exponential distribution, while their inclination and dip angles adhere to the Fisher distribution. The outcomes of the simulated fracture parameters, derived from this statistical examination, are presented in Table 2. In our research, a total of 5111 fractures were simulated in this study area, and the reliability of the simulated fracture parameters was rigorously assessed using the relative error method, with the corresponding calculations detailed in Table 3. The relative error between the field measurements and the simulated data was minimal, indicating a high degree of consistency. Specifically, the relative error in the average radius measurements spanned from −13.894% to 12.598%, suggesting a moderate deviation that was within acceptable margins for this type of analysis. For the average inclination, the relative error was even more constrained, ranging from −0.150% to 2.312%, which underscored the high fidelity of the simulated data to the actual field observations. Additionally, the relative error for the average dip angle, which is another critical parameter for fracture characterization, was reported between −3.660% and 0.954%. Lastly, the relative error for the average width of the fractures was within the bounds of −9.800% to 6.000%, further reinforcing the reliability of the simulation outcomes.
Table 2.
Statistical results of simulated fractures.
Table 3.
Comparison between field data and simulated data.
Figure 6 illustrates the subsequent steps undertaken in this study. Initially, 3D modeling software (Rhinoceros 3D, version 6) was employed to construct three-dimensional representations of fractures and grouting holes on a unified spatial scale. Subsequently, digital drilling techniques were applied to perform Boolean operations on the grouting hole and fracture models, yielding a set of fractures capable of intersecting with a grouting hole. Thirdly, DFS was utilized to identify fracture sets that could be connected to the grouting hole segments. Ultimately, parameters indicative of fracture connectivity were computed. The correlation between these fracture connectivity parameters and cement intake is depicted in Figure 7. Notably, the two key parameters—N and V—exhibited strong positive correlations with cement intake, with Pearson correlation coefficients of 0.63 and 0.81, respectively. This reflects the underlying physical mechanisms: N captures the number of available flow channels a grout front can access, thereby influencing propagation pathways, while V serves as a proxy for storage capacity and effectively scales with the order of magnitude of grout uptake. The consistent strength of these relationships underscores fracture connectivity as a fundamental control on grout distribution and consumption within the analytical framework of grouting processes.
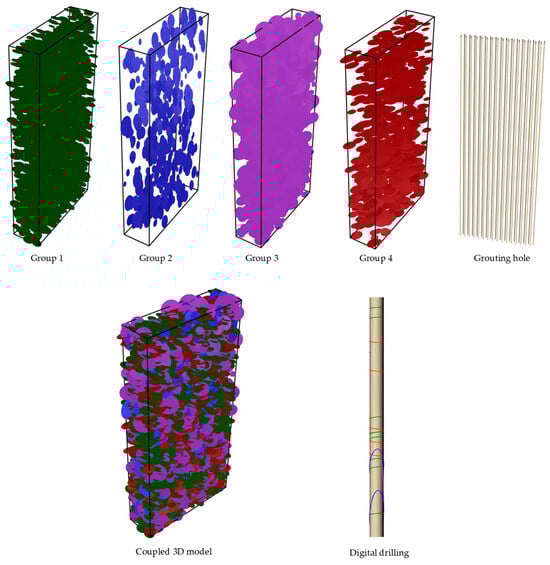
Figure 6.
Procedures for digital drilling.
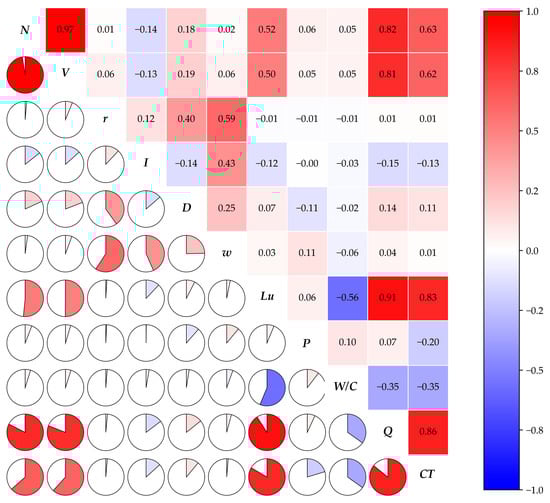
Figure 7.
Correlation coefficient between input parameters and cement intake. Note: Lower triangle: pie charts of R (sector size = |R|, color indicates sign); Upper triangle: colored cells with numeric R values.
3.3. Cement Intake Prediction
In this study, a total of 448 samples were randomly divided into three non-overlapping subsets: 357 samples were assigned to the training set, 45 to the validation set, and 46 to the independent test set. To ensure robust hyperparameter optimization and reliable generalization performance assessment, a 5-fold cross-validation strategy was incorporated into a GA framework during model selection. Specifically, for each candidate individual in the GA population, the combined training and validation sets underwent stratified 5-fold splitting, and the average RMSE across the validation folds was used as the fitness criterion for evolutionary selection. After conducting a GA-based search over the hyperparameter space, an ensemble of the top-performing models was constructed, consisting of 14 models in the strong preset mode. The final ensemble’s hyperparameters, weighted according to performance, were as follows: the first hidden layer consisted of 492 neurons, the second hidden layer had 679 neurons, the number of fine-tuning epochs was 310, the learning rate was 1.08 × 10⁻³, the batch size was 145, and learning rate scheduling was enabled, with approximately 28.4% of the top models employing step decay. As shown in Figure 8, on the independent test set, the final ensemble achieved an R of 0.9724, an MAE of 105.71, an MAPE of 14.23%, and an RMSE of 177.66. These metrics highlight the robustness of the predictive model.
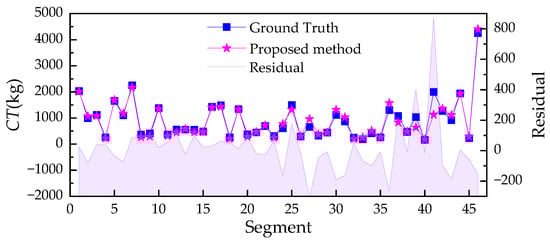
Figure 8.
Curves of predicted values and ground truth of cement intake.
4. Discussion
4.1. The Advantages of Incorporating 3D Fracture Connectivity
To assess whether explicitly encoding 3D fracture connectivity enhances prediction accuracy, we employed a controlled-variable experimental design: only the fracture set intersecting the grout hole was allowed to vary, while all other inputs and modeling conditions remained fixed. As shown in Figure 9, both approaches broadly followed the measured cement consumption trend, but the connectivity-aware model aligned more closely with empirical observations and substantially reduced the large local deviations evident in the baseline.
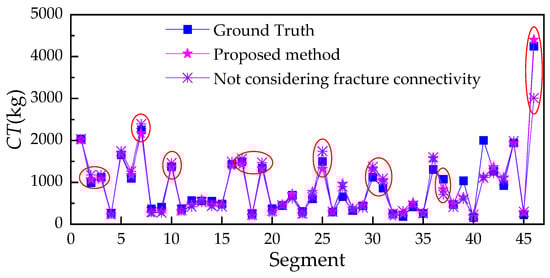
Figure 9.
Comparison of results with and without considering fracture connectivity.
The proposed method yielded a mean prediction of 899.72, closer to the observed mean of 913.63 than the baseline’s 889.30. This corresponds to a modest negative bias of approximately 1.5% for the proposed method, compared to 2.7% for the baseline—indicating that incorporating connectivity mitigates systematic underestimation. Pattern-level agreement also improved markedly: the R rose from 0.938 (without connectivity) to 0.972 (with connectivity), reflecting a stronger linear relationship between predictions and measurements.
Error metrics further confirmed this gain. When connectivity was accounted for, MAE dropped from 144.93 to 105.71, MAPE declined from 16.21% to 14.23%, and RMSE fell from 264.13 to 177.66. These quantitative improvements align with the visual evidence in Figure 9: high-residual outliers (highlighted in red circles) are notably fewer and less extreme, underscoring enhanced pointwise accuracy and overall model stability.
Crucially, reachable connectivity exceeded simple geometric intersection by capturing the actual pathways grout can propagate through once it enters the fracture network. In our formulation, two descriptors carried the dominant predictive signal: N, which quantified the number of available flow channels at the injection front, and V, which approximated void volume and thus scaled with expected intake magnitude. Additional features—I and D—encoded directional anisotropy, while R and W modulated hydraulic resistance. Together, they yielded more physically grounded estimates, reducing both underprediction and large residuals—particularly during rare, high-intake events (see Segment 46 in Figure 9).
In summary, embedding 3D fracture connectivity into the predictive framework meaningfully improves both statistical performance and practical fidelity, especially in challenging, high-magnitude scenarios.
4.2. The Advantages of the Proposed Method
4.2.1. Ablation Study Results
This paper presents a comprehensive evaluation of a novel machine learning model for predicting cement intake. Central to this evaluation is an ablation study that isolated and assessed the contributions of three core components: RBM pretraining, SE (squeeze-and-excitation) attention, and ensemble learning. By comparing the full model against systematically simplified variants, we demonstrated that each component meaningfully enhanced both predictive accuracy and stability.
As summarized in Table 4, four configurations were tested. Removing RBM pretraining (“Proposed w/o RBM pretraining”) resulted in a clear decline in performance: RMSE rose to 198.679, while MAE and MAPE increased to 117.525 and 14.975%, respectively. This indicates that RBM pretraining helps establish effective initial feature representations, facilitating better generalization. Further performance degradation occurred when the SE attention mechanism was omitted (“Proposed w/o SE attention”), with RMSE and MAE climbing to 206.527 and 133.577. This underscores the mechanism’s role in dynamically recalibrating feature importance to prioritize more informative predictors.
Table 4.
Performance comparison of ablation study.
The “Proposed Top-1 (no ensemble)” variant corresponded to the single best-performing model from the ensemble pool, selected based on validation performance and evaluated independently—without ensemble averaging. It achieved an RMSE of 194.353 and an MAE of 121.129. While still strong, its performance fell short of the full ensemble, highlighting how ensemble learning mitigates prediction variance and improves robustness.
Residual analysis (Figure 10) further supported these findings: the residuals of the full model were tightly clustered within [−400, 300], reflecting consistently high prediction precision across diverse test cases. Notably, the model excelled in regions 1 to 3, where errors were especially small.
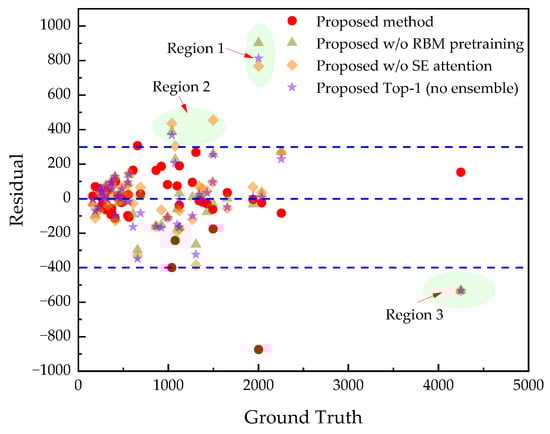
Figure 10.
Residuals of the ablation study for the proposed method.
In sum, the ablation study confirmed that RBM pretraining, SE attention, and ensemble learning each play a distinct and valuable role. Their integration yields a model that consistently outperforms all ablated versions, in both accuracy and reliability.
4.2.2. Results Compared to Baseline Methods
To rigorously validate the proposed method, we compared its performance against four representative baselines—support vector regression (SVR), random forest (RF), extreme learning machine (ELM), and long short-term memory (LSTM). All models were optimized using a genetic algorithm (GA) under identical data splits, preprocessing pipelines, and evaluation protocols. Hyperparameters were tuned via 5-fold cross-validation on the combined training and validation sets, with final metrics reported on a held-out test set (see Table 5 and Figure 11).
Table 5.
Analysis results of baselines.
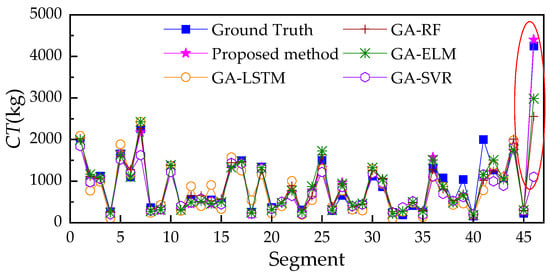
Figure 11.
Comparison with baseline methods.
The SVR model, based on ε-insensitive support vector regression with an RBF kernel, was optimized over 18 generations with a population size of 24, yielding optimal hyperparameters: a regularization parameter set to 100.0, the insensitivity tube width set to 1.094 × 10⁻³, and kernel scale set to 4.495. This configuration achieved the following test metrics: an R of 0.777, MAE of 193.612, MAPE of 18.109%, and RMSE of 506.571.
The RF baseline, a random forest regressor, evolved over 16 generations and selected a configuration comprising 238 trees, 153 features considered at each split, and a minimum leaf size of 2, resulting in an R of 0.923, MAE of 135.025, MAPE of 14.575%, and RMSE of 308.191—demonstrating strong non-linear modeling capability but still falling short of the proposed method.
The ELM model, an extreme learning machine with tanh activation and ridge-regressed output weights, converged to a configuration with 220 hidden units and a regularization coefficient of 0.0308, delivering an R of 0.944, MAE of 138.404, MAPE of 15.421%, and RMSE of 258.364. Although computationally efficient, its fixed random input weights constrained its representational capacity.
The LSTM baseline, which processed tabular inputs as artificial sequences through a single-layer LSTM followed by a multilayer perceptron head, underperformed significantly, achieving an R of 0.725, MAE of 235.94, MAPE of 27.573%, and RMSE of 528.544. This poor performance likely stemmed from the absence of genuine temporal structure in the data, rendering sequence-based modeling suboptimal.
In stark contrast, the proposed method consistently outperformed all baselines. This superiority derived from the synergistic innovations: (1) DBN pretraining for robust initialization and high-level feature capture; (2) SE attention for dynamic feature recalibration; (3) RankGauss transformation to stabilize the target distribution and improve calibration; and (4) ensemble aggregation of diverse top models to reduce variance and enhance robustness. Notably, as shown in Figure 11, the method excelled at predicting extreme values—e.g., at segment 46, where cement injection volumes exceed 4000. Among 448 samples, only 3 such cases existed, yet the model generalized accurately, highlighting its exceptional capacity to handle rare, high-magnitude events.
5. Conclusions
This paper presents an innovative approach to predicting cement intake by integrating the critical factor of fracture connectivity, which has been notably absent in traditional forecasting methodologies. Our research yielded the following significant findings:
- (1)
- Three-dimensional connectivity matters. By integrating a DFN with a DFS traversal, we quantified the reachable fracture subnetwork around each hole segment and proposed six descriptors (N, I, D, V, r, w). These features capture the extent, scale, and topology of conductive pathways beyond direct intersections and can be computed efficiently from digital drilling data.
- (2)
- Connectivity-aware learning improves prediction. On a real curtain-grouting project, explicitly modeling fracture connectivity substantially enhanced agreement with field measurements: the correlation coefficient increased to R = 0.972, while MAE, MAPE, and RMSE were reduced by 27.1%, 12.2%, and 32.8%, respectively, compared to a model that ignored connectivity.
- (3)
- Practicality. Ablation studies confirmed the value of each component in our integrated model: RBM pretraining improved generalization, SE attention enhanced feature selection, and ensemble learning stabilized predictions. Compared to four optimized baseline models (SVR, RF, ELM, and LSTM), the proposed integrated hybrid model—a GA-optimized DBN with SE attention—achieved improvements of 3–34% in R and reductions of 22–55% in MAE, 31–66% in RMSE, and 2–48% in MAPE on the held-out test set.
The present study used data from a single grouting unit; broader validation across sites and lithologies is needed. Future efforts will incorporate (1) physics-guided constraints linking connectivity to hydraulic aperture evolution and (2) model explainability to support adaptive control of pressure, mix design, and stage length during construction.
Author Contributions
Z.L.: Conceptualization, formal analysis, methodology, writing—original draft; X.L.: methodology, funding acquisition, writing—review and editing; M.Y.: data curation, formal analysis, resources, software; C.Z.: formal analysis, software, validation; J.C.: conceptualization, methodology, project administration, supervision. All authors have read and agreed to the published version of the manuscript.
Funding
This research was supported by the National Natural Science Foundation of China (No. 52309162) and the Natural Science Foundation of Sichuan Province (2025ZNSFSC0414).
Institutional Review Board Statement
Not applicable.
Informed Consent Statement
Not applicable.
Data Availability Statement
The original contributions presented in the study are included in the article, further inquiries can be directed to the corresponding author.
Acknowledgments
The authors are very grateful to the respected editor and the anonymous referees for their insightful and constructive comments, which helped to improve the overall quality of the paper.
Conflicts of Interest
Authors Zongxian Liu, Mengjie Yuan and Chaofeng Zhang were employed by the company Yalong River Valley Hydropower Development Co., Ltd., China. The remaining authors declare that the research was conducted in the absence of any commercial or financial relationships that could be construed as potential conflicts of interest.
References
- Hu, J.; Wang, Q.; Meng, Z.; Song, H.; Chen, B.; Shen, H. Numerical Study of the Internal Fluid Dynamics of Draft Tube in Seawater Pumped Storage Hydropower Plant. Sustainability 2023, 15, 8327. [Google Scholar] [CrossRef]
- Liu, Z.X.; Song, W.S.; Cui, B.; Wang, X.L.; Yu, H.L. A Comprehensive Evaluation Model for Curtain Grouting Efficiency Assessment Based on Prospect Theory and Interval-Valued Intuitionistic Fuzzy Sets Extended by Improved D Numbers. Energies 2019, 12, 3674. [Google Scholar] [CrossRef]
- Öge, İ.F. Prediction of Cementitious Grout Take for a Mine Shaft Permeation by Adaptive Neuro-Fuzzy Inference System and Multiple Regression. Eng. Geol. 2017, 228, 238–248. [Google Scholar] [CrossRef]
- Sohrabi-Bidar, A.; Rastegar-Nia, A.; Zolfaghari, A. Estimation of the Grout Take Using Empirical Relationships (Case Study: Bakhtiari Dam Site). Bull. Eng. Geol. Environ. 2016, 75, 425–438. [Google Scholar] [CrossRef]
- Dou, J.X.; Zhang, G.J.; Zhou, M.X.; Wang, Z.L.; Gyatso, N.; Jiang, M.Q.; Safari, P.; Liu, J.Q. Curtain Grouting Experiment in a Dam Foundation: Case Study with the Main Focus on the Lugeon and Grout Take Tests. Bull. Eng. Geol. Environ. 2020, 79, 4527–4547. [Google Scholar] [CrossRef]
- Li, X.L.; Hao, M.M.; Zhong, Y.H.; Zhang, B.; Wang, F.M.; Wang, L.B. A Quasi-3D Numerical Model for Grout Injection in a Parallel Fracture Based on Finite Volume Method. Complexity 2019, 2019, 4139616. [Google Scholar] [CrossRef]
- Cui, W.; Wang, L.X.; Jiang, Z.A.; Wang, C.; Wang, X.H.; Zhang, S.R. Numerical Simulation of Grouting Process in Rock Mass with Rough Fracture Network Based on Corrected Cubic Law. Rock Soil Mech. 2021, 42, 2250–2258. [Google Scholar] [CrossRef]
- Xuan, D.Y.; Xu, J.L.; Wang, B.L.; Teng, H. Investigation of Fill Distribution in Post-Injected Longwall Overburden with Implications for Grout Take Estimation. Eng. Geol. 2016, 206, 71–82. [Google Scholar] [CrossRef]
- Ajalloeian, R.; Moein, F. Evaluation of Damsites Groutability Using Secondary Permeability Index, Rock Classification (Case Studies). Am. J. Appl. Sci. 2009, 6, 1235–1241. [Google Scholar] [CrossRef]
- Zhu, Y.; Wang, X.; Deng, S.; Chen, W.; Shi, Z.; Xue, L.; Lv, M. Grouting Process Simulation Based on 3D Fracture Network Considering Fluid–Structure Interaction. Appl. Sci. 2019, 9, 667. [Google Scholar] [CrossRef]
- Yang, C.P. Estimating Cement Take and Grout Efficiency on Foundation Improvement for Li-Yu-Tan Dam. Eng. Geol. 2004, 75, 1–14. [Google Scholar] [CrossRef]
- Li, X.C.; Zhong, D.H.; Ren, B.Y.; Fan, G.C.; Cui, B. Prediction of Curtain Grouting Efficiency Based on ANFIS. Bull. Eng. Geol. Environ. 2019, 78, 281–309. [Google Scholar] [CrossRef]
- Rahimi, E.; Teshnizi, E.S.; Rastegarnia, A.; Al-Shariati, E.M. Cement Take Estimation Using Neural Networks and Statistical Analysis in Bakhtiari and Karun 4 Dam Sites, in South West of Iran. Bull. Eng. Geol. Environ. 2019, 78, 2817–2834. [Google Scholar] [CrossRef]
- Niu, J.D.; Wang, B.; Chen, G.J.; Chen, K. Predicting the Unit Grouting Quantity in Karst Curtain Grouting by the Water Permeability of Rock Strata. Appl. Sci. 2019, 9, 4814. [Google Scholar] [CrossRef]
- Niu, J.D.; Wang, B.; Wang, H.F.; Deng, Z.W.; Liu, J.X.; Li, Z.W.; Chen, G.J.; Zhang, B.T. An Intelligent Prediction Method of the Karst Curtain Grouting Volume Based on Support Vector Machine. Geofluids 2020, 2020, 8892106. [Google Scholar] [CrossRef]
- Deng, S.H.; Wang, X.L.; Zhu, Y.S.; Lv, F.; Wang, J.J. Hybrid Grey Wolf Optimization Algorithm-Based Support Vector Machine for Groutability Prediction of Fractured Rock Mass. J. Comput. Civ. Eng. 2019, 33, 04018081. [Google Scholar] [CrossRef]
- Zhong, D.H.; Liu, Z.X.; Su, Z.; Li, K.; Li, X.C. Predicting and Controlling the Cement Intake during Curtain Grouting of Dam Foundations. Eur. J. Environ. Civ. Eng. 2022, 26, 4237–4262. [Google Scholar] [CrossRef]
- Fan, G.C.; Zhong, D.H.; Yan, F.G.; Yue, P. A Hybrid Fuzzy Evaluation Method for Curtain Grouting Efficiency Assessment Based on an AHP Method Extended by D Numbers. Expert Syst. Appl. 2016, 44, 289–303. [Google Scholar] [CrossRef]
- Carter, T.G.; Dershowitz, W.; Shuttle, D.; Jefferies, M. Improved Methods of Design for Grouting Fractured Rock. In Grouting and Deep Mixing 2012; American Society of Civil Engineers (ASCE): Reston, VA, USA, 2012; pp. 1472–1483. [Google Scholar]
- Shuttle, D.A.; Dershowitz, W.; Glynn, E.; Burch, S.; Novak, T. Discrete Fracture Network Analysis of Foundation Grouting. In Pacific Rocks 2000: Rock Around the Rim, Proceedings of the 4th North American Rock Mechanics Symposium, NARMS 2000, Seattle, WA, USA, 31 July–3 August 2000; Balkema: Rotterdam, The Netherlands, 2000; pp. 1369–1376. [Google Scholar]
- Xu, C.; Dowd, P.A.; Mardia, K.V.; Fowell, R.J. A Connectivity Index for Discrete Fracture Networks. Math. Geol. 2006, 38, 611–634. [Google Scholar] [CrossRef]
- Gothäll, R.; Stille, H. Fracture–Fracture Interaction during Grouting. Tunn. Undergr. Space Technol. 2010, 25, 199–204. [Google Scholar] [CrossRef]
- Alghalandis, Y.F.; Xu, C.; Dowd, P.A. Connectivity Index and Connectivity Field towards Fluid Flow in Fracture-Based Geothermal Reservoirs. In Proceedings of the Stanford Geothermal Workshop, Stanford, CA, USA, 11–13 February 2013. [Google Scholar]
- Alghalandis, Y.F.; Dowd, P.A.; Xu, C. Connectivity Field: A Measure for Characterising Fracture Networks. Math. Geosci. 2015, 47, 63–83. [Google Scholar] [CrossRef]
- Deng, S.H.; Wang, X.L.; Yu, J.; Zhang, Y.C.; Liu, Z.; Zhu, Y.S. Simulation of Grouting Process in Rock Masses under a Dam Foundation Characterized by a 3D Fracture Network. Rock Mech. Rock Eng. 2018, 51, 1801–1822. [Google Scholar] [CrossRef]
- Zhu, W.W.; Khirevich, S.; Patzek, T.W. Impact of Fracture Geometry and Topology on the Connectivity and Flow Properties of Stochastic Fracture Networks. Water Resour. Res. 2021, 57, e2020WR028652. [Google Scholar] [CrossRef]
- Cao, M.; Sharma, M.M. Factors Controlling the Flow and Connectivity in Fracture Networks in Naturally Fractured Geothermal Formations. SPE Drill. Complet. 2023, 38, 131–145. [Google Scholar] [CrossRef]
- Sun, M.D.; Duan, X.G.; Liu, Q.; Blach, T.P.; Ostadhassan, M.; Liu, B.; Ji, Y.P.; Hu, Q.H.; Pan, Z.J. The Importance of Pore–Fracture Connectivity in Overmature Marine Shale for Methane Occurrence and Transportation. Mar. Pet. Geol. 2023, 157, 106495. [Google Scholar] [CrossRef]
- Baecher, G.; Lanney, N.; Einstein, H. Statistical Description of Rock Properties and Sampling. In ARMA U.S. Rock Mechanics/Geomechanics Symposium, Proceedings of the 18th U.S. Symposium on Rock Mechanics (USRMS), Golden, CO, USA, 22–24 June 1977; Paper No. ARMA-77-0400; ARMA: Denver, CO, USA, 1977. [Google Scholar]
- Villas, M.V.; Ferreira, A.; Leroy, P.; Miranda, C.; Bockman, C. Estruturas de Dados: Conceitos e Técnicas de Implementação; Campus: Rio de Janeiro, Brazil, 1993. [Google Scholar]
- Boaventura Netto, P.O.; Jurkiewicz, S. Grafos: Introdução e Prática; Blucher: São Paulo, Brazil, 2009. [Google Scholar]
- Rodrigues, G.P.W.; Costa, L.H.M.; Farias, G.M.; de Castro, M.A.H. A Depth-First Search Algorithm for Optimizing the Gravity Pipe Networks Layout. Water Resour. Manag. 2019, 33, 4583–4598. [Google Scholar] [CrossRef]
- Hu, J.; Shen, L.; Sun, G. Squeeze-and-Excitation Networks. In Proceedings of the IEEE Conference on Computer Vision and Pattern Recognition (CVPR), Salt Lake City, UT, USA, 18–23 June 2018; pp. 7132–7141. [Google Scholar]
- Hinton, G.E.; Osindero, S.; Teh, Y.-W. A Fast Learning Algorithm for Deep Belief Nets. Neural Comput. 2006, 18, 1527–1554. [Google Scholar] [CrossRef]
- Guan, S.; Wang, X.; Hua, L.; Li, L. Quantitative Ultrasonic Testing for Near-Surface Defects of Large Ring Forgings Using Feature Extraction and GA-SVM. Appl. Acoust. 2021, 173, 107714. [Google Scholar] [CrossRef]
- Wang, M.; Yu, J.; Zhou, M.; Quan, W.; Cheng, R. Joint Forecasting Model for the Hourly Cooling Load and Fluctuation Range of a Large Public Building Based on GA-SVM and IG-SVM. Sustainability 2023, 15, 16833. [Google Scholar] [CrossRef]
Disclaimer/Publisher’s Note: The statements, opinions and data contained in all publications are solely those of the individual author(s) and contributor(s) and not of MDPI and/or the editor(s). MDPI and/or the editor(s) disclaim responsibility for any injury to people or property resulting from any ideas, methods, instructions or products referred to in the content. |
© 2025 by the authors. Licensee MDPI, Basel, Switzerland. This article is an open access article distributed under the terms and conditions of the Creative Commons Attribution (CC BY) license (https://creativecommons.org/licenses/by/4.0/).