Abstract
The mechanical characteristics of soil–rock mixtures (SRMs) are significantly influenced by its material composition, composition ratio, water content, and a variety of other influencing factors. A total of 120 SRMs samples with different stone contents and water contents, sourced from typical cohesive soil and crushed stone in the Wuyishan region of Fujian Province, were prepared and subjected to large-scale direct shear tests. This research investigated how stone content, water content, and normal stress impact the shear stress–shear displacement behavior of the SRMs, as well as their influence on internal friction angle, cohesion, and shear strength. The results indicated that the shear stress–shear displacement curves of the SRMs exhibit similar patterns across different conditions, with shear stress increasing with shear displacement. The increase rate correlated closely with water and rock content, as well as normal stress. The shear strength, which adheres to the Mohr–Coulomb criterion, increased with rising stone content. It initially increased and then decreased as water content rose and reached a peak at the optimal water content. Higher stone content reduced shear strength sensitivity to water content changes. The internal friction angle diminished in response to elevated water content, while conversely, it experienced an augmentation with a heightened concentration of stone. It was less affected by water content at higher stone contents. The cohesion decreased as rock content increased, and it initially increased before decreasing with rising water content. Furthermore, as stone content grew, the effect of water content on cohesion became less pronounced.
1. Introduction
SRMs are distinctive geological materials that exhibit characteristics intermediate between those of soil and rock []. It is typically characterized by a disordered structure and poor sorting. Despite this, it serves as an excellent roadbed filling material in mountain road construction due to its strong permeability and high strength. However, the mechanical characteristics of the SRMs exhibit significant differences when compared to those of soil or rock masses. Variations in the content of coarse and fine particles, along with differing water contents, lead to distinct mechanical properties. This complicates the accurate description of this material using existing geotechnical mechanics theories. Therefore, exploring the patterns by which stone content and water content influence the SRM’s shear strength carries considerable theoretical significance and provides essential technical support for their engineering applications.
The methodologies utilized to evaluate the shear strength of the SRMs primarily encompass in situ testing, laboratory experimentation, and numerical simulation. Numerous scholars have employed one or more of these methodologies to examine the mechanical characteristic of the SRMs, yielding fruitful findings. In terms of in situ test, You et al. [], Xu et al. [,], Li et al. [,], Coli et al. [], Savely et al. [], Zhang et al. [], Hou et al. [], and Liu et al. [] examined the shear strength of the SRMs under a variety of conditions, including differing water environments, sample sizes, rock contents, and geological settings. This was achieved through compression shear tests or in situ large-scale horizontal push shear. They observed that both the composition of the rock and the size of the samples have a substantial impact on the mechanical properties and failure mechanisms of the SRMs. Specifically, an augmentation in rock content led to a notable enhancement in internal friction angle of the SRMs, whereas cohesion diminished with the rising rock content. Additionally, the shear strength of the SRMs tends to be notably reduced when the water content is high. In terms of laboratory tests, Jalili J et al. [], Du et al. [], Salimun et al. [,], He et al. [], Li et al. [], Liu et al. [], Tang et al. [], Wang et al. [], Zhang et al. [], Tian et al. [], and Tu et al. [] conducted large-scale direct shear tests to study factors affecting the shear strength of the SRMs. These factors included particle gradation, water content, stone content, particle breakage, and shear rate. Their findings revealed that SRMs with well-graded particles generally exhibit greater shear strength than those with poorly graded particles. Furthermore, the shear strength exhibited a decrease as water content increased, while initially increasing and subsequently decreasing with rising stone content. The variable initially exhibited an increase, followed by a decrease as shear speed increased. The shear strength exhibited a more significant reduction with increased particle breakage. Wang et al. [], Garcia et al. [], Werkmeister et al. [,], Voznesensky et al. [], Feda et al. [], Donaghe et al. [], Dupla et al. [], Younes et al. [], and Miller et al. [] have also explored the mechanical properties of the SRMs using large-scale triaxial apparatus. These studies indicate that the SRMs typically exhibit strain softening and dilatancy under low confining pressures. Conversely, at elevated confining pressures, these materials demonstrate strain hardening and shrinkage. The stone content significantly influences the shear stress–shear displacement curves characteristics of the SRMs. In terms of numerical simulation, Gong et al. [], Xu et al. [,], Xiao et al. [], Xu et al. [], Wang et al. [], Zhao et al. [], Jiang et al. [], Chen et al. [], Li et al. [], An et al. [], Li et al. [], Wu et al. [], and Yang et al. [] had investigated the macro and micro mechanical properties of SRMs under varying rock contents, particle shapes, stress paths, and block stone contents.
In summary, the material composition, water content, soil/rock ratio and other related factors significantly influence the SRM’s shear stress–shear displacement curves and shear strength. In recent years, large-scale infrastructure construction is being carried out in Wuyishan, Fujian Province, such as National Highway G322, scenic road No.1 in Wuyishan National Park, and ‘Four Good Rural Roads’ and other projects. This area is hilly and mountainous. In the process of road subgrade construction, a large amount of earthwork and stone excavation must be carried out, as well as a large number of subgrade filling. As a kind of material with high bearing capacity and strong permeability, soil–rock mixtures are an excellent material for roadbed filling in mountainous areas. However, the research on the properties of soil–rock mixtures in Wuyishan area is still blank. To investigate how water content and soil/rock ratio affect the shear strength of the SRMs consisting of cohesive soil and gravel in Fujian’s Wuyishan region, we conducted large-scale direct shear tests on laboratory-prepared SRMs under varying stone and water contents. This study aimed to examine how stone and water content affect the shear strength, shear stress–shear displacement curve, internal friction angle, and cohesion of the SRMs. The findings support the engineering use of SRMs made from cohesive soil and gravel in Fujian’s Wuyishan region.
2. Large-Scale Direct Shear Tests of SRMs
2.1. Test Equipment
ZY50-2G large-scale dual-use instrument for compression and direct shear of coarse-grained soil, which was manufactured by Chengdu Donghua Zhuoyue Technology Co., Ltd. (Chengdu, China) was used for testing. The equipment can test the SRMs with particle sizes up to 80 mm. This equipment consists of a loading frame, a servo system, a displacement monitoring sensor, and two circular shear boxes. It is controlled by a microcomputer with an automatic control system that supports automatic data acquisition. The sample dimensions are Φ 504.6 × 400 mm, and the maximum vertical load and horizontal thrust are both 700 kN. The force and displacement resolutions are 0.01 kN and 0.01 mm, respectively. The displacement control accuracy is ±0.5%F.S., and the vertical and horizontal pressure stabilization errors are both ±0.5%F.S. The horizontal shear speed ranges from 0.5 to 3.0 mm/min. The equipment is illustrated in Figure 1.
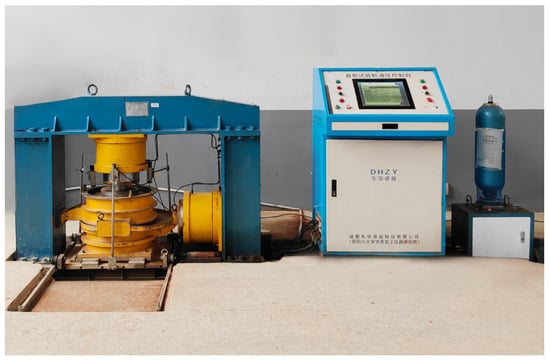
Figure 1.
ZY50-2G large-scale dual-use instrument for compression and direct shear of coarse-grained soil.
2.2. Selection of Raw Materials
There is no universally accepted standard for the boundary particle size of the SRMs worldwide, with common values including 2 mm [,], 4.75 mm [,], 5.0 mm [,,,,], 9.5 mm [,], and 0.05 A1/2 (where A represents the area of the study area) [,]. Most existing studies utilize 5.0 mm as the boundary particle size. To ensure comparability with previous research, the boundary value for soil and stone particle size in this test was set at 5.0 mm. The particles with particle size less than 5.0 mm used cohesive soil, and the particles with particle size greater than 5.0 m used gravel.
The raw materials used in this test were all obtained from the construction site of National Highway G322. The gravel was taken from the hole slag of Hedun Tunnel and crushed. The gravel had a hard texture, a bluish gray color, distinct edges, and a rough surface. But, the gravel surface contains a lot of stone powder. The gravel was cleaned before the test, screened after drying, and classified into storage categories based on particle sizes varying from 5 to 10 mm, 10 to 20 mm, and 20 to 40 mm. The cohesive soil was obtained from the excavated section of one side slope of National Highway G322. After the topsoil is removed, the soil was taken at a depth of about 1 m. The soil is brownish yellow, composed of powder and clay particles, and has strong cohesion. Due to its strong cohesion, the soil particles are bonded together, and the size of the clusters are more than 5 mm, so the soil samples are dried in the sun, and the clusters are crushed by a silt machine after drying, so that the soil particles are separated from each other. Then, the soil sample was stored in a sealed plastic container. To measure the water content of the cohesive soil, soil from three different positions were subjected to oven drying at 105 °C for a minimum duration of 12 h following a 24 h boring process. Figure 2 illustrates the raw materials of the SRMs with various particle sizes.

Figure 2.
Raw materials of the SRMs with various particle sizes.
2.3. Preparation of SRMs Samples
2.3.1. Preparation of Samples with Various Stone Contents
Six types of SRMs samples with various stone contents were prepared for the test, where the stone contents, denoted as P5, were 30%, 40%, 50%, 60%, 70%, and 80%, respectively. The curvature coefficient Cv for each sample was 2.0, while the non-uniformity coefficient Cu exceeded 5, indicating excellent gradation across all samples. The particle size grading curves for the samples with various stone contents are presented in Figure 3.
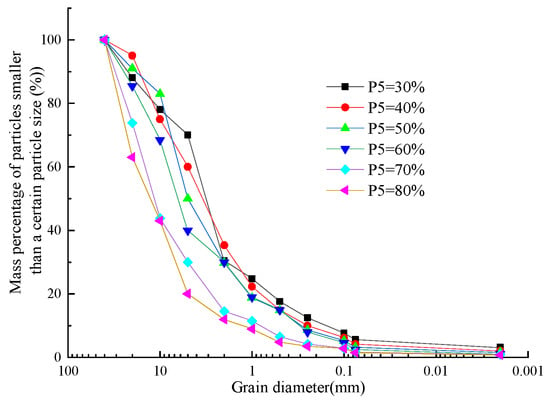
Figure 3.
Particle size gradation curves of samples with various stone contents.
2.3.2. Preparation of Samples with Various Water Contents
The particle size distribution curves for the SRMs with identical stone content were consistent. For each mixture, four samples with various water contents were prepared while maintaining the same stone content. The first group had a water content 2% lower than the optimal level (denoted as wop − 2%), the second group had an optimal water content (denoted as wop), the third group had a water content 2% higher than the optimal level (denoted as wop + 2%), and the fourth group had a saturated water content (denoted as wsat). Prior to conducting the extensive direct shear tests, the DDJ30-6 coarse-grained soil electric compaction apparatus was utilized to ascertain the optimal water content for SRMs with various stone contents.
The formula for calculating the dry density of the sample is shown in Equation (1):
where is the density of the compacted sample; is the water content of the compacted sample.
In the relationship curve between dry density and water content, the peak of the curve is the maximum dry density (), and the corresponding water content is the optimal water content.
According to Equation (62.4.3) in the ‘Standard for Soil Test Methods’ [], the calculation formula for the saturated moisture content of soil–rock mixtures is shown in Equation (2):
where is the density of water; is the specific gravity of soil–rock mixture, and the calculation is shown in Equation (3):
where is the mass fraction of particles larger than 5 mm, expressed as a decimal; and represent the specific gravities of particles larger than 5 mm and those not exceeding 5 mm, respectively.
According to the compaction test results of soil–rock mixtures, the optimal water content of soil–rock mixtures with different stone content was obtained. This enables calculation of the water requirement for specimens at optimum moisture content. Subsequently, the water requirements for specimens at 2% below and 2% above optimum moisture content were calculated. According to Equation (2), the water consumption required for saturation of soil–rock mixture with different stone content was calculated. The saturated water content referred to in this paper was calculated by Equation (2). According to the above method, the water consumption required for different samples was calculated.
2.3.3. Requirements for Preparation of SRMs Samples
The mass of each particle group necessary for performing large-scale direct shear tests on the SRMs containing various stone contents was precisely determined based on the particle size grading curve presented in Figure 3. The samples from each particle group were placed on a water-resistant iron plate. Initially, cohesive soil and gravel were thoroughly mixed using a shovel, and water was uniformly applied with an electric sprayer until the mixture reached the predetermined water content. After the materials are evenly mixed, they are placed in a storage box. Then, the waterproof film was covered on the surface of the sample to prevent water evaporation. After the sample was allowed to stand for 24 h, the sample was loaded into the shear box. The function of standing for 24 h is to allow water to distribute more evenly throughout the soil–rock mixtures. Before testing, soil samples from various locations within the mixture were collected for water content determination. The measured average water content must not deviate from the target value by more than 0.5%; otherwise, the samples were re-prepared. The sample preparation process is shown in Figure 4.

Figure 4.
Process of preparation the soil–rock mixture samples. (a) Weigh the required materials for each particle size; (b) add the required amount of water and mix evenly; (c) load into the storage box; (d) covering waterproof film and standing for 24 h.
2.4. Test Plan
In accordance with the requirements outlined in the ‘Standard for Geotechnical Testing Methods’ [] and the ‘Test Methods of Soils for Highway Engineering’ [], an open joint ring was positioned between the upper and lower shear boxes. The open joint ring dimensions were set at (1/3 to 1/4) of the largest particle size (dmax) present within the sample. Considering that the dmax for this test is 40 mm, a slit ring measuring 10 mm in height was selected. After securing the shear boxes, the soil samples, which had been conditioned for 24 h, were introduced to the shear boxes in three layers. Each layer was meticulously compressed to a predefined height by vibration tamp, followed by a deliberate roughening of the surface prior to the addition of subsequent layers. This process was repeated until the last layer was completed, which was smoothed for consistency. To ensure the precision of the test outcomes, five samples were prepared for each stone content, while ensuring a density difference in less than 0.03 g/cm3 and a water content difference in less than 0.5%. The vertical loads applied to the five samples were 200 kPa, 400 kPa, 600 kPa, 800 kPa, and 1000 kPa, respectively. The vertical loading method dictated that the loading duration for each stage should not exceed 1 h or result in a compression deformation of less than 50 μm/h. Horizontal shearing was subsequently performed automatically once the vertical load met the specified conditions. The horizontal loading mode was established as equal strain. The loading speed was set to 1.0 mm per minute.
The relevant provisions on stopping the consolidation slow shear test of soil–rock mixtures in the References [,] are as follows: when the shear stress reading reaches stability or shows a significant decrease. If the shear stress reading continues to increase, the test cannot be stopped until the shear deformation reaches 1/5~1/10 of the sample diameter. The diameter of the test sample is 504.6 mm, and the maximum horizontal displacement of the instrument is 65 mm. Yang et al. [,] and Lei et al. [] also employed identical instrument for direct shear tests on soil–rock mixtures, and the maximum shear displacement they set was 60 mm. In order to compare with the existing research results, the maximum shear displacement of this test was also 60 mm.
3. Results and Analysis
3.1. Shear Stress–Shear Displacement Curves of SRMs
3.1.1. Shear Stress–Shear Displacement Curves Characterization Under Different Conditions
The shear stress versus shear displacement curves of SRMs showed a similar trend under varying normal stresses, water contents, and stone contents. Overall, shear stress demonstrated an increase as a function of shear displacement. However, the rate of increase in shear stress, along with the maximum shear stress attained, exhibited notable variations under differing conditions. Tian et al. [], Liu et al. [], and Zhang et al. [] and Du et al. [] classified the shear stress-shear displacement curve into three distinct phases: the elastic phase, the plastic deformation phase, and the hardening or softening phase. The results obtained from this study indicate that the shear stress–shear displacement curve features correspond to these three phases, with a definitive hardening behavior observed in the third phase.
Initially, the shear stress increased linearly as the shear displacement increased. In this stage, SRMs only experienced elastic deformation, while its internal structure remained relatively unchanged. The shear displacement was relatively small. At the same time, the shear displacement during this stage diminishes as the normal stress, water content, and stone content increase. With the progressive increase in shear displacement, the correlation between shear stress and shear displacement deviates from linearity. The SRMs entered the plastic deformation stage, with particles sliding relatively and coarse particles starting to roll. The rate of increase in shear stress began to decelerate as shear displacement rose. However, under conditions characterized by high stone content and elevated normal stress, the rate at which shear stress increases with respect to shear displacement was significantly greater than what was observed under conditions of low stone content and low normal stress. Furthermore, the shear displacement during the plastic deformation stage exhibited a decrease as stone content, water content, and normal stress were increased. As shear displacement continued to increase, SRMs entered the hardening stage, where the particles were rearranged, and the coarse particles were sheared and ground. The shear stress progressively escalated in tandem with the shear displacement; however, the rate of increase was clearly less pronounced than the one observed during the yield stage. The shear displacement corresponding to the hardening stage decreased with rising stone content, water content, and normal stress. With the shear displacement increased progressively, a rapid decline in shear stress was observed, indicating that the mixture had transitioned into the failure stage.
3.1.2. Impact of Stone Content on the Shear Stress–Shear Displacement Curve
Under varying conditions of stone content, the shear stress exhibited an increased response to the applied shear displacement; however, the rate of increase was related to the stone content. Figure 5 illustrates the curves of shear stress compared to shear displacement for SRMs with different stone contents, specifically when w = wop, = 1000 kPa, and w = wsat, = 200 kPa. It was observed that, under identical normal stress conditions, the shear stress of the low stone content SRMs (less than 50%) increased slowly as the shear displacement increased. Conversely, in mixtures containing more than 50% stone, the shear stress rose markedly as shear displacement increased, especially at larger displacement levels. This behavior is due to the higher presence of coarse particles in mixtures with high stone content, leading to increased friction and interlocking forces. During the shearing process, some particles might fracture and roll, which necessitated greater shear stress. Therefore, a higher stone content correlated with a more pronounced increase in shear stress in relation to shear displacement, especially when the normal stress was at greater levels.
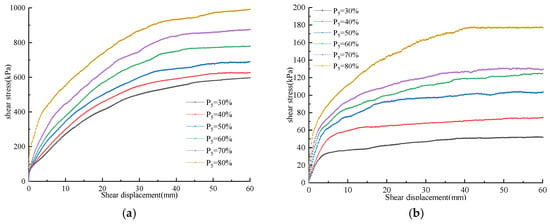
Figure 5.
Curves of the shear stress versus shear displacement for SRMs with various stone contents. (a) w = wop, = 1000 kPa; (b) w = wsat, = 200 kPa.
3.1.3. Impact of Normal Stress on the Shear Stress–Shear Displacement Curve
When stone content remained constant, the shear stress versus shear displacement curves for SRMs showed largely similar trends. Shear stress exhibited an increasing trend with shear displacement; however, the rate of this increase was influenced by the magnitude of normal stress. Figure 6 illustrates the shear stress curves in relation to shear displacement under varying normal stress conditions, when w = wop, P5 = 30%, and w = wop, P5 = 80%. The shear stress exhibited a slow increase as the shear displacement progressed when subjected to low normal stress conditions, while it rose rapidly with shear displacement when normal stress was high. This phenomenon arises from the fact that, under conditions of low normal stress, the compactness of the mixture diminishes. This diminishment engenders a notable reduction in both the frictional and interlocking forces that bind particles together, consequently weakening the resistance encountered during shearing. Consequently, the rate at which shear stress escalates in relation to shear displacement was relatively mild. As normal stress increased, the mixture’s compactness improved, resulting in greater friction and interlocking between particles. The phenomena of particle breakage and rolling became more pronounced during shearing, resulting in a considerable escalation in the resistance that must be surmounted. As a result, the rate at which shear stress escalates in relation to shear displacement became markedly more pronounced, especially when stone content was high.
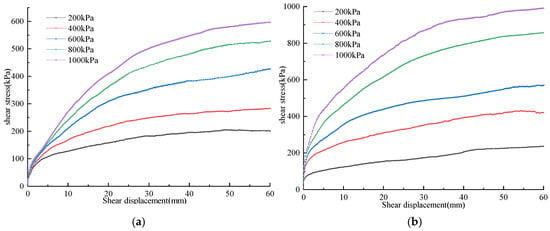
Figure 6.
Curves of the shear stress versus shear displacement for SRMs under various normal stresses. (a) w = wop, P5 = 30%; (b) w = wop, P5 = 80%.
3.1.4. Impact of Water Content on the Shear Stress–Shear Displacement Curve
The SRM’s shear stress exhibited an increase with shear displacement across varying water contents. However, the rate of this increase was significantly influenced by both stone content and normal stress. Figure 6 presents the shear stress versus shear displacement curves of SRMs under different water contents at P5 = 30% under = 200 kPa and P5 = 80% under = 1000 kPa. Figure 7 revealed that under conditions of low water content, the shear strengths of SRMs were found to be relatively low, with the shear stress increased gently with shear displacement. This phenomenon emerged due to the insufficient lubricating impact of water on the particles at low water content levels. Consequently, the particles did not achieve their densest arrangement, which restricted the full expression of friction and interlocking force among the particles. Consequently, the shear stress increases at a relatively slow rate as shear displacement progresses. As the water content reached the optimal level, the arrangement of particles became more compact, maximizing the interlocking force and friction among them. In this state, SRMs required greater shear stress during shearing, and the resulting shear stress–shear displacement curve exhibited a steep incline, where the rate of escalation in shear stress relative to shear displacement reached its maximum. Conversely, as the water content exceeded the optimal level, excess water was present in SRMs, which lubricated the particles and reduced both friction and cohesion among them. As water content increased, the rate at which shear stress increases in relation to shear displacement progressively diminished. It ultimately reached a minimum when the water content reached the saturated level. In SRMs characterized by a high stone content, the proportion of fine particles was relatively low, leading to a skeletal structure composed of the coarse particles. This configuration facilitated the easy drainage of excess water through the pores between the skeletons. Therefore, the curves of shear stress versus shear displacement for SRMs, characterized by a high stone content, demonstrated a remarkable consistency across varying water contents.
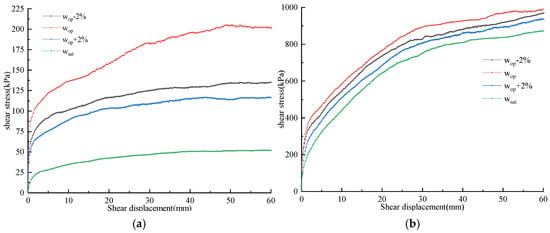
Figure 7.
Curves of the shear stress versus shear displacement for SRMs with various water contents. (a) P5 = 30%, = 200 kPa; (b) P5 = 80%, = 1000 kPa.
3.2. Impact of Water Content and Stone Content on the Shear Strength of SRMs
3.2.1. Impact of Stone Content on the Shear Strength of SRMs
Figure 8 illustrates the curve of the shear strength versus stone content in SRMs across different water contents.
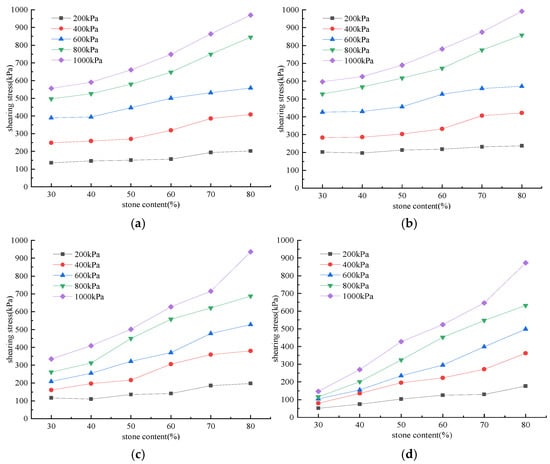
Figure 8.
Curve of the shear strength and stone content relationship for SRMs at different water contents. (a) w = wop − 2%; (b) w = wop; (c) w = wop + 2%; (d) w = wsat.
Figure 8 shows that the shear strength of the SRMs exhibits a consistent increase with elevated stone content, irrespective of variations in water content and normal stress levels. However, the rate of increase in shear strength with stone content differed depending on the levels of normal stress and water content. As the water content fell below saturation levels and the applied normal stress remained minimal, the shear strength of SRMs showed a continuous rise with the increase in stone content. This effect was especially pronounced when the rock content fell below 60%, as the increase in shear strength proved to be minimal. In contrast, as normal stress increased, both the rate and magnitude of shear strength improvement with stone content became significantly more substantial. For instance, when the normal stress was 200 kPa and the water content was below saturated levels, an elevation in stone content from 30% to 60% led to a maximum shear strength increase of only 21.27 kPa. Conversely, at a normal stress of 1000 kPa and optimal water content, a corresponding increase from 30% to 80% stone content yielded a minimum shear strength increase of 395.02 kPa. When the water content reached saturated levels, the maximum increase in shear strength was recorded at 726.31 kPa.
At low stone content, the SRMs is primarily composed of fine-grained cohesive soil and features a block-soil skeleton-filling mixed structure. Conversely, at high stone content, the mixture consists mainly of coarse-grained gravel, and its structure is dominated by a block stone skeleton, where the fine particles fill the pores within the skeleton. As stone content increased, the skeleton effect of SRMs became more pronounced. Under low normal stress, the compactness of the SRMs was low, and the interlocking force among particles was not fully exerted. Thus, the shear strength increased slightly with rising stone content. However, as normal stress increased, the compactness gradually increased, leading to stronger interlocking force among particles. Particularly at high stone content, the direct contact between coarse particles enhanced friction, necessitating greater energy consumption for grinding and shearing during deformation. Therefore, as normal stress increased, the impact of stone content on the shear strength of the SRMs became increasingly significant, particularly at higher stone content levels.
3.2.2. Impact of Water Content on Coarse-Grained Soil Shear Strength
Figure 9 illustrates curve of the shear strength versus water content for SRMs under various conditions.
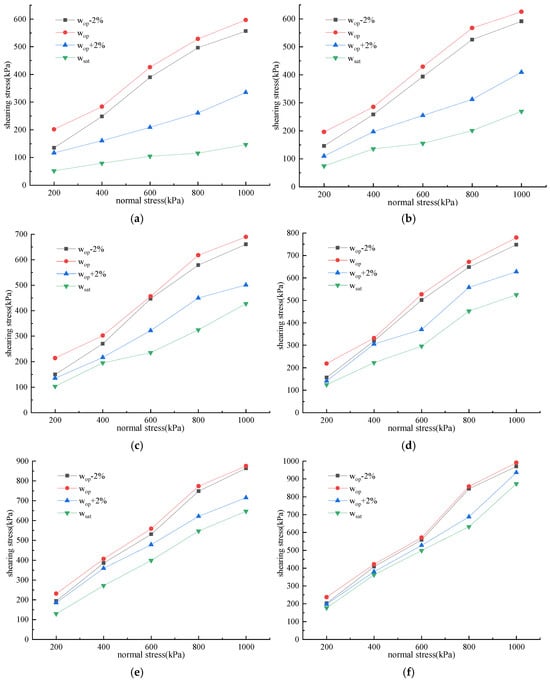
Figure 9.
Graph of shear strength as a function of water content for SRMs under different conditions. (a) P5 = 30%; (b) P5 = 40%; (c) P5 = 50%; (d) P5 = 60%; (e) P5 = 70%; (f) P5 = 80%.
The results illustrated in Figure 9 indicate that the shear strength of SRMs with varying stone contents shows that it first increases, then decreases with rising water content. However, this trend was influenced by both normal stress levels and stone content. For all SRMs, when the water content fell below the optimal level, the shear strength exhibited a gradual increase in response to rising water content. As the water content reached its optimal level, the water content within SRMs was regarded as suitable. Consequently, both the compactness and shear strength reached the maximum. As water content increased, the water within SRMs gradually rose, although it did not reach complete saturation. Meanwhile, a portion of water existed as free water, which provided lubrication between particles. This reduction in friction and cohesion among the particles subsequently led to a diminished shear strength. Further increases in water content resulted in SRMs reaching saturation, with all voids fully filled with water. In this case, the lubrication effect of water became more pronounced, while the friction and cohesion between the particles were significantly reduced, and the SRM’s shear strength reached its minimum. For SRMs with water content at or below the optimal level, the relationship curves between shear stress and normal stress at identical stone content exhibit a consistent pattern.
As stone content increased, the SRM’s coarse particle proportion gradually increased, leading to a greater number of pores between particles. This configuration facilitated the efficient drainage of water through the pores, thereby mitigating its influence on shear strength once the water was discharged. Consequently, the shear strength of SRMs with a high stone content showed less sensitivity to changes in water content. Conversely, for SRMs with low stone content, the limited number of pores restricted timely water drainage, which enabled the water to keep its lubricating properties on the particles, leading to significantly reduced shear strength. Therefore, as stone content increased, the impact of water content on the shear strength of SRMs was significantly diminished.
3.2.3. Shear Strength Constitutive Model for SRMs
The Mohr–Coulomb model is one of the most important elastic–plastic models in the field of geotechnical engineering, which can deeply reveal the mechanical behavior of rock, clay, sand, and other geotechnical materials. The model describes the strength characteristics of rock and soil through the relationship between shear stress and shear displacement, and has been widely used in geotechnical engineering.
In existing research, many scholars have used the Mohr–Coulomb criterion to describe the shear strength of soil–rock mixtures. Yang et al. [,], Lei et al. [], Du et al. [], Zhang et al. [], Yang et al. [], Xu et al. [], and Tang et al. [] had used the Mohr–Coulomb criterion to fit the peak shear strength of soil–rock mixtures at different levels of normal stress, achieving satisfactory results. It shows that the Mohr–Coulomb criterion has certain applicability in the shear strength fitting of soil–rock mixture. According to the normal stress–shear stress curve in Figure 8, it can be seen that there is a good linear relationship between normal stress and shear stress, which basically conforms to the linear Mohr–Coulomb strength theory. Therefore, the Mohr–Coulomb strength theory is used to fit the shear strength of soil–rock mixture under different conditions. The equations obtained from the fitting process, along with their corresponding correlation coefficients, are presented in Table 1.

Table 1.
Equations and correlation coefficients for SRMs under various conditions.
The information presented in Table 1 elucidates that the interaction between normal stress and shear stress for SRMs under diverse conditions can be adeptly encapsulated by a one-dimensional linear equation. Notably, all fitted values exceed 0.95, indicating a strong correlation. This finding indicates that the shear strength of SRMs which are composed of cohesive soil and gravel in the Wuyishan regions of Fujian Province adheres to the Mohr–Coulomb criterion.
3.3. Impact of Water Content and Stone Content on Internal Friction Angle of SRMs
Figure 10 illustrates curve of internal friction angle versus stone content for SRMs under various water contents.
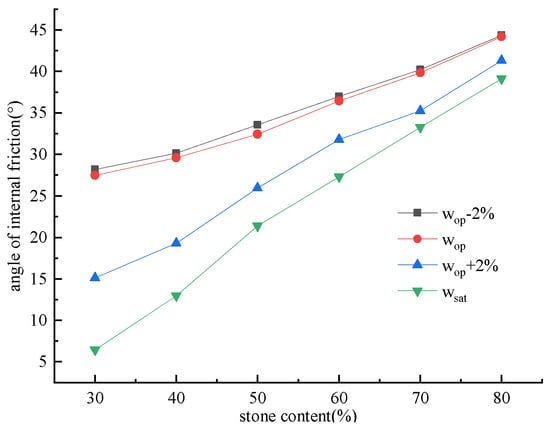
Figure 10.
Curve of internal friction angle versus stone content for SRMs under various water contents.
Figure 10 illustrates that the internal friction angle of SRMs tends to increase as the stone content rises across different levels of water content. However, the rate of increase varied across different water contents. The internal friction angle exhibited a decrease with increasing water content in SRMs comprising the same stone proportions. An increased stone content led to a diminished impact of water content on internal friction angle.
When the water content was at or below optimal levels, a consistent trend was observed in the correlation between the internal friction angle and the proportion of stone content. However, with an increase in stone content, the differences in internal friction angle across various water contents gradually diminished. For instance, when the stone content was 30% and the water content was 2% below the optimal level, the measured internal friction angle was recorded at 28.21°. In contrast, as the water content reached the optimal level, the measured internal friction angle decreased to 27.47°, resulting in a difference of 0.74° between these two conditions. Similarly, when the stone content increased to 80% and the water content remained at 2% below its optimal level, the measured internal friction angle was observed to be 44.36°. However, once again at optimal water content levels, this angle slightly reduced to 44.20°, yielding a difference of only 0.16° between these measurements. As water content increased, the difference gradually decreased. When the water content surpassed optimal levels, the internal friction angle of SRMs with varying stone contents progressively decreased as water content increased. The impact of water content on internal friction angle was more pronounced for SRMs with lower stone content, leading to a more significant reduction. Conversely, mixtures with higher stone content experienced less influence from water content. For example, at a stone content of 30%, internal friction angles exhibited a spectrum ranging from a maximum of 28.21° to a minimum of 6.44°. In contrast, when the stone content increased to 80%, these angles demonstrated a significant elevation, with values soaring to a maximum of 44.36° and descending to a minimum of 39.12°, respectively. This disparity can be ascribed to the higher proportion of fine particles in SRMs with lower stone content, which possessed greater water absorption capacity. In such SRMs, fine particles occupied the void spaces between the coarse particles, impeding water drainage under vertical loads. Conversely, SRMs characterized by elevated stone content exhibit larger pore sizes among the coarse particles, thereby promoting enhanced water drainage. Consequently, the internal friction angle of SRMs with low stone content shows greater sensitivity to changes in water content. In contrast, internal friction angle of SRMs with a substantial stone composition demonstrates considerably less susceptibility to changes in moisture levels.
3.4. Impact of Water Content and Stone Content on the Cohesion of SRMs
Figure 11 illustrates curve of the cohesion versus stone content for the various SRMs under various water contents.
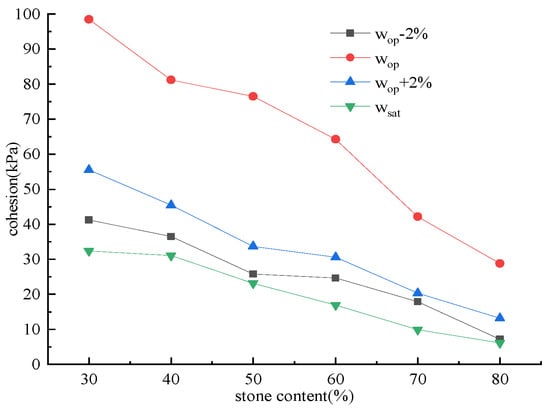
Figure 11.
Shear strength versus water content curves for SRMs under different conditions.
Figure 11 demonstrates that under varying water content conditions, the cohesion of SRMs declines with an increase in stone content. However, the rate of reduction varied across different water contents. When w = wop − 2%, the cohesion decreased with increasing stone content, and the rate of reduction increased with higher water content. When w = wop, the reduction in cohesion with increasing stone content occurred at the fastest rate. Conversely, when w > wop, the rate of reduction in cohesion associated with increased stone content gradually slowed down as water content increased. In case of w = wop − 2%, the cohesion decreased from 41.22 kPa at 30% rock content to 7.20 kPa at 80% rock content. In case of w = wop, the cohesion decreased from 98.53 kPa at 30% stone content to 28.79 kPa at 80% stone content. In case of w = wop + 2%, the cohesion decreased from 55.51 kPa at 30% stone content to 13.20 kPa at 80% stone content. In case of w = wsat, the cohesion decreased from 32.41 kPa at 30% stone content to 6.12 kPa at 80% stone content. This phenomenon can be attributed to the dominant influence of cohesive soil containing fine particles on the cohesion in SRMs, while coarse particles do not contribute to increasing cohesion. As stone content increased, the fine particle proportion in SRMs decreased, while more coarse particles disrupted the continuous structure of the finer ones. Consequently, higher stone content resulted in a reduced effective contact area between fine particles, thereby diminishing cohesion among them.
At low water content, insufficient water in SRMs primarily existed as bound water, which limited the lubrication effect on particles. Under load, the arrangement between the particles failed to adjust optimally, leading to inadequate cementation between particles, which resulted in relatively low cohesion. In SRMs with low stone content, a higher proportion of fine-grained materials enhanced the bonding capabilities among fine particles, thereby resulting in higher cohesion. As water content increased, the water in SRMs began to play a lubricating role among the particles. Under load, the arrangement of particles gradually attained an optimal configuration, and the cementation and interlocking among particles approached their maximum potential. Consequently, the cohesion progressively increased as the water content rose, reaching its maximum at the optimal water content. As water content continued to increase, the excess water in SRMs manifested as free water, which increased the distance between particles and reduced inter-particle cohesion, thereby leading to a gradual decline in cohesion. In SRMs with low stone content, the abundance of fine particles and smaller pores inhibited efficient water drainage under load. In contrast, high stone content led to a dominance of coarse particles, resulting in larger inter-particle pores that facilitated water drainage under load. Once water was discharged, the lubrication effect on particles diminished; thus, higher stone content leads to reduced cohesion sensitivity to water content variations in SRMs.
4. Conclusions
In this research, various SRMs with different stone contents and water contents were systematically prepared in the laboratory. And SRMs commonly comprised cohesive soil and gravel sourced from the Wuyishan region in Fujian Province. The mechanical properties of these mixtures were evaluated through large-scale direct shear tests. The conclusions can be summarized as follows:
- (1)
- The SRM’s shear stress–shear displacement curves exhibited a similar trend across different conditions. The shear stress exhibited an increase in conjunction with the shear displacement. SRMs with higher stone content demonstrated a more rapid increase in shear stress, which was further accelerated under greater normal stress. Additionally, the shear stress demonstrated an initial increase that was then followed by a subsequent decrease as the water content rose. The presence of a higher stone content, coupled with increased normal stress, led to a more significant enhancement in shear stress relative to shear displacement.
- (2)
- The SRM’s shear strength increased with higher stone content under various conditions. At low normal stress levels, the shear strength displayed a gradual improvement with an increase in stone content. However, as normal stress increased, the rate and amplitude of shear strength exhibited a significant rise as stone content was elevated. The shear strength of the SRMs initially increased and subsequently decreased as the water content increased across different stone content levels. The shear strength peaked at optimal water content. The shear strength of SRMs characterized with higher stone content exhibited reduced sensitivity to variations in water content. The SRM’s shear strength aligned with the Mohr–Coulomb criterion.
- (3)
- The internal friction angle of the SRMs exhibited an increasing trend with elevated stone content across different water content conditions. Conversely, for SRMs with identical stone content, an elevation in water content resulted in a concomitant decrease in the internal friction angle. The SRMs that contained a lower percentage of stone exhibited a more pronounced reduction in internal friction angle, indicating a greater influence of water content on internal friction angle in these mixtures.
- (4)
- The cohesion of the SRMs decreased as the stone content increased, regardless of the water content conditions. The initial rise was succeeded by a drop as the water content grew, with the greatest decrease happening at the optimal water level. The cohesion of the SRMs containing low stone content was notably affected by the water content.
Author Contributions
Conceptualization, J.W.; Validation, Y.W.; Investigation, X.T.; Data curation, X.T.; Writing—original draft, J.W.; Writing—review & editing, J.W.; Supervision, J.W. and Y.W.; Project administration, Y.J., Z.Z., B.J., H.Y. and S.L.; Funding acquisition, J.W. All authors have read and agreed to the published version of the manuscript.
Funding
This work was supported by the National Key R&D Program of China (No: 2023YFC3009400), Fujian Natural Science Foundation (No: 2021J011134), the National Science Fund of Jiangxi Province (No: 20223BBG71018), Engineering Research Center of Prevention and Control of Geological Disasters in Northern Fujian, Fujian Province University (No: WYERC2024-4), Innovation and Entrepreneurship Training Program for College Students (S202410397068).
Data Availability Statement
The original contributions presented in this study are included in the article. Further inquiries can be directed to the corresponding authors.
Conflicts of Interest
The authors declare no conflicts of interest.
References
- You, X. Stochastic Structure Model of the Earth-Rock Aggretage and Its Application; Beijing Jiaotong University: Beijing, China, 2001. [Google Scholar]
- You, X.; Tang, J. Research on horizontal push-shear in-situ test of soil and rock-mixture. Chin. J. Rock Mech. Eng. 2002, 1537–1540. [Google Scholar]
- Xu, W.; Hu, R.; Tan, R. Some geomechanical properties of soil–rock mixtures in the Hutiao Gorge area, China. Géotechnique 2007, 57, 255–264. [Google Scholar] [CrossRef]
- Xu, W.; Hu, R.; Tan, R.; Zeng, R.; Yu, H. Study on field test of rock-soil aggregate on right band of longpan in tiger-leaping gorge area. Chin. J. Rock Mech. Eng. 2006, 25, 1270–1277. [Google Scholar] [CrossRef]
- Li, X.; Liao, Q.; He, J. In-situ tests and a stochastic structural model of rock and soil aggregate in the three gorges reservoir area, China. Int. J. Rock Mech. Min. Sci. 2004, 41, 702–707. [Google Scholar] [CrossRef]
- Li, X.; Liao, Q.; He, J.; Chen, J. Study on in-situ tests of mechanical characteristics on soil-rock aggregate. Chin. J. Rock Mech. Eng. 2007, 26, 2377–2384. [Google Scholar] [CrossRef]
- Coli, N.; Berry, P.; Boldini, D. In situ non-conventional shear tests for the mechanical characterisation of a bimrock. Int. J. Rock Mech. Min. Sci. 2011, 48, 95–102. [Google Scholar] [CrossRef]
- Savely, J.P. Determination of shear strength of conglomerates using a caterpillar D9 ripper and comparison with alternative methods. Geotech. Geol. Eng. 1990, 8, 203–225. [Google Scholar] [CrossRef]
- Zhang, Z.; Xu, W.; Xia, W.; Zhang, H. Large-scale in-situ test for mechanical characterization of soil–rock mixture used in an embankment dam. Int. J. Rock Mech. Min. Sci. 2016, 86, 317–322. [Google Scholar] [CrossRef]
- Hou, H.; Zhao, D.; Cai, X.; Chen, Z.; Li, S. Study on dilatancy characteristics of alluvial gravel soil in the secondary step of Yellow River. West-China Explor. Eng. 2006, 18, 22–24. [Google Scholar]
- Liu, L.; Mao, X.; Xiao, Y.; Wu, Q.; Nie, M. Effect of Water Content on Shear Characteristics of Landslide Deposit Subgrade Fillers. China J. Highw. Transp. 2020, 33, 126–135. [Google Scholar] [CrossRef]
- Jalili, J.; Jafari, M.K.; Shafiee, A.; Koseki, J.; Sato, T. An investigation on effect of inclusions on heterogeneity of stress, excess pore pressure and strain distribution in composite soils. Int. J. Civ. Eng. 2012, 10, 124–138. [Google Scholar]
- Du, C.; Han, T.; Fu, Y.; Meng, X.; Sun, D. Study of Shear Properties and Shear Model of Soil-Rock Mixture. PLoS ONE 2023, 18, 19. [Google Scholar] [CrossRef] [PubMed]
- Salimun, N.; Mohamad, H. Effect of Particle Gradation and Rock Block Content on Soil-Rock Mixture Shear Strength Parameters. Bull. Geol. Soc. Malays. 2024, 78, 29–37. [Google Scholar] [CrossRef]
- Salimun, N.; Mohamad, H. Investigation of Particle Gradation Effect on Soil-Rock Mixture Using Direct Shear Test. Int. J. Integr. Eng. 2024, 16, 23–30. [Google Scholar] [CrossRef]
- He, Z.; Zhang, J.; Sun, T. Influence of Maximum Particle Diameter on the Mechanical Behavior of Soil-Rock Mixtures. Adv. Civ. Eng. 2020, 2020, 8850221. [Google Scholar] [CrossRef]
- Li, T.; Tian, J.; Pei, X.; Guo, J.; Chen, M.; Yuan, X.; Meng, M. Shear Strength Indices Predication Model for Coarse-Grained Soil Based on Particle Gradation and Moisture Content Information. Bull. Eng. Geol. Environ. 2025, 84, 344. [Google Scholar] [CrossRef]
- Liu, G.; Wang, K.; Xia, Z. Experimental Study on Shear Properties and Resistivity Change of Soil-Rock Mixture. J. Mt. Sci. 2024, 21, 3930–3944. [Google Scholar] [CrossRef]
- Tang, J.; Xu, D.; Liu, H. Effect of gravel content on shear behavior of sand-gravel mixture. Rock Soil Mech. 2018, 39, 93–102. [Google Scholar] [CrossRef]
- Wang, J.; Cao, W.; Zhang, C.; Wang, H. Large-scale direct shear tests on soil-rock aggregate mixture under complicated environment based on orthogonal design. Chin. J. Geotech. Eng. 2013, 35, 1849–1856. [Google Scholar]
- Zhang, Y.; Lu, J.; Han, W.; Xiong, Y.; Qian, Q. Effects of Moisture and Stone Content on the Shear Strength Characteristics of Soil-Rock Mixture. Materials 2023, 16, 567. [Google Scholar] [CrossRef] [PubMed]
- Tian, H.; Xue, Y. Experimental Research on Shear Behavior of Soil-rock Mixture for Road Construction. Chin. J. Undergr. Space Eng. 2014, 10, 30–35. [Google Scholar] [CrossRef]
- Tu, Y.; Liu, X.; Ren, Q.; Cai, H.; Wang, J.; Yu, J. Effects of rock contents and particle breakage on strength characteristics of soil-rock aggregate. Rock Soil Mech. 2020, 41, 3919–3928. [Google Scholar] [CrossRef]
- Wang, S.; Zhu, Y.; Ma, W.; Li, G. Effects of rock block content and confining pressure on dynamic characteristics of Soil-Rock Mixtures. Eng. Geol. 2021, 280, 105963. [Google Scholar] [CrossRef]
- García-Rojo, R.; Herrmann, H.J. Shakedown of unbound granular material. Granul. Matter 2005, 7, 109–118. [Google Scholar] [CrossRef]
- Werkmeister, S. Permanent Deformation Behaviour of Unbound Granular Materials in Pavement Constructions; Technische Universität Dresden: Dresden, Germany, 2003; Available online: https://d-nb.info/968400930/34 (accessed on 15 May 2020).
- Werkmeister, S.; Dawson, A.R.; Wellner, F. Permanent Deformation Behavior of Granular Materials and the Shakedown Concept. Transp. Res. Rec. J. Transp. Res. Board 2001, 1757, 75–81. [Google Scholar] [CrossRef]
- Voznesensky, E.A.; Funikova, V.V.; Babenko, V.A. Deformability properties of model granular soils under true triaxial compression conditions. Mosc. Univ. Geol. Bull. 2013, 68, 253–259. [Google Scholar] [CrossRef]
- Feda, J. Notes on the effect of grain crushing on the granular soil behavior. Eng. Geol. 2002, 63, 93–98. [Google Scholar] [CrossRef]
- Donaghe, R.T.; Torrey, V.H. Scalping and Replacement Effects on Strength Parameters of Earth-Rock Mixtures. In Design Parameters in Geotechnical Engineering: 7th European Conference on Soil Mechanics & Foundation Engineering; British Geotechnical Society: London, UK, 1979. [Google Scholar]
- Dupla, J.C.; Pedro, L.S.; Canou, J.; Dormieux, L. Mechanical behavior of coarse-grained soils reference. Bull. Liaison Lab. Ponts Chaussees 2007, 268, 1–58. [Google Scholar]
- Amini, Y.; Hamidi, A. Triaxial shear behavior of a cement-treated sand–gravel mixture. J. Rock Mech. Geotech. Eng. 2014, 6, 455–465. [Google Scholar] [CrossRef]
- Miller, E.A.; Sowers, G.F. The strength characteristics of soil-aggregate mixtures. Highw. Res. Board Bull. 1957, 183, 16–23. Available online: http://onlinepubs.trb.org/Onlinepubs/hrbbulletin/183/183-003.pdf (accessed on 15 May 2020).
- Gong, J.; Liu, J. Analysis on the Mechanical Behaviors of Soil-Rock Mixtures Using Discrete Element Method. Procedia Eng. 2015, 102, 1783–1792. [Google Scholar] [CrossRef]
- Xu, W.; Zhang, H.; Xu, Q.; Yu, Y. Numerical simulations of direct shear test with soil-rock mixture using discrete element method. Chin. J. Comput. Mech. 2014, 31, 228–234. [Google Scholar]
- Xu, W.; Wang, S. Meso-mechanics of soil-rock mixture with real shape of rock blocks based on 3D numerical direct shear test. Chin. J. Comput. Mech. 2016, 35, 2152–2160. [Google Scholar] [CrossRef]
- Xiao, J.; Ma, Y.; Zhou, J.; Cai, H.; Wei, Y.; Liu, C. Numerical simulation of shear strength of rock-soil mixtures by using PFC2D. Chin. J. Geotech. Eng. 2020, 42, 123–128. [Google Scholar]
- Xu, W.; Yue, Z.; Hu, R. Study on the mesostructure and mesomechanical characteristics of the soil-rock mixture using digital image processing based finite element method. Int. J. Rock Mech. Min. Sci. 2008, 45, 749–762. [Google Scholar] [CrossRef]
- Wang, S.; Li, Y.; Gao, X.; Xue, Q.; Wu, Z. Influence of volumetric block proportion on mechanical properties of virtual soil-rock mixtures. Eng. Geol. 2020, 278, 105850. [Google Scholar] [CrossRef]
- Zhao, L.; Huang, D.; Zhang, S.; Cheng, X.; Luo, Y.; Deng, M. A new method for constructing finite difference model of soil-rock mixture slope and its stability analysis. Int. J. Rock Mech. Min. Sci. 2021, 138, 104605. [Google Scholar] [CrossRef]
- Jiang, C.; Zeng, L.; Liu, Y.; Yu, M.; Dong, W. A DEM Study on the Macro- and Micro-Mechanical Characteristics of an Irregularly Shaped Soil–Rock Mixture Based on the Analysis of the Contact Force Skeleton. Appl. Sci. 2025, 15, 7978. [Google Scholar] [CrossRef]
- Chen, X.; Cui, K.; Wang, Y.; Zhou, J.; Yang, X.; Qi, S. Decoding Multi-Scale Stochastic Mechanics of Soil-Rock Mixtures: A DEM-Based Investigation. Mech. Mater. 2025, 209, 105446. [Google Scholar] [CrossRef]
- Li, J.; Wang, B.; Wang, D.; Zhang, P.; J Vardon, P. A Coupled MPM-DEM Method for Modelling Soil-Rock Mixtures. Comput. Geotech. 2023, 160, 105508. [Google Scholar] [CrossRef]
- An, N.; Ma, G.; Zhou, H.; Wang, D.; Lu, X.; Zhou, W. DEM Investigation of the Microscopic Mechanism of Scale Effect of Sandy Gravel Material. Acta Geotech 2022, 18, 1373–1390. [Google Scholar] [CrossRef]
- Li, J.; Yang, Y.; Yang, X.; Zheng, H.; Wang, S. Investigation of Equivalent Strength Parameters of Soil-Rock Mixture Using Numerical Manifold Method. J. Rock Mech. Geotech. Eng. 2025, in press. [Google Scholar] [CrossRef]
- Wu, W.; Yang, Y.; Zheng, H.; Wang, S.; Zhang, N.; Wang, Y. Investigation of the Effective Hydro-Mechanical Properties of Soil-Rock Mixtures Using the Multiscale Numerical Manifold Model. Comput. Geotech. 2023, 155, 105191. [Google Scholar] [CrossRef]
- Yang, Y.; Sun, G.; Zheng, H.; Qi, Y. Investigation of the sequential excavation of a soil-rock-mixture slope using the numerical manifold method. Eng. Geol. 2019, 256, 93–109. [Google Scholar] [CrossRef]
- BSI.BS1377:1990. Methods of Test for Soils for Civil Engineering Purposes, Part 2: Classification Tests. British Standards Institution: London, UK, 1990.
- Indraratna, B.; Salim, W. Modeling of particle breakage of coarse aggregates incorporating strength and dilatancy. Geotech. Eng. 2002, 155, 243–252. [Google Scholar] [CrossRef]
- Indraratna, B.; Gasson, I.; Chowdhury, R.N. Utilization of compacted coal tailings as a structural fill. Can. Geotech. J. 2011, 31, 614–623. [Google Scholar] [CrossRef]
- Chai, H.; Yan, Z.; Jia, X. Construction Technology of Soil-Stone Mixed Fill Subgrades; People’s Communications Press: Beijing, China, 2009. [Google Scholar]
- Shu, Z.; Liu, X.; Liu, B.; Guo, Z. Study of Strength Properties of Earth-Rock Aggregate Based on Fractals. Chin. J. Rock Mech. Eng. 2009, 28, 2652–2656. [Google Scholar]
- Shu, Z.; Liu, B.; Liang, N.; Li, Y.; Wang, D. Study on the Fractal Characteristics of Earth-rock Coarse Grain Based on Digital Image Processing. Chin. J. Undergr. Space Eng. 2012, 8, 511–516. [Google Scholar] [CrossRef]
- Kong, X.; Wang, J.; Liu, X. Experiment and Research on Vibrating Compaction Properties of Soil-aggregate Mixture. Chin. J. Undergr. Space Eng. 2007, 1, 55–61. [Google Scholar] [CrossRef]
- Dong, Y.; Chai, H. Study on engineering synthetical classification of rock-soil aggregate mixture. Rock Soil Mech. 2007, 28, 179–184. [Google Scholar] [CrossRef]
- Indraratna, B.; Nimbalkar, S.; Coop, M.; Sloan, S.W. A constitutive model for coal-fouled ballast capturing the effects of particle degradation. Comput. Geotech. 2014, 61, 96–107. [Google Scholar] [CrossRef]
- Selig, E.T.; Waters, J.M.; Ayers, M.E.; Aziz, C.N.; Best, M.G. Track geotechnology and substructure management. Life 1994, 8, 16–26. [Google Scholar] [CrossRef]
- Medley, E.W. The Engineering Characterization of Melanges and Similar Block-In-Matrix Rocks (Bimrocks); University of California, Berkeley: Berkeley, CA, USA, 1994. [Google Scholar]
- Lindquist, E.S.; Goodman, R.E. Strength and Deformation Properties of a Physical Model Melange. In Proceedings of the ARMA North America Rock Mechanics Symposium, Austin, TX, USA, 1–3 June 1994. [Google Scholar]
- GB/T 50123-2019. Chinese MWR (2019) Standard for Geotechnical Testing Method. China Planning Press: Beijing, China, 2019.
- JTG 3430-2020; Test Methods of Soils for Highway Engineering. Ministry of Transport of the People’s Republic of China: Beijing, China, 2020.
- Yang, Z.; Tian, X.; Lei, X.; Jiang, Y.; Liu, X.; Hu, Y. Particle discrete element numerical study on factors of shear strength characteristics for soil-rock mixture. J. Eng. Geol. 2020, 28, 39–50. [Google Scholar] [CrossRef]
- Yang, Z.; Zhao, Y.; Hu, Y.; Li, S.; Lei, X.; Li, X. Effect of the strength of rock blocks on the shear characteristics of soil-rock mixtures. Chin. J. Rock Mech. Eng. 2021, 40, 814–827. [Google Scholar] [CrossRef]
- Lei, X.; Yang, Z.; Zhang, X.; Tu, Y.; Liu, S.; Hu, Y. Shear properties and rock block breakage characteristics of soil-rock mixtures. Rock Soil Mech. 2018, 39, 899–908. [Google Scholar] [CrossRef]
- Zhang, M.; Zhang, S.; Zhang, S.W. Study on Shear Failure and Crack Propagation Characteristics of Soil-Rock Mixture. Environ. Earth Sci. Res. J. 2021, 8, 153–158. [Google Scholar] [CrossRef]
- Yang, S.; Li, X. Simulation Analysis of Large Direct Shear Test of Soil and Rock Mixture Based on PFC3D. Adv. Eng. Sci. 2020, 52, 8. [Google Scholar] [CrossRef]
- Xu, X.; Wei, H.; Meng, Q.; Wei, C.; Ai, D. Effects of shear rate on shear strength and deformation characteristics of coarse-grained soils in large-scale direct shear tests. Chin. J. Geotech. Eng. 2013, 35, 728–733. [Google Scholar]
- Tang, L.; Sun, S.; Zheng, J.; Jin, L.; Yu, Y.; Luo, T.; Duan, X. Pore evolution and shear characteristics of a soil-rock mixture upon freeze-thaw cycling. Res. Cold Arid. Reg. 2023, 15, 179–190. [Google Scholar] [CrossRef]
Disclaimer/Publisher’s Note: The statements, opinions and data contained in all publications are solely those of the individual author(s) and contributor(s) and not of MDPI and/or the editor(s). MDPI and/or the editor(s) disclaim responsibility for any injury to people or property resulting from any ideas, methods, instructions or products referred to in the content. |
© 2025 by the authors. Licensee MDPI, Basel, Switzerland. This article is an open access article distributed under the terms and conditions of the Creative Commons Attribution (CC BY) license (https://creativecommons.org/licenses/by/4.0/).